 Hazrat Ali
 Ben Belton
 Mohammad Mahfujul Haque
 Khondker Murshed-e-Jahan
 Liz Ignowski
- 1Department of Aquaculture, Bangladesh Agricultural University, Mymensingh, Bangladesh
- 2WorldFish, Bangladesh and South Asia Office, Dhaka, Bangladesh
- 3Department of Agricultural, Food & Resource Economics, Michigan State University, East Lansing, MI, United States
- 4International Food Policy Research Institute, Dhaka, Bangladesh
- 5WorldFish, Phnom Penh, Cambodia
Introduction: Seed production has experienced significant growth in Bangladesh over the last decade, driven by the increasing number of hatcheries. The hatchery segment plays a crucial role in the overall growth and development of aquaculture in the country. Understanding its structure, conduct and performance is essential for assessing its impact on the productivity and profitability of aquaculture farms. However, there is a limited number of methodologically rigorous studies focusing on the hatchery segment in Bangladesh. The study aimed to fill the gap in the exiting literature by conducting a methodologically analysis of the hatchery segment of aquaculture value chain in Bangladesh.
Methods: This study was conducted in seven of the main aquaculture producing districts in southern Bangladesh. A comprehensive structured survey was conducted between May and August 2022 with 66 enterprises, including 42 carp+catfish, 16 tilapia, and 8 crustacean hatcheries.
Results and discussion: The major findings and their implications are as follows. (1) The number of hatcheries increased by 15% over the past decade, with a 27% increase in fish hatcheries and a 47% decrease in crustacean hatcheries. (2) Carp and tiger shrimp were the most commonly produced fish and crustacean seeds, contributing 67% and 99% of volume and 66% and 97% of sales value, respectively. (3) The hatcheries were family-owned and operated enterprise, and generated a total 2,491 full time equivalent (FTE) jobs. (4) Hatcheries used 86% of their broodstock annually and replaced them regularly for improving quality and avoiding inbreeding. (5) 18% of hatcheries reported facing diseases and/or water quality problems, but mean economic loss was only 0.71% of seed sales value, which is a low level of loss and waste. (6) Average annual net profit margin was relatively modest, averaging 54% of the gross revenue, which suggests the existence of competitive seed production and marketing. The results showed that the hatchery segment in southern Bangladesh appears to be dynamic, well developed, efficient, and relatively competitive.
1 Introduction
A growing body of recent research has focused on actors in the midstream of agrifood value chains, such as traders and input suppliers, and their role facilitating commercialization and improving aquaculture farm productivity (Bremer et al., 2016; Liverpool-Tasie et al., 2020; Haque et al., 2021; Barrett et al., 2022). While the literature on aquaculture value chains has grown (e.g., Bush et al., 2019), many segments of aquaculture value chains remain understudied, including the upstream segments supplying inputs such as seed to farms. Seed is the most critical input for aquaculture, and ensuring good quality seed is crucial for the intensification and improvement of aquaculture production globally, including Bangladesh (Haque, 2007; Haque et al., 2012; Belton et al., 2018; Anderson et al., 2019; Jamabo et al., 2019; Wang et al., 2023).
The use of hatchery produced fish seed in aquaculture is increasing in Bangladesh (Hasan and Arthur, 2015; Jahan et al., 2015; Hernandez et al., 2018; Shikuku et al., 2021). Fish seed production increased from 276 MT in 2002 to 671 MT in 2021 (DoF, 2022). This increase in seed production facilitated the expansion of aquaculture output in the country, which increased from 786,604 MT to 2.64 million MT (DoF, 2022). The greater use of fish seed, along with higher levels of feed use, contributed to higher productivity, which rose from 2,580 kg/ha in 2002 to 5,129 kg/ha in 2021 (DoF, 2022). The use of fish seed is therefore associated with expansion of aquaculture production both at the extensive and intensive margins. The production of fish seeds primarily occurs in hatcheries, making the hatchery segment a crucial component of the aquaculture value chain that influences the overall growth and profitability of aquaculture farms (Hasan and Arthur, 2015; Karim et al., 2016).
The hatchery segment of the aquaculture value chain can be analyzes with respect to: 1) structure (e.g., the number, size, geographical location, and asset ownership of hatcheries); 2) conduct (e.g., type of seed production and sales, services offered to clients, seed delivery to clients, and credit provision); and 3) performance (e.g., employment generation, profit margins, competitiveness, seed quality). These factors play an important role in understanding the dynamics and functioning of hatcheries and their impact on the productivity and profitability of aquaculture farms. However, there is a limited number of methodologically rigorous studies focusing on the hatchery segment in Bangladesh.
Previous research has primarily focused on seed marketing channels, disease management, water quality, length-weight relationships, transportation, and technology diffusion (Bui et al., 2010; Sabbir et al., 2010; Belton, 2012; Bui et al., 2013; Islam et al., 2015; Uppanunchai et al., 2015; Hemal et al., 2017; Debnath et al., 2020). While these studies provide valuable insights into different aspects of hatchery segment, there has been relatively little attention given to seed production, trade, and distribution - though see Lewis et al. (1996) for an exception. The few studies that address seed production and distribution have often focused on management practices in specific locations or individual hatcheries and have not used statistically representative sampling techniques (e.g., Islam et al., 2017a; Islam et al., 2017b; Khanom et al., 2020; Biswas et al., 2021). This lack of rigorous research makes it difficult to generalize results.
There are four main characterizations often referenced in the literature on the fish hatchery segment of the aquaculture value chain.
First, fish seed production within hatcheries is often said to be inefficient, with poor broodstock management and spawning practices (Hasan and Arthur, 2015; Debnath et al., 2020; Biswas et al., 2021). This inefficiency may be due to lack of resources and low technical capacity among hatchery staff, leading to the collection of cultured fish species from the local market for breeding (Hasan and Arthur, 2015).
Second, challenges such as lack of capital, poor water quality, and disease can interrupt seed production in hatcheries. Diseases are the most significant challenge due to the abrupt mortality of seed in hatcheries, which may lead to economic losses (Islam et al., 2015; Islam et al., 2017b; Debnath et al., 2020).
Third, hatcheries often suffer from a shortage of well-qualified staff due to lack of institutional support to develop trained hatchery operators. This can result in low technical capacity among hatchery staff, with many learning breeding techniques on the job (Hasan and Arthur, 2015; Islam et al., 2015; Khanom et al., 2020).
Fourth, the hatchery segment of the aquaculture value chain is known to provide substantial employment opportunities (Bhuiyan et al., 2011; Hamid and Haque, 2012; Siddika et al., 2016; Hernandez et al., 2018), but the scale of employment in seed production has rarely been evaluated. Moreover, hatcheries sometimes help their customers by providing services that reduce transaction costs such as packaging, transportation, or providing information (Islam et al., 2017a; Hernandez et al., 2018).
Considering the above context, a comprehensive structured survey was conducted to address the gap in the literature on the hatchery segment of aquaculture value chain in Bangladesh.
The remainder of the paper is organized as follows. First, we analyze the structure of the hatchery segment in southern Bangladesh – including the number and types of hatcheries, scale of operations, geographical location, socio-demographic characteristics, and asset ownership. Second, we analyze the hatchery conduct, with reference to the types and quantities of seeds produced, procurement and sales behavior, utilization of working capital and credit, and service provision to clients. Third, we analyze value chain performance in terms of employment generation, the impacts of COVID-19 on business operations, and business profitability. Fourth, we triangulate the data derived from hatcheries survey against farm-level data on seed procurement and use by farmers.
2 Data and methods
2.1 Study area and types of hatchery
This study was conducted in seven of the main aquaculture producing districts in southern Bangladesh (Figure 1). The aquaculture production in this area comprises a variety of fish species (Indian major carps, Chinese carps, tilapia, catfish, brackish water fish species and others), as well as black tiger shrimp (Penaeus monodon) and giant freshwater prawn (Macrobrachium rosenbergii). Crustaceans are mainly produced in polyculture with fish, and in some cases integrated with other crops such as rice or vegetables (Jahan et al., 2015), reflecting the diversity of farming practices in the region. The aquaculture farming systems in this region are diverse, ranging from improved extensive shrimp culture, to semi-intensive farms, and a handful of intensive operations (Ali et al., 2022).
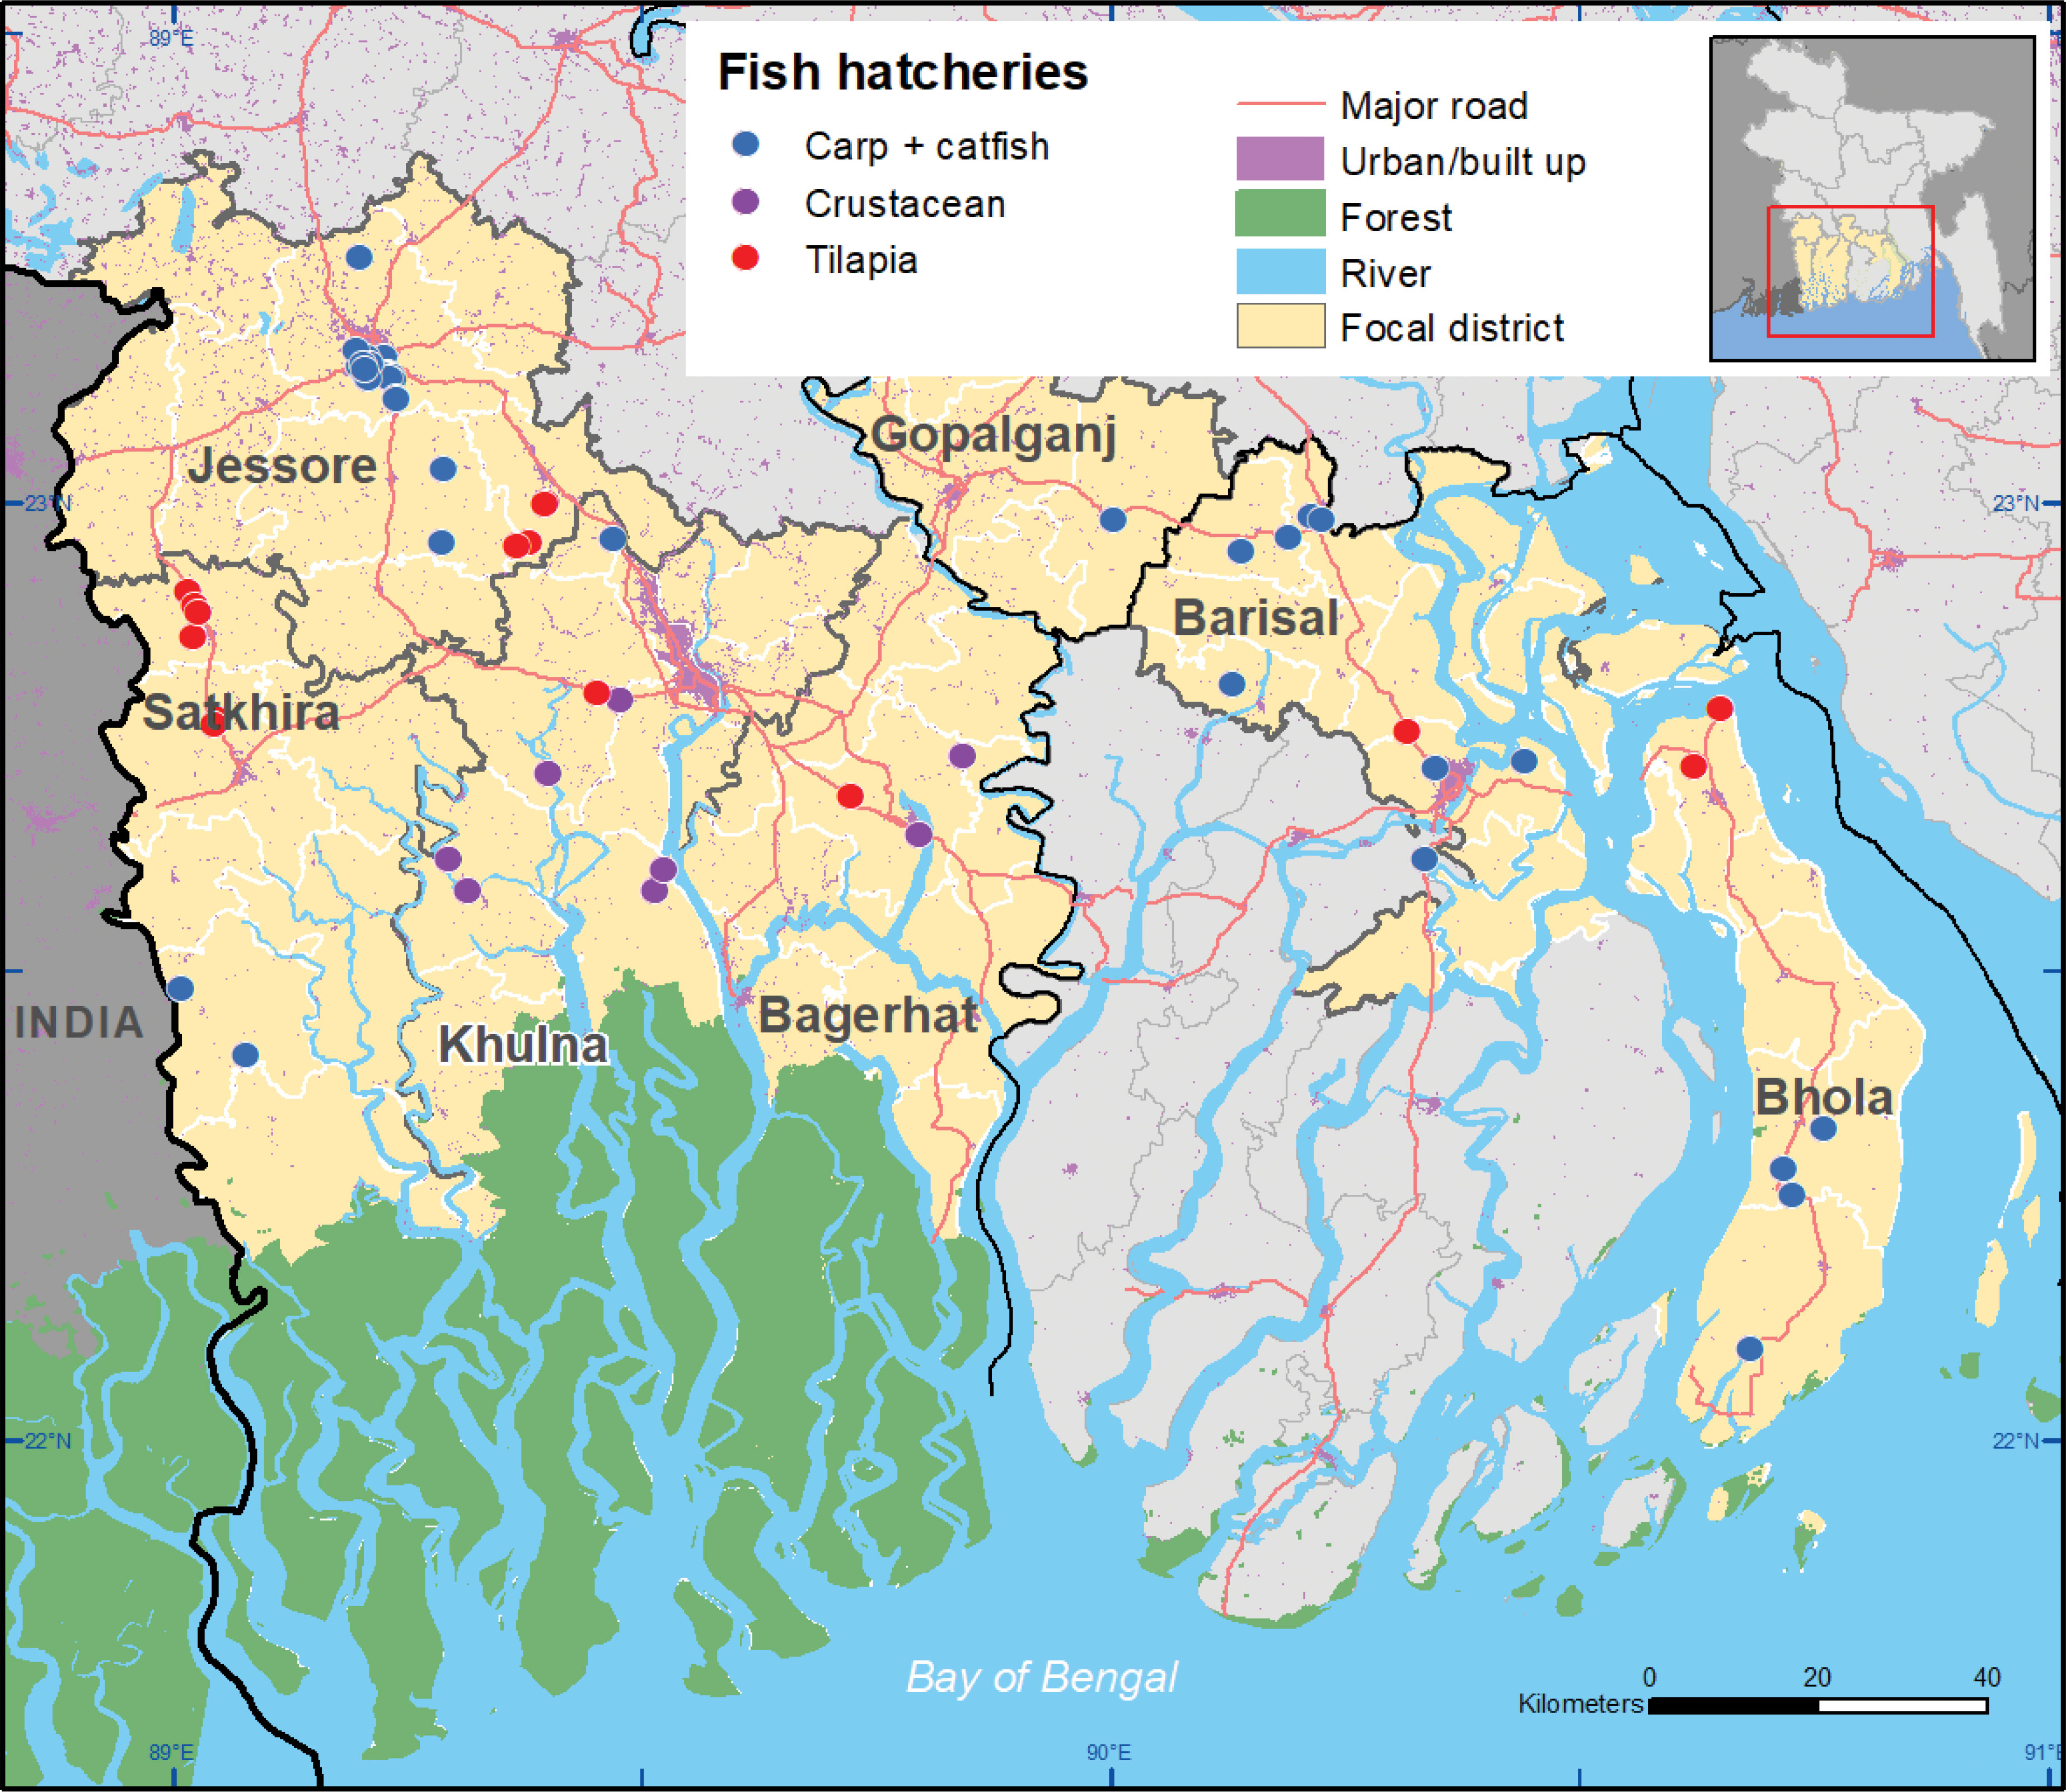
Figure 1 Map of location of surveys hatcheries in Southern Bangladesh.
During the pre-survey scoping, three distinct categories of fish hatcheries were identified based on common fish species produce and sell. They are as follows:
(1) Carp+catfish. These hatcheries primarily focus on producing carp species (rohu, Labeo rohita; catla, Catla; mrigel, Cirrhinus cirrhosus; bata, Labeo bata; silver carp, Hypophthalmichthys molitrix; common carp, Cyprinus carpio, other carp1) and catfish species (pangasius, Pangasianodon hypophthalmus; walking catfish, Clarias batrachus; stinging catfish, Heteropneustes fossilis; pabda catfish, Ompok pabda and long whiskers catfish, Mystus gulio). However, a few of them also produce some other fish like climbing perch (Anabas testudineus) and silver barb (Barbonymus gonionotus). Most of the seed are sold as fertilized spawn or hatchlings. Some hatcheries with nursery ponds also stock spawn to produce fries and/or fingerlings for sale to customers. Carp+catfish hatchery practices induced breeding by using pituitary gland (87%), synthetic hormone (11%) and human chorionic gonadotropin (2%) hormones.
(2)Tilapia hatcheries, which produce only Nile tilapia (Oreochromis niloticus) seed and sell them as fry after nursing them for 18-22 days in hapa using 17α-methyltestosterone (17α-MT) hormone to produce mono-sex male tilapia.
(3)Crustacean hatcheries, that produce black tiger shrimp or freshwater prawn post larvae (PL) for sale to farmers or seed traders. These hatcheries buy black tiger shrimp nauplii from hatcheries located in the Cox’s Bazar in southeastern Bangladesh, and nurse them from nauplii to PL stage. Freshwater prawn broodstock is collected from rivers through suppliers and the hatcheries produce nauplii themselves.
2.2 Survey methods and data
The data used in this paper were collected between May and August 2022 through a comprehensive survey of 66 enterprises, including 42 carp+catfish, 16 tilapia, and 8 crustacean hatcheries. This survey was part of a larger ‘stacked survey’ that covered multiple segments of the aquaculture value chain, including 721 aquaculture farms. The stacked survey approach allows for collection of more comprehensive and accurate data than conventional value chain research methods, which often rely on small, non-representative, or qualitative samples across a few value chain nodes (Reardon et al., 2012). Survey weights were created by dividing the total number of hatcheries of each type in surveyed districts by the number of sampled hatcheries in each hatchery group. These weights were then applied where applicable during analysis to adjust for over/under sampling.
The 2022 stacked survey was a follow-up to a survey originally conducted in 2013. In the first survey, the initial selection of seven districts was done purposively based on their importance for aquaculture production. All upazilas (sub-districts) with significant aquaculture production were included in the initial sample frame and then, a random selection was made using proportional probability to size (PPS) technique, resulting in 13 upazilas being chosen for the final sample. Within each selected upazila, a process of trimming took place during the second stage. Mouzas with fewer than 20 aquaculture farms, as reported in the national agricultural census of 2008, were eliminated from the sample. Subsequently, two to three mouzas were randomly selected from each upazila to be included in the farm survey. In each selected mouza, a list of aquaculture farms was compiled during a pre-survey farm census and 20 aquaculture farms were randomly chosen from census list for interview, constituting the farm household sample. A census of fish hatcheries was conducted in all upazilas included in the farm household sample. Respondents were randomly selected for interview from the census list of fish hatcheries.
In 2022, we replicated the sampling approach used in the 2013 survey. This involved conducting a new complete listing fish hatcheries in each area surveyed in 2013. All hatcheries surveyed in 2013 that were still operating in 2022 (43%) were resurveyed. Replacements for respondents from the 2013 survey whose businesses had closed or who were not available to participate in the resurvey were selected at random from the 2022 census list of hatcheries.
Interviews were conducted face to face by trained enumerators using a structured questionnaire implemented using a tablet. The 66 hatcheries surveyed in 2022 represented 34% of the total number of hatcheries operated in the seven southern districts of Bangladesh, based on a complete list of hatcheries operating in southern Bangladesh collected by the Bangladesh Aquaculture and Nutrition Activity (BANA) project (Personal communication, Bappy Shahrier). In addition to the structured micro-scale survey of individual hatcheries, we conducted 12 key informant interviews (KIIs) to collect meso-scale information about changes in the number of hatcheries operated, types of fish species produced, and volumes sold over the last 10 years prior to the survey. The KIIs provided valuable insights into temporal trends in the hatchery business.
The final section of the paper presents data on seed procurement and use by farmers, drawn from a survey of 721 fish farmers. The selection methodology for the farm survey was similar to that described above. Farmers were categorized into four groups for analysis, based on the combination of species cultured, which were only fish (N=284), prawn + fish (N=165), shrimp + fish (=65) and prawn + shrimp + fish (N=211).
2.3 Data analysis
Data were downloaded from the KoBo Collect platform in Excel format and exported to Stata 17.0 (StataCorp LLC, College Station, Texas 77845 USA). Descriptive results from the data analysis were used to characterize hatcheries in combination with qualitative information from KIIs. One-way analysis of variance (ANOVA) was used for statistical analysis of the surveyed data, followed by a Bonferroni Multiple Range Test to determine the significance of variations among the hatchery categories averages. A probability of less than or equal 5% (p ≤ 0.05) was considered as significant in all instances, except where stated otherwise in the text.
3 Results and discussion
3.1 Hatchery and business characteristics
All survey respondents were men, with an average age of 51 years (Table 1). The mean level of formal education of 12 years was much higher than the national average in Bangladesh of 6 years (World Economics, 2022). Tilapia hatchery owners had been in business for significantly less time (11 years; p ≤ 0.05) compared to crustacean hatcheries (16 years) and carp+catfish (24 years) hatcheries, indicating that many new tilapia hatcheries have opened in the last decade prior to the survey. Saengnoree and Lebel (2003) reported that education and experience on fish farming technologies improved skill and knowledge to maintain intensive production and made the system sustainable. The majority of hatchery owners (81%) had attended short training courses on hatchery operation organized by Department of Fisheries or non-governmental organizations (NGOs). These training programs may have contributed to increasing their skills, knowledge, and social capital.
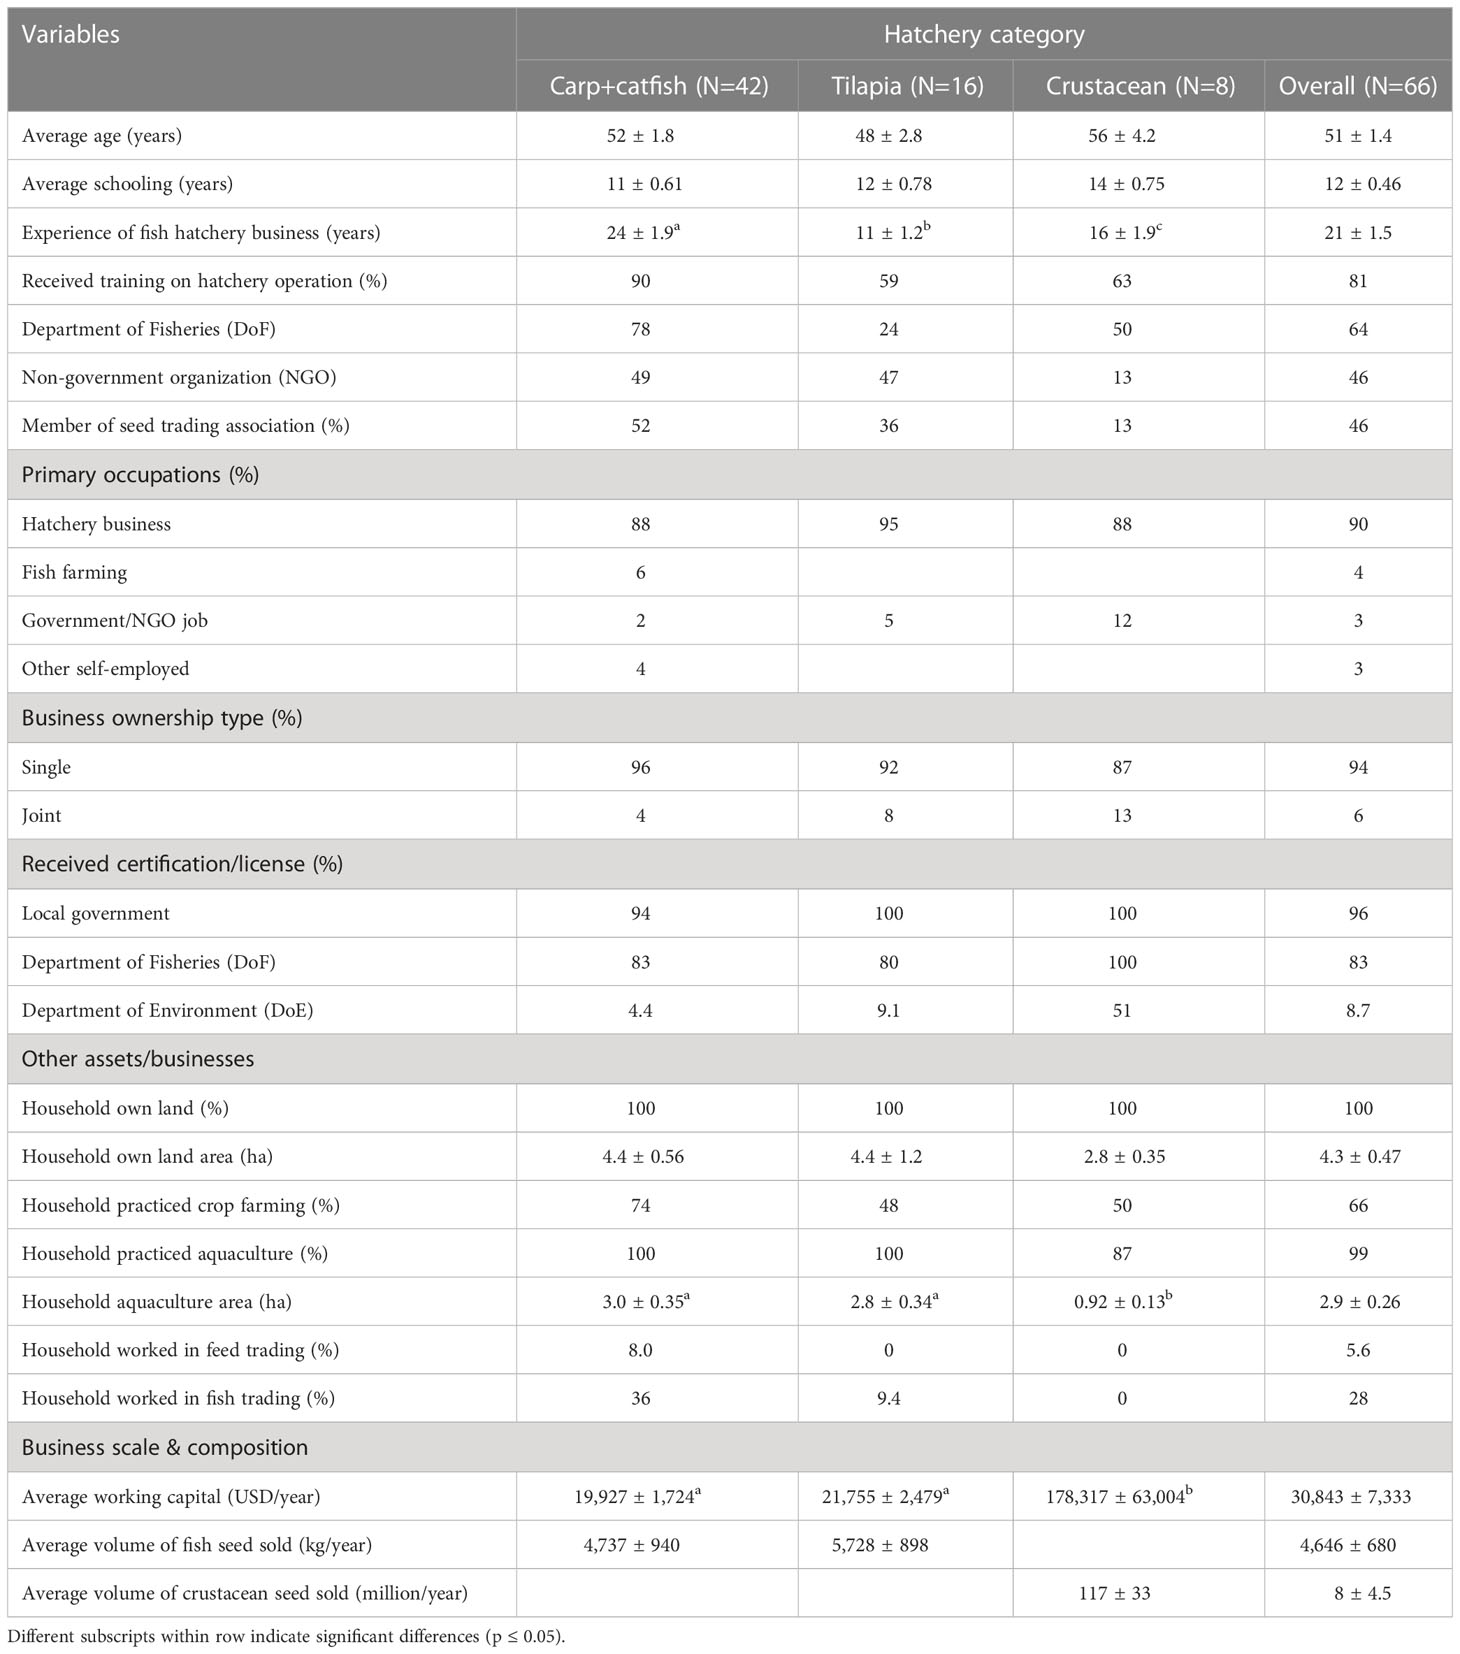
Table 1 Demographic and basic information of fish hatchery business.
Most hatchery owners (90%) specialized in hatchery business as their primary occupation (Table 1). However, most had multiple sources of household income. Almost all (99%) farmed fish and/or crustaceans, and a significant portion (66%) cultivated agricultural crops. This reflects the rural location of many hatcheries and may indicate that the hatchery owners were originally successful farmers prior to venturing hatchery enterprises. Moreover, 36% of carp+catfish and 9.4% of tilapia hatchery owners have worked in table fish trading. Additionally, 8% of carp+catfish owners also worked in fish feed trading as well. All hatchery owners in the study owned land, with an average size of 4.3 ha, which is significantly larger (13 times) than the average land size in southern Bangladesh (BBS, 2019), reflecting the high socio-economic status of the hatchery owners.
Almost all hatcheries (96%) had obtained trade licenses from local government (Table 1). Trade license is a mandatory requirement to establish any type of enterprise in Bangladesh. Additionally, 83% of hatcheries obtained a license from Department of Fisheries (DoF), which is required to operate a hatchery in Bangladesh (Code of Conduct, 2015). Furthermore, 51% of crustacean hatcheries had acquired a license from the Department of Environment in accordance with the Code of Conduct 2015 for the shrimp aquaculture industry in Bangladesh (Table 1). This is because these hatcheries produce PL of exportable crustaceans, which require different types of licenses to maintain traceability requirements. Officials frequently visited these hatcheries to ensure compliance, while implementation was less strict in other hatcheries.
Hatchery operations in Bangladesh are mostly family-based on small-scale enterprises. Nearly all hatcheries (96%) operated their business individually. The average annual volume of seed sold by carp+catfish and tilapia hatcheries was 4,737 kg and 5,728 kg, respectively (Table 1). Crustacean hatcheries sold 117 million PL on average during the survey year. The average annual volume of working capital was significantly higher (p ≤ 0.05) in the crustacean hatcheries (USD 178,317) than carp+catfish (USD 19,927), and tilapia (USD 21,755) hatcheries, reflects the larger scale of the former.
3.2 Structure
The number of hatcheries increased by 15% over the 10 years preceding the survey. The primary driver of this increase was the growth in fish hatcheries, while the number of crustacean hatcheries has decreased over the same period. The intensification of aquaculture, which refers to the increased productivity and scale of aquaculture operations, has created a higher demand for fish seed. This demand has been a key factor leading to the establishment of new fish hatcheries (Belton et al., 2018; Hernandez et al., 2018). The new fish hatcheries are located beyond the original core clusters in Jashore, where ideal iron-free water conditions and technical training were initially provided by a government hatchery in the 1970s (Lewis et al., 1996; Hernandez et al., 2018).
The first hatchery in the sample was established in 1980, but more than half (55%) started between 2006 and 2017 (Figure 2). Growth over this period was fastest for tilapia hatcheries (62%) and slowest for carp+catfish hatcheries (13%), indicating the growth rate of tilapia production outstripping that of carp production. This observation is consistent with the growth of tilapia production in Bangladesh, which has increased four times over the past 10 years (DoF, 2022). The meso-scale survey revealed growth in the production of indigenous catfish species’ seed, with existing hatcheries expanded their facilities, and new hatcheries were established to meet the growing demand. This finding is consistent with a previous study (Shamsuzzaman et al., 2020), which reported a tripling of seed production for local catfish species over the past decade.
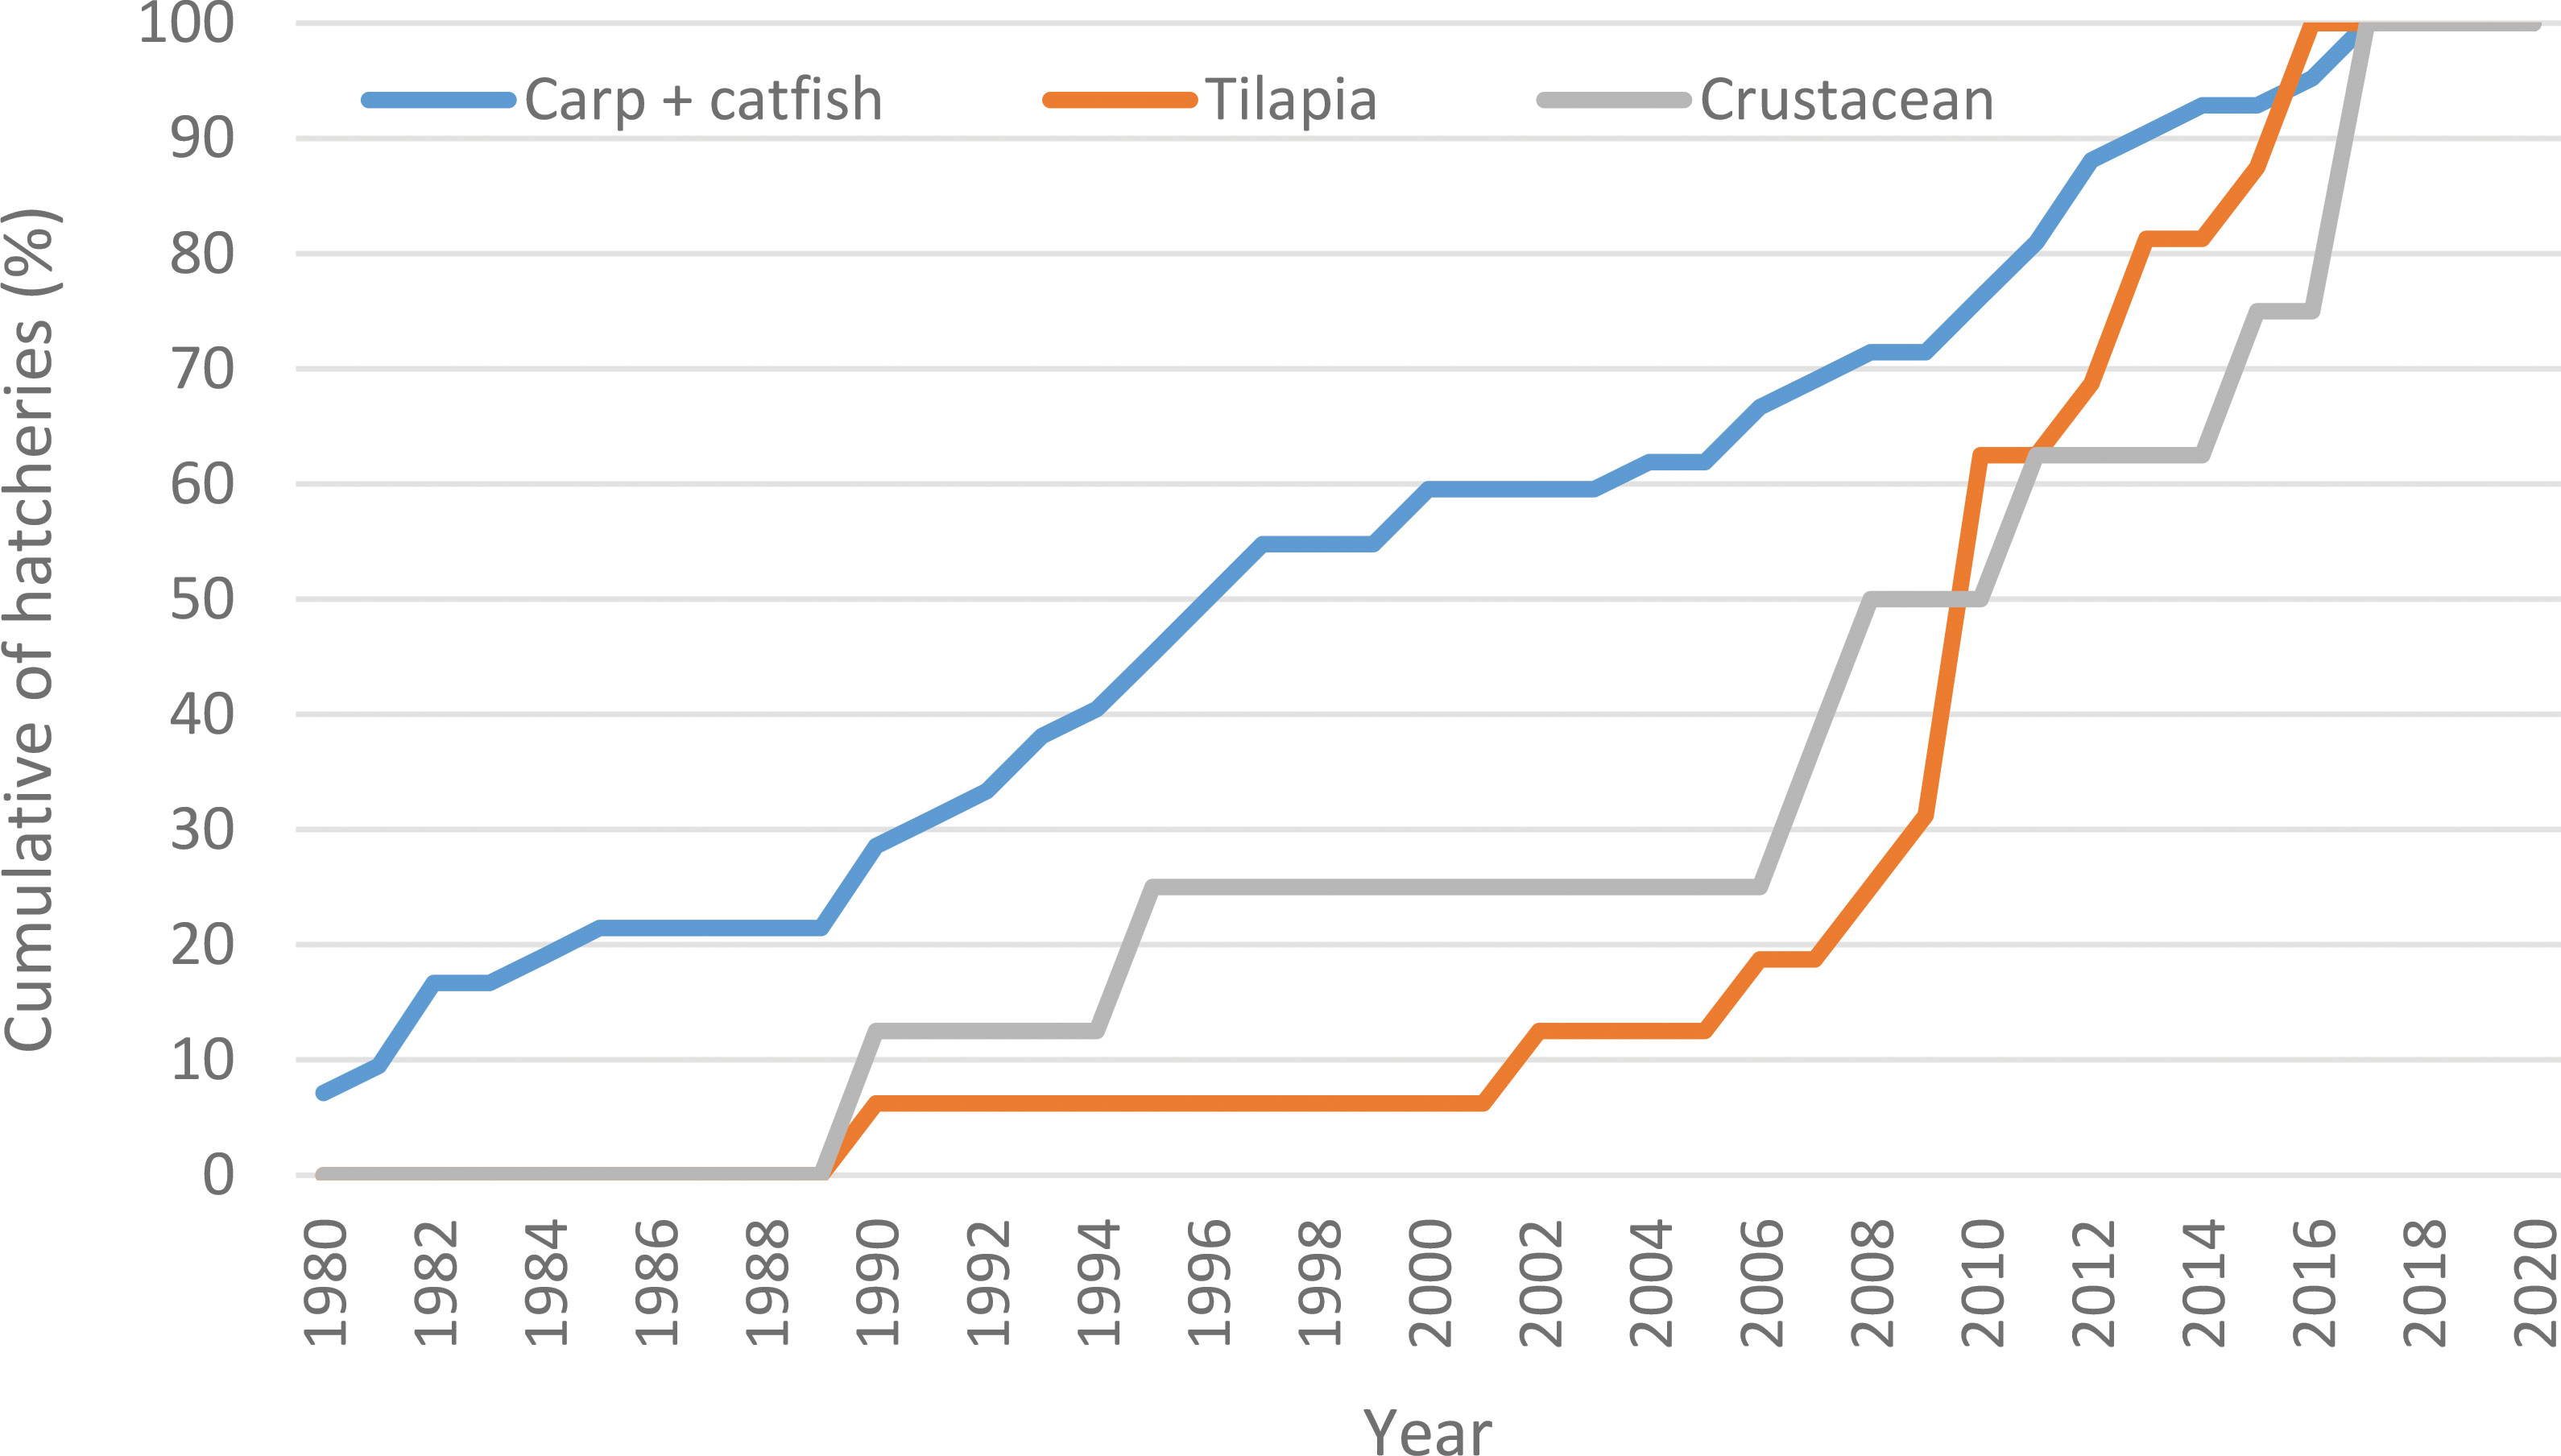
Figure 2 Cumulative share of carp+catfish, tilapia, and crustacean hatcheries established by year, 1980-2020.
Although some new hatcheries were established recently, the total number of crustacean hatcheries in the survey areas has fallen by 47% over the past decade, indicating a downward trend in the establishment and operation of crustacean hatcheries. The decline in crustacean hatcheries is attributed to a drop both seed (PL) production and lower demand from farms. This finding is consistent with data from farm household surveys conducted in the same zone as well as with data from DoF (2022), which reported a 42% decrease in the number of crustacean hatcheries and a 16% decrease in PL production.
3.3 Assets
All surveyed hatcheries operated from fixed premises (Table 2), the majority (86%) of which were owned rather than rented (14%). The average floor space for hatchery infrastructure was 1,984 m2. Crustacean hatcheries had more floor space (p ≤ 0.05) compared to tilapia and carp+catfish hatcheries, likely due to the need for sophisticated management practices that require different types of infrastructure equipment. Most hatcheries (82%) had well-constructed business premises to prevent theft and provide protection from the weather. The meso-scale interviews indicated that hatchery infrastructure has improved over the past decade, with some hatcheries converting their earthen floors to cement or concrete, which required significant capital investment. Additionally, the overall hatchery area has increased by 24%, from 2.1 ha in 2011 to 2.6 ha in 2021, reflecting larger operational scale to increase seed production. All tilapia and 96% of carp+catfish hatcheries had their own broodstock ponds to rear their own broodstock, with the share of land dedicated to ponds being 59% and 54% for tilapia and carp+catfish hatcheries, respectively. All tilapia, and 63% of carp+catfish hatcheries had one of more nursery ponds in which to produce fries and/or fingerlings.
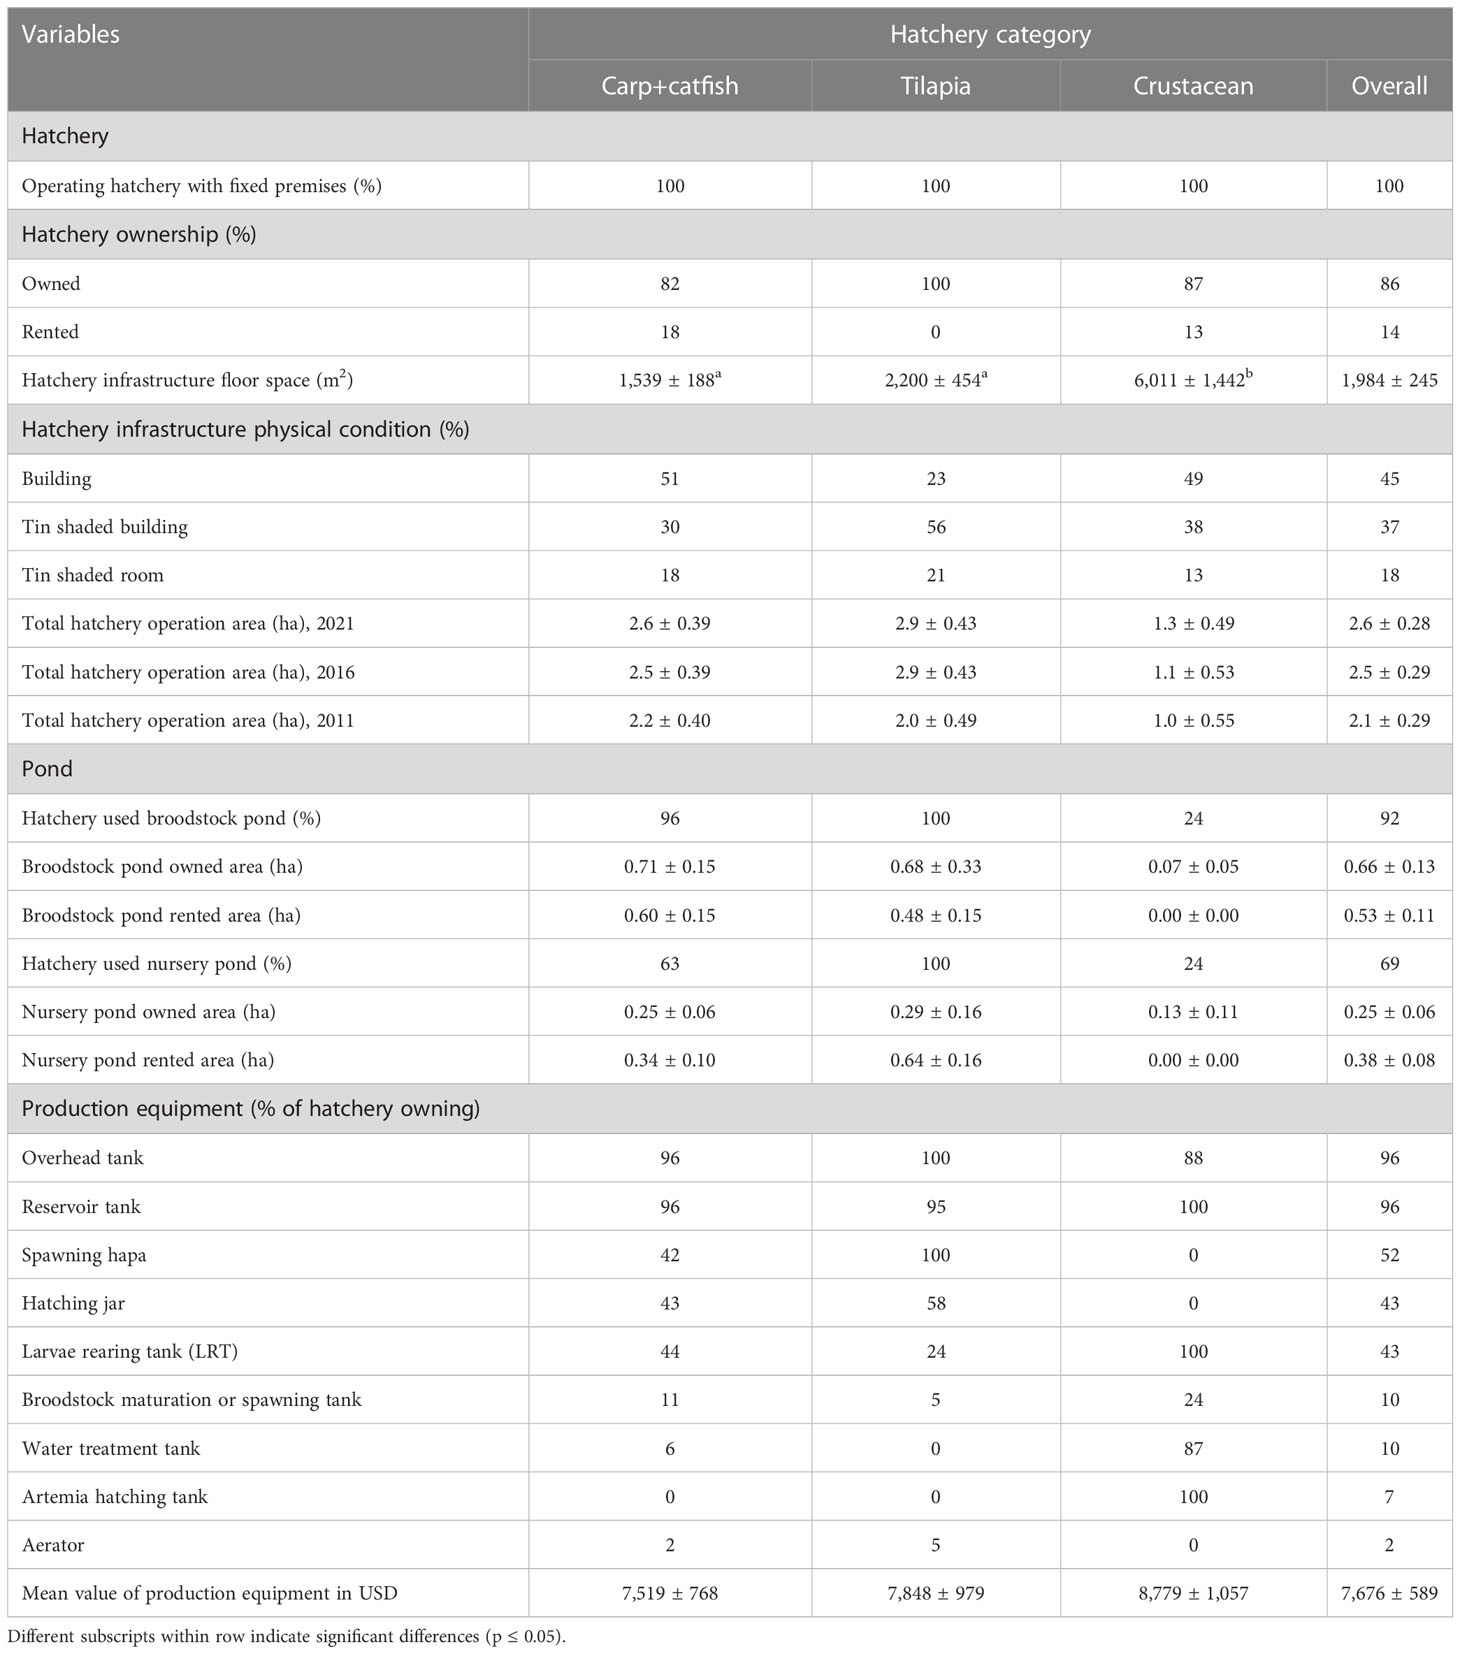
Table 2 List of assets used for fish hatchery operation.
The types of production equipment used in hatcheries included overhead tanks, reservoir tanks, larvae rearing tanks, hatching jars, and spawning hapas (Table 2). The average value of production equipment increased from USD 5,267 in 2013 to USD 7,676 in 2021, suggesting that hatcheries invested in new and more advanced equipment to improve their seed production. In addition to production equipment, hatcheries owned equipment water pumps, furniture, scales, calculators, mobile phones, and oxygen cylinders (Table 3). The ownership of computer desktops/laptops increased from none in 2013 to 5% in 2021, likely due to adoption of technology that has made it easier to maintain accounts.
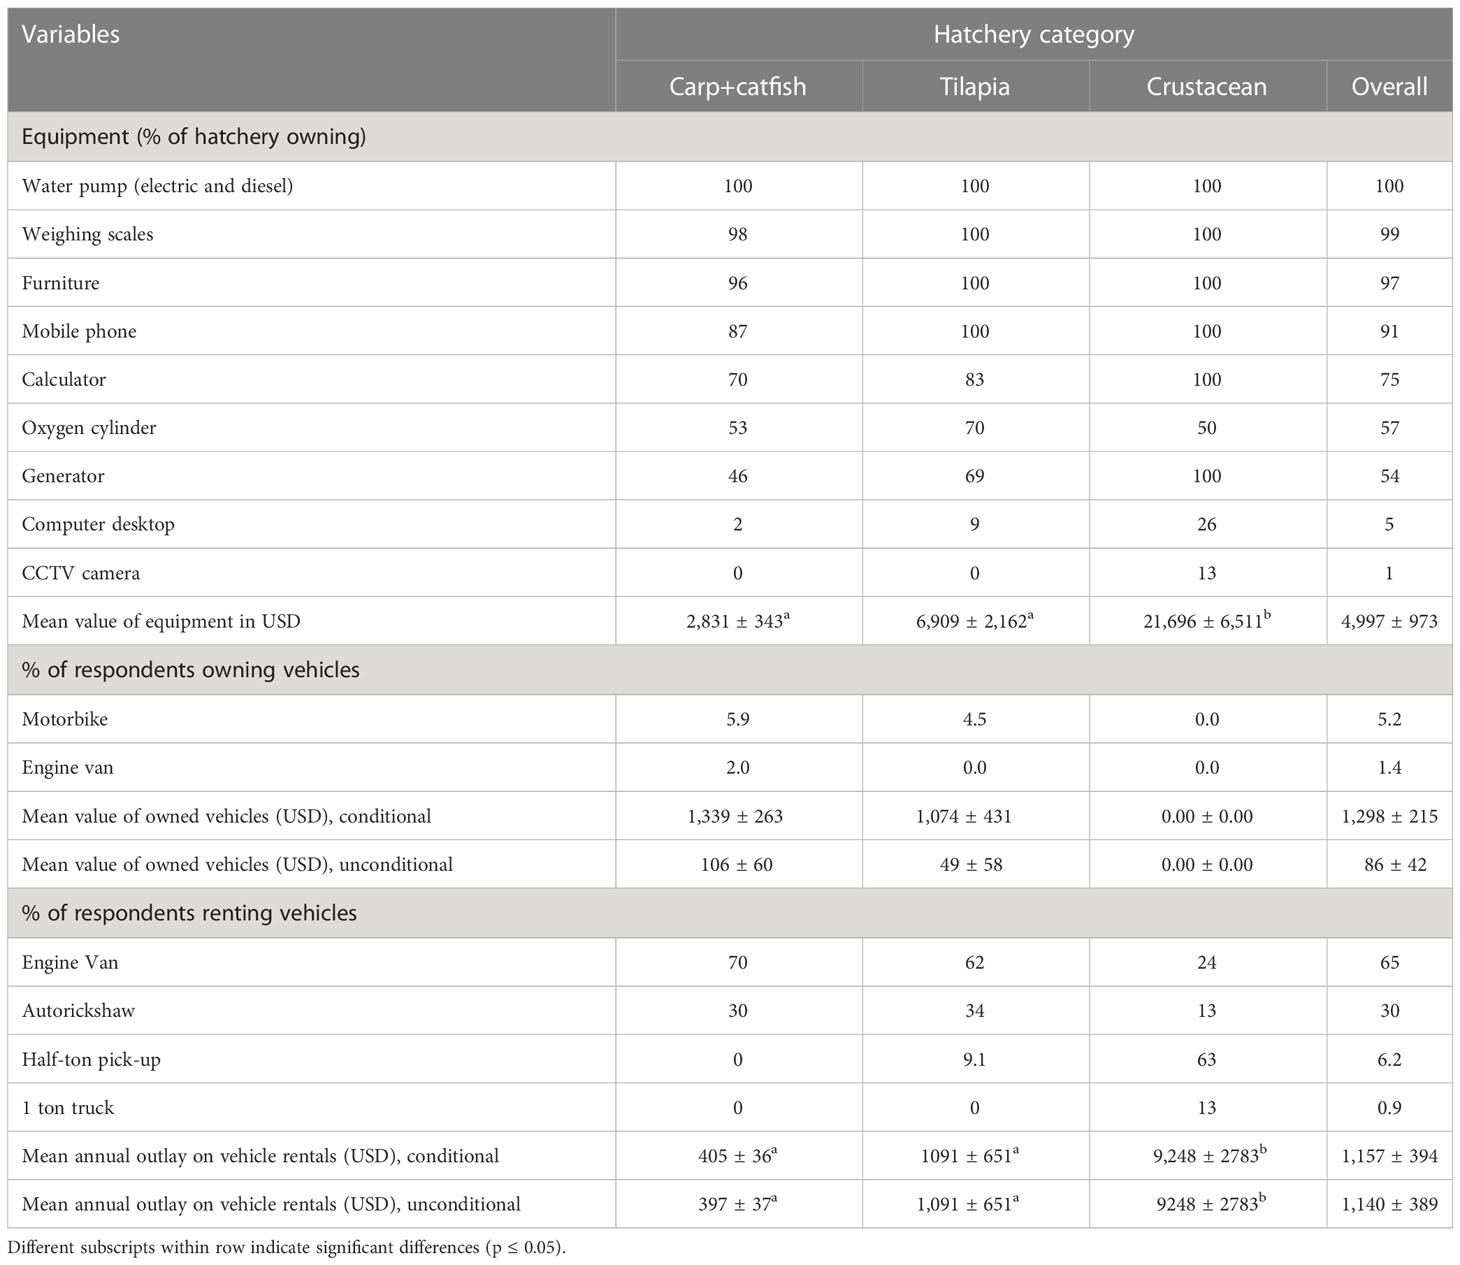
Table 3 Value and ownership of equipment and vehicle, and used by hatcheries.
The ownership of CCTV cameras has also increased, with 13% of crustacean hatcheries using them for business security. Similarly, the ownership of mobile phones has increased from 75% in 2013 to 91% in 2021, with the average value of mobile phones increased from USD 68 to USD 120 over this period, reflecting the shift from analog phones to more sophisticated smartphones. These phones are not only useful for maintaining connections between hatcheries and clients, but also for learning hatchery operation-related activities online.
None of the hatcheries owned any large vehicles such as trucks. Vehicle ownership is limited primarily to motorbikes (5.9% of carp+catfish and 4.5% tilapia) for personal transportation and ‘engine vans’ (2% of carp+catfish) to transport inputs. The value of vehicles owned is relatively low, averaging USD 86 across hatchery categories (Table 3). Therefore, hatcheries relied heavily on rented vehicles, particularly small electric and motorized vehicles such as engine vans (65%) and autorickshaws (30%) for transporting inputs and seed. Most crustacean hatcheries (63%) rented 1-ton trucks, while 13% rented half-ton trucks for moving large loads for longer distances. The average annual expenditure per hatchery on transport increased from USD 135 in 2013 to USD 1140 in 2021 (Table 3). The low level of vehicle ownership and consequent dependence on rented transport services (i.e., hired vehicle plus driver), reflects the wider availability of third-party logistics firms (transport rental providers) in the study area, highlighting the crucial role that these play in enabling the movement of hatchery inputs and outputs between buyers and sellers.
3.4 Conduct
3.4.1 Seasonality
Fish hatcheries have a seasonal operation with peak and lean periods for seed production. The peak season runs from March to June, corresponding to the primary period for stocking grow-out farms. In contrast, the lean season for hatchery activities is during January-February and July-August. The spawn produced in the later months is mainly stocked in nursery ponds to produce over-wintered fingerlings, which are used to stock grow-out ponds early in the following season. Hatcheries were not operated during the months of September to December and this period was considered an off-season or business off for the hatcheries.
3.4.2 Composition, volume, and value of fish seed sold
The surveyed hatcheries produced a total of 20 different species, of which 18 fish species and 2 crustaceans (Table 4). Carp was the dominant species group (with concentration in a few carp species), followed by tilapia and crustaceans. Other species were produced in smaller quantities. These findings are consistent with our farm survey conducted at the same time, which identified carp, tilapia, and crustaceans as the main species farmed in the region.
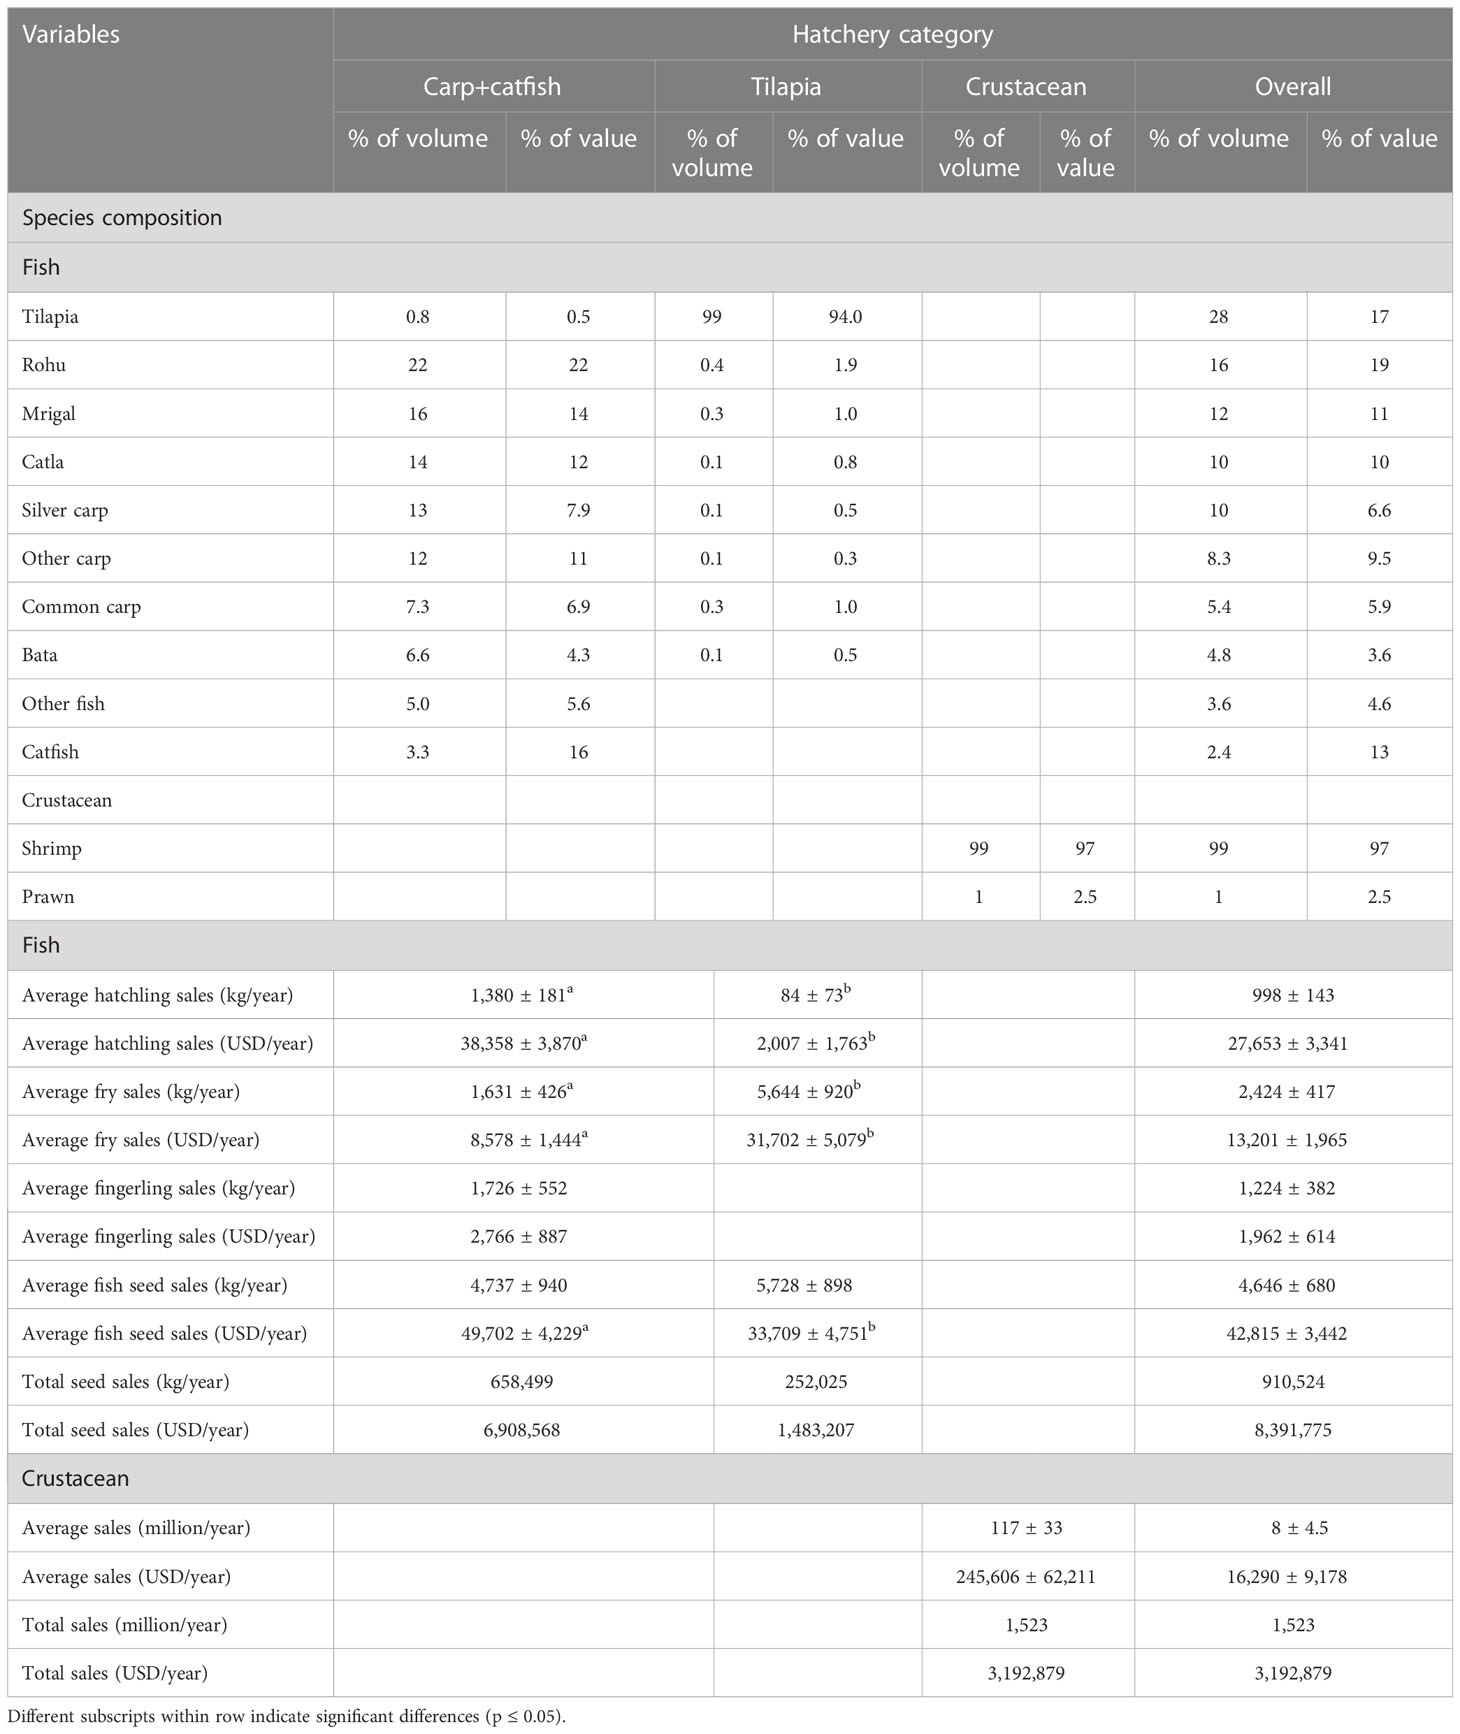
Table 4 Share of seed sold by species, and average and total sales volume and value.
The volume of fish seed production has increased 1.3 times from 2013 to 2021. This increase was largely attributed to the production of tilapia seed, which saw a volume increase of 43% over the same period (DoF, 2022). Tilapia hatcheries produced only a single species, which contributed to 28% of the total fish seed production but only 17% of the total sales value, indicating relatively low unit price of tilapia seed in Bangladesh. Carp represent the largest share of fish seed, accounting for 67% of the volume and 66% of the sales value. The share of carp seed production increased by 13% from 2013 to 2021. Rohu, one of the most important aquaculture fish in Bangladesh, ranked second in terms of production volume, contributed the largest share (24%) of carp seed production (DoF, 2022).
Catfish accounted for only 3.3% of total seed production in carp+catfish hatcheries, but contributed to 16% of total sales value. Among catfish seed, pangasius contributed to 51% of volume but only 13% of sales value. This suggests the higher per unit value of local indigenous catfish seed compared to pangasius. The production of local indigenous catfish seed increased by 62% over the last 10 years before the survey (DoF, 2022), indicating the potential for the development of catfish farming in southern Bangladesh.
Crustacean seed/PL production decreased by 23% from 2013 to 2021 in surveyed hatcheries. This finding is consistent with national PL production data for Bangladesh, which reported a 16% drop of crustacean seed production over the same period (DoF, 2022). Black tiger shrimp dominated the production (99% of volume) and sales value (97% of sales value) of crustacean PL. Freshwater prawn contributed only a small portion (1% of volume) of PL produced in 2021, and production has decreased by 98% from 2013 to 2021 due to problems with unidentified disease in freshwater prawn hatcheries, as reported by Briggs (2013).
Fish seed were mostly sold as hatchlings, except for tilapia that was sold as fry. The hatcheries also kept some hatchlings to nurse in their own nursery pond and sold them as fries and/or fingerlings. The average annual sales volume and value of seeds were 4,737 kg and USD 49,702 for carp+catfish, 5,728 kg and USD 33,709 for tilapia, and 117 million PL and USD 245,606 for crustacean hatcheries, respectively. The population-weighted estimates of annual sales volume and value for all hatcheries operated in southern areas were significant, totaling 910 MT and USD 8.4 million for fish seed and 1,523 million and USD 2.2 million for crustacean PL.
3.4.3 Hatchery procurement behavior
Almost all fish hatcheries (96%) used their owned broodstock to produce seed (Table 5) and recruited new broodstock every 2.3 years to improve quality and avoid inbreeding. The new broodstock were primarily sourced from their own farms (78%), followed by farms in the same district (25%), farms in other district (16%) and others (4.9%). The collection of broodstock from own farm is common practice in fish hatcheries in Bangladesh (Khanom et al., 2020). Most matured broodstock (86% of volume) were used annually, and each broodstock was used 2.6 times per year, suggesting a high level of efficiency in the hatchery operations. In contrast, crustacean hatcheries collected black tiger shrimp nauplii from other hatcheries in Cox’s Bazar district and freshwater prawn broodstock from wild sources from suppliers. The average number of total suppliers and regular suppliers of broodstock was 4.5 and 3.4, respectively (Table 5) and were significantly higher (p ≤ 0.05) in the carp+catfish and crustacean hatcheries compared to tilapia hatcheries.
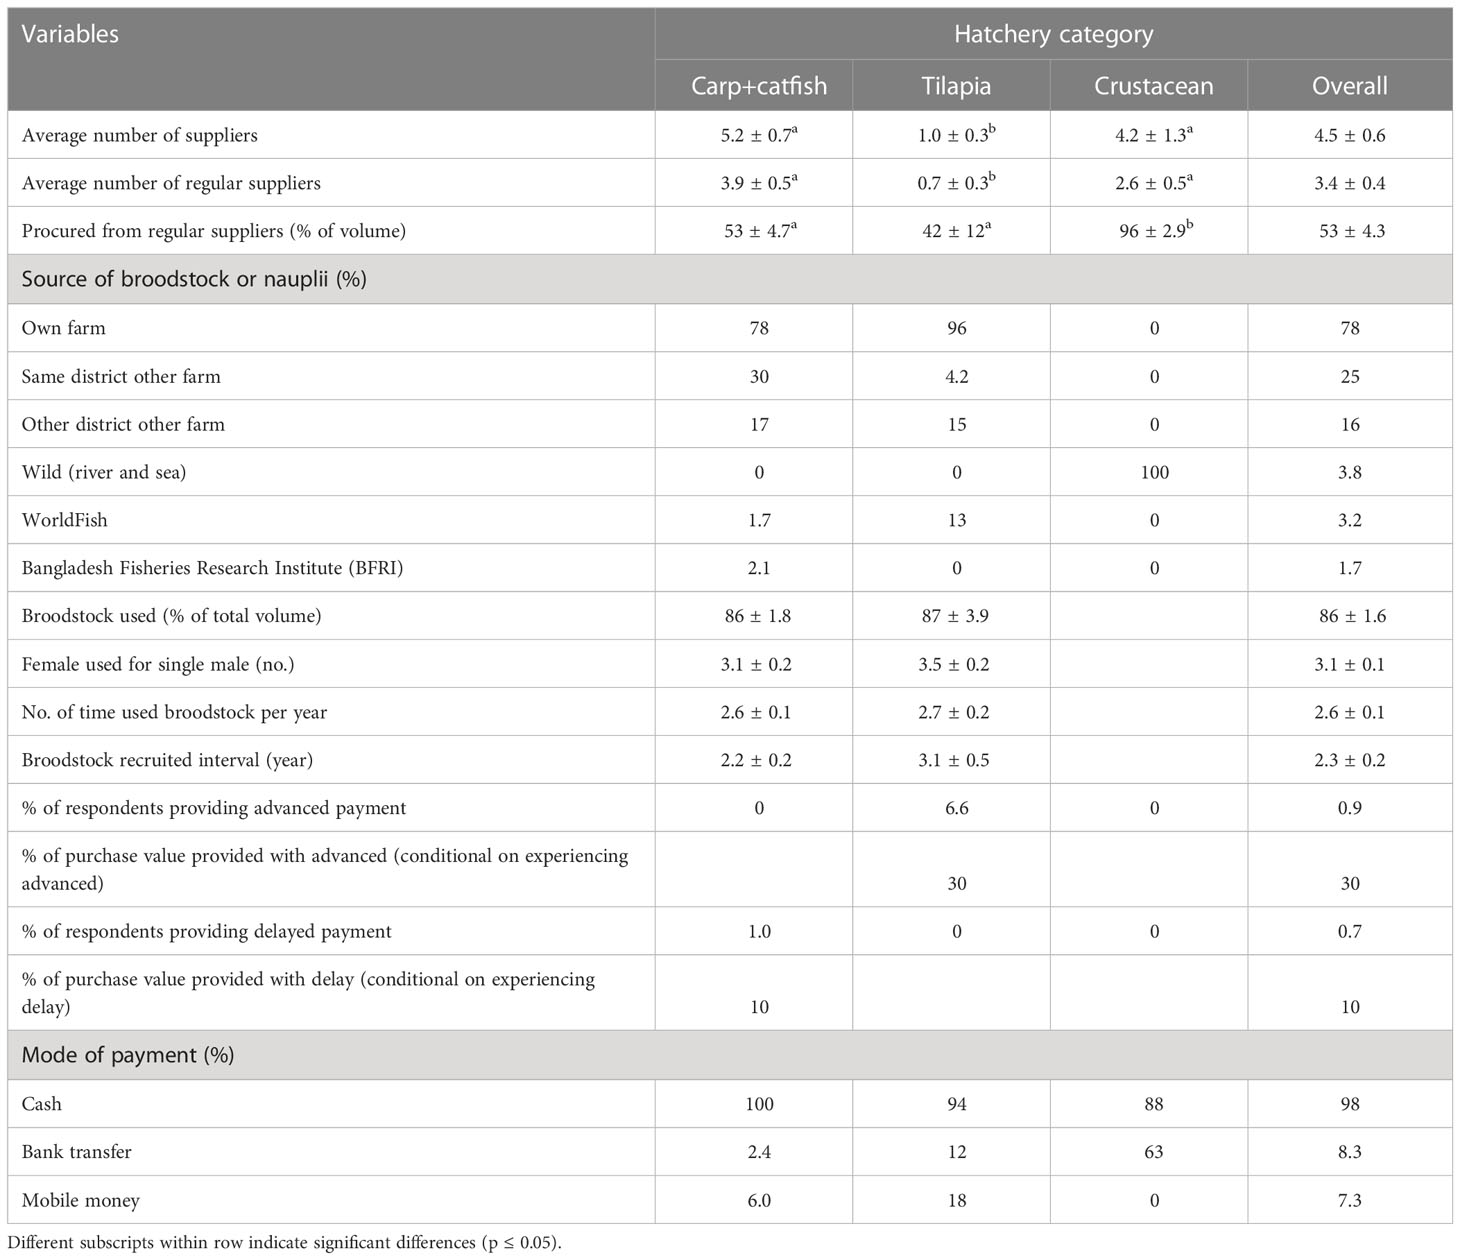
Table 5 Hatcheries broodstock procurement and production behavior.
3.4.4 Hatchery sales behavior
Hatcheries sold seeds to an average of 243 customers (Table 6) and the number of customers was significantly higher (p ≤ 0.05) in tilapia and carp+catfish hatcheries than crustaceans. About 69% of the clients were regular customers who bought 73% of the volume of seed sold, indicating the importance of social relationships and trust in determining the choice of hatcheries. Carp+catfish and tilapia hatcheries sold 50% and 30% of total seed directly to nursery owners, who then nurse them to produce fries and fingerlings to resell to farmers. This reflects a lengthening of the seed supply chain. In contrast, crustacean hatcheries primarily sold their seed directly to farmers (45% of volume) or large traders (53% of volume). The meso-scale data also indicates that the share of seed sold directly from hatcheries to farmers increased from 20% in 2013 to 30% in 2021, indicating a trend towards more direct sales and potentially shorter supply chains in the seed industry. Hatcheries sold seed to customers within various geographic ranges, including within the same union (11-22%), the same upazila (16-32%), same district (16-19%), and other districts (25-38%). The share of seed sold to customers in other districts decreased from 40% in 2013 to 27% in 2021, likely due to the establishment of new hatcheries in more remote areas, which allows for seed sales closer to the point of production.
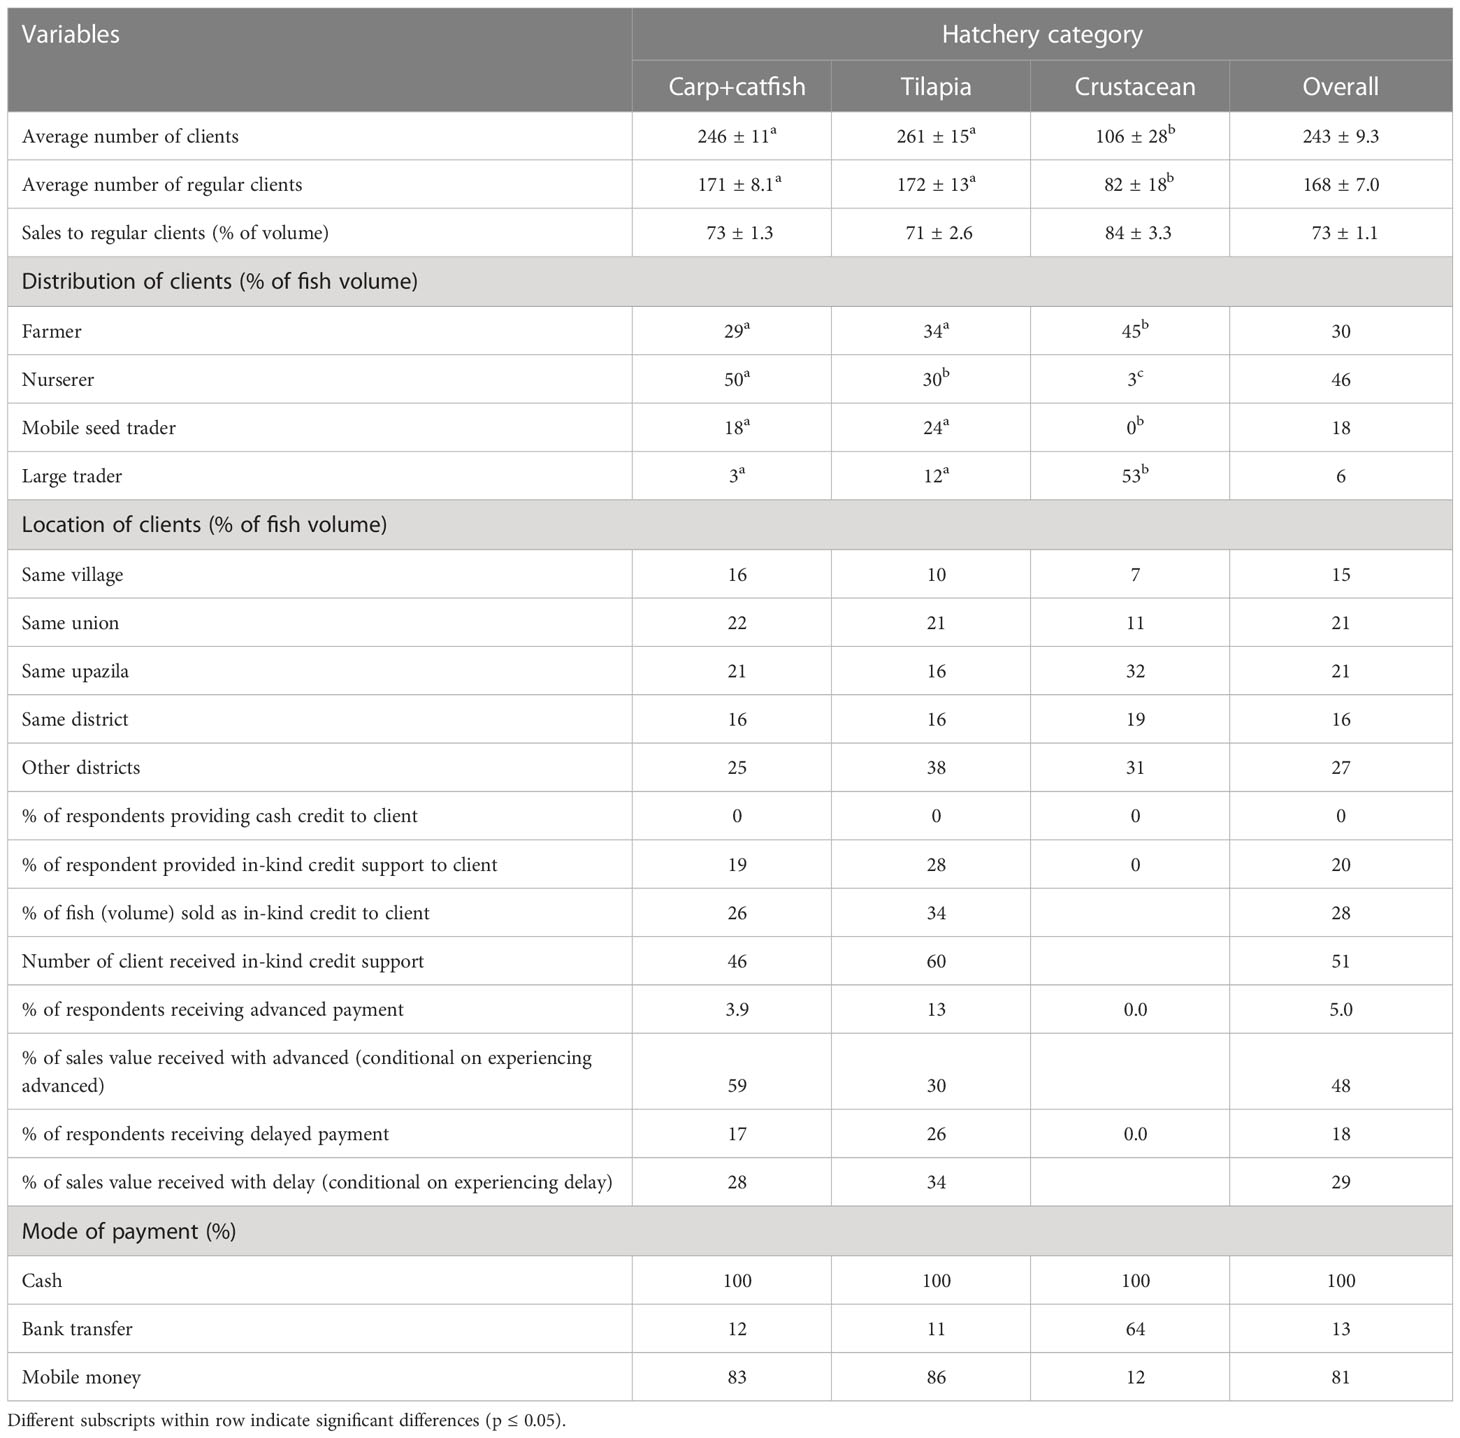
Table 6 Hatcheries sales behavior.
None of the hatcheries surveyed provided any cash credit to their customers. However, 20% of hatcheries (carp+catfish and tilapia) reported providing in-kind credit to well-known and trusted regular customers, with an average value of 28% of the volume of seed sold. Additionally, a quarter of tilapia and 17% of carp+catfish hatcheries reported receiving short-term delayed payment from regular clients, averaging 29% of the value of seed sold. Only 5% hatcheries reported receiving advanced payment from clients, amounting to 48% of total sales value. All hatcheries surveyed received payment in cash, but most carp+catfish (83%) and tilapia (86%) hatcheries also received payment via mobile phone based financial service. In contrast, crustacean hatcheries were more likely to receive payment by bank transfer (64%). This electronic payment may help to facilitate long-distance trade and improve the ease of conducting business across different locations.
3.4.5 Services offered by hatcheries to clients
Hatcheries offered a variety of services to their clients beyond seed production and sales, as presented in Table 7. The most commonly provided service was packing at the time of sale, which was provided by 94% of the hatcheries. Sorting or grading seeds by size prior to sale was reported by 70% of hatcheries in 2021, which is an increase from 50% in 2013. In addition to these services, 20% of hatcheries reported providing in-kind credit to customers, and a smaller proportion (9%) offered seed delivery services. These additional services can help to develop a good relationship between buyers and sellers, ultimately leading to increased sales volume.
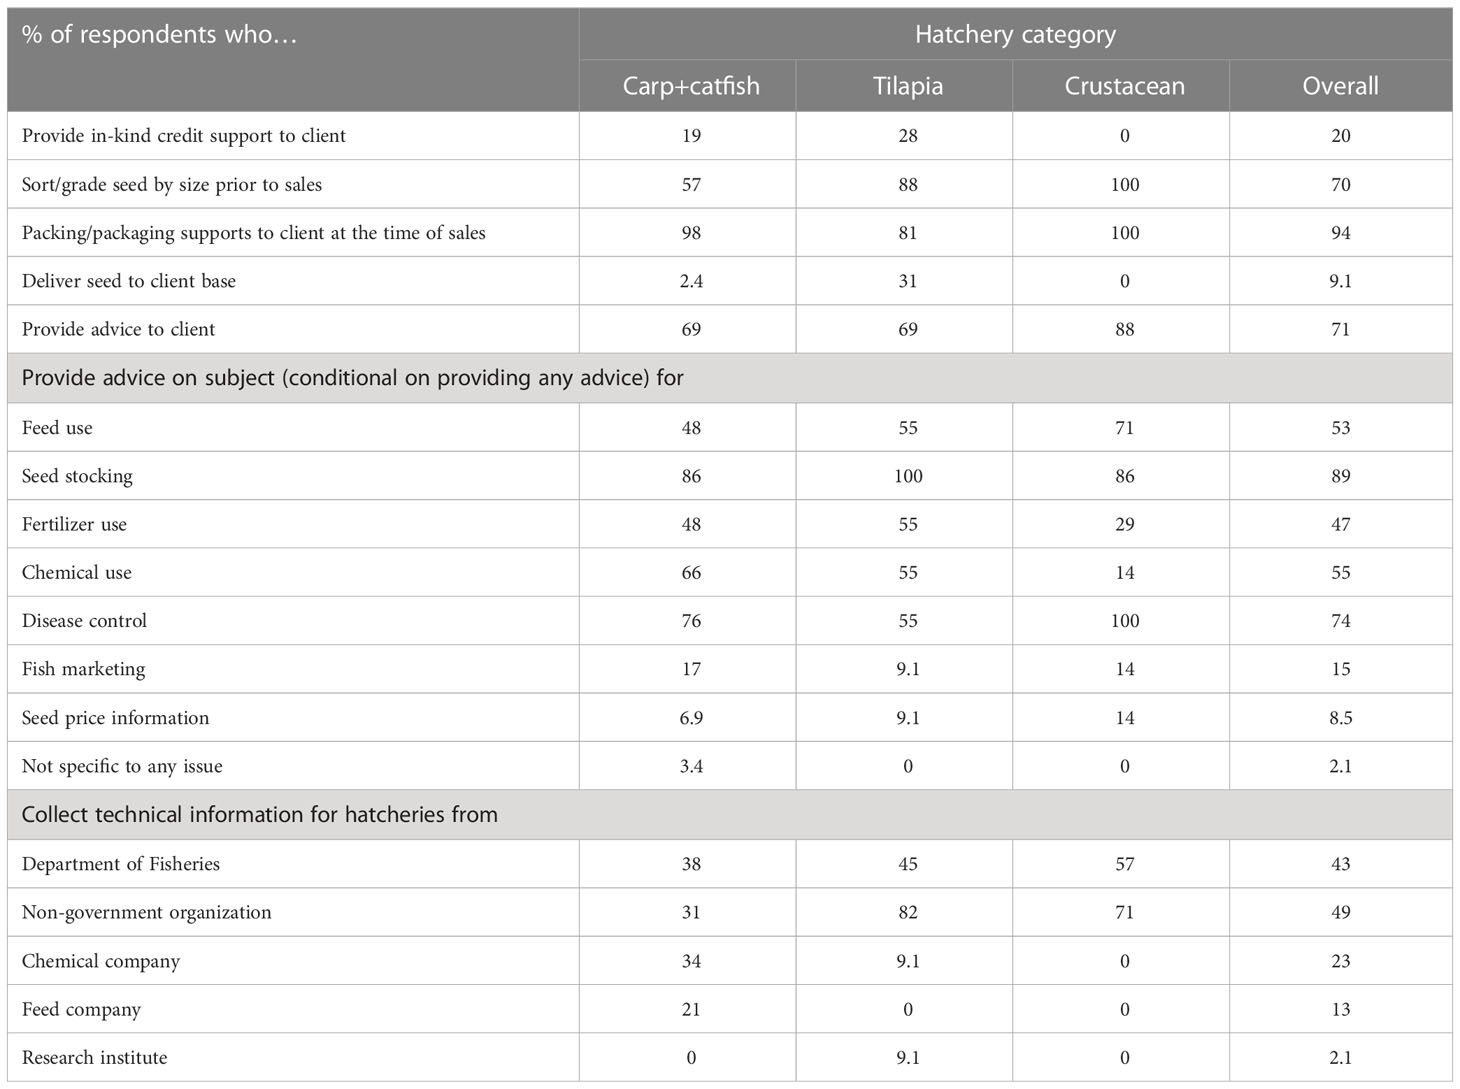
Table 7 Type of services provided by fish hatcheries to clients.
Most hatcheries (71%) provided technical advice to clients, covering topics such as stocking seeds, application of feeds, chemicals and fertilizers, disease control, and seed prices. However, the quality of this technical information is unknown. Key informant interviews suggest that hatcheries regularly provide seed price information to farmers, nursery owners, and mobile seed traders, which is beneficial for all parties involved. Most respondents (49%) reported getting technical information from non-governmental organizations, followed by the Department of Fisheries (43%), chemical companies (23%), and feed companies (13%).
3.4.6 Financial management
The average annual working capital was USD 30,843 across hatchery categories (Table 8), with crustacean hatcheries having significantly higher (p ≤ 0.05) working capital compared to others, reflecting their larger scale of operation and higher operational costs. Most working capital came from reinvestment of business earning (84%) and own savings (4.3%). Bank loans were found to be a more important source of working capital for crustacean hatcheries (28% of funds) than for tilapia (14% of funds), and carp+catfish (6%).
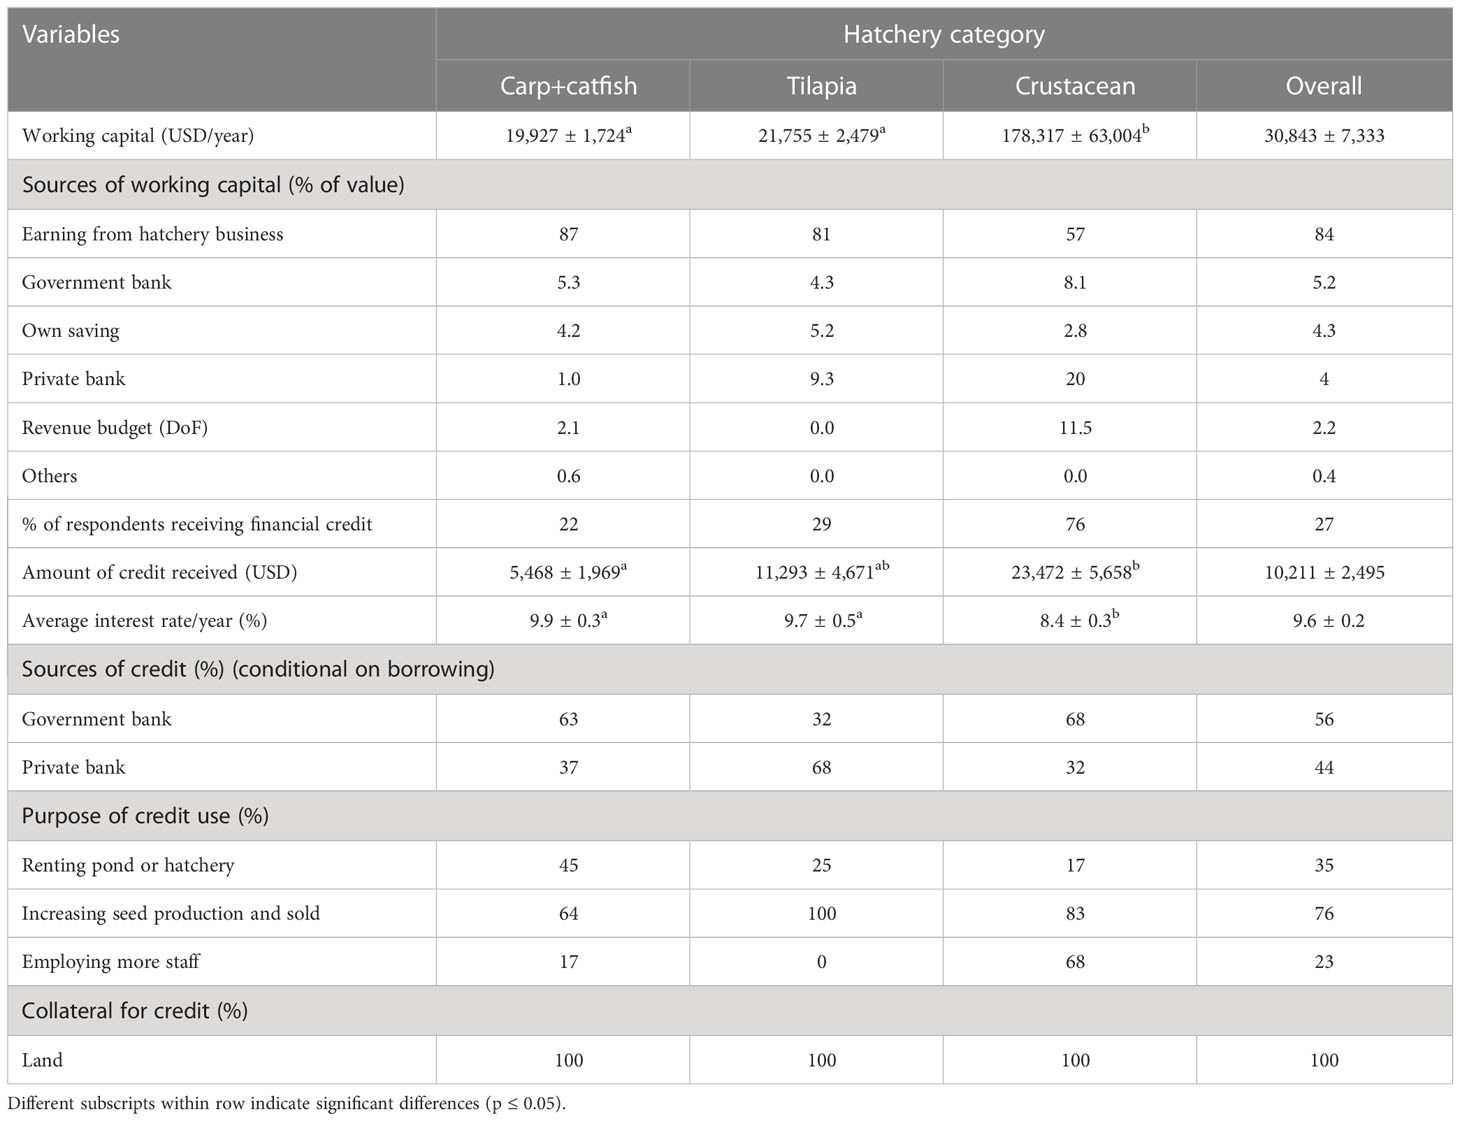
Table 8 Hatchery business access to finance.
More than 27% of respondents borrowed from at least one lender, with borrowing more common for crustacean compared to tilapia and carp+catfish hatcheries. All respondents who borrowed money took loans from government (56%) or private (44%) banks, suggesting widespread access to formal credit (e.g., Sabur et al., 2010; Sarwer, 2021). None of the hatcheries reported receiving any loans from microfinance institutions or informal moneylenders, and reported interest rates were relatively low across hatchery categories at 9.6% per annum, indicative of high levels of access to formal financial institutions (e.g., Jahan et al., 2015).
3.5 Performance
3.5.1 Employment generation
The characteristics of employment by type of labor (family, permanent hired or causal hired) are presented in Table 9. Almost all hatcheries (96%) used family male labor for operational activities, with an average of 1.6 male family members employed. Additionally, 10% of hatcheries (carp+catfish, and tilapia) also employed female family labor, with an average 1.1 female family members employed. The majority of hatcheries (78%) hired permanent male labor, with an average of 3.7 workers, and crustacean hatcheries employed significantly higher workers (p ≤ 0.05) than other hatcheries. Moreover, 68% of the hatcheries employed casual male workers, with an average of 5.8 workers, for general manual activities. However, none of the respondents employed any casual or permanent female workers.
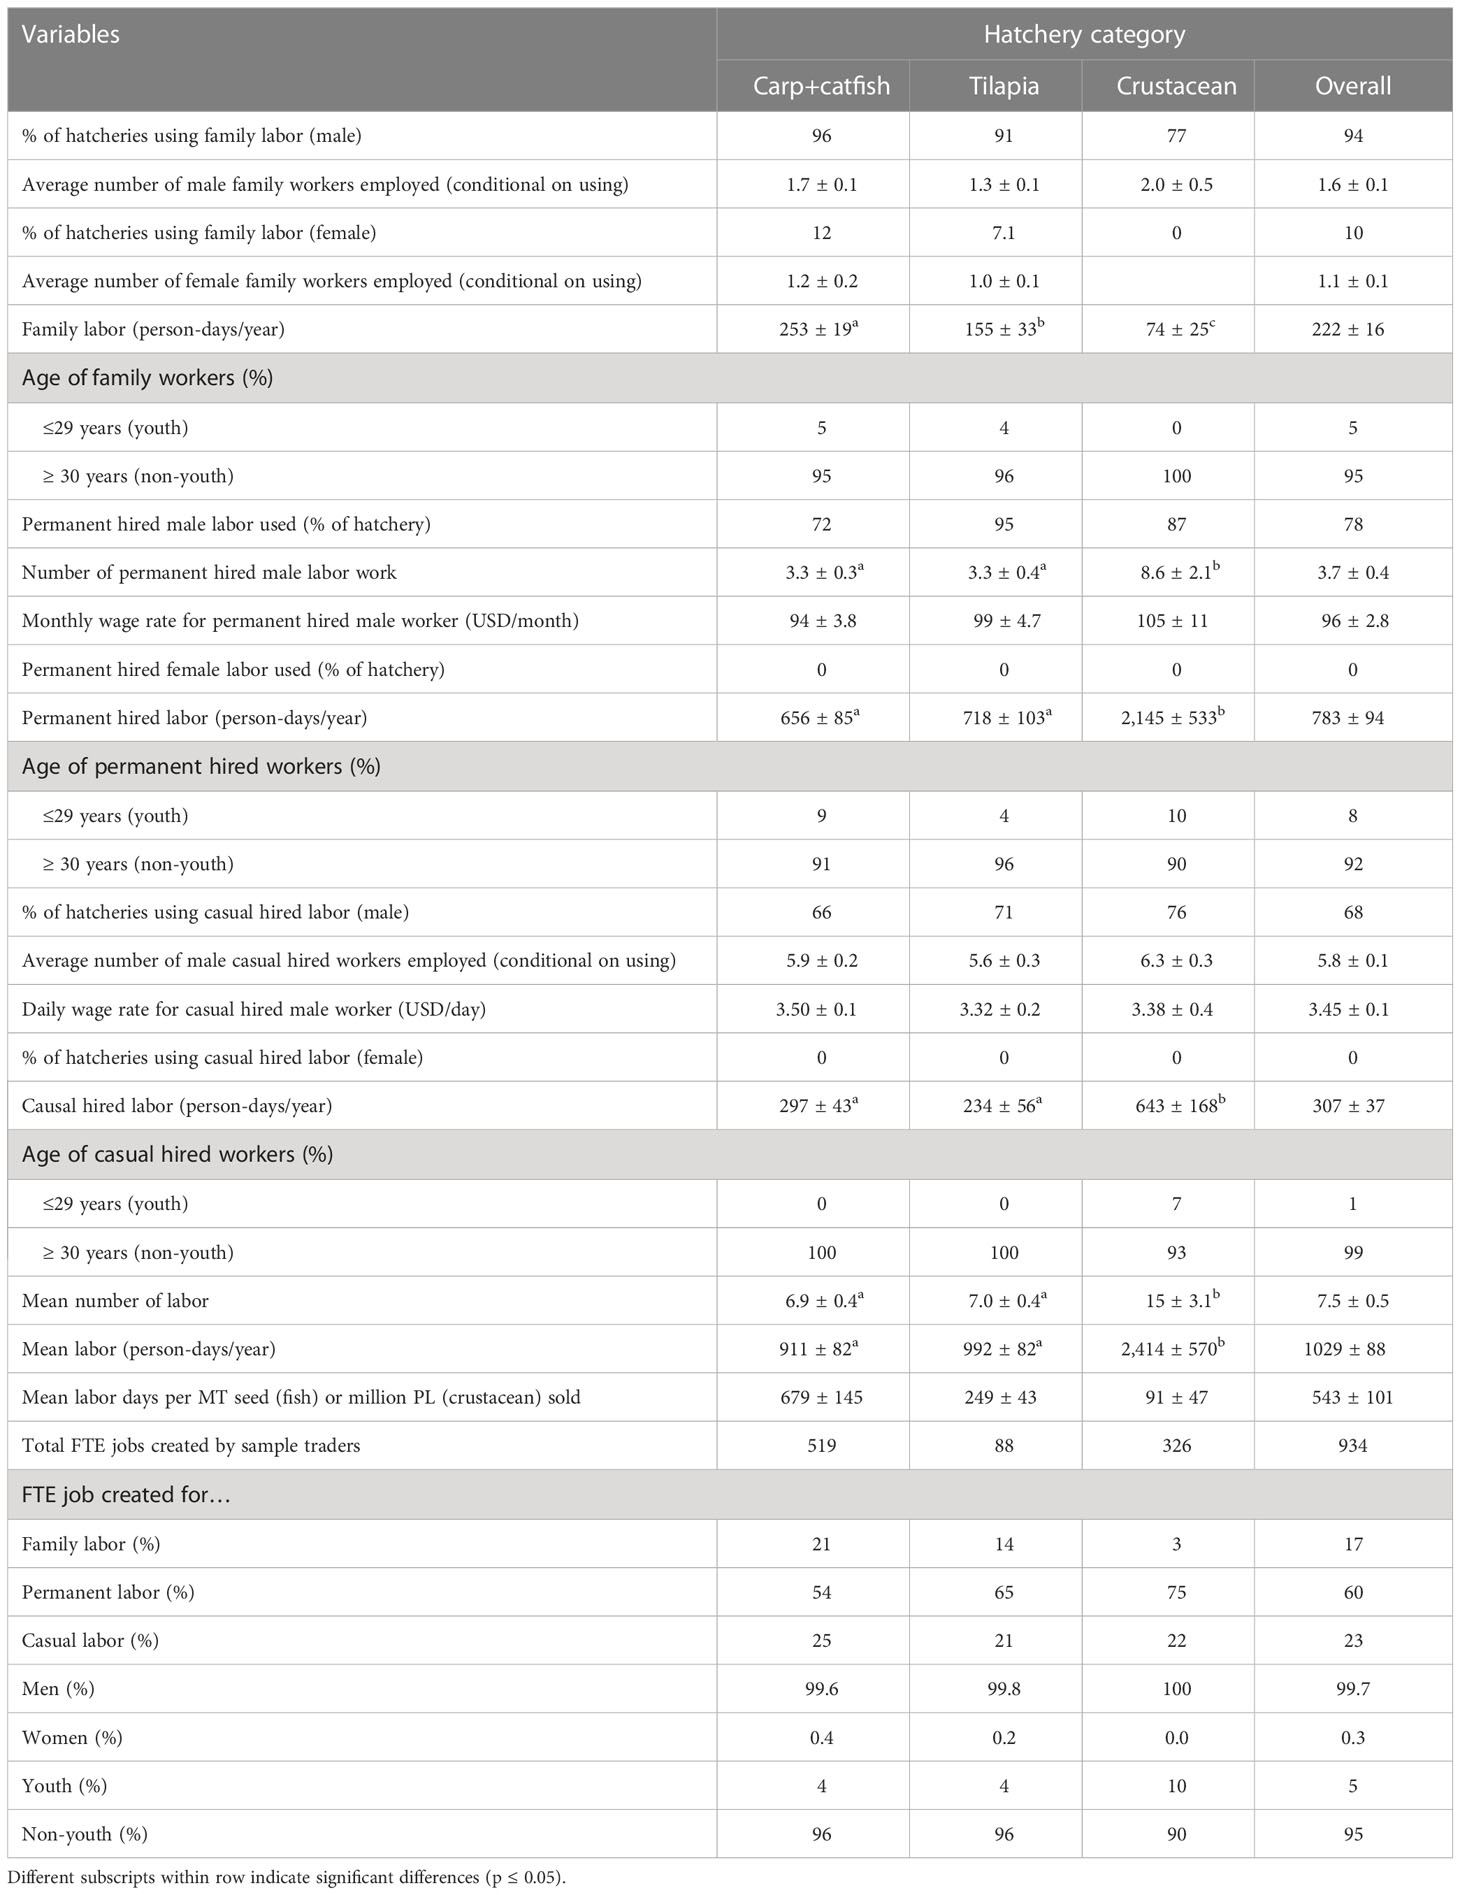
Table 9 Characteristics of labor use by hatchery business.
The majority of family (95%), permanent (92%), and casual (99%) workers employed by hatcheries were ≥ 30 years old, indicating the challenges for young people to enter the hatchery business due to various factor such as lack of access to financing, limited knowledge and skills, and preference for other types of employment (Arulingam et al., 2019). The average daily wage earned by casual workers was USD 3.45/day, which is higher than the national average daily wage rate of Bangladesh (USD 2.14/day) for agricultural work (BBS, 2022). The average monthly wage of USD 102 paid to permanent workers did not differ significantly (p ≥ 0.05) between hatchery categories. However, the monthly wage rate was 55% higher than national minimum wage rate in Bangladesh (BBS, 2022). This suggests that employment in the hatchery sector may provide better wages and working conditions than many other agricultural jobs in Bangladesh.
Hatchery business created an average of 543 days of employment per MT of fish seed or per million of PL sold across hatchery categories. The 66 surveyed hatcheries appointed an average 7.5 workers each, and created 943 full time equivalent (FTE)2 jobs, assuming 2080 working hours per year. These FTEs included 17% family, 23% casual and 60% permanent labor (Table 9). Hatchery industry created employment opportunities mainly for men (99.7%), with only 5% of workers being aged ≤29 (i.e., youth). This reflects the family-owned and operated nature of many hatchery businesses, which may limit the opportunities for young people and women to enter the sector. These findings are consistent similar studies conducted in other aquaculture producing countries, which have also reported a high degree of family involvement and limited opportunities for youth and women in the fish seed production segment (Nasr-Allah et al., 2014; Joffre et al., 2021; Shoko et al., 2022).
The total FTE jobs created by hatcheries in the seven southern districts of Bangladesh were estimated (Table 10). Therefore, the total volume of fish and crustaceans seed produced in these districts was estimated using population weighted total for all hatcheries operated in surveyed districts. Total FTE jobs created by hatcheries were estimated by each hatchery by multiplying the mean labor days per unit of seed sold by the total quantities sold. These estimates are disaggregated for each hatchery group by family, casual, and permanent labor, youth and non-youth, and male and female employment.
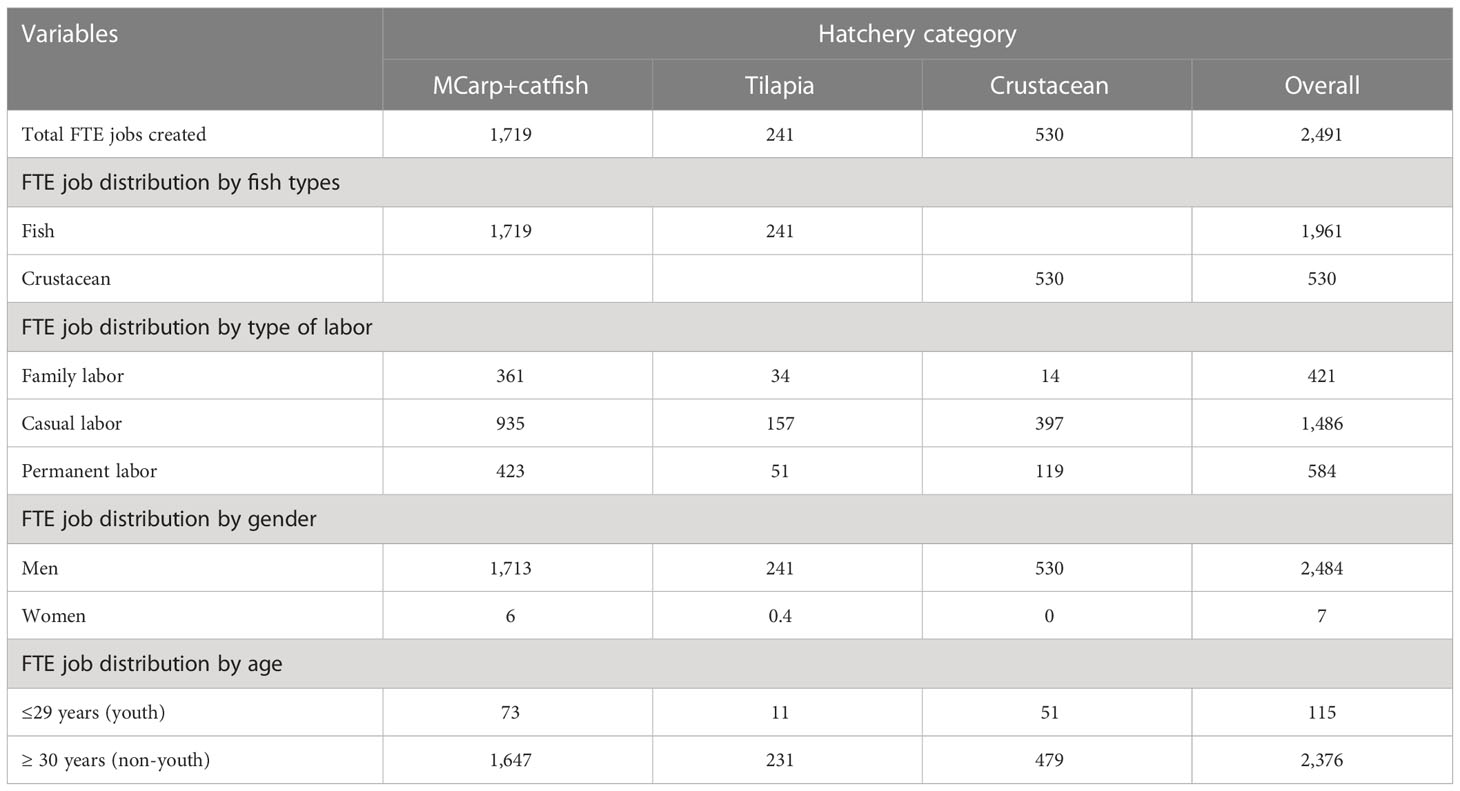
Table 10 Estimated total FTE jobs created by hatcheries in the surveyed seven districts.
The total number of FTE jobs created by hatcheries in southern region was 2,491, with 421 FTEs from family labor, 584 FTEs from casual labor, and 1,486 FTEs from permanent labor. The majority of employment created was non-youth (2,376) and male (2,484). Fish seed production and sales created the majority (79%) of the employment, with crustacean hatcheries contributing the remaining 21%, or 530 FTEs. Carp and catfish hatcheries created the most employment (1,719 FTEs or 69% of the total), followed by crustacean hatcheries (530 FTEs or 21%), and tilapia hatcheries (241 FTEs or 10%).
3.5.2 Impacts of COVID-19 on the hatchery sector
The hatchery production and sales were negatively impacted by COVID-19, similar to other segments of aquaculture value chain in Bangladesh. Key informant interviews indicated that the interruptions in hatchery operations resulted in lower seed production and sales in 2020 and 2021 compared to 2019. The hatchery survey results show a 17% decrease in seed sales in 2021 compared to 2019, which was a significant decline. The reduction in sales volumes reflects fewer customers, and has resulted lower quantities of seed sold at a lower price than usual, and lower incomes for hatchery owners (Figure 3). These findings are consistent with other research on the impacts of COVID-19 on the aquaculture sector in Bangladesh that reported lower sales volume due to lockdowns and travel restrictions (Belton et al., 2021).
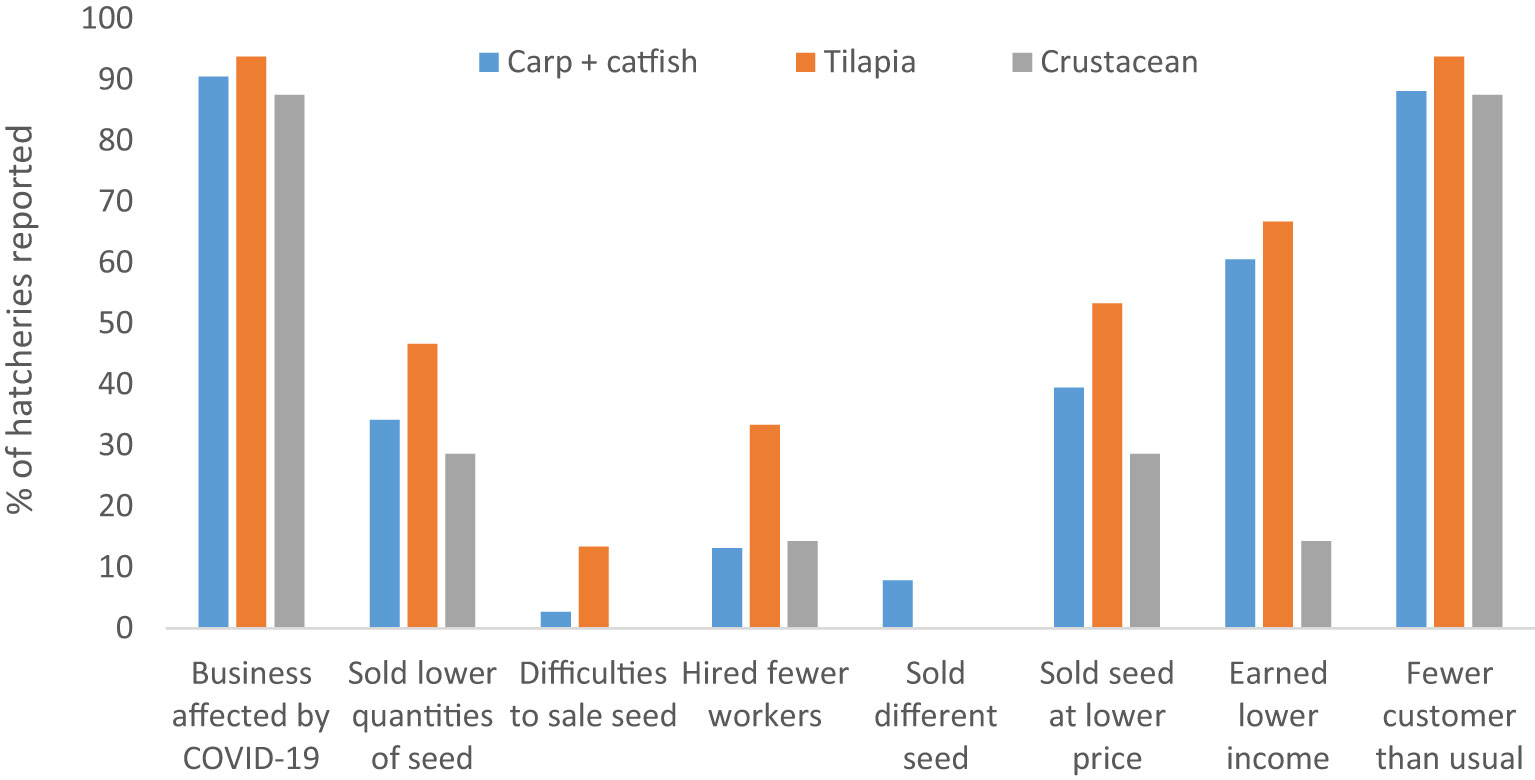
Figure 3 Share of hatcheries facing COVID-19 related challenges in 2021.
3.5.3 Financial performance
Average annual hatchery operating costs were substantial, at USD 22,996 (Table 11), and significantly higher (p ≤ 0.05) for crustacean hatcheries compared to tilapia and carp+catfish hatcheries. Variable costs account for 85% of total costs. Production inputs including feed, and salaries were the most important cost items across all types of hatchery, comprising 32% and 16% of variable costs, respectively, except for crustacean hatcheries. In crustacean hatcheries, transportation was the single largest cost item, accounting for 23% of variable costs. This result may reflect the need to collect inputs (e.g., nauplii, salt water) from suppliers located far away.
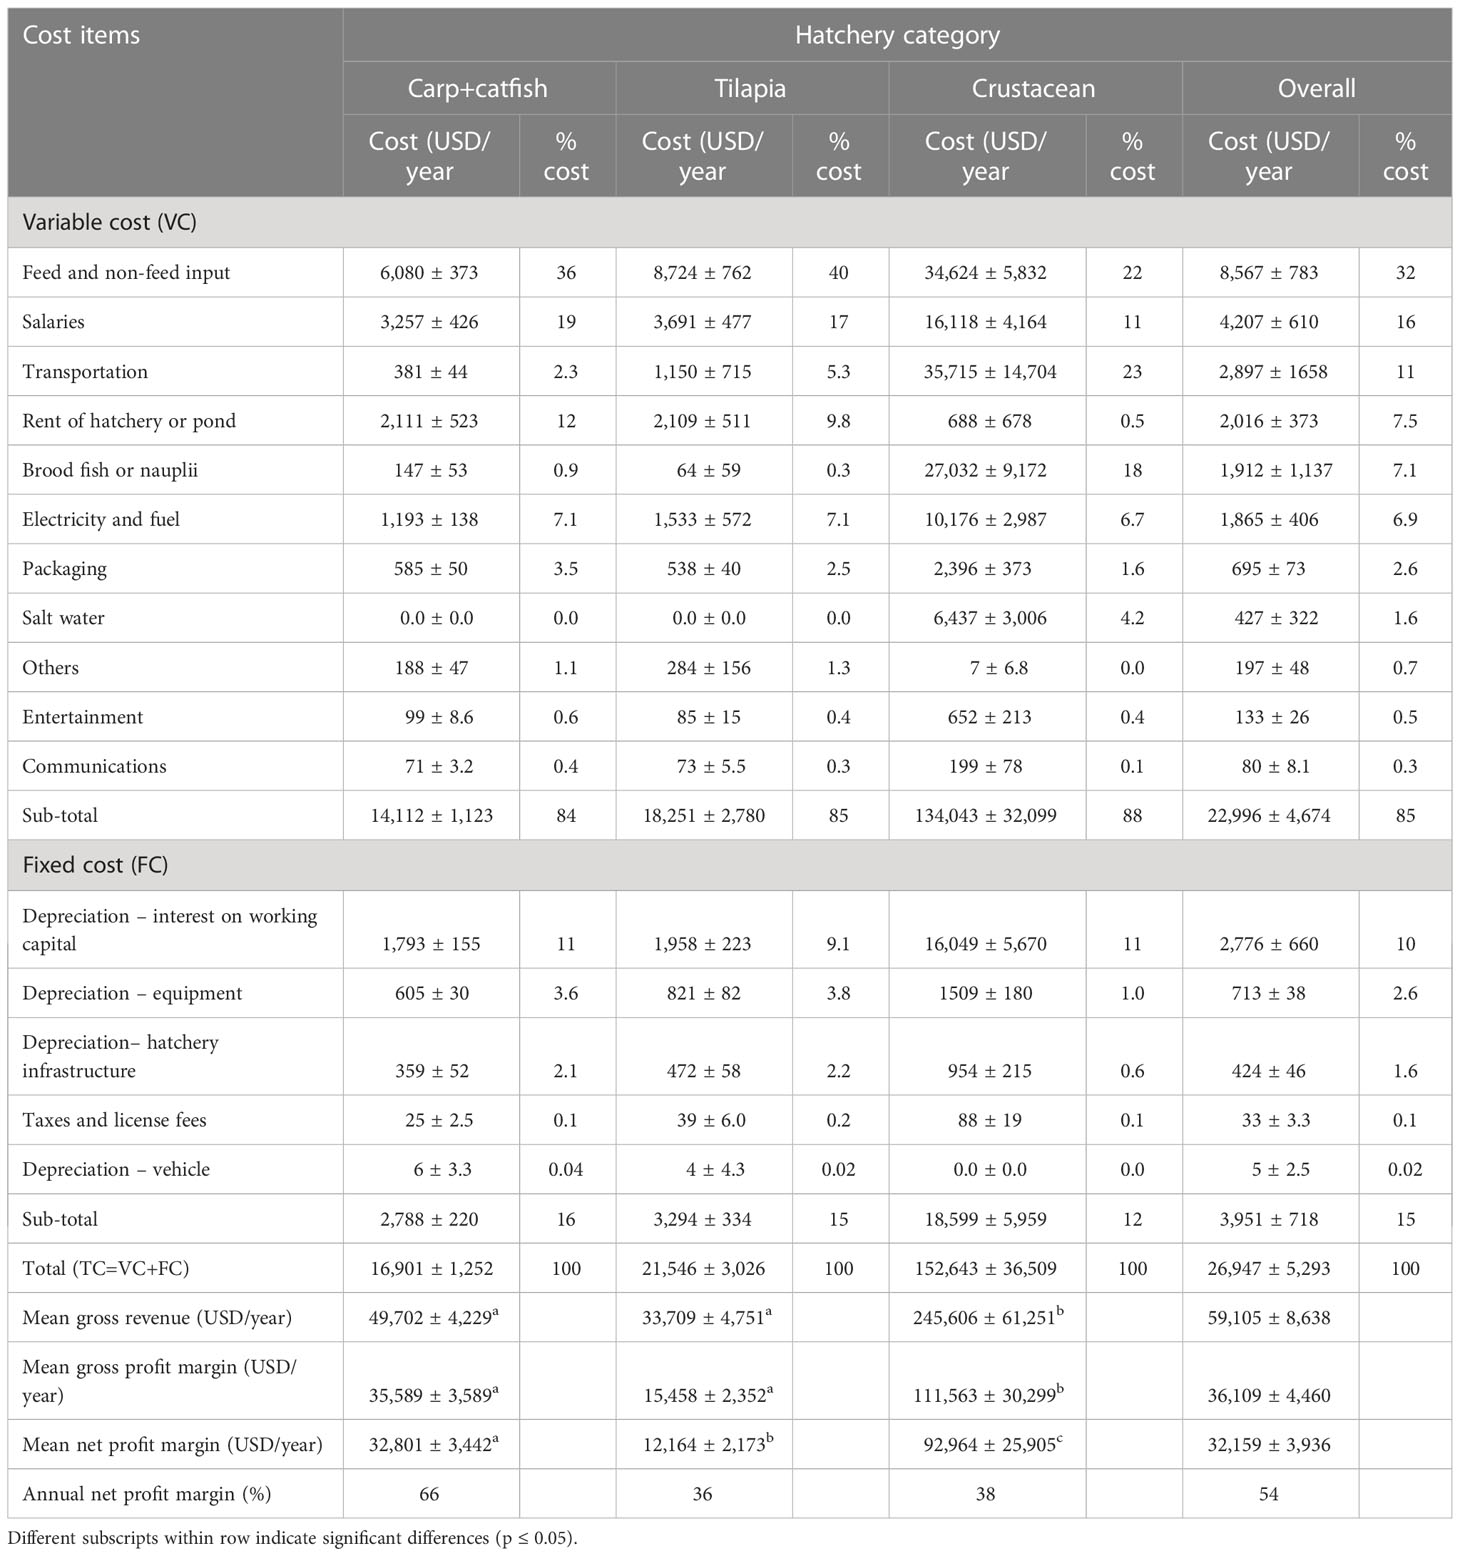
Table 11 Annual cost and profit margin of business operation.
Almost all hatcheries (95%) reported a positive profit. The mean annual gross profit margin was significantly higher (p ≤ 0.05) in the crustacean (USD 111,563) than the carp+catfish (USD 35,589) and tilapia (USD 15,458) hatcheries. The average annual net profit margin, which accounts for all annual fixed and operating costs, was USD 32,159, and differed significantly (p ≤ 0.05) between hatchery categories. Across all hatcheries, the average annual net profit margin was 54% of the gross revenue, which is relatively modest considering the total annual working capital investments. These findings suggest the existence of competitive seed markets in Bangladesh.
None of the hatcheries reported any loss or waste at the time of sales or delivery of seed. However, 18% of hatcheries (26% of carp+catfish, and 13% of crustacean) reported facing disease and/or water quality problems such as white spot disease, fungal disease, tail and fin rot, gill rot, argulosis and lernaeasis. The average annual mortality rate was 13% and 10% for carp+catfish and crustacean hatcheries, respectively. Despite these challenges, the average annual economic loss due to mortality was only 0.71% of the total seed sales values, which is quite low.
3.6 Farmers seed procurement and use
We analyzed fish seed procurement and use by farmers in the same locations where hatcheries surveyed. All farmers stocked carp fish seed, and most of them (72%) stocked tilapia seed (Table 12). Additionally, 16% of farmers particularly only fish and prawn+fish farmers also stocked catfish seed along with carp and tilapia. All farmers, except those stocking only fish, stocked freshwater prawn and/or tiger shrimp PL. The average annual fish stocking density was 498 kg/ha and it was significantly higher (p ≤ 0.05) in only fish farms, followed by prawn+fish, shrimp+fish, and prawn+shrimp+fish farms. The mean annual stocking density of crustacean was significantly higher (p ≤ 0.05) in shrimp+fish and prawn+shrimp+fish farms than prawn+fish farms. The mean seed stocking cost was USD 791 ha-1 and did not differ significantly (p ≥ 0.05) between farm categories.
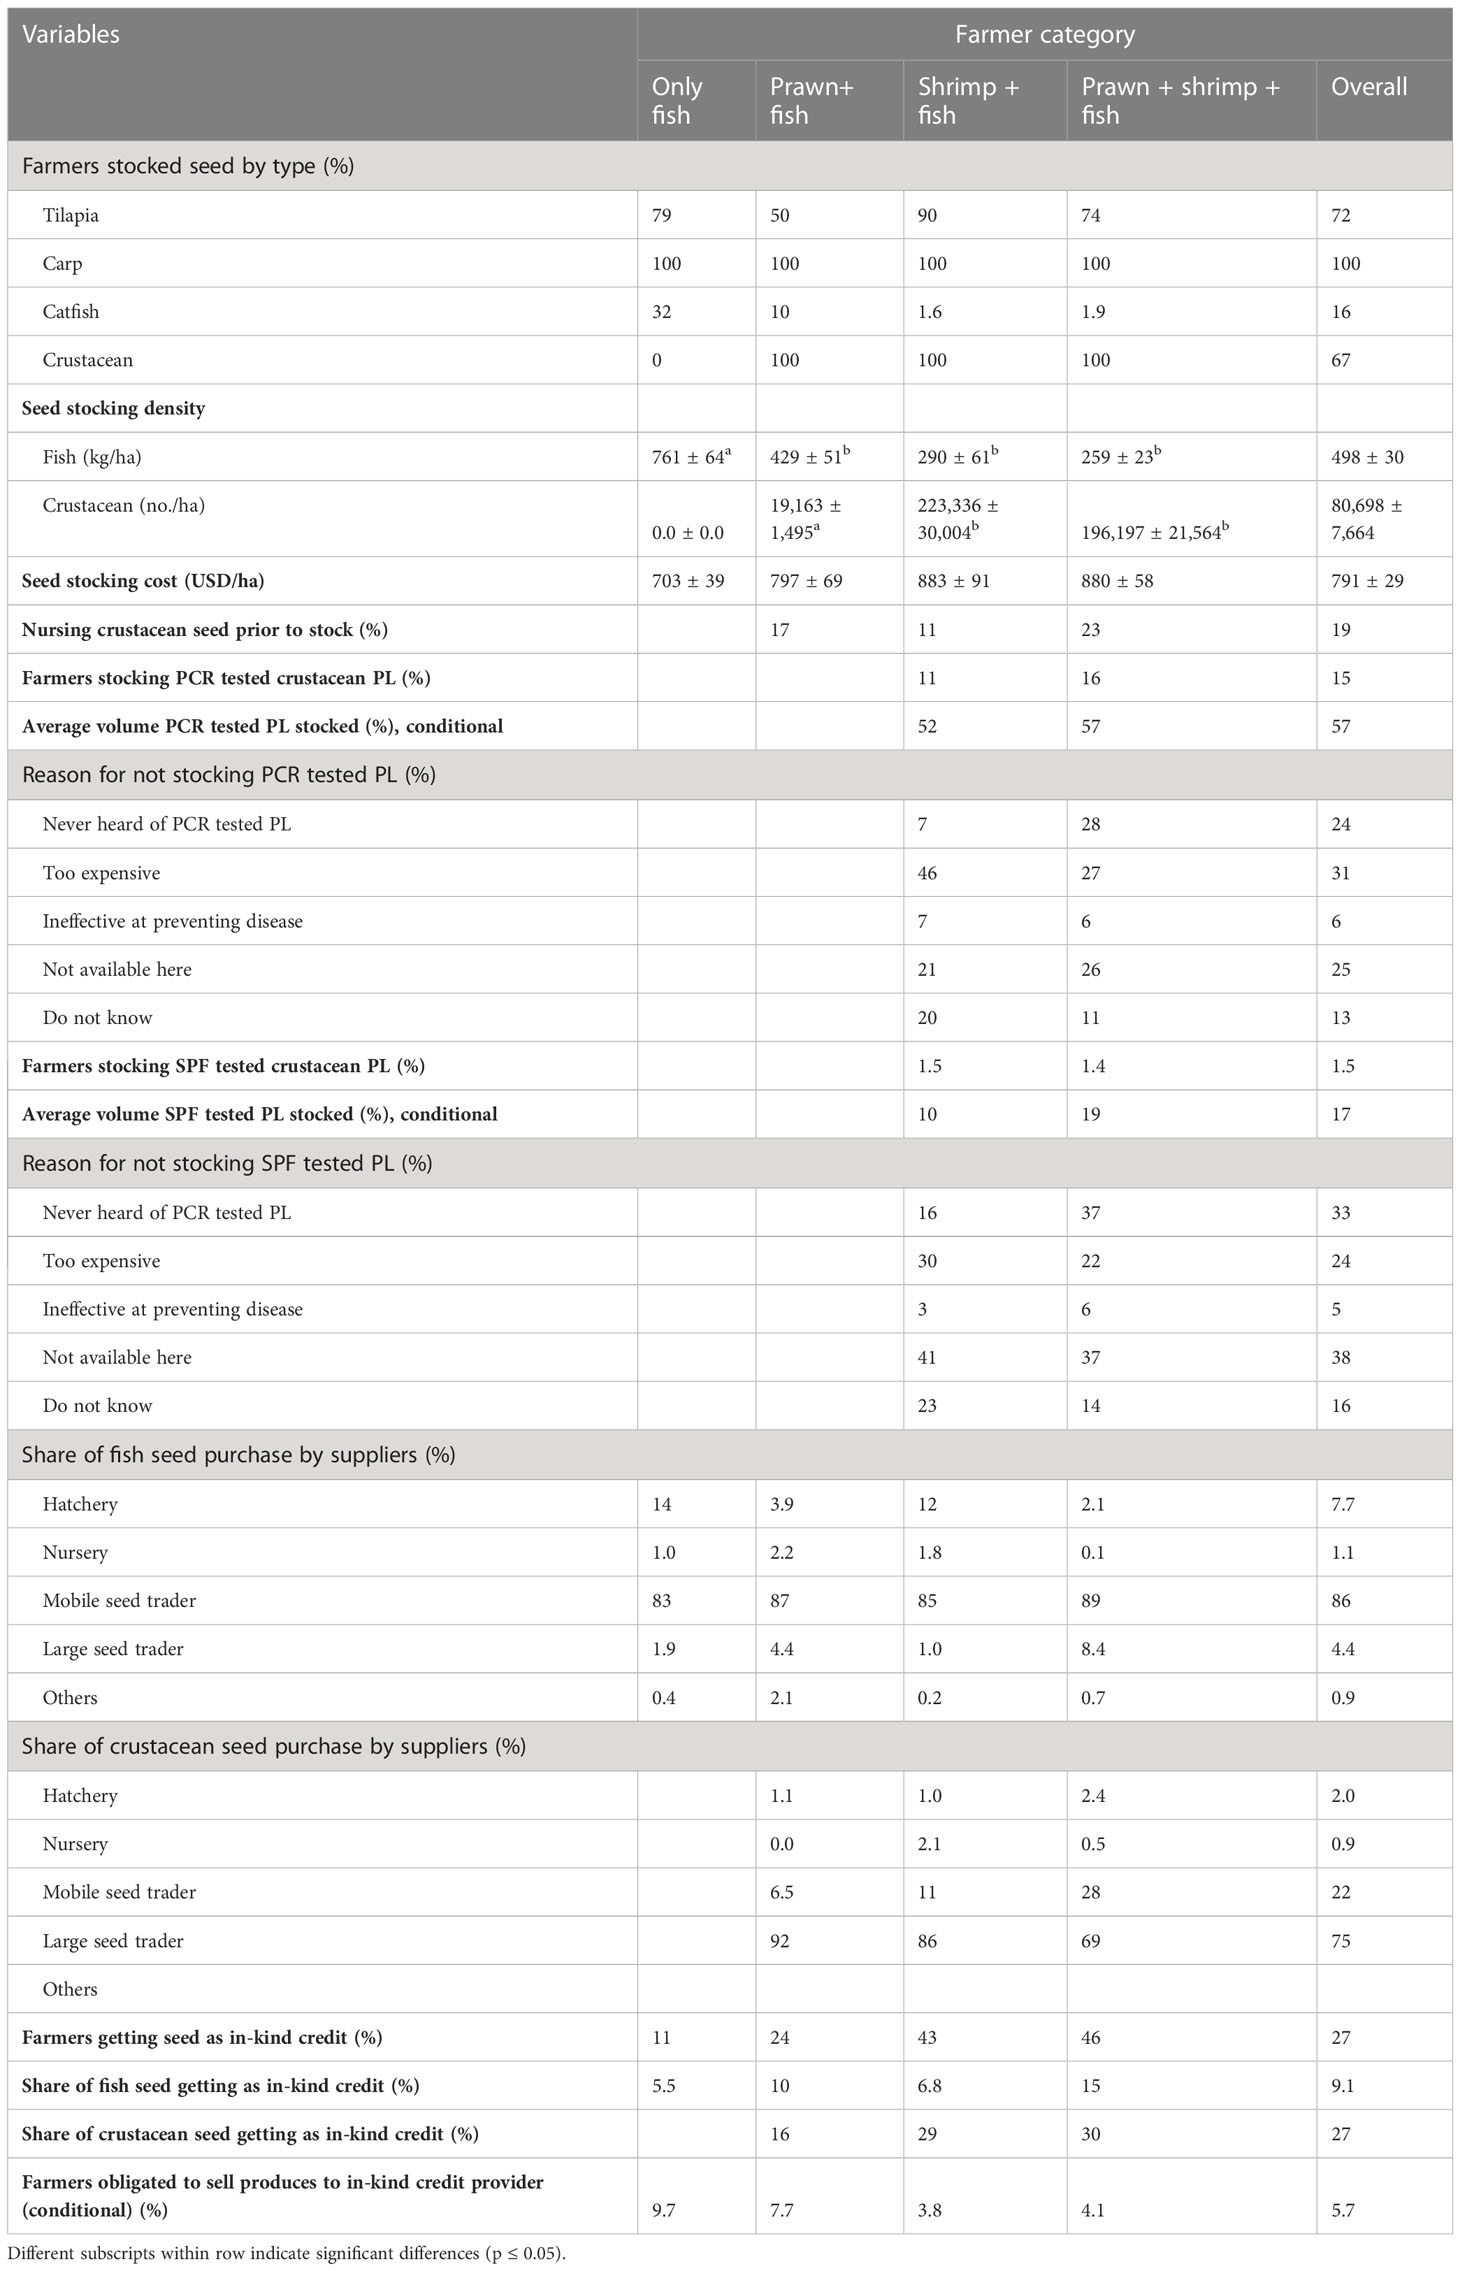
Table 12 Fish seed procurement and use practices reported by farmers.
More than 19% of crustacean farmers nurse PL prior to stock in grow-out farms. The use of PCR and SPF tested shrimp PL is crucial for disease prevention, biosecurity, improved growth and survival rates, quality assurance, and market access. However, only 15% of farmers stocked PCR tested PL, while 1.5% stocked SPF tested PL, with the average volume being 57% and 17% of the total PL stocked, respectively. The reasons given by respondents for not stocking PCR or SPF tested PL included high cost, ineffectiveness at preventing disease, unavailability, and no knowledge of PCR or SPF tested PL.
Most fish seed used by farms (86%) was purchased from mobile seed traders, locally known as patilwala, and the remaining from hatcheries (7.7%), large seed traders (4.4%), nurseries (1.1%), and other sources (0.9%). In contrast, most crustacean seed (75%) was purchased from large seed traders, followed by mobile seed traders (22%), hatcheries (2.0%), and nurseries (0.9%). These findings were consistent with the hatchery surveys, which showed that most fish seed was sold to nursery operators who then sold to farmers through mobile seed traders, while crustacean seed was sold to large seed traders who then sold directly to farmers.
More than one-fourth (27%) of farmers reported having received seed as in-kind credit from traders and the in-kind credit arrangement was more prevalent for crustacean seed (27% of total volume) compared to fish seed (9.5% of total volume). However, only 5.7% of farmers doing so reported being obligated to sell their produce to these traders, suggesting very little use of tied credit by seed traders. Key informant interviews suggested that in some cases, the price of seed purchased as in-kind credit was 3-5% higher than that of seed purchased immediately in cash, but interest was not always charged, based on the relationship between farmers and traders.
4 Conclusion
The hatchery segment of aquaculture value chain in Bangladesh has experienced significant growth in the last decade, with an overall increase in the number of hatcheries and the volume of seed produced. Carp and tiger shrimp were the most commonly produced fish and crustacean species, amounting 67% and 99% of volume, respectively. Hatcheries used a high volume of their matured broodstock annually and replaced them at an average interval of 2.3 years, indicating a level of efficiency in their operation and broodstock management. Around 18% of hatcheries faced disease or water quality problems and reported to loss only 0.7% of total sales value, which is quite low. Hatcheries were family-owned and operated business that created a total 2,491 full time equivalent (FTE) jobs, predominantly for men. The mean annual net profit margin was relatively modest considering the investments, suggesting the existence of competitive seed production and marketing. The overall findings suggest that the hatchery segment of the aquaculture value chain in southern Bangladesh is dynamic, well developed, efficient, and relatively competitive. This contradicts the conventional perception of inefficiency and problems in the hatchery segment in Bangladesh.
Data availability statement
The original contributions presented in the study are included in the article/supplementary material. Further inquiries can be directed to the corresponding author.
Ethics statement
The research design was reviewed by Michigan State University Institutional Review Board (MSU Study ID: STUDY00003689). The study was determined to be exempt from IRB review on July 10, 2020.
Author contributions
HA, BB, MMH and KM-e-J designed research. HA performed research, HA analyzed data. HA and BB wrote paper, MMH, KM-e-J and LI edited paper. All authors contributed to the article and approved the submitted version.
Funding
This research was made possible by the Feed the Future Innovation Lab for Fish, through the United States Agency for International Development (USAID). The Feed the Future Innovation Lab for Fish is managed by Mississippi State University through an award from USAID (Award No. 7200AA18CA00030; M. Lawrence, PI) and provides support to this project (Grant No. 193900.312455.12B; Belton, PI; Haque, PI). This work was also implemented as part of the CGIAR Initiative on Securing the Food Systems of Asian Mega‐Deltas for Climate and Livelihood Resilience (INIT-18), which is carried out with support from funders through their contributions to the CGIAR Trust Fund. (https://www.cgiar.org/funders/). We also grateful to National Science and Technology (NST) fellowship, Bangladesh for providing financial supports to complete field works successfully.
Conflict of interest
The authors declare that the research was conducted in the absence of any commercial or financial relationships that could be construed as a potential conflict of interest.
The authors HA, BB, MMH, KM-e-J declared that they were editorial board members of Frontiers, at the time of submission. This had no impact on the peer review process and the final decision.
Publisher’s note
All claims expressed in this article are solely those of the authors and do not necessarily represent those of their affiliated organizations, or those of the publisher, the editors and the reviewers. Any product that may be evaluated in this article, or claim that may be made by its manufacturer, is not guaranteed or endorsed by the publisher.
Footnotes
- ^ Other carp includes grass carp (Ctenopharyngodon idella), bighead carp (Hypophthalmichthys nobilis), kalibaus (Labeo calbasu) and black carp (Mylopharyngodon piceus).
- ^ A full-time equivalent (FTE) is a unit of measurement used to figure out the number of full-time hours worked by all employees in a business.
References
Ali H., Rahman M. M., Jaman A., Basak S. K., Eltholth M., Murray F. (2022). Economic performance characterization of intensive shrimp (Penaeus monodon) farming systems in Bangladesh. Aquaculture Fish Fisheries 2 (1), 57–70. doi: 10.1002/aff2.29
Anderson J. L., Valderrama D., Jory D. (2019)GOAL 2019 shrimp review. Available at: https://www.globalseafood.org/wp-content/uploads/2019/10/Day1_Jim_Anderson.pdf.
Arulingam I., Nigussie L., Sellamuttu S. S., Debevec L. (2019). “Youth participation in small-scale fisheries, aquaculture and value chains in Africa and the Asia-pacific,” in Program Report: FISH-2019-14(Penang, Malaysia: CGIAR Research Program on Fish Agri-Food Systems) Availbale at: https://hdl.handle.net/10568/108010.
Barrett C. B., Reardon T., Swinnen J., Zilberman D. (2022). Agri-food value chain revolutions in low- and middle-income countries. J. Economic Literature 60 (4), 1316–1377. doi: 10.1257/jel.20201539
BBS (2019). Report on agriculture and rural statistics. agriculture and rural statistics survey (ARSS) project-2017 (Bangladesh: Bangladesh Bureau of Statistics (BBS) Statistics and Informatics Division (SID) Ministry of Planning).
BBS (2022). Consumer price index (CPI), inflation rate and wage rate index (WRI) in Bangladesh Vol. 1207 (Agargoan, Dhaka: National Accounting Wing Bangladesh Bureau of Statistics (BBS) E-27/A), 41.
Belton B. (2012). Culture, social relations and private sector development in the Thai and Vietnamese fish hatchery sectors. Asia Pacific Viewpoint 53 (2), 133–146. doi: 10.1111/j.1467-8373.2012.01487.x
Belton B., Hein A., Htoo K., Kham L. S., Phyoe A. S., Reardon T. (2018). The emerging quiet revolution in myanmar’s aquaculture value chain. Aquaculture 493, 384–394. doi: 10.1016/j.aquaculture.2017.06.028
Belton B., Rosen L., Middleton L., Ghazali S., Mamun A., Shieh J., et al. (2021). COVID-19 impacts and adaptations in Asia and africa’s aquatic food value chains. Mar. Policy 129, 104523. doi: 10.1016/j.marpol.2021.104523
Bhuiyan A. S., Akther S., Aktar N. (2011). Present status and fish seed production of the hatcheries of six upazilas of rajshahi district. Univ. J. zoology Rajshahi Univ. 30, 29–32. doi: 10.3329/ujzru.v30i0.10743
Biswas A., Choudhury M., Farid M. A., Rahman M. A., Rahman M. A. (2021). Induced breeding of freshwater fishes and cost benefit analysis of a selected fish hatchery in jashore, Bangladesh. Annu. Res. Rev. Biol. 36 (11), 15–25. doi: 10.9734/arrb/2021/v36i1130446
Bremer S., Haque M. M., Haugen A. S., Kaiser M. (2016). Inclusive governance of aquaculture value-chains: Co-producing sustainability standards for Bangladeshi shrimp and prawns. Ocean & Coastal Management 131, 13–24. doi: 10.1016/j.ocecoaman.2016.07.009
Briggs M. (2013). Analysis of freshwater prawn hatchery problems in Bangladesh (Dhaka, Bangladesh: Report to USAID funded Feed the Future Aquaculture (FtF AQ) project of the WorldFish Center, Bangladesh and South Asia Office).
Bui T. M., Phan L. T., Ingram B. A., Nguyen T. T. T., Gooley G. J., Nguyen H. V., et al. (2010). Seed production practices of striped catfish, Pangasianodon hypophthalmus in the Mekong delta region, Vietnam. Aquaculture 306, 92–100. doi: 10.1016/j.aquaculture.2010.06.016
Bui T. M., Phuong N. T., Nguyen G. H., De Silva S. S. (2013). Fry and fingerling transportation in the striped catfish, Pangasianodon hypophthalmus, farming sector, Mekong delta, Vietnam: a pivotal link in the production chain. Aquaculture 388-391, 70–75. doi: 10.1016/j.aquaculture.2013.01.007
Bush S., Belton B., Little D. C., Islam M. S. (2019). Emerging trends in aquaculture value chain research. Aquaculture 498, 428–434. doi: 10.1016/j.aquaculture.2018.08.077
Debnath S., Hossen S., Sharker M. R., Ghosh A., Ferdous A., Zannat L. K., et al. (2020). Fish seed producing hatcheries in southern Bangladesh: an overview. Middle-East J. Sci. Res. 28 (3), 199–206. Available at: https://idosi.org/mejsr/mejsr28(3)20/6.pdf.
DoF (2022). Yearbook of fisheries statistics of Bangladesh 2020-21 Vol. 38 (Bangladesh: Fisheries Resources Survey System (FRSS), Department of Fisheries), 1438.
Hamid F., Haque M. M. (2012). “Assessing the impacts of large fish hatchery on employment generation.” in Fifth Fisheries Conference & Research Fair 2012, BangladeshAgricultural Research Council, Dhaka, Bangladesh.
Haque M. M, Little D. C., Barman B. K., Wahab M. A., Telfer T. C. (2012). Impacts of decentralized fish fingerling production in irrigated rice fields in Northwest Bangladesh. Aquaculture Research 45(4), 655–674. doi: 10.1111/are.12000
Haque M. M. (2007). Decentralised Fish Seed Networks in Northwest Bangladesh: Impacts on Rural Livelihoods. [Dissertation thesis]. University of Stirling, UK. pp. 491. Available at: http://hdl.handle.net/1893/301.
Haque M. M., Alam M. M., Hoque M. S., Hasan N. A., Nielsen M., Hossain M. I., et al (2021). Can Bangladeshi pangasius farmers comply with the requirements of aquaculture certification? Aquaculture Reports 21, 100811. doi: 10.1016/j.aqrep.2021.100811
Hasan M. R., Arthur J. R. (2015). Aquaculture 775 seed and feed production and management in Bangladesh – status, issues and constraints (Rome: Food and Agriculture Organization of the United Nation). Available at: https://www.fao.org/3/i4945e/i4945e.pdf.
Hemal S., Uddin S. M., Uddin M. S., Majumdar B. C., Rasul M. G., Alam M. T. (2017). Present status and problems of fish seed marketing in sylhet district, Bangladesh. Research in Agriculture Livestock and Fisheries 4 (1), 45–54. doi: 10.3329/ralf.v4i1.32405
Hernandez R., Belton B., Reardon T., Hub C., Zhang X., Ahmed A. (2018). The quiet revolution in the aquaculture value chain in Bangladesh. Aquaculture 493, 456–468. doi: 10.1016/j.aquaculture.2017.06.006
Islam M. S., Asif A. A., Sarker B., Satter A., Ahmed M., Rahman M., et al. (2017b). Fry production and its marketing system of north-West fisheries extension project at parbatipur, dinajpur, Bangladesh. Asian J. Med. Biol. Res. 3 (3), 368–378. doi: 10.3329/ajmbr.v3i3.34527
Islam M. A., Bappa S. B., Dey B. K., Hasan-Uj-Jaman M., Ali M. M., Rahman M. A. (2015). Major technical and disease problems of the hatchery operation in jessore district, bangladesh. Eco-friendly Agric. J. 8 (05), 51–55.
Islam M. S., Hossain M. S., Hasan M. T., Hossain M. B., Hossain M. A. (2017a). Studies on supply and marketing channel of fish seeds and observing their condition factors in Chasra market in jessore district, Bangladesh. Int. J. Fisheries Aquat. Stud. 5 (2), 394–404. Available at: https://www.fisheriesjournal.com/archives/2017/vol5issue2/PartF/4-6-102-132.pdf.
Jahan K. M., Belton B., Ali H., Dhar G. C., Ara I. (2015). Aquaculture technologies in Bangladesh: an assessment of technical and economic performance and producer behavior. WorldFish Penang Malaysia. Program Rep. 2015-52, 123. Available at: https://hdl.handle.net/20.500.12348/83.
Jamabo N. A., Ukwe I. O. K., Amachree D. (2019). Growth assessment and microbial flora presence in African catfish (Clarias gariepinus) larvae fed live and commercial feeds. Int. J. Sci. 8 (7), 1–6. doi: 10.18483/ijSci.2058
Joffre O. M., Freed S., Bernhardt J., Teoh S. J., Sambath S., Belton B. (2021). Assessing the potential for sustainable aquaculture development in Cambodia. Front. Sustain. Food Syst. 5:704320. doi: 10.3389/fsufs.2021.704320
Karim M., Keus H. J., Ullah M. H., Kassam L., Phillips M., Beveridge M. (2016). Investing in carp seed quality improvements in homestead aquaculture: lessons from Bangladesh. Aquaculture 453, 19–30. doi: 10.1016/j.aquaculture.2015.11.027
Khanom D. A., Sultana N., Aktar M. R., Shikha S., Jewel M. A. S. (2020). Broodstock management and seed production at the hatcheries in rajshahi region of Bangladesh. Bangladesh J. Agric. Life Sci. 01 (1), 33–39. Available at: http://dept.ru.ac.bd/bjals/sites/default/files/abstract_pdf/khanom.pdf.
Lewis D. J., Wood G. W., Gregory R. (1996). Trading the silver seed: local knowledge and market moralities in aquacultural development (UK: Intermediate Technology Publications. London).
Liverpool-Tasie L. S. O., Wineman A., Young S., Tambo J., Vargas C., Reardon T., et al. (2020). A scoping review of market links between value chain actors and small-scale producers in developing regions. Nat. Sustainability 3, 799–808. doi: 10.1038/s41893-020-00621-2
Nasr-Allah A. M., Dickson M. W., Al-Kenawy D. A., Fathi M., El-Naggar G. O., Azazy G. E., et al. (2014). Value chain analysis of Egyptian fish seed production. 4th Conference of Central Laboratory for Aquaculture Research, 351–372. Available at: https://hdl.handle.net/20.500.12348/4290.
Reardon T., Chen K. Z., Minten B., Adriano L. (2012). The quiet revolution in staple food value chains in Asia: enter the dragon, the elephant, and the tiger (Mandaluyong City, Philippines: Asian Development Bank).
Sabbir W., Nusrat M. N., Shaha B. K., Ghosh A. K., Islam M. R., Mahmud S. M. A. (2010). Present status of fish fry production and trade at chachra in jessore (Bangladesh: Khulna University Studies) 10 (1 & 2), 153–160.
Sabur S. A., Palash M. S., Lina H. N., Haque F. I. (2010). Profitability, marketing, and price behavior of aquaculture fish fry and feed inputs in Bangladesh J. World Aquac. Soc. 41 (4), 519–532. doi: 10.1111/j.1749-7345.2010.00392.x
Saengnoree A., Lebel L. (2003) Experience, knowledge and the technology choices of shrimp farmers in Thailand and Vietnam. Available at: http://agris.fao.org/agris-search/search.do?recordID=TH2005001877.
Sarwer R. H. (2021). “Market assessment and business analysis of carp feed in Northwest Bangladesh,” in A report submitted to WorldFish(House 335/A, Road 114, Gulshan-2, Dhaka-1212, Bangladesh).
Shamsuzzaman M. M., Mozumder M. M. H., Mitu S. J., Ahamad A. F., Bhyuian M. S. (2020). The economic contribution of fish and fish trade in Bangladesh. Aquaculture Fisheries 5, 174–181. doi: 10.1016/j.aaf.2020.01.001
Shikuku K. M., Tran N., Joffre O. M., Islam A. H. M. S., Barman B. K., Ali S., et al. (2021). Lock-ins to the dissemination of genetically improved fish seeds. Agric. Syst. 188, 103042. doi: 10.1016/j.agsy.2020.103042
Shoko A. P., Limbu S. M., Ulotu E. E., Shayo S. D., Silas M. O., Chimatiro S. K., et al. Fish seed and feed value chains analysis and their critical factors for aquaculture development in Tanzania. Aquaculture Fish and Fisheries 3 (1), 35–50. doi: 10.1002/aff2.84
Siddika T., Adhikary R. K., Hasan-Uj-Jaman M., Khondoker S., Tabassum N., Zaman M. F. U. (2016). Socio economic conditions of the hatchery labors in chanchra area of jessore district in Bangladesh. Agriculture, Forestry and Fisheries 5 (3), 30–36. doi: 10.11648/j.aff.20160503.11
Uppanunchai A., Apirumanekul C., Lebel L. (2015). Planning for production of freshwater fish fry in a variable climate in northern Thailand. Environ. Manage. 56, 859–873. doi: 10.1007/s00267-015-0547-4
Wang Q., Rossignoli C. M., Dompreh E. B., Su J., Ali S. A., Karim M., et al. (2023). Sustainable intensification of small-scale aquaculture production in Myanmar through diversification and better management practices. Environ. Res. Lett. 18, 015002. doi: 10.1088/1748-9326/acab16
World Economics (2022) Bangladesh's social factors. Available at: https://www.worldeconomics.com/ESG/Social/Bangladesh.aspx.
Keywords: structure, conduct, performance, hatchery, Bangladesh
Citation: Ali H, Belton B, Haque MM, Murshed-e-Jahan K and Ignowski L (2023) The structure, conduct, and performance of the hatchery segment of the aquaculture value chain in Bangladesh. Front. Aquac. 2:1219458. doi: 10.3389/faquc.2023.1219458
Received: 09 May 2023; Accepted: 27 June 2023;
Published: 18 July 2023.
Edited by:
Neaz A. Hasan, Bangabandhu Sheikh Mujibur Rahman Science and Technology University, BangladeshReviewed by:
Mahmoud Eltholth, University of Edinburgh, United KingdomMd. Mehedi Alam, Khulna Agricultural University, Khulna, Bangladesh
Copyright © 2023 Ali, Belton, Haque, Murshed-e-Jahan and Ignowski. This is an open-access article distributed under the terms of the Creative Commons Attribution License (CC BY). The use, distribution or reproduction in other forums is permitted, provided the original author(s) and the copyright owner(s) are credited and that the original publication in this journal is cited, in accordance with accepted academic practice. No use, distribution or reproduction is permitted which does not comply with these terms.
*Correspondence: Hazrat Ali, aC5hbGlAY2dpYXIub3Jn