Abstract
Since 2011, the coasts of Mexico have experienced massive Sargassum invasions, resulting in substantial economic losses in tourism and fisheries. Circular economy approaches provide an opportunity to valorize this abundant biomass by extracting bioactive compounds for pharmaceutical, food, and feed applications. In this study, Sargassum collected in Cancún was subjected to hydrothermal treatment at 100–200°C, producing carbohydrate rich solid and aqueous fractions. These fractions were subsequently fermented with Kluyveromyces marxianus to evaluate their antioxidant potential. Fermentation conducted over 24–72 h showed that the aqueous fraction fermented for 48 h exhibited the highest radical scavenging activity (~26%), significantly exceeding that of the control (~11%). The results indicate that hydrothermally pretreated Sargassum is a promising substrate for K. marxianus, capable of generating bioactive compounds with antioxidant properties. Importantly, this study is the first to report the use of Sargassum as a substrate for K. marxianus. These findings suggest potential applications for incorporating fermented Sargassum into livestock and aquaculture diets to enhance animal health and growth, while indirectly improving the nutritional quality and safety of animal derived products for human consumption.
1 Introduction
In 2011, the coasts of the Gulf of Mexico and the Caribbean experienced an unprecedented and widespread influx of Sargassum biomass, largely attributed to climate change and altered oceanographic and meteorological patterns (Louime et al., 2017). To date, the excessive arrival of Sargassum continues to pose a major challenge for Mexico, generating substantial economic losses in the tourism and fishing sectors, with an estimated 210 million dollars invested in coastal cleanup activities (Saldarriaga-Hernandez et al., 2021). Moreover, the decomposition of this biomass in shallow waters releases toxic gases and reduces dissolved oxygen levels, leading to anoxia and the subsequent death of marine organisms (Saldarriaga-Hernandez et al., 2021). These emitted gases also represent a health risk for coastal populations, as chronic exposure has been associated with neurological, pulmonary, and cardiovascular disorders, including vestibular dysfunction and memory impairment (Saldarriaga-Hernandez et al., 2021). Consequently, the Sargassum phenomenon constitutes a critical environmental, economic, and social problem for the region.
Given its abundance, accessibility, and renewable nature, Sargassum has attracted interest as a feedstock for circular economy strategies focused on transforming this problematic biomass into value-added products. This macroalga contains high levels of minerals, vitamins, proteins, and carotenoids, as well as numerous bioactive compounds—polysaccharides, tannins, flavonoids, sulfated polyphenols, phenolics, and β-carotene. Among these, polysaccharides represent the most abundant fraction of brown algae (50–70%) and constitute a promising substrate for microorganisms of interest in the animal feed industry (Argüello-Guevara and Molina-Poveda, 2013).
One such microorganism is Kluyveromyces marxianus, a yeast valued for its rapid growth rate, thermotolerance, and ability to synthesize antioxidant and other bioactive metabolites. When included in livestock and aquaculture feed, K. marxianus has been associated with improved physiological performance, enhanced immune function, reduced plasma cholesterol levels, lower disease incidence, and decreased dependence on antibiotic treatments (Øverland et al., 2013; Xie et al., 2015; Wang et al., 2017; Bilal et al., 2022; Rossi and Dell’Anno, 2024). Thus, incorporating this yeast into the diets of animals destined for human consumption may contribute to obtaining products with improved nutritional profiles and reduced antibiotic residues, thereby mitigating the development of antimicrobial resistance.
However, the resistant structure of Sargassum limits the accessibility of its polysaccharides and other nutritionally relevant compounds, reducing its direct suitability as a microbial substrate (Loaiza et al., 2022). Therefore, pretreatment strategies are necessary to depolymerize its complex matrix and increase the release of fermentable sugars and bioactive molecules. In this regard, hydrothermal processing has emerged as a promising, environmentally friendly alternative. This method employs elevated temperatures and pressures to modify the physicochemical properties of water, enhancing hydrolysis and promoting the extraction of valuable compounds from algal biomass (Ruiz et al., 2017; Morales-Contreras et al., 2022; Fonseca et al., 2023).
Therefore, the objective of this study was to enhance the availability of glucose in Sargassum biomass collected from the coasts of Cancún, Quintana Roo, Mexico, through hydrothermal pretreatment at temperatures ranging from 100 to 200°C. The resulting solid and aqueous fractions, characterized by increased carbohydrate content, were recovered and evaluated as potential substrates for the growth of K. marxianus. Fermentations were carried out over incubation periods of 24–72 h, and the antioxidant activity of the resulting cultures was assessed.
This study is novel in that the use of Sargassum derived substrates for the cultivation of K. marxianus has not previously been reported, providing new insights into the valorization of this invasive biomass for biotechnological applications.
2 Materials and methods
2.1 Collection of Sargassum sp. and flour preparation
Sargassum sp. was collected from the beach of Quintana Roo, Mexico (geographic position: 20°58´19´´N 86°49´47´´W). The samples were cleaned with tap water to remove impurities in the biomass, such as sand, plastic, soil, among others. Subsequently, they were filtered using a Nalgene ® filter holder (Waltham, Massachusetts, United States) with a funnel and a TECNAL® TE-0581 pump (Sao Paulo, Brazil). A 10-50 µm filter was used in the process. The biomass was dried in a SHEL LAB® SGO3 (Cornelius, Oregon, United States) for 24 hours at 60°C. The Sargassum flour was obtained after a pulverization process using a Waring Pro™ mixer (Newark, New Jersey, USA) and sifted through a 25-mesh sieve.
2.2 Hydrothermal treatment
Fifty grams of Sargassum flour were subjected to hydrothermal treatment in a stirred Parr reactor (Parr Instrument Company®, Moline, Illinois, USA) at temperatures ranging from 100 to 200°C and an agitation speed of 200 rpm (Table 1) for a residence time of 50 min. After processing, the reaction mixture was vacuum filtered to separate the liquid and solid fractions. The aqueous extract was stored at 4°C, whereas the solid biomass was dried in an oven at 60°C for 24 h (Loaiza et al., 2022).
Table 1
| Treatment | Temperature (°C) | Pressure (bar) | Time (min) | Agitation (rpm) |
|---|---|---|---|---|
| T0 | --- | --- | --- | --- |
| T1 | 100 | 3.44 | 50 | 200 |
| T2 | 150 | 3.723 | 50 | 200 |
| T3 | 200 | 11.7211 | 50 | 200 |
Hydrothermal pretreatment conditions.
T0, Untreated Sargassum biomass (control); T1, Sargassum biomass processed at 100°C; T2, Sargassum biomass processed at 150°C; T3, Sargassum biomass processed at 200°C.
2.3 Chemical characterization
2.3.1 Ash content
Ash content was determined according to the method described by Van Wychen and Laurens (2013) by incinerating 1 g of Sargassum flour before and after hydrothermal treatment. Incineration was carried out at 550°C for 2 h in a Thermolyne™ tabletop muffle furnace (Marshalltown, Iowa, USA). After completion, the ash residue was quantified using Equation 1, and the results were expressed as percent ash (% ash) (Van Wychen and Laurens, 2013).
2.3.2 Total carbohydrate content
The carbohydrate content of Sargassum flour was determined using the acid hydrolysis method described by Loaiza et al. (2022). Briefly, 500 mg of Sargassum flour were mixed with 15 mL of 77% sulfuric acid and stirred at 600 rpm and 35°C for 60 min using a Thermo Scientific™ Cimarec+™ stirred hotplate (Waltham, Massachusetts, USA). The acid concentration was then reduced to 4% by adding 150 mL of water, and the mixture was autoclaved at 121°C and 15 psi for 15 min. The hydrolysate was filtered through 0.45 µm Thermo Scientific™ syringe filters (Waltham, Massachusetts, USA) and stored at –20°C until analysis (Loaiza et al., 2022).
Carbohydrate quantification was performed following López-Legarda et al. (2017). Measurements were conducted in a Corning® Costar® 96 well plate (New York, USA) using a Thermo Scientific™ Multiskan SkyHigh UV-Vis spectrophotometer (Waltham, Massachusetts, USA). A glucose standard curve (y = 0.2012x – 0.0701, R² = 0.988) with a concentration range of 0–200 mg mL−1 was used for calibration. All samples were analyzed in triplicate, and results were expressed as mg mL−1 (López-Legarda et al., 2017).
2.3.3 Total protein content
Proteins quantification was assisted by the Lowry assay. The lowry assay was followed according to the protocol established by Lowry et al. (1951). For this, a calibration curve was made from 0 to 1 mg mL-1. 40 µL of the sample and the standard were used and mixed with 200 µL of Lowry reactive reagent (Thermo Scientific™) in a 96 well plate. The plate was incubated for 10 minutes at room temperature, and after the incubation, 20 µL of 1X Folin-Ciocalteu Thermo Scientific™ (Waltham, Massachusetts, United States) was added to each well of a 96 well plate and incubated for 30 minutes. The absorbance was measured Thermo Scientific™ Multiskan SkyHigh (Waltham, Massachusetts, United States) at a wavelength of 750 nm, and using the BSA standard curve (), the results were expressed in mg mL-1 (Lowry et al., 1951).
2.3.4 Total phenolic content
Phenolic content was measured following the Folin-Ciocalteu protocol with modifications and adaptations for a 96 well plate. The method started with the preparation of sodium carbonate CTR® Scientific (Monterrey, Nuevo Léon, México) at 15% w v-1 and a standard curve of phloroglucinol (PEG) Merck Sigma Aldrich® (Darmstadt, Hessen, Germany) in the concentration range from 0 mg mL-1 to 1 mg mL-1. Using a 96 well plate, it was charged with a mix of 70 µL of sample, 190 µL MiliQ Water Merck Millipore® (Billerica, Massachusetts, United States), 340 µL sodium carbonate and 40 µL of Folin-Ciocalteu reagent (Darmstadt, Hessen, Germany), the plate was incubated at 50°C for 6 minutes. The samples were measured with a UV-Vis spectrophotometer, Thermo Scientific™ Multiskan SkyHigh (Waltham, Massachusetts, United States) at a wavelength of 730 nm. The quantification was performed with the standard curve (), and the results were expressed in mg mL-1 (Singleton and Rossi, 1965).
2.3.5 Antioxidant activity
Based on the DPPH assay described by Brand-Williams et al. (1995), a 2,2-diphenyl-1-picrylhydrazyl (DPPH) solution was prepared by dissolving 2.5 mg of DPPH (Sigma-Aldrich®, Darmstadt, Hessen, Germany) in 50 mL of absolute ethanol (DEQ S.A. de C.V., Mexico City, Mexico). The solution was stirred and kept in the dark until use. For the standard calibration curve, Trolox (Sigma-Aldrich®, Darmstadt, Hessen, Germany) solutions ranging from 0.005 to 0.5 mg mL−1 were prepared, yielding the regression equation y = −0.1733x + 1.0941 (R² = 0.9951).
In a 96-well microplate, 20 µL of each sample was mixed with 180 µL of the DPPH solution. The plate was incubated in the dark for 30 min, after which absorbance was measured at 540 nm using a UV–Vis spectrophotometer Thermo Scientific™ Multiskan SkyHigh (Waltham, Massachusetts, United States). The results were calculated according to Equation 2, using the DPPH solution prepared in ethanol as the control, and the values were expressed in antioxidant activity % (Brand-Williams et al., 1995).
2.4 Fermentation
For fermentation experiments, K. marxianus, provided by the Institute of Biotechnology of the Faculty of Biology at the Autonomous University of Nuevo León, was used. The yeast was cultivated in a broth containing peptone, 2% dextrose, and 1% yeast extract at pH 4.8 for 12 h at 28°C with agitation at 120 rpm (Herrera et al., 2017).
The solid and aqueous phases of T2 (150°C) used for fermentation were irradiated with UV-C light (254 nm) for 30 min, and all procedures were carried out under aseptic conditions in a laminar flow hood. The untreated biomass (T0) and the solid phase obtained from T2 were moistened with sterile water at a pH 4.5 to achieve a moisture content of 70%. Subsequently, 108 cells were inoculated into 1 g of untreated Sargassum (T0) and into 1 g of the solid phase of the treated biomass T2 in sterile Petri dishes, maintaining a moisture content of 70% and an incubation temperature of 28°C.
For the liquid phase, 108 cells were inoculated into 1 mL of the treated liquid phase from T2, adjusted to pH 4.5, in sterile 15 mL tubes. Fermentation was conducted for 24–72 hours, and all experiments were performed in triplicate using a Thermo Scientific™ HERATHERM microbiological incubator (Waltham, Massachusetts, USA) (Herrera et al., 2017).
2.5 Statistical analysis
All tests were performed in triplicate, and the results are presented as the mean and ± standard deviation of the replicates. To determine the existence of significant differences between the different treatments analyzed, a one-way analysis of variance (ANOVA) was performed using the Tukey test, with at least α = 0.05. The ANOVA was performed in Minitab Statistical Software (Minitab Inc, USA).
3 Results
3.1 Yields of pretreated Sargassum biomass
The initial and final weights of the Sargassum biomass were measured to calculate the corresponding yields after being subjected to three different hydrothermal treatments: T0 (untreated Sargassum biomass), T1 (100°C at 3.44 bar), T2 (150°C at 3.723 bar), and T3 (200°C at 11.7211 bar) (Table 1). Statistically significant differences (p ≤ 0.05) were observed among the treatments, with the solid-phase yield decreasing from 89.8% to 36.2% as temperature and pressure increased (Table 2).
Table 2
| Treatment | Initial weight (grams) | Final weight (grams) | Yield (%) |
|---|---|---|---|
| T1 | 50.147 ± 0.025 | 44.217 ± 0.675* | 89.8 ± 1.350* |
| T2 | 50.113 ± 0.076 | 34.657 ± 0.1914* | 69.74 ± 0.382* |
| T3 | 50.137 ± 0.023 | 18.0667 ± 0.252* | 36.2 ± 0.503* |
Yields obtained from Sargassum biomass after hydrothermal pretreatment.
T1, Sargassum biomass processed at 100°C; T2, Sargassum biomass processed at 150°C; T3, Sargassum biomass processed at 200°C; *, statistical significance (p ≤ 0.05).
3.2 Chemical composition of treated and untreated Sargassum biomass
After hydrothermal treatment, the biomass subjected to different temperatures and pressures (T1, T2, and T3) was filtered to obtain two phases: solid and aqueous, which were subsequently characterized. The chemical composition of the untreated Sargassum (T0) and of both phases obtained from T1, T2, and T3 was determined to evaluate the ash content and the concentrations of carbohydrates, proteins, and phenolic compounds. One-way ANOVA, followed by Tukey’s post-hoc test, was performed to determine statistically significant differences between the treatments within the same phase and between compounds in the solid and aqueous phases under different treatment conditions. The results are presented in Table 3.
Table 3
| Sample type | Treatment | Ash (%) | Carbohydrates (mg GEQ g-1 DW) | Proteins (mg g-1 DW) | Phenols (mg PEQ g-1 DW) |
|---|---|---|---|---|---|
| Solid phase | T0 | 17.09 ± 1.31 Aa | 411.26 ± 14.08 Aa | 2.27 ± 0.15 Aa | 0.82 ± 0.21 Aa |
| T1 | 15.49 ± 1.09 Aa | 288.55 ± 17.57 Bb | 1.33 ± 0.35 Bb | 0.79 ± 0.03 Aa | |
| T2 | 15.40 ± 0.314 Aa | 301.11 ± 13.39 Bb | 3.84 ± 0.23 Cc | 1.79 ± 0.23 Bb | |
| T3 | 17.15 ± 0.55 Aa | 116.09 ± 12.38 Cc | 11.11 ± 0.44 Dd | 3.26 ± 0.38 Cc | |
| Aqueous phase | T1 | 0.29 ± 0.701 Ab | 151.49 ± 6.71 Ac | 0.420 ± 0.02 Ae | 0.177 ± 0.03 Ad |
| T2 | 0.58 ± 0.99 Ab | 623.47 ± 10.87 Bd | 1.14 ± 0.08 Bbe | 0.50 ± 0.154 ABad | |
| T3 | 0.63 ± 0.20 Ab | 669.60 ± 32.77 Bd | 2.32 ± 0.46 Ca | 0.67 ± 0.05 Bad |
Chemical composition of Sargassum.
T0, Untreated Sargassum biomass; T1, Sargassum biomass processed at 100°C; T2, Sargassum biomass processed at 150°C; T3, Sargassum biomass processed at 200°C, Different uppercase letters indicate statistically significant differences (p ≤ 0.05) among treatments within the same phase, whereas different lowercase letters denote statistically significant differences between phases across treatments.
Regarding ash content, the solid phase exhibited values ranging from 15.40% to 17.15%, whereas the aqueous phase showed much lower values, from 0.29% to 0.63%, with no significant differences among treatments. However, significant differences were observed between phases, with the solid fraction consistently presenting higher ash levels. An increase in ash content was also noted at the highest treatment temperature (200°C).
In terms of carbohydrate content, the solid phase showed significant differences between treatments, with T0 exhibiting the highest value (411.26 ± 14.08 mg GEQ g−1 DW) and T3 the lowest (116.09 ± 12.38 mg GEQ g−1 DW). In the aqueous phase, carbohydrate content was higher in T3 (669.60 ± 32.77 mg GEQ g−1 DW) and T2 (623.47 ± 10.87 mg GEQ g−1 DW) compared to T1, which showed the lowest content (151.49 ± 6.71 mg GEQ g−1 DW). In summary, the aqueous phase exhibited the highest carbohydrate content, particularly in T2 and T3, with significant differences compared to all solid phase treatments (T0–T3) and T1 of the aqueous phase.
The protein content was higher in the solid phase of T3 (11.11 ± 0.44 mg g−1 DW), showing statistically significant differences compared to the control (T0) and the other treatments in both the solid (T1 and T2) and aqueous (T1, T2, and T3) phases, which exhibited protein concentrations ranging from 0.42 to 3.84 mg g−1 DW.
Similarly, the phenolic compound content was significantly higher in the solid phase of T3 (3.26 ± 0.38 mg GAE g−1 DW) compared to the control and the other treatments in both phases. In contrast, the lowest value was observed in the aqueous phase of T1 (0.177 ± 0.03 mg GAE g−1 DW).
3.3 Antioxidant activity of treated and untreated Sargassum biomass
The radical scavenging activity in T0 and in the solid and aqueous phases obtained from treated biomass (T1, T2, and T3) is illustrated in Figure 1. The data indicate that the aqueous and solid phases T0, T1, and T2 treatments exhibit relatively low and statistically similar radical scavenging activities, with values around 10-20%. In contrast, the solid and aqueous phases of treatment T3 show a significant increase in radical scavenging activity, reaching approximately 70% in the solid phase and almost 80% in the aqueous phase.
Figure 1
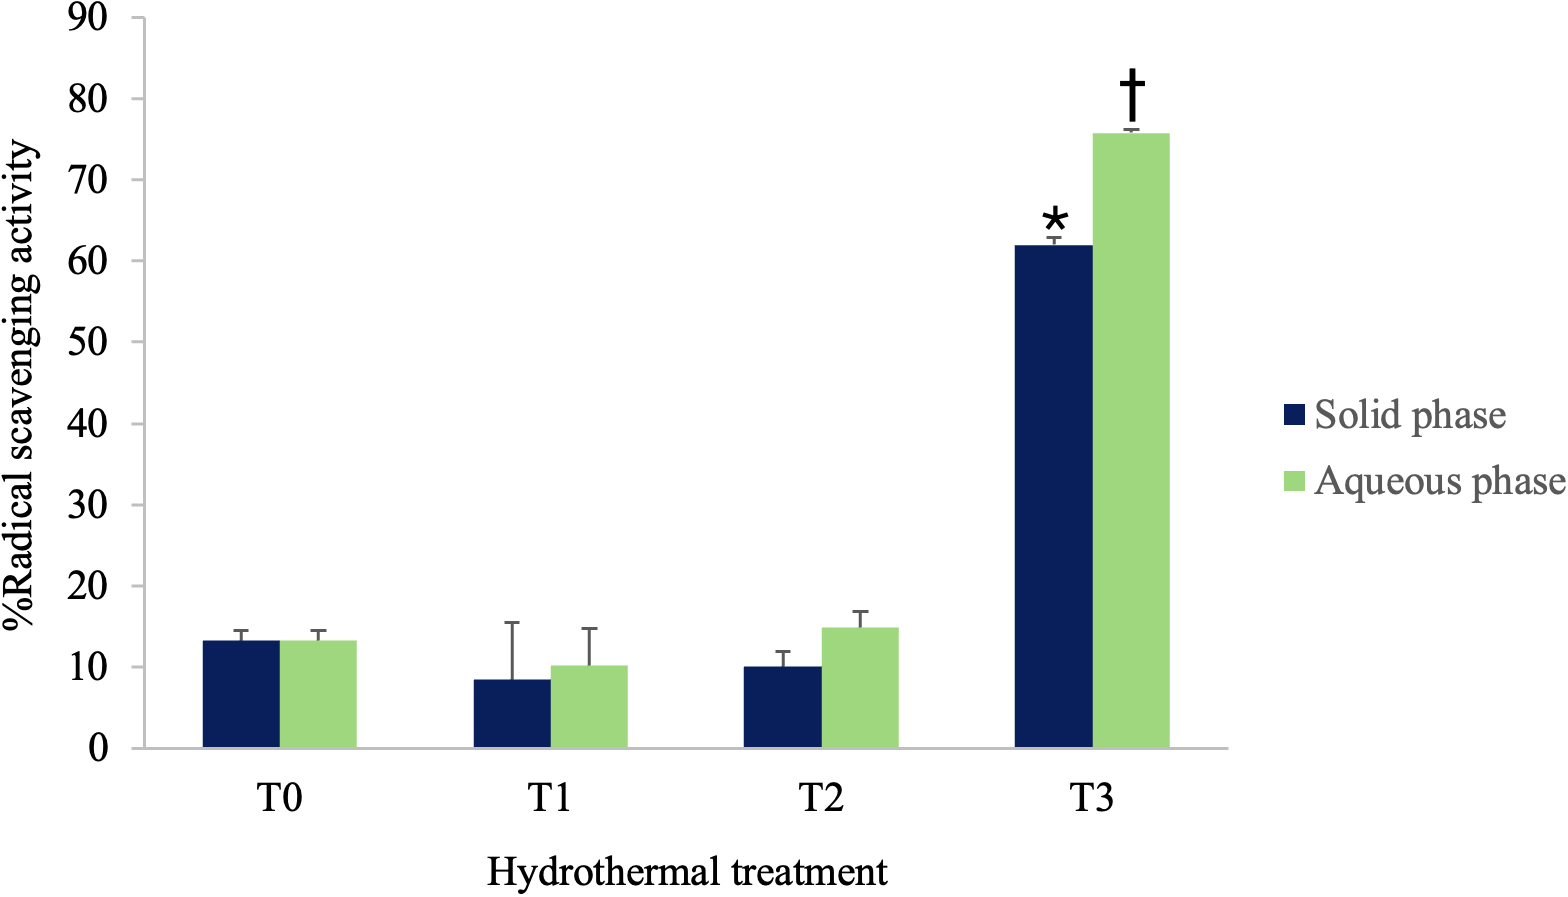
The radical scavenging activity of untreated biomass T0 and of the solid and aqueous phases obtained from treated biomass (T1, T2, and T3) is shown. Abbreviations: T0 = Untreated Sargassum biomass, T1 = Sargassum biomass processed at 100°C, T2 = Sargassum biomass processed at 150°C, T3 = Sargassum biomass processed at 200°C. Different symbols indicate statistically significant differences (p ≤ 0.05).
3.4 Antioxidant activity of the fermented phases
To carry out fermentation over different time periods (24, 48, and 72 hours), the T2 biomass phases were selected due to their higher carbohydrate content in both the solid and aqueous phases. Subsequently, the free radical scavenging activity was evaluated (Table 4). The unfermented T0 biomass, as well as the solid and aqueous phases of T2, were used as controls, along with T0 subjected to fermentation for the different time periods.
Table 4
| Sample type | Treatment | Fermentation time | ||
|---|---|---|---|---|
| 24 h | 48 h | 72 h | ||
| Solid phase | T0 | 13.27% ± 0.01 ABab | 13.27 ± 0.01 Aa | 13.27 ± 0.01 ABab |
| T2 SP | 10.05% ± 0.15 Bb | 10.05 ± 0.15 Aa | 10.05 ± 0.15 Bb | |
| T0 F | 12.80% ± 0.02 ABab | 11.13 ± 0.01 Aa | 12.90 ± 0.05 ABab | |
| T2 FSP | 16.92% ± 0.01 Aa | 19.89 ± 0.01 Bbc* | 20.96 ± 0.03 Aa* | |
| Aqueous phase | T2 AP | 14.95% ± 0.02 Aab | 14.95 ± 0.02 Aab | 14.95 ± 0.02 Aab |
| T2 FAP | 17.61% ± 0.02 Aa | 25.52 ± 0.03 Bc* | 11.51 ± 0.01 Ab | |
Percentage of radical scavenging activity across different phases of untreated and treated biomass.
T0, unfermented biomass; T2 SP, unfermented solid phase; T2 AP, unfermented aqueous phase; T0 F, fermented biomass; T2 SPF, fermented solid phase; T2 APF, fermented aqueous phase. Different uppercase letters indicate statistically significant differences (p ≤ 0.05) among treatments within the same phase, whereas different lowercase letters indicate statistically significant differences among phases across treatments. Asterisks denote treatments exhibiting the highest radical scavenging activity.
The fermentation results showed no significant changes in the antioxidant activity of the untreated Sargassum biomass (T0 F) over 24, 48, and 72 hours. In contrast, the highest antioxidant activity was observed in the fermented aqueous and solid phases of T2 after 48 and 72 hours, with values of 25.516% ± 0.0303 and 20.962% ± 0.0249, respectively. These values were substantially higher than those of the controls (T2 aqueous phase: 14.949% ± 0.015; T2 solid phase: 10.0515% ± 0.015).
4 Discussion
This study evaluated the effect of hydrothermal pretreatment (100–200°C) on Sargassum spp. biomass collected from the coasts of Cancún, Quintana Roo, Mexico. The pretreatments produced two fractions, solid and aqueous, whose bioactive compound profiles were analyzed. Of particular interest was the pretreatment that yielded the highest carbohydrate content, as the primary objective was to identify conditions that maximize carbohydrate content in both fractions for use as a nutrient source for K. marxianus.
Hydrothermal pretreatment was employed due to the complex structure of brown algae, which makes it difficult to utilize them as a food source for microorganisms (Ruiz et al., 2021; Loaiza et al., 2022). This treatment facilitates the solubilization of sugars as water penetrates the cellular structure through thermal hydrolysis. Statistically significant differences were observed among the hydrothermal treatments, with the solid-phase yield decreasing from 89.8% to 36.2% as temperature (from 100 to 200°C) and pressure (from 3.44 to 11.7211 bar) increased (Table 2). These results are consistent with those reported by del Río et al. (2021), who observed a decrease in the solid fraction from 57 to 53 g per 100 g DW when the temperature was increased from 160 to 180°C during microwave-assisted processing of Sargassum muticum biomass for 2.5 min (del Río et al., 2021).
Regarding the chemical composition, the ash content was significantly higher in the solid phase than in the aqueous phase (Table 3). Furthermore, an increase in ash content was observed with increasing temperature (200°C), although no significant differences were detected between treatments within the same phases. This trend is consistent with the observations reported by Anastasakis and Ross (2011), who indicated that solid residues generally contain high ash concentrations, which tend to increase as processing temperature rises (Anastasakis and Ross, 2011).
In contrast, the carbohydrate content was higher in the aqueous phase obtained from the hydrothermally treated Sargassum biomass than in the solid phase and the untreated biomass (Table 3). These results are in agreement with those reported by Anastasakis and Ross (2011), who found that hydrothermal liquefaction of Laminaria saccharina at temperatures of 350°C and above led to an increased sugar concentration in the aqueous phase (Anastasakis and Ross, 2011). Similarly, studies employing microwave-assisted hydrothermal pretreatment of Sargassum muticum at 160°C and 180°C demonstrated that the aqueous phase was enriched in sugars, including glucans (del Río et al., 2021).
On the other hand, protein content was consistently higher in the solid phase, reaching its maximum in treatment T3 (Table 3). This result contrasts with the findings reported by del Río et al. (2021), who observed no significant changes in protein content in Sargassum muticum subjected to microwave-assisted processing at 160 and 180°C for treatment times ranging from 0 to 60 min (del Río et al., 2021). This discrepancy may be attributed to the potential degradation of proteins induced by microwave treatment, as hydrolysis reactions occur more rapidly but are susceptible to variability due to the challenges in precisely controlling temperature and pressure. In contrast, conventional methods offer better control over these variables, which may contribute to more consistent outcomes (Kapoore et al., 2018).
Likewise, a higher phenolic content was observed in the solid phase across all hydrothermal treatments (Table 3). This observation is in agreement with the findings of Anastasakis and Ross (2011), who reported increased phenolic content at elevated temperatures as a consequence of carbohydrate and cellulose decomposition in brown algae (Anastasakis and Ross, 2011).
Regarding antioxidant activity, a statistically significant increase was observed in both the aqueous and solid phases of treatment T3 compared to the untreated biomass (T0) and to the corresponding phases of treatments T1 and T2 (Figure 1). This finding is consistent with the results reported by Ponthier et al. (2020), who demonstrated that microwave-assisted treatment of the red alga Mastocarpus stellatus at 190°C led to an enhancement of its antioxidant activity (Ponthier et al., 2020).
Although treatment T3 led to higher levels of bioactive compounds in both the solid phase (proteins and phenols) and the aqueous phase (carbohydrates) (Table 3), as well as increased antioxidant activity in both phases (Figure 1), treatment T2 provided a more favorable carbohydrate profile for fermentation. Specifically, the solid phase obtained at 150°C exhibited the highest carbohydrate content among all hydrothermal treatments applied to this phase, while the carbohydrate concentration in the aqueous phase of T2 was comparable to that of T3, with no statistically significant differences. This aspect is particularly important for fermentation with K. marxianus, for which carbohydrates serve as the primary energy source (Fonseca et al., 2013). Therefore, T2 emerges as a more balanced and strategically advantageous pretreatment, ensuring adequate carbohydrate availability for efficient fermentation.
The fermentation results revealed no significant changes in the antioxidant activity of untreated Sargassum biomass (T0) after 24, 48, and 72 hours (Table 4). This lack of change may be attributed to the presence of complex polysaccharides in the samples, which are not readily utilized as a carbon source by K. marxianus (Ruiz et al., 2021; Loaiza et al., 2022).
However, after 48 hours, an increase in the antioxidant activity was observed in the fermented aqueous phase of the biomass pretreated at 150°C (T2 FAP) (Table 4). This increase is likely due to the high availability and diffusion of simple carbohydrates and other nutrients in the medium, which facilitate their rapid assimilation. In contrast, the fermented solid phase exhibited its highest antioxidant activity at 72 hours, likely because the biomass structure restricts nutrient accessibility, resulting in a slower utilization of these compounds (Zhao et al., 2021).
Furthermore, in this study, the antioxidant activity was enhanced by 10% after fermenting the aqueous and solid phases for 48 and 72 hours, respectively, from Sargassum biomass pretreated at 150°C. These findings are consistent with those reported by Rashad et al. (2015), who observed an 8% increase in antioxidant activity in pineapple extracts fermented by K. marxianus compared to the control (unfermented pineapple extracts) (Rashad et al., 2015).
5 Conclusion
This study demonstrates that hydrothermal treatment and fermentation time with K. marxianus significantly influence free radical scavenging activity. The aqueous phase obtained from hydrothermal pretreatment at 150°C exhibited the highest antioxidant potential, particularly after 48 hours of fermentation, compared to untreated fermented biomass. These results highlight the critical role of pretreatment in enhancing the availability and accessibility of Sargassum carbohydrates for K. marxianus. Notably, this study presents a novel approach, as Sargassum has not previously been utilized as a food source for K. marxianus. Further research is required to elucidate the behavior of the antioxidant activity and determine the levels of carbohydrates, proteins, and phenols, as well as to identify, using HPLC, the main compounds present before and after fermentation of the aqueous and solid phases of the different treatments (T0, T1, T2, and T3). For the moment, these findings are promising, as they may support the development of Sargassum and K. marxianus based supplements for livestock and aquaculture feeds. Such supplements, enriched with antioxidant bioactive compounds, have the potential to enhance immune function, reduce antibiotic dependence, mitigate the emergence of multidrug-resistant microorganisms, and indirectly improve the physiological quality of animal-derived foods intended for human consumption.
Statements
Data availability statement
The raw data supporting the conclusions of this article will be made available by the authors, without undue reservation.
Author contributions
EF-C: Conceptualization, Data curation, Formal analysis, Funding acquisition, Investigation, Methodology, Project administration, Resources, Software, Supervision, Validation, Visualization, Writing – original draft, Writing – review & editing. ID-C: Conceptualization, Investigation, Methodology, Writing – original draft. EM-M: Conceptualization, Writing – original draft, Writing – review & editing. GB-C: Investigation, Methodology, Writing – original draft. ÁG-C: Investigation, Methodology, Writing – original draft. EG-G: Conceptualization, Formal analysis, Investigation, Methodology, Project administration, Writing – original draft, Writing – review & editing.
Funding
The author(s) declared that financial support was received for this work and/or its publication. This work was supported by the project: Development of a sustainable feed formulation for shrimp based on bioprocessed Sargassum biomass to improve their nutritional and health parameters (IJXT070-23EG59002), from the 2023 Challenge-Based Research Funding Program of the Instituto Tecnológico de Estudios Superiores de Monterrey. The author, Elda A. Flores-Contreras, received research support.
Conflict of interest
The author(s) declared that this work was conducted in the absence of any commercial or financial relationships that could be construed as a potential conflict of interest.
Generative AI statement
The author(s) declared that generative AI was used in the creation of this manuscript. ChatGPT (OpenAI, 2024) was used to improve the grammar and clarity of the manuscript.
Any alternative text (alt text) provided alongside figures in this article has been generated by Frontiers with the support of artificial intelligence and reasonable efforts have been made to ensure accuracy, including review by the authors wherever possible. If you identify any issues, please contact us.
Publisher’s note
All claims expressed in this article are solely those of the authors and do not necessarily represent those of their affiliated organizations, or those of the publisher, the editors and the reviewers. Any product that may be evaluated in this article, or claim that may be made by its manufacturer, is not guaranteed or endorsed by the publisher.
References
1
Anastasakis K. Ross A. B. (2011). Hydrothermal liquefaction of the brown macro-alga Laminaria Saccharina: Effect of reaction conditions on product distribution and composition’. Bioresource Technol.102, 4876–4883. doi: 10.1016/J.BIORTECH.2011.01.031
2
Argüello-Guevara W. Molina-Poveda C. (2013). Effect of binder type and concentration on prepared feed stability, feed ingestion and digestibility of Litopenaeus vannamei broodstock diets’. Aquaculture Nutr.19, 515–522. doi: 10.1111/ANU.12003
3
Bilal M. Ji L. Xu Y. Xu S. Lin Y. Iqbal H. M. N. et al . (2022). Bioprospecting kluyveromyces marxianus as a robust host for industrial biotechnology. Front. Bioengineering Biotechnol.10. doi: 10.3389/FBIOE.2022.851768
4
Brand-Williams W. Cuvelier M. E. Berset C. (1995). Use of a free radical method to evaluate antioxidant activity. LWT - Food Sci. Technol.28, 25–30. doi: 10.1016/S0023-6438(95)80008-5
5
del Río P. G. Gullón B. Pérez-Pérez A. Romaní A. Garrote G. . (2021). Microwave hydrothermal processing of the invasive macroalgae Sargassum muticum within a green biorefinery scheme. Bioresource Technol.340, 125733. doi: 10.1016/J.BIORTECH.2021.125733
6
Fonseca G. G. De Carvalho N. M. B. Gombert A. K. (2013). Growth of the yeast Kluyveromyces marxianus CBS 6556 on different sugar combinations as sole carbon and energy source. Appl. Microbiol. Biotechnol.97, 5055–5067. doi: 10.1007/S00253-013-4748-6
7
Fonseca F. Fuentes J. Vizcaíno A. J. Alarcón F. J. Mancera J. M. Martínez-Rodríguez G. et al . (2023). From invasion to fish fodder: Inclusion of the brown algae Rugulopteryx okamurae in aquafeeds for European sea bass Dicentrarchus labrax (L. 1758). Aquaculture568, 739318. doi: 10.1016/J.AQUACULTURE.2023.739318
8
Herrera E. Murillo M. Berumen L. Soto-Cruz N. O. Páez-Lerma J. B. . (2017). Protein enrichment of Opuntia ficus-indica using Kluyveromyces marxianus in solid-state fermentation. Ciencia e investigación agraria44, 113–120. doi: 10.7764/RCIA.V44I2.1767
9
Kapoore R. V. Butler T. Pandhal J. Vaidyanathan S. . (2018). Microwave-assisted extraction for microalgae: from biofuels to biorefinery. Biology7, 18. doi: 10.3390/BIOLOGY7010018
10
Loaiza A. M. B. et al . (2022). ‘Fungal proteins from sargassum spp. Using solid-state fermentation as a green bioprocess strategy’. Molecules27, 3887. doi: 10.3390/MOLECULES27123887
11
López-Legarda X. Taramuel-Gallardo A. Arboleda-Echavarría C. Segura-Sánchez F. . (2017). Comparison of methods using sulfuric acid for determination of total sugars. Rev. Cubana Química29, 180–198. Available online at: https://cubanaquimica.uo.edu.cu/index.php/cq/article/view/2498 (27 October 2022).
12
Louime C. Fortune J. Gervais G. . (2017). Sargassum invasion of coastal environments: A growing concern. Am. J. Environ. Sci.13, 58–64. doi: 10.3844/AJESSP.2017.58.64
13
Lowry O. H. Rosebrough N. J. Farr A. L. Randall R. J. . (1951). Protein measurement with the folin phenol reagent. J. Biol. Chem.193, 265–275. doi: 10.1016/S0021-9258(19)52451-6
14
Morales-Contreras B. E. Flórez-Fernández N. Dolores Torres M. Domínguez H. Rodríguez-Jasso R. M. Ruiz H. A. et al . (2022). Hydrothermal systems to obtain high value-added compounds from macroalgae for bioeconomy and biorefineries’. Bioresource Technol.343, 126017. doi: 10.1016/J.BIORTECH.2021.126017
15
Øverland M. Karlsson A. Mydland L. T. Romarheim O. H. Skrede A. . (2013). Evaluation of Candida utilis, Kluyveromyces marxianus and Saccharomyces cerevisiae yeasts as protein sources in diets for Atlantic salmon (Salmo salar). Aquaculture402–403, 1–7. doi: 10.1016/J.AQUACULTURE.2013.03.016
16
Ponthier E. Domínguez H. Torres M. D. (2020). The microwave assisted extraction sway on the features of antioxidant compounds and gelling biopolymers from Mastocarpus stellatus. Algal Res.51, 102081. doi: 10.1016/J.ALGAL.2020.102081
17
Rashad M. M. Mahmoud A. E. Ali M. M. Nooman M. U. Al-Kashef A. S. . (2015). Antioxidant and anticancer agents produced from pineapple waste by solid state fermentation. Int. J. Toxicological Pharmacol. Res.7, 287–296.
18
Rossi L. Dell’Anno M. (2024). Novel antioxidants for animal nutrition. Antioxidants13, 438. doi: 10.3390/ANTIOX13040438
19
Ruiz H. A. Thomsen M. H. Trahano H. L. . (2017). “ Hydrothermal processes for extraction of macroalgae high value-added compounds,” in Hydrothermal Processing in Biorefineries: Production of Bioethanol and High Added-Value Compounds of Second and Third Generation Biomass (Cham: Springer) 461–481. doi: 10.1007/978-3-319-56457-9_20
20
Ruiz H. A. Galbe M. Garrote G. Ramirez-Gutierrez D. M. Ximenes E. Sun S. N. et al . (2021). Severity factor kinetic model as a strategic parameter of hydrothermal processing (steam explosion and liquid hot water) for biomass fractionation under biorefinery concept. Bioresource Technol.342, 125961. doi: 10.1016/J.BIORTECH.2021.125961
21
Saldarriaga-Hernandez S. Melchor-Martínez E. M. Carillo-Nieves D. Parra-Saldívar R. Iqbal H. M. N. . (2021). Seasonal characterization and quantification of biomolecules from sargassum collected from Mexican Caribbean coast – A preliminary study as a step forward to blue economy. J. Environ. Manage.298, 113507. doi: 10.1016/J.JENVMAN.2021.113507
22
Singleton V. L. Rossi J. A. (1965). Colorimetry of total phenolics with phosphomolybdic-phosphotungstic acid reagents. Am. J. Enology Viticulture16, 144–158. doi: 10.5344/ajev.1965.16.3.144
23
Van Wychen S. Laurens L. M. L. (2013). Determination of Total Carbohydrates in Algal Biomass: Laboratory Analytical Procedure (LAP) (Revised). Available online at: www.nrel.gov/publications (Accessed 25 February 2025).
24
Wang W. Li Z. Lv Z. Zhang B. Lv H. Guo Y. (2017). Effects of Kluyveromyces marxianus supplementation on immune responses, intestinal structure and microbiota in broiler chickens. PloS One12, e0180884. doi: 10.1371/JOURNAL.PONE.0180884
25
Xie Y. Zhang H. Liu H. Xiong L. Gao X. Jia H. et al . (2015). Hypocholesterolemic effects of Kluyveromyces marxianus M3 isolated from Tibetan mushrooms on diet-induced hypercholesterolemia in rat. Braz. J. Microbiol.46, 389. doi: 10.1590/S1517-838246220131278
26
Zhao Y.-S. Eweys A. S. Zhang J.-Y. Zhu Y. Bai J. Darwesh O. M. et al . (2021). ‘Fermentation affects the antioxidant activity of plant-based food material through the release and production of bioactive components’. Antioxidants10, 2004. doi: 10.3390/ANTIOX10122004
Summary
Keywords
carbohydrates, fermentation, hydrothermal pretreatment, Kluyveromyces marxianus , Sargassum
Citation
Delgado-Cortez IG, Melchor-Martínez EM, Badillo-Contreras G, Gómez-Cavazos ÁF, González-González E and Flores-Contreras EA (2026) Sargassum biomass as a nutrient source for Kluyveromyces marxianus: effects of hydrothermal treatment and fermentation on antioxidant activity. Front. Aquac. 5:1761112. doi: 10.3389/faquc.2026.1761112
Received
05 December 2025
Revised
20 January 2026
Accepted
20 January 2026
Published
05 February 2026
Volume
5 - 2026
Edited by
Cosmas Nathanailides, University of Ioannina, Greece
Reviewed by
Ashish Christopher, North Dakota State University, United States
Konstantinos Katsoulis, University of Thessaly, Greece
Updates
Copyright
© 2026 Delgado-Cortez, Melchor-Martínez, Badillo-Contreras, Gómez-Cavazos, González-González and Flores-Contreras.
This is an open-access article distributed under the terms of the Creative Commons Attribution License (CC BY). The use, distribution or reproduction in other forums is permitted, provided the original author(s) and the copyright owner(s) are credited and that the original publication in this journal is cited, in accordance with accepted academic practice. No use, distribution or reproduction is permitted which does not comply with these terms.
*Correspondence: Everardo González-González, e.gzz@tec.mx; Elda A. Flores-Contreras, eldafc92@gmail.com; elda.florescn@uanl.edu.mx
Disclaimer
All claims expressed in this article are solely those of the authors and do not necessarily represent those of their affiliated organizations, or those of the publisher, the editors and the reviewers. Any product that may be evaluated in this article or claim that may be made by its manufacturer is not guaranteed or endorsed by the publisher.