 Hoseung Song
 Jayaraman J. Thiagarajan
 Bhavya Kailkhura
- 1Department of Statistics, University of California, Davis, CA, United States
- 2Lawrence Livermore National Laboratory, Livermore, CA, United States
Dataset shift refers to the problem where the input data distribution may change over time (e.g., between training and test stages). Since this can be a critical bottleneck in several safety-critical applications such as healthcare, drug-discovery, etc., dataset shift detection has become an important research issue in machine learning. Though several existing efforts have focused on image/video data, applications with graph-structured data have not received sufficient attention. Therefore, in this paper, we investigate the problem of detecting shifts in graph structured data through the lens of statistical hypothesis testing. Specifically, we propose a practical two-sample test based approach for shift detection in large-scale graph structured data. Our approach is very flexible in that it is suitable for both undirected and directed graphs, and eliminates the need for equal sample sizes. Using empirical studies, we demonstrate the effectiveness of the proposed test in detecting dataset shifts. We also corroborate these findings using real-world datasets, characterized by directed graphs and a large number of nodes.
1 Introduction
Most machine learning (ML) applications, e.g., healthcare, drug-discovery, etc., encounter dataset shift when operating in the real-world. The reason for this comes from the bias in the testing conditions compared to the training environment introduced by experimental design. It is well known that ML systems are highly susceptible to such dataset shifts, which often leads to unintended and potentially harmful behavior. For example, in ML-based electronic health record systems, input data is often characterized by shifting demographics, where clinical and operational practices evolve over time and a wrong prediction can threaten human safety.
Although dataset shift is a frequent cause of failure of ML systems, very few ML systems inspect incoming data for a potential distribution shift (Bulusu et al., 2020). While some practical methods such as (Rabanser et al., 2019) have been proposed for detecting shifts in applications with Euclidean structured data (speech, images, or video), there are limited efforts in solving such issues for graph structured data that naturally arises in several scientific and engineering applications. In recent years there has been a surge of interest in applying ML techniques to structured data, e.g. graphs, trees, manifolds etc. In particular, graph structured data is becoming prevalent in several high-impact applications including bioinformatics, neuroscience, healthcare, molecular chemistry and computer graphics. In this paper, we investigate the problem of detecting distribution shifts in graph-structured datasets for responsible deployment of ML in safety-critical applications. Specifically, we propose to solve the problem of detecting shifts in graph-structured data through the lens of statistical two-sample testing. Broadly, the objective in two-sample testing for graphs is to test whether two populations of random graphs are different or not based on the samples generated from each of them.
Two-sample testing has been of significant research interest due to its broad applicability. An important class of testing methods relies on summary metrics that quantify the topological differences between networks. For example, in brain network analysis, commonly adopted topological summary metrics include the global efficiency (Ginestet et al., 2011) and network modularity (Ginestet et al., 2014). An inherent challenge with these approaches is that the topological characteristics depend directly on the number of edges in the graph, and can be insufficient in practice. An alternative class of methods is based on comparing the structure of subgraphs to produce a similarity score (Shervashidze et al., 2009; Macindoe and Richards, 2010). For example, Shervashidze et al. (2009) used the earth mover’s distance between the distributions of feature summaries of their constituent subgraphs.
While these heuristic methods are reasonably effective for comparing real-world graphs, not until recently that a principled analysis of hypothesis testing with random graphs was carried out. In this spirit, Ginestet et al. (2017) developed a test statistic based on a precise geometric characterization of the space of graph Laplacian matrices. Most of these approaches for graph testing based on classical two-sample tests are only applicable to the restrictive low-dimensional setting, where the population size (number of graphs) is larger than the size of the graphs (number of vertices). To overcome this challenge, Tang et al. (2017a) proposed a semi-parametric two-sample test for a class of latent position random graphs, and studied the problem of testing whether two dot product random graphs are drawn from the same population or not. Other testing approaches that focused on hypothesis testing for specific scenarios, such as sparse networks (Ghoshdastidar et al., 2017a) and networks with a large number of nodes (Ghoshdastidar et al., 2017b), have been developed. More recently, Ghoshdastidar and von Luxburg (2018) developed a novel testing framework for random graphs, particularly for the cases with small sample sizes and the large number of nodes, and studied its optimality. More specifically, this test statistic was based on the asymptotic null distributions under certain model assumptions.
Unfortunately, all these approaches are limited to testing undirected graphs under the equal sample size (for two graph populations) setting. In real-world dataset shift detection problems, these assumptions are extremely restrictive, making existing approaches inapplicable to several applications. In order to circumvent these crucial shortcomings, we develop a novel approach based on hypothesis testing for detecting shifts in graph-structured data, which is more flexible (i.e., accommodates 1) both undirected and directed graphs and 2) unequal sample size cases). Moreover, it is highly effective even when the sample size grows. Notice that, similar to the setting in Ghoshdastidar and von Luxburg (2018), we also consider scenarios where all networks are defined from the same vertex set, which is common to several real-world applications. The main contributions of this paper are summarized below:
• We propose a new test statistic that can be applied to undirected graphs as well as directed graphs and/or unweighted graphs as well as weighted graphs, while eliminating the equal sample size requirement. The asymptotic distribution for the proposed statistic, based on the well-known U-statistic, is derived.
• A practical permutation approach based on a simplified form of the statistic is also proposed.
• We compare the new approach with existing methods for graph testing in diverse simulation settings, and show that the proposed statistic is more flexible and achieves significant performance improvements.
• In order to demonstrate the usefulness of the proposed method in challenging real-world problems, we consider several applications (including a healthcare application), and show the effectiveness of our approach.
2 Preliminaries
We consider the following two-sample setting. Let two random graph populations with d vertices be denoted as
Notice that we consider the cases where each population consists of independent and identically distributed samples, which encompasses a wide-range of network analysis problems, see, e.g., Holland et al. (1983), Newman and Girvan (2004), Newman (2006). In contrast to existing formulations, e.g., Ghoshdastidar and von Luxburg (2018), we consider a more flexible setup where 1) the sample sizes m and n are allowed to be different and 2) the graphs in p and Q can be weighted and/or directed.
While there have several efforts to two-sample testing of graphs (Bubeck et al., 2016; Gao and Lafferty, 2017; Maugis et al., 2017), recent works such as Tang et al. (2017a), Tang et al. (2017b); Ginestet et al. (2017) have focused on designing more general testing methods that are applicable to practical settings. For example, Ginestet et al. (2017) proposed a practical test statistic based on the correspondence between an undirected graph and its Laplacian under the inhomogeneous Erdős-Rényi (IER) assumption, which means all nodes are independently generated from a Bernoulli distribution (see details in Section 3). The test statistic, under the assumption of equal sample sizes m, can be described as follows:
where
The authors showed that
Recently, Ghoshdastidar and von Luxburg (2018) proposed a new class of test statistics, designed for different scenarios under the IER model assumption. More specifically, they focused on cases with small m and large d. For cases with
While it was suggested by the authors to perform this test using bootstraps from the aggregated data, this could be challenging for sparse graphs, since it is difficult to construct bootstrapped statistics from an operator norm. Hence, they considered an alternate test statistic based on the Frobenius-norm as follows:
where
3 Proposed Test
To carry out two-sample testing, we want to measure the distance between two populations. Here, we utilize the Frobenius distance as the evidence for discrepancy between two populations:
Next, we provide finite sample estimates of this quantity. To accommodate more general settings for random graphs, the new test statistic is defined as follows:
where
Note that the proposed test statistic accommodates scenarios where
Next, we analyze the theoretical properties of the proposed test. For the ease of theoretical analysis, we focus on the case where graphs are unweighted and undirected. However, the proposed test and algorithmic tools are applicable to weighted and/or directed graph scenarios which is the main focus of the paper and is considered in our experimental evaluations. More specifically, in our theoretical analysis, we assume that graphs are drawn from the inhomogeneous Erdős-Rényi (IER) random graph process, which is considered as an extended version of the Erdős-Rényi (ER) model from Bollobás et al. (2007). In other words, we consider unweighted and undirected random graphs, where edges occur independently without any additional structural assumption on the population adjacency matrix. Note, the IER model encompasses other models studied in the literature including random dot product graphs (Tang et al., 2017b) and stochastic block models (Lei et al., 2016). A graph
LEMMA 3.1.
PROOF. Under the IER assumptions, for all
since
In the form of
When
where
and
Theorem 3.1 Assume
where
where
PROOF. These results can be obtained by applying the asymptotic properties of U-statistics as given in Serfling (2009) and the IER assumptions.
Having devised the test statistic, our next aim is to determine whether the new test statistic
where
Although we do not use the last term of
Input: Graph samples Output: Reject the null hypothesis 2: for 3: Randomly permute the pooled samples 4: Compute 5: end for. 6: Calculate p-value =
4 Experiments
Here, we first examine the performance of the new test statistics under diverse settings through simulation studies. Later, we will apply the new test to real-world applications.
4.1 Simulated Data
To evaluate the performance of the new test, we examine sparse graphs from stochastic block models with two communities as studied in Tang et al. (2017a) an Ghoshdastidar and von Luxburg (2018). Specifically, we consider sparse graphs with d nodes where the same
We generate m samples from p and n samples from Q. Under the null,
The performance of the test based on
Figure 1 shows results for the undirected graph case under different settings. When two sample sizes are equal (upper panels), where existing methods can be applied, we see that the proposed test outperforms all other methods. Note that, when the sample size of two graph populations are different (i.e.,
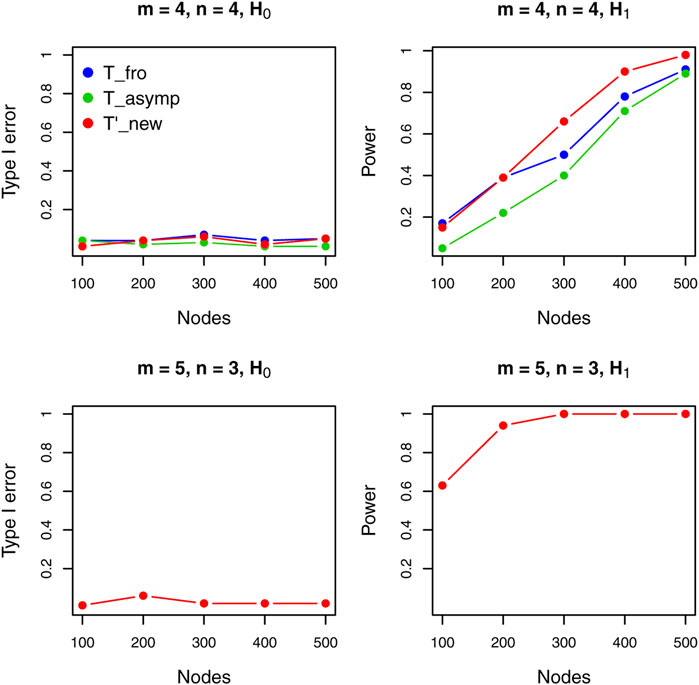
FIGURE 1. Performance comparison of different tests for undirected graphs.
We also evaluate the performance of the new test for directed graphs under various configurations. (Figure 2). The existing methods are not applicable to directed graphs, but we transform
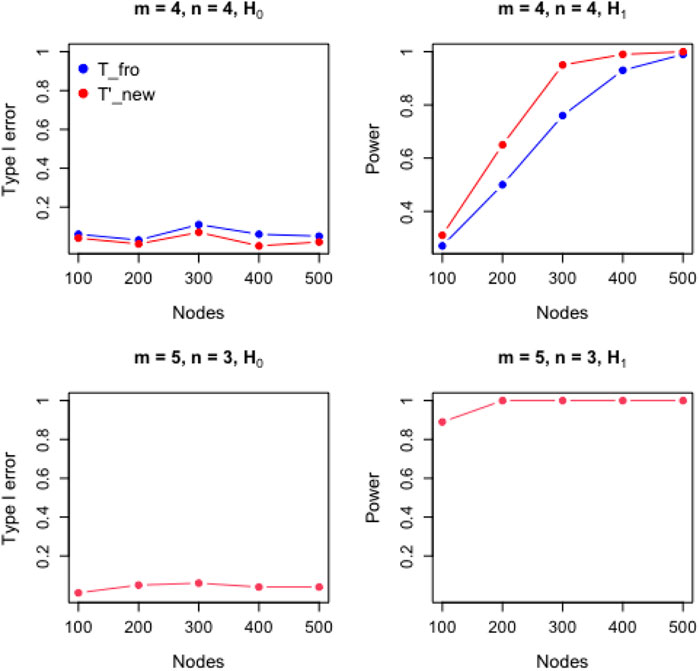
FIGURE 2. Performance comparison of proposed test for directed graphs.
Next, we examine the effect of the sparsity on the performance of the tests. To this end, we consider the same setting as above, but with different choices of
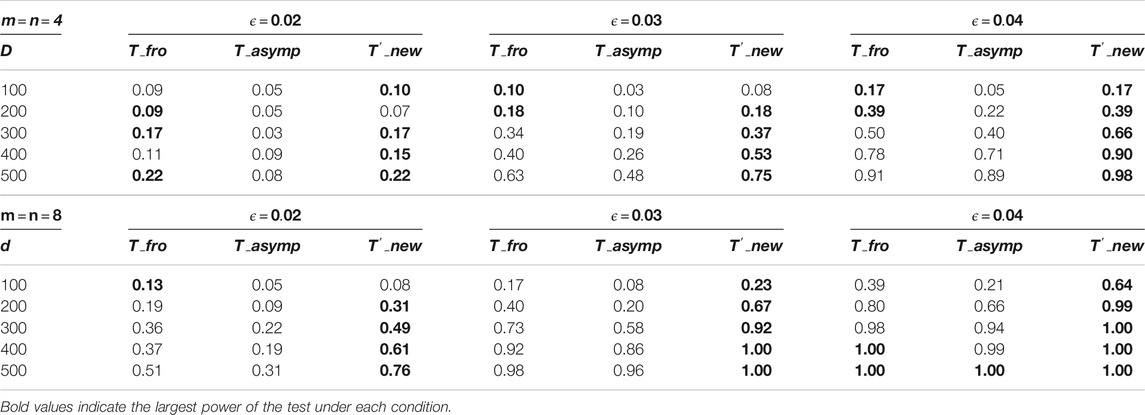
TABLE 1. Power comparison of different tests for undirected graphs with varying sparsity levels.
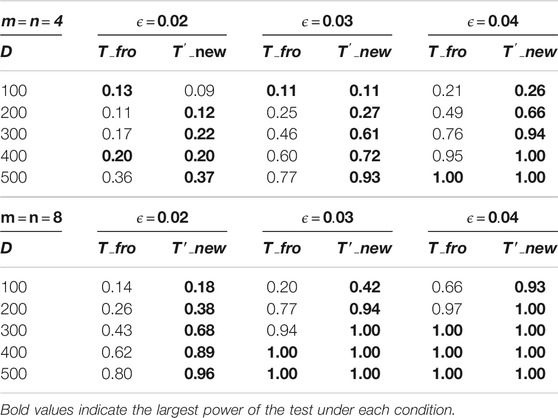
TABLE 2. Power of the proposed test for directed graphs with varying sparsity levels.
This observation becomes particularly evident when we have a large number of samples. To this end, we study how the performance of the tests is affected by the number of samples. For this study, we consider

TABLE 3. Power comparison of different tests for undirected graphs with varying sample sizes.
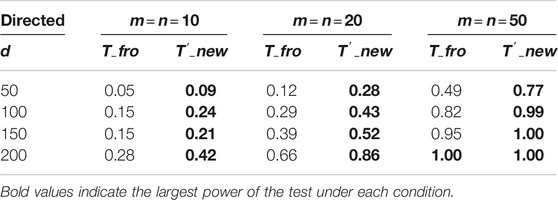
TABLE 4. Power comparison of different tests for directed graphs with varying sample sizes.
4.2 Real-World Applications
4.2.1 Phone-Call Network
The MIT Media Laboratory conducted a study following 87 subjects who used mobile phones with a pre-installed device that can record call logs. The study lasted for 330°days from July 2004 to June 2005 (Eagle et al., 2009). Given the richness of this dataset, one question of interest to answer is that whether the phone call patterns among subjects are different between weekends and weekdays. These patterns can be viewed as a representation of the personal relationship and professional relationships of a subject. Removing days with no calls among subjects, there are
The test statistic and corresponding p-value are shown in Table 5. We see that the new test rejects the null hypothesis of equal distribution at 0.05 significance level. This outcome is intuitively plausible as phone call patterns in weekends (personal) can be different from the patterns in weekdays (work).

TABLE 5. Test summary on the phone-call network.
4.2.2 Safety-Critical Healthcare Application
Modeling relationships between functional or structural regions in the brain is a significant step toward understanding, diagnosing, and eventually treating a gamut of neurological conditions including epilepsy, stroke, and autism. A variety of sensing mechanisms, such as functional-MRI, Electroencephalography (EEG), and Electrocorticography (ECoG), are commonly adopted to uncover patterns in both brain structure and function. In particular, the resting state fMRI (Kelly et al., 2008) has been proven effective in identifying diagnostic biomarkers for mental health conditions such as the Alzheimer disease (Chen et al., 2011) and autism (Plitt et al., 2015). At the core of these neuropathology studies is predictive models that map variations in brain functionality, obtained as time-series measurements in regions of interest, to clinical scores. For example, the Autism Brain Imaging Data Exchange (ABIDE) is a collaborative effort (Di Martino et al., 2014), which seeks to build a data-driven approach for autism diagnosis. Further, several published studies have reported that predictive models can reveal patterns in brain activity that act as effective biomarkers for classifying patients with mental illness (Plitt et al., 2015). Following current practice (Parisot et al., 2017), graphs are natural data structures to model the functional connectivity of human brain (e.g. fMRI), where nodes correspond to the different functional regions in the brain and edges represent the functional correlations between the regions. The problem of defining appropriate metrics to compare these graphs and thereby identify suitable biomarkers for autism severity has been of significant research interest. We show that the proposed two-sample test is highly effective at characterizing stratification based on demographics (e.g. age, gender) as well as autism severity states (normal vs abnormal) across a large population of brain networks.
In the dataset, there are total 871 graphs and each graph consists of 111 nodes (functional regions). Through this example, we study the effectiveness of our approach under the weighted and undirected graph setting. In particular, we focus on detecting variations across stratification arising from demographics (gender, age). Specifically, groups of normal control subjects as well as those diagnosed with Autism Spectrum Disorders (ADS) are further sub-divided according to their gender (Male or Female) and age (under 20 or over 20), and we compare these sub-groups using the proposed test. Table 6 shows the distribution of graphs in the dataset and Figure 3 shows an example of the network structure of normal-male and normal-female groups.
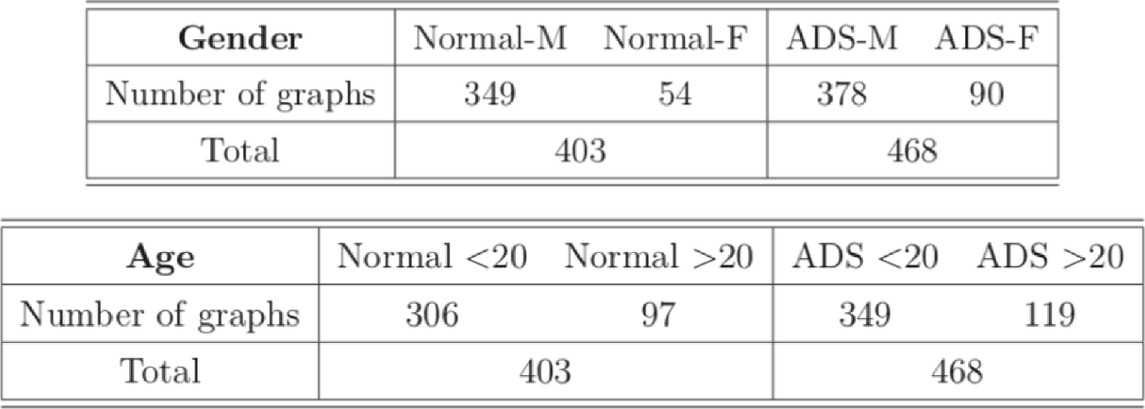
TABLE 6. Distribution of graphs. “M” and “F” indicate male and female, respectively. ‘<20’ and ‘>20’ represent age less than 20 and over 20, respectively.
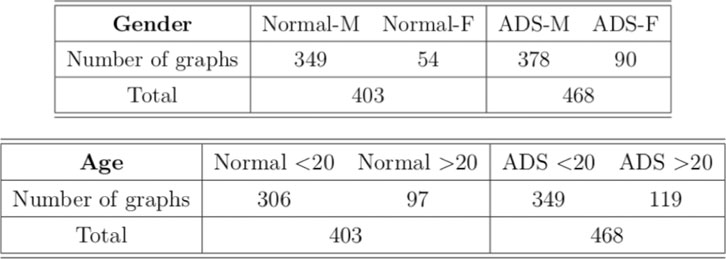
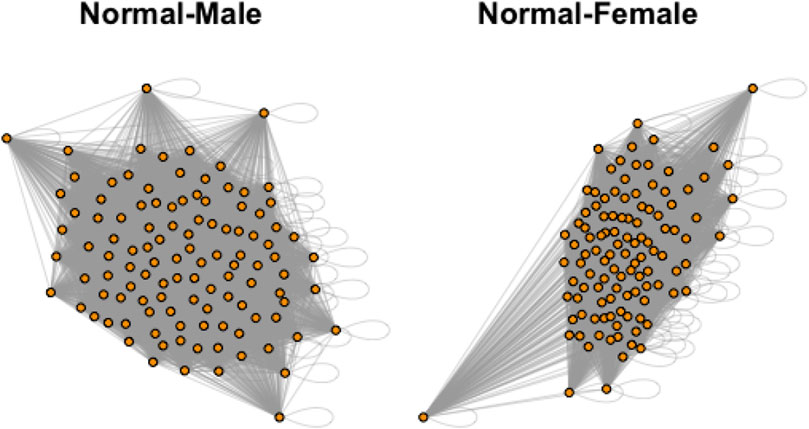
FIGURE 3. Example networks from Normal-Male and Normal-Female groups.
We conduct the two-sample test based on
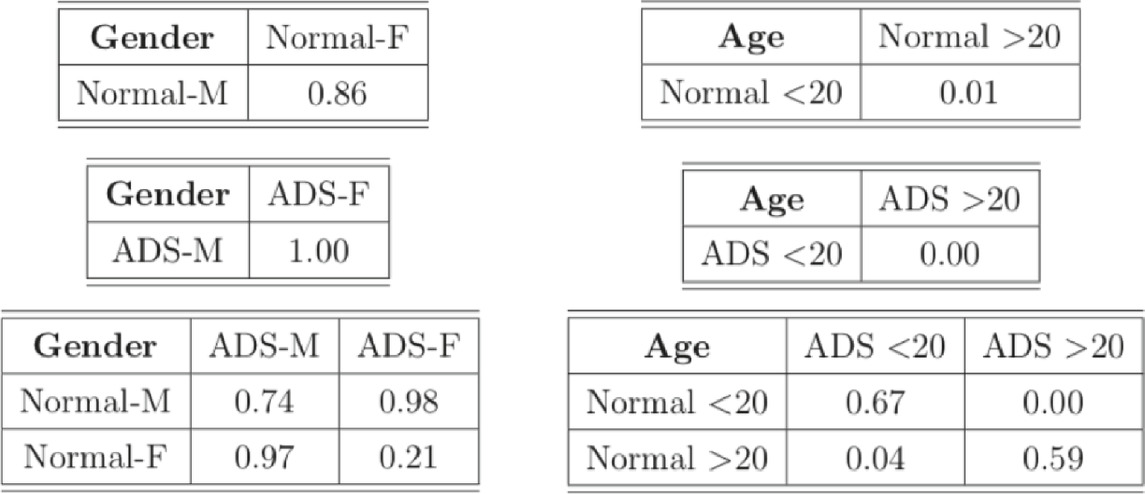
TABLE 7. p-values of the tests on the ABIDE dataset.
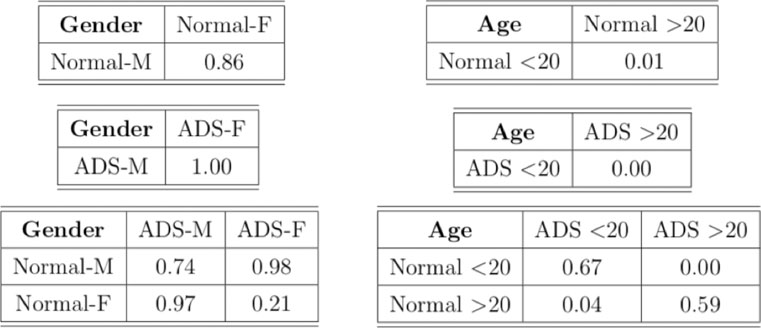
This conclusion indicates there is a dataset shift even within the same normal and ADS groups, depending on the age. Hence, the fact that normal and ADS groups are considered differently by age may affect the machine learning subjects classification and prediction task in population. Moreover, with the dataset in which the normal group and ADS group are determined differently by age and not by gender, the machine learning classification and prediction model may not be reliable. Hence, detecting dataset shift shed some light on the machine learning task for more reliable results.
We also compare the new test with the existing method
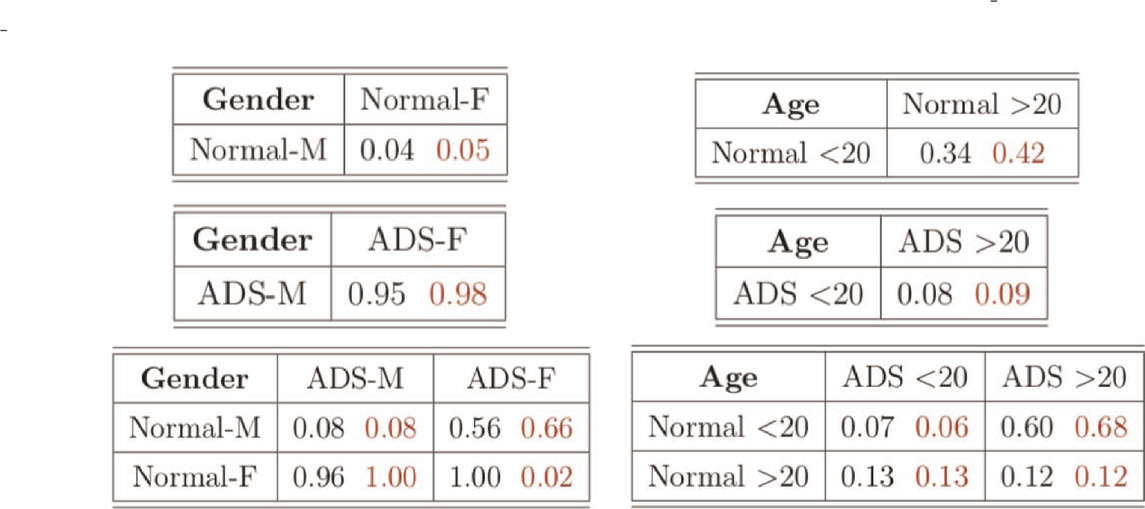
TABLE 8. Estimated power of the tests with the significance level at 5%. Black numbers indicate the power of test based on 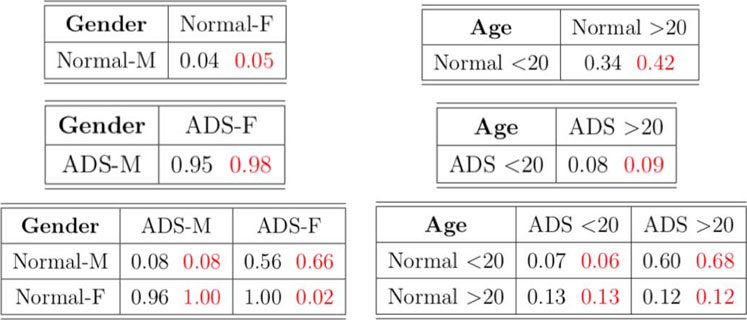
5 Conclusion
We propose the new two-sample test statistic for graph-structured data. Unlike the existing methods, the new test statistic is more versatile, which is applicable to directed graphs, imbalanced sample size cases, and even weighted graphs. The asymptotic distribution of the test statistic is presented and a practical testing procedure is proposed. The performance of the new method is studied under a number of settings. Experiments demonstrate that the new test in general outperforms state-of-the-art tests. The proposed test is also applied to two real datasets (including a safety-critical healthcare application), and we reveal that the new approach is effective to detecting the heterogeneity between disparate samples.
Data Availability Statement
The original contributions presented in the study are included in the article/Supplementary Material, further inquiries can be directed to the corresponding author.
Author Contributions
HS developed the main method and proposed the testing procedure based on the new test statistic. He conducted the simulation experiments and real data analysis. JJ and BK provided the intuition and the direction of the method and worked on simulation experiments with HS. JJ provided the real dataset, and JJ and BK discussed about the results with HS. HS, JJ, and BK generated the paper together.
Funding
This work was performed under the auspices of the U.S. Department of Energy by Lawrence Livermore National Laboratory under Contract DE-AC52-07NA27344. This work was supported by the DOE Advanced Scientific Computing Research. Release number LLNL-JRNL-822138.
Disclaimer
The views and opinions of the authors do not necessarily reflect those of the U.S. government or Lawrence Livermore National Security, LLC neither of whom nor any of their employees make any endorsements, express or implied warranties or representations or assume any legal liability or responsibility for the accuracy, completeness, or usefulness of the information contained herein.
Conflict of Interest
The authors declare that the research was conducted in the absence of any commercial or financial relationships that could be construed as a potential conflict of interest.
References
Bollobás, B., Janson, S., and Riordan, O. (2007). The Phase Transition in Inhomogeneous Random Graphs. Random Struct. Alg. 31, 3–122. doi:10.1002/rsa.20168
Bubeck, S., Ding, J., Eldan, R., and Rácz, M. Z. (2016). Testing for High-Dimensional Geometry in Random Graphs. Random Struct. Alg. 49, 503–532. doi:10.1002/rsa.20633
Bulusu, S., Kailkhura, B., Li, B., Varshney, P. K., and Song, D. (2020). Anomalous Instance Detection in Deep Learning: A Survey. Available at: arXiv:2003.06979 (Accessed March 16, 2020).
Chen, G., Ward, B. D., Xie, C., Li, W., Wu, Z., Jones, J. L., et al. (2011). Classification of Alzheimer Disease, Mild Cognitive Impairment, and Normal Cognitive Status with Large-Scale Network Analysis Based on Resting-State Functional Mr Imaging. Radiology 259, 213–221. doi:10.1148/radiol.10100734
Di Martino, A., Yan, C.-G., Li, Q., Denio, E., Castellanos, F. X., Alaerts, K., et al. (2014). The Autism Brain Imaging Data Exchange: toward a Large-Scale Evaluation of the Intrinsic Brain Architecture in Autism. Mol. Psychiatry 19, 659–667. doi:10.1038/mp.2013.78
Eagle, N., Pentland, A., and Lazer, D. (2009). Inferring Friendship Network Structure by Using Mobile Phone Data. Proc. Natl. Acad. Sci. 106, 15274–15278. doi:10.1073/pnas.0900282106
Gao, C., and Lafferty, J. (2017). Testing Network Structure Using Relations between Small Subgraph Probabilities. Available at: arXiv:1704.06742 (Accessed April 22, 2017).
Ghoshdastidar, D., and von Luxburg, U. (2018). “Practical Methods for Graph Two-Sample Testing,” in Advances in Neural Information Processing Systems, December, 2018, 3019–3028.
Ghoshdastidar, D., Gutzeit, M., Carpentier, A., and von Luxburg, U. (2017a). Two-sample Hypothesis Testing for Inhomogeneous Random Graphs. Available at: arXiv:1707.00833 (Accessed July 4, 2017).
Ghoshdastidar, D., Gutzeit, M., Carpentier, A., and von Luxburg, U. (2017b). Two-sample Tests for Large Random Graphs Using Network Statistics. Available at: arXiv:1705.06168v2 (Accessed May 26, 2017).
Ginestet, C. E., Fournel, A. P., and Simmons, A. (2014). Statistical Network Analysis for Functional Mri: Summary Networks and Group Comparisons. Front. Comput. Neurosci. 8, 51. doi:10.3389/fncom.2014.00051
Ginestet, C. E., Li, J., Balachandran, P., Rosenberg, S., and Kolaczyk, E. D. (2017). Hypothesis Testing for Network Data in Functional Neuroimaging. Ann. Appl. Stat. 11, 725–750. doi:10.1214/16-aoas1015
Ginestet, C. E., Nichols, T. E., Bullmore, E. T., and Simmons, A. (2011). Brain Network Analysis: Separating Cost from Topology Using Cost-Integration. PloS one 6, e21570. doi:10.1371/journal.pone.0021570
Hoeffding, W. (1992). “A Class of Statistics with Asymptotically Normal Distribution,” in Breakthroughs in Statistics (Springer), 308–334. doi:10.1007/978-1-4612-0919-5_20
Holland, P. W., Laskey, K. B., and Leinhardt, S. (1983). Stochastic Blockmodels: First Steps. Social networks 5, 109–137. doi:10.1016/0378-8733(83)90021-7
Kelly, A. M. C., Uddin, L. Q., Biswal, B. B., Castellanos, F. X., and Milham, M. P. (2008). Competition between Functional Brain Networks Mediates Behavioral Variability. Neuroimage 39, 527–537. doi:10.1016/j.neuroimage.2007.08.008
Lehmann, E. L., and Romano, J. P. (2006). Testing Statistical Hypotheses. Berlin, Germany: Springer Science & Business Media.
Lei, J., (2016). A Goodness-Of-Fit Test for Stochastic Block Models. Ann. Stat. 44, 401–424. doi:10.1214/15-aos1370
Macindoe, O., and Richards, W. (2010). Graph Comparison Using Fine Structure Analysis, IEEE Second International Conference on Social Computing. IEEE. doi:10.1109/socialcom.2010.35
Maugis, P., Priebe, C. E., Olhede, S. C., and Wolfe, P. J. (2017). Statistical Inference for Network Samples Using Subgraph Counts. Available at: arXiv:1701.00505 (Accessed January 2, 2017).
Newman, M. E., and Girvan, M. (2004). Finding and Evaluating Community Structure in Networks. Phys. Rev. E 69, 026113. doi:10.1103/physreve.69.026113
Newman, M. E. J. (2006). Modularity and Community Structure in Networks. Proc. Natl. Acad. Sci. 103, 8577–8582. doi:10.1073/pnas.0601602103
Parisot, S., Ktena, S. I., Ferrante, E., Lee, M., Moreno, R. G., Glocker, B., et al. (2017). “Spectral Graph Convolutions for Population-Based Disease Prediction,” in International Conference On Medical Image Computing and Computer-Assisted Intervention, QC, Canada, September 10–14, 2017 (Springer), 177–185.
Plitt, M., Barnes, K. A., and Martin, A. (2015). Functional Connectivity Classification of Autism Identifies Highly Predictive Brain Features but Falls Short of Biomarker Standards. NeuroImage: Clin. 7, 359–366. doi:10.1016/j.nicl.2014.12.013
Rabanser, S., Günnemann, S., and Lipton, Z. (2019). “Failing Loudly: An Empirical Study of Methods for Detecting Dataset Shift,” in 33rd Conference on Neural Information Processing Systems, Vancover, Canada, 1396–1408.
Serfling, R. J. (2009). Approximation Theorems of Mathematical Statistics. Hoboken, NJ: John Wiley & Sons.
Shervashidze, N., Vishwanathan, S., Petri, T., Mehlhorn, K., and Borgwardt, K. (2009). “Efficient Graphlet Kernels for Large Graph Comparison,” in Artificial Intelligence and Statistics, 488–495.
Tang, M., Athreya, A., Sussman, D. L., Lyzinski, V., Park, Y., and Priebe, C. E. (2017a). A Semiparametric Two-Sample Hypothesis Testing Problem for Random Graphs. J. Comput. Graphical Stat. 26, 344–354. doi:10.1080/10618600.2016.1193505
Keywords: graph learning, dataset shift, safety, two-sample testing, random graph models
Citation: Song H, Thiagarajan JJ and Kailkhura B (2021) Preventing Failures by Dataset Shift Detection in Safety-Critical Graph Applications. Front. Artif. Intell. 4:589632. doi: 10.3389/frai.2021.589632
Received: 31 July 2020; Accepted: 26 April 2021;
Published: 18 May 2021.
Edited by:
Novi Quadrianto, University of Sussex, United KingdomCopyright © 2021 Song, Thiagarajan and Kailkhura. This is an open-access article distributed under the terms of the Creative Commons Attribution License (CC BY). The use, distribution or reproduction in other forums is permitted, provided the original author(s) and the copyright owner(s) are credited and that the original publication in this journal is cited, in accordance with accepted academic practice. No use, distribution or reproduction is permitted which does not comply with these terms.
*Correspondence: Hoseung Song, aG9zb25nQHVjZGF2aXMuZWR1