 Weijie Wu1,2†
 Zheng Zhang1†
 Shuailei Wang1Ru Xin1
 Dong Yang3
 Weifeng Yao1Ziqing Hei1
 Chaojin Chen1*
 Gangjian Luo1*
- 1Department of Anesthesiology, The Third Affiliated Hospital of Sun Yat-Sen University, Guangzhou, China
- 2Department of Anesthesiology, The Seventh Affiliated Hospital of Sun Yat-Sen University, Shenzhen, China
- 3Guangzhou AID Cloud Technology Co., LTD, Guangzhou, China
Early prediction of acute respiratory distress syndrome (ARDS) after liver transplantation (LT) facilitates timely intervention. We aimed to develop a predictor of post-LT ARDS using machine learning (ML) methods. Data from 755 patients in the internal validation set and 115 patients in the external validation set were retrospectively reviewed, covering demographics, etiology, medical history, laboratory results, and perioperative data. According to the area under the receiver operating characteristic curve (AUROC), accuracy, specificity, sensitivity, and F1-value, the prediction performance of seven ML models, including logistic regression (LR), decision tree, random forest (RF), gradient boosting decision tree (GBDT), naïve bayes (NB), light gradient boosting machine (LGBM) and extreme gradient boosting (XGB) were evaluated and compared with acute lung injury prediction scores (LIPS). 234 (30.99%) ARDS patients were diagnosed. The RF model had the best performance, with an AUROC of 0.766 (accuracy: 0.722, sensitivity: 0.617) in the internal validation set and a comparable AUROC of 0.844 (accuracy: 0.809, sensitivity: 0.750) in the external validation set. The performance of all ML models was better than LIPS (AUROC 0.692, 0.776). The predictor variables included the age of the recipient, BMI, MELD score, total bilirubin, prothrombin time, operation time, standard urine volume, total intake volume, and red blood cell infusion volume. We firstly developed a risk predictor of post-LT ARDS based on RF model to ameliorate clinical practice.
1 Introduction
For patients with end-stage liver disease, liver transplantation (LT) is currently the most effective treatment (Samuel et al., 2024), while acute respiratory distress syndrome (ARDS) is a common postoperative complication following liver transplantation (LT) with high morbidity and mortality rates. In recent studies, ARDS after LT has been reported to cause a range of morbidities, with an incidence between 1 and 30% (Feltracco et al., 2013). ARDS plays a pivotal role in the poor survival of post-LT patients, leading to prolonged intensive care unit (ICU) and hospital stays, increased in-hospital mortality, and long-term physical, psychological, and social disabilities (Gorman et al., 2022; Oh et al., 2023).
Although postoperative ARDS significantly impacts the clinical outcomes of LT patients, it is often unrecognized and underdiagnosed, leading to the underutilization of timely and effective treatments (Tariparast et al., 2025). Therefore, the current research efforts mainly focus on identifying the risk factors which assist clinicians in implementing preventive interventions in the early stage (Grasselli et al., 2023). Earlier studies have reported many risk factors related to ARDS after LT, and these risk factors include recipient age, smoking history, ongoing dialysis, and preoperative total bilirubin (Ripoll et al., 2020). In addition, relevant prediction models, such as acute lung injury (ALI) prediction scores (LIPS), were established to predict ARDS/ALI (Kim B. K. et al., 2021). Using routinely available clinical data, we can identify patients at high risk of ARDS/ALI by LIPS in the early stage of their illness (Wei et al., 2025). However, the prediction performance of LIPS in post-LT patients has not been reported. Furthermore, the nonlinear relationship between the outcome variables and the explanatory variables could not be excluded, and the overfitting and multicollinearity limitations could not be avoided during traditional regression analysis (Bayman and Dexter, 2021).
Novel applications of machine learning (ML) methods in medicine have emerged and are constantly evolving (Gotlieb et al., 2022). ML has the ability to minimize the above limitations of regression analysis and to analyze large, complex datasets, yielding sophisticated outcomes and prediction models (Rubulotta et al., 2024). ML methods have already been applied in different fields in transplant medicine (Bhat et al., 2023), including organ allocation, prediction of overall survival, and short-and long-term complications, resulting in the development of significant prediction models with the potential to improve clinical practice (Swinckels et al., 2024; Tran et al., 2022). However, currently, no studies have reported the performance of machine learning models in predicting postoperative ARDS in LT patients (Tran et al., 2024).
Therefore, we tried to use our perioperative database to determine risk factors for perioperative ARDS in adult LT patients. Moreover, we compared the prediction performance of LIPS and seven machine learning models, including logistic regression (LR), random forest (RF), decision tree (DT), gradient boosting decision tree (GBDT), naïve bayes (NB), light gradient boosting machine (LGBM), and extreme gradient boosting (XGB). Finally, a visualized risk predictor based on an optimal machine learning model was developed to predict post-LT ARDS at ICU admission.
2 Methods
2.1 Study design and subjects
This was a retrospective study conducted at a single center and was approved by the Ethics Committee of the Third Affiliated Hospital of Sun Yat-sen University ([2021]02-023-01). We retrospectively reviewed the electronic medical records of 952 LT patients in our institution between January 2015 and February 2020. The recipients of organ transplantation were all registered in the China Organ Transplant Response Systems (www.cot.org.cn). During retrospective enrollment, patients who were under the age of 18 (n = 111), underwent combined organ transplantation (n = 13), presented with preoperative ARDS (n = 24) or were missing sufficient data (n = 49) were excluded from this study. A total of 755 patients were included in the final cohort, which was used to develop and internally validate the prediction models of postoperative ARDS in LT patients.
Meanwhile, according to the same inclusion and exclusion criteria, 143 patients who underwent LT from March 2020 to December 2020 in our institution were screened for temporal external validation of the prediction models. Among the 143 identified patients, those who were under the age of 18 (n = 21), underwent combined organ transplantation (n = 1), presented with preoperative ARDS (n = 2) or were missing sufficient data (n = 4) were excluded. A total of 115 patients were included in the external validation set.
As the primary outcome of our analysis, ARDS was identified according to the Berlin Definition (Ranieri et al., 2012), including PaO2/FiO2 ≤ 300 mmHg within 7 days after liver transplantation, respiratory failure not fully explained by fluid overload or cardiac failure, and bilateral opacities consistent with pulmonary edema on a chest radiograph. The secondary outcomes included lengths of stay (ICU, hospital), overall hospitalization cost, and one-year survival of patients after liver transplantation.
In addition, the predictive capability of the models was compared with LIPS, which is currently used to predict the ARDS/ALI risk. Finally, the optimal prediction model was visualized as an online risk predictor for clinical application at ICU admission. The flow diagram of this study is presented in Figure 1.
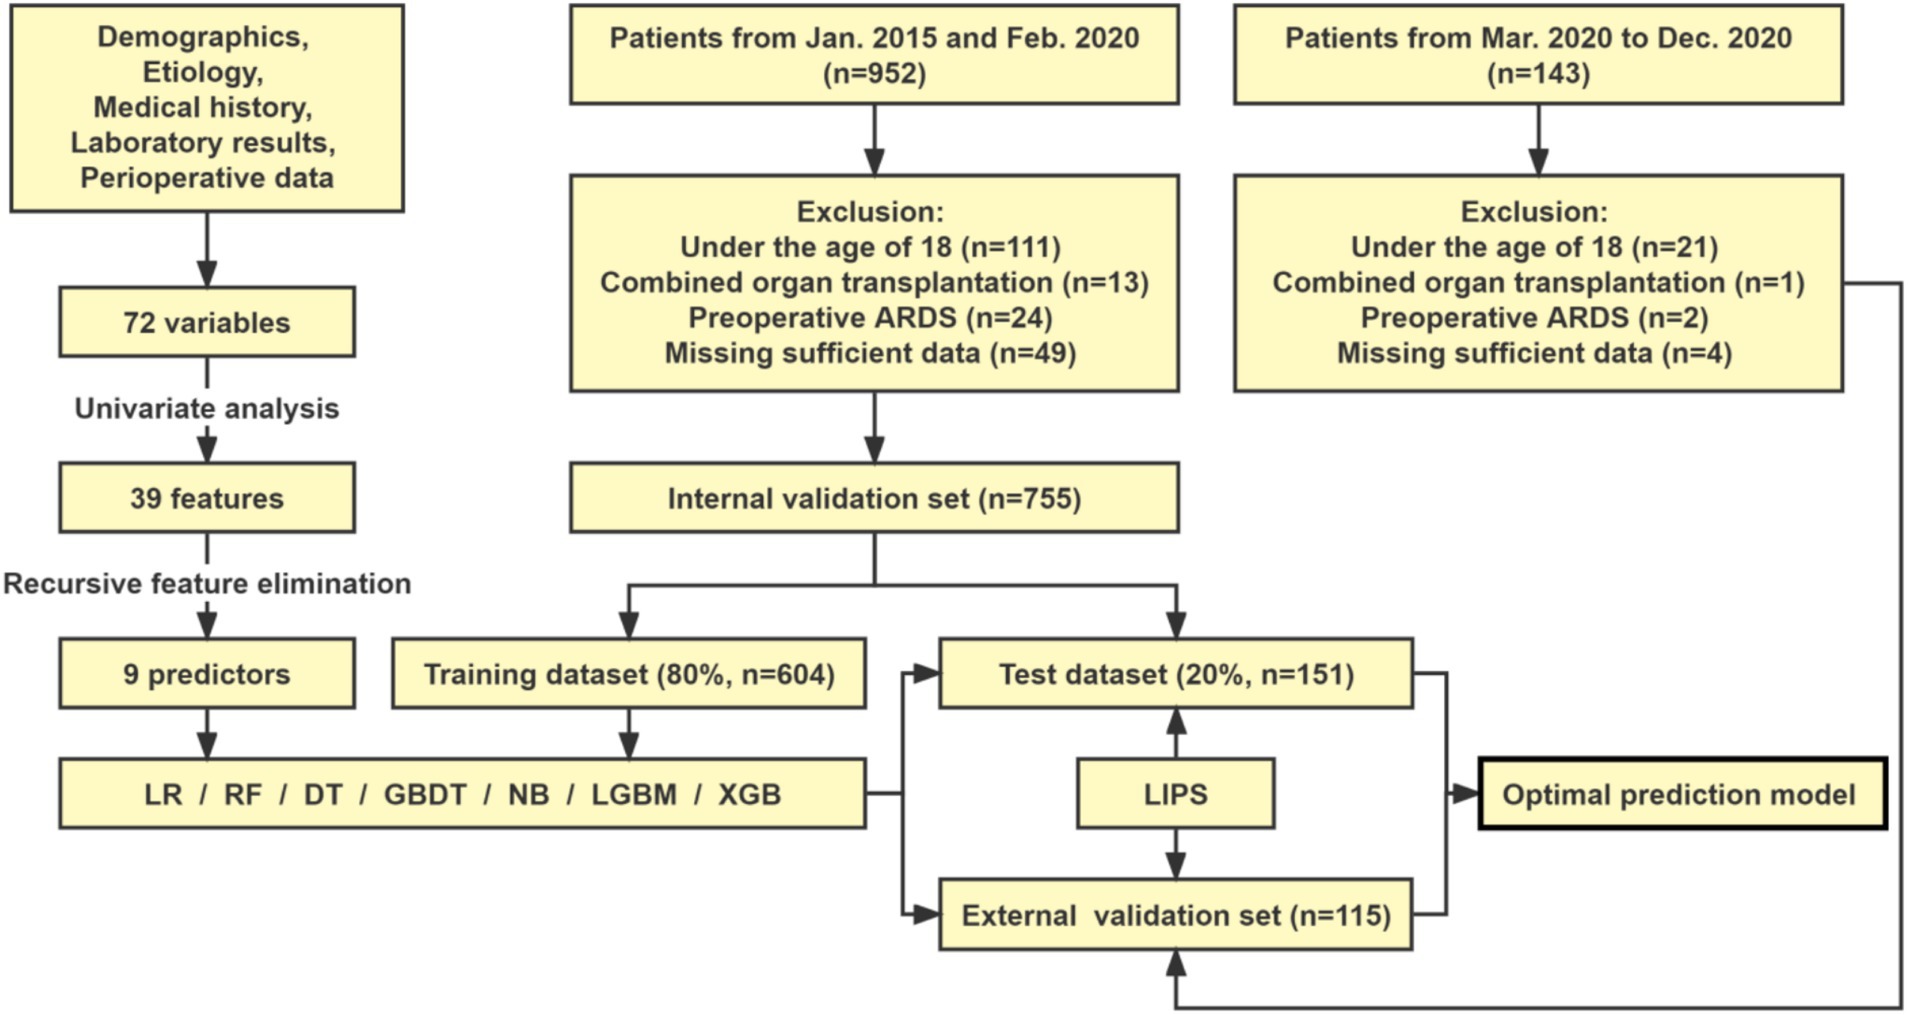
Figure 1. Study flowchart. LR, logistic regression; DT, decision tree; RF, random forest; GBDT, gradient boosting decision tree; NB, naive bayes; LGBM, light gradient boosting machine; XGB, extreme gradient boosting.
2.2 Data collection
In the EPR systems of our institution, a database platform was established by extracting medical records from the hospital information system, picture archiving, and communication system, laboratory information system, and care anesthesia system. The medical data chosen for our analysis were extracted from this database platform in our hospital and were grouped into the following categories: (1) Demographics: age of recipient, gender and body mass index (BMI); (2) Etiology for liver transplantation: hepatitis, hepatocellular carcinoma, alcoholic liver cirrhosis, acute hepatic failure, cholestatic liver cirrhosis, genetic metabolic diseases and other reasons; (3) Comorbidities: hypertension, diabetes mellitus, cardiovascular disease, chronic kidney disease, cerebrovascular disease, bronchiectasis, old tuberculosis, chronic obstructive pulmonary disease (COPD), pulmonary hypertension, lung infection, pulmonary nodules, smoking history and alcohol history; (4) Complications and treatments: use of preoperative continuous renal replacement therapy (CRRT), plasma exchange (PE) and respirator, hepato-pulmonary syndrome, hepato-renal syndrome, pleural effusion, spontaneous bacterial peritonitis, hepatic encephalopathy, thrombogenesis, esophageal and gastric varices, model for end-stage liver disease (MELD) score and Child–Turcotte–Pugh score; (5) Laboratory results: white blood cells, red blood cells, platelet, hemoglobin, aspartate transaminase, alanine transaminase, albumin, total bilirubin, concentration of K+, Na+, Ca2+, Cl−, HCO3− in blood, blood glucose, creatinine, urea nitrogen, fibrinogen, prothrombin time and international normalized ratio; (6) Surgery and anesthesia characteristics: operation time, anesthesia time, cold ischemic time and anhepatic phase time; (7) Intraoperative fluid administration and transfusions: crystalloid, colloid, sodium bicarbonate, albumin, urine output, standardize urinary output, blood loss, ascites removal, the total amount, the total output, red blood cell transfusion, fresh frozen plasma transfusion, cryoprecipitate transfusion and platelet transfusion. A total of 72 potential perioperative predictive variables were included in the initial analysis.
2.3 Variable selection
To reduce the effects of overfitting during training for the model performance, we implemented a univariate analysis to filter out the 39 statistically significant features among the 72 variables. The statistically significant features in the univariate analysis were screened by 5-fold cross-validation (Liu et al., 2019) and the recursive feature elimination (RFE) method embedded with random forest (Li et al., 2024), which was trained on the above variables. The least important variables were then recursively removed. We finally selected the subset of variables with the highest F1-value to develop machine learning prediction models. As shown in Figure 2, the results showed that the model performed best when the number of features was nine. Therefore, the nine features included the age of the recipient, BMI, MELD score, total bilirubin, prothrombin time, operation time, standard urine volume, total intake volume, and red blood cell infusion volume. In addition, the rank of feature importance was determined.
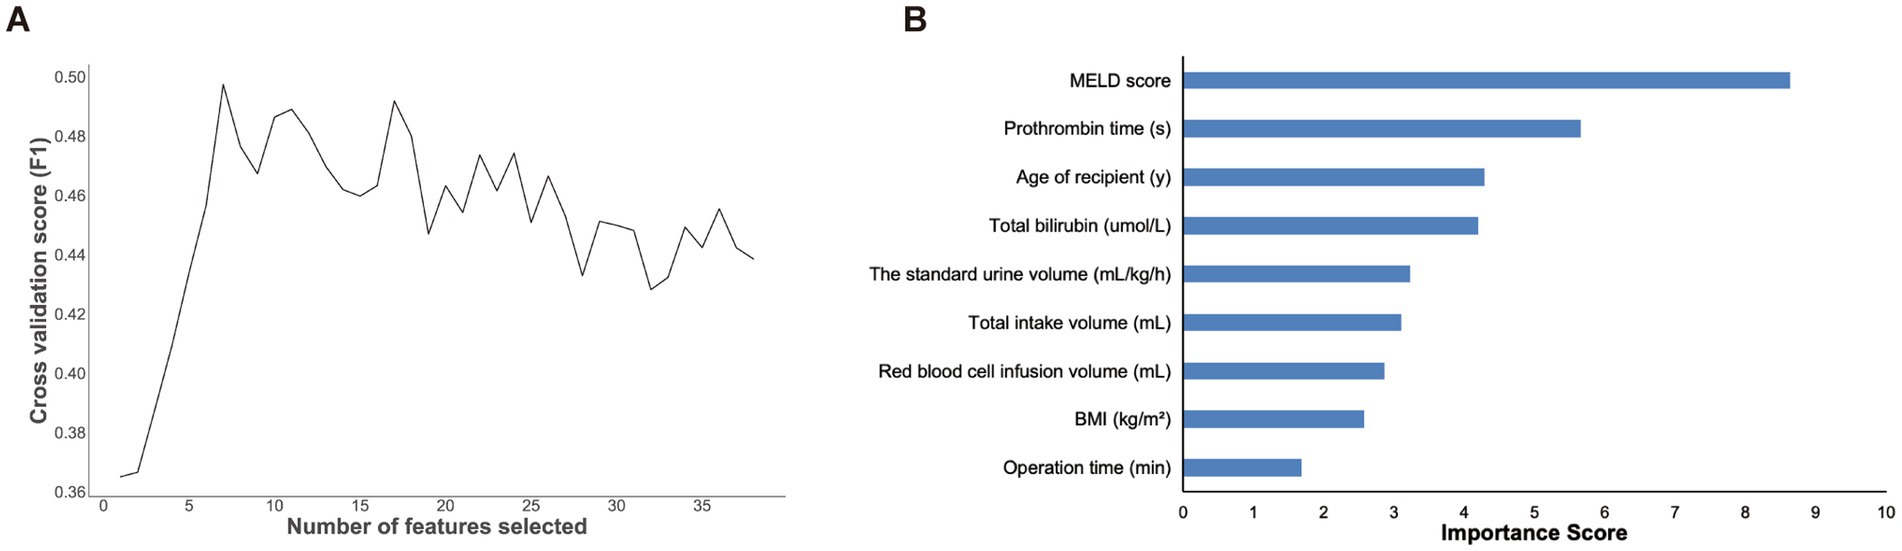
Figure 2. The results of features screening and selection. (A) Number of features screened by RFE method. (B) Feature importance ranking of the selected nine features illustrated by random forest. MELD, model for end-stage liver Disease; BMI, body mass index.
2.4 Classification algorithms
To systematically evaluate the predictive capacity of machine learning (ML) in post-LT ARDS, we implemented seven algorithms representing diverse computational paradigms. These models were selected based on their established performance in medical data analysis, methodological heterogeneity, and ability to address clinical challenges such as imbalanced outcomes and feature interactions (Haug and Drazen, 2023; Liu et al., 2019). These models were developed using Scikit-learn, XGBoost, and LightGBM libraries with hyperparameters optimized through 5-fold cross-validation. Missing values were addressed via median/mode imputation consistent with clinical data preprocessing standards. The comparative optimization algorithm is outlined below.
(1) Logistic Regression (LR): A linear probabilistic model serving as the baseline for its interpretability and compatibility with traditional clinical risk scoring systems. LR provides odds ratios that align with conventional statistical analyses while accommodating nonlinear relationships via feature engineering (Zabor et al., 2022). (2) Decision Tree (DT): A rule-based classifier generating transparent decision pathways through recursive binary splitting. DT was included to establish interpretable decision thresholds and contrast performance against ensemble methods (Luo et al., 2022). (3) Random Forest (RF): An ensemble of 100 decor-related decision trees utilizing bootstrap aggregation and randomized feature subset selection. Chosen for its intrinsic overfitting resistance and ability to model complex interactions between surgical parameters and biochemical markers through feature importance ranking (Becker et al., 2023). (4) Gradient Boosting Decision Tree (GBDT): A sequential boosting algorithm optimizing prediction residuals through additive tree construction. Selected for its superior performance on imbalanced datasets via adaptive instance reweighting (Seto et al., 2022), critical given the 30.99% ARDS incidence rate. (5) Naïve Bayes (NB): A probabilistic classifier assuming conditional feature independence. Implemented for computational efficiency in real-time clinical settings and tolerance to minor data missingness (Zhang, 2016). (6) Light Gradient Boosting Machine (LGBM): High-performance gradient boosting framework employing histogram-based optimization and leaf-wise tree growth. Adopted to efficiently process temporal intraoperative variables while minimizing computational overhead (Yanagawa et al., 2024). (7) eXtreme Gradient Boosting (XGB): Regularized gradient boosting with sparsity-aware split finding and L2 penalty terms. Utilized to handle heterogeneous clinical data types while maintaining model generalizability through strict regularization constraints (Hou et al., 2020).
2.5 Model training and evaluation
The patients were randomly divided into a training dataset (80%) and a test dataset (20%). Patients from the training dataset were used to develop machine learning models. Patients from the testing dataset were used to validate and compare the performance of the developed-models. We used 5-fold cross-validation to determine the optimal hyperparameter combination of each machine learning method. The hyperparameters with the highest average validation area under the receiver operating characteristic curve (AUROC) were considered the optimal hyperparameters. Furthermore, we used 500 bootstrap resamples to calculate the 95% confidence intervals around the sample correlation estimates. Missing data were present in less than 5% of the total records. Moreover, we substituted the mean for the missing data for continuous variables and the mode for incidence variables.
The prediction capability of the machine learning models was assessed and compared according to AUROC, accuracy, specificity, sensitivity, and F1-value. Accuracy indicates the percent of correct prediction among all the samples. Specificity illustrates the correct prediction ratios of the negative samples, while sensitivity denotes the correct prediction ratios of the positive samples. The F1-value is a comprehensive evaluation index that combines precision and sensitivity.
2.6 Statistical analysis
Our analysis was performed using the Python programming language (Python Software Foundation, version 3.7.4). We expressed continuous variables as the medians (interquartile ranges) and categorical variables as numbers (percentages). Continuous variables were analyzed using the nonparametric Mann–Whitney U test and Wilcoxon W-test. Categorical variables were compared using the chi-squared test with continuity correction. Statistical significance was determined by a p-value less than 0.05.
3 Results
3.1 The basic information and prognosis of the study subjects
A total of 755 patients were included in the final cohort and were used to develop and internally validate machine learning models for predicting postoperative ARDS. It is noteworthy that ARDS occurred in 234 patients after liver transplantation, accounting for 30.99% of the study subjects, while 521 (69.01%) patients did not have ARDS. The basic clinical characteristics of the enrolled patients are presented in Table 1.
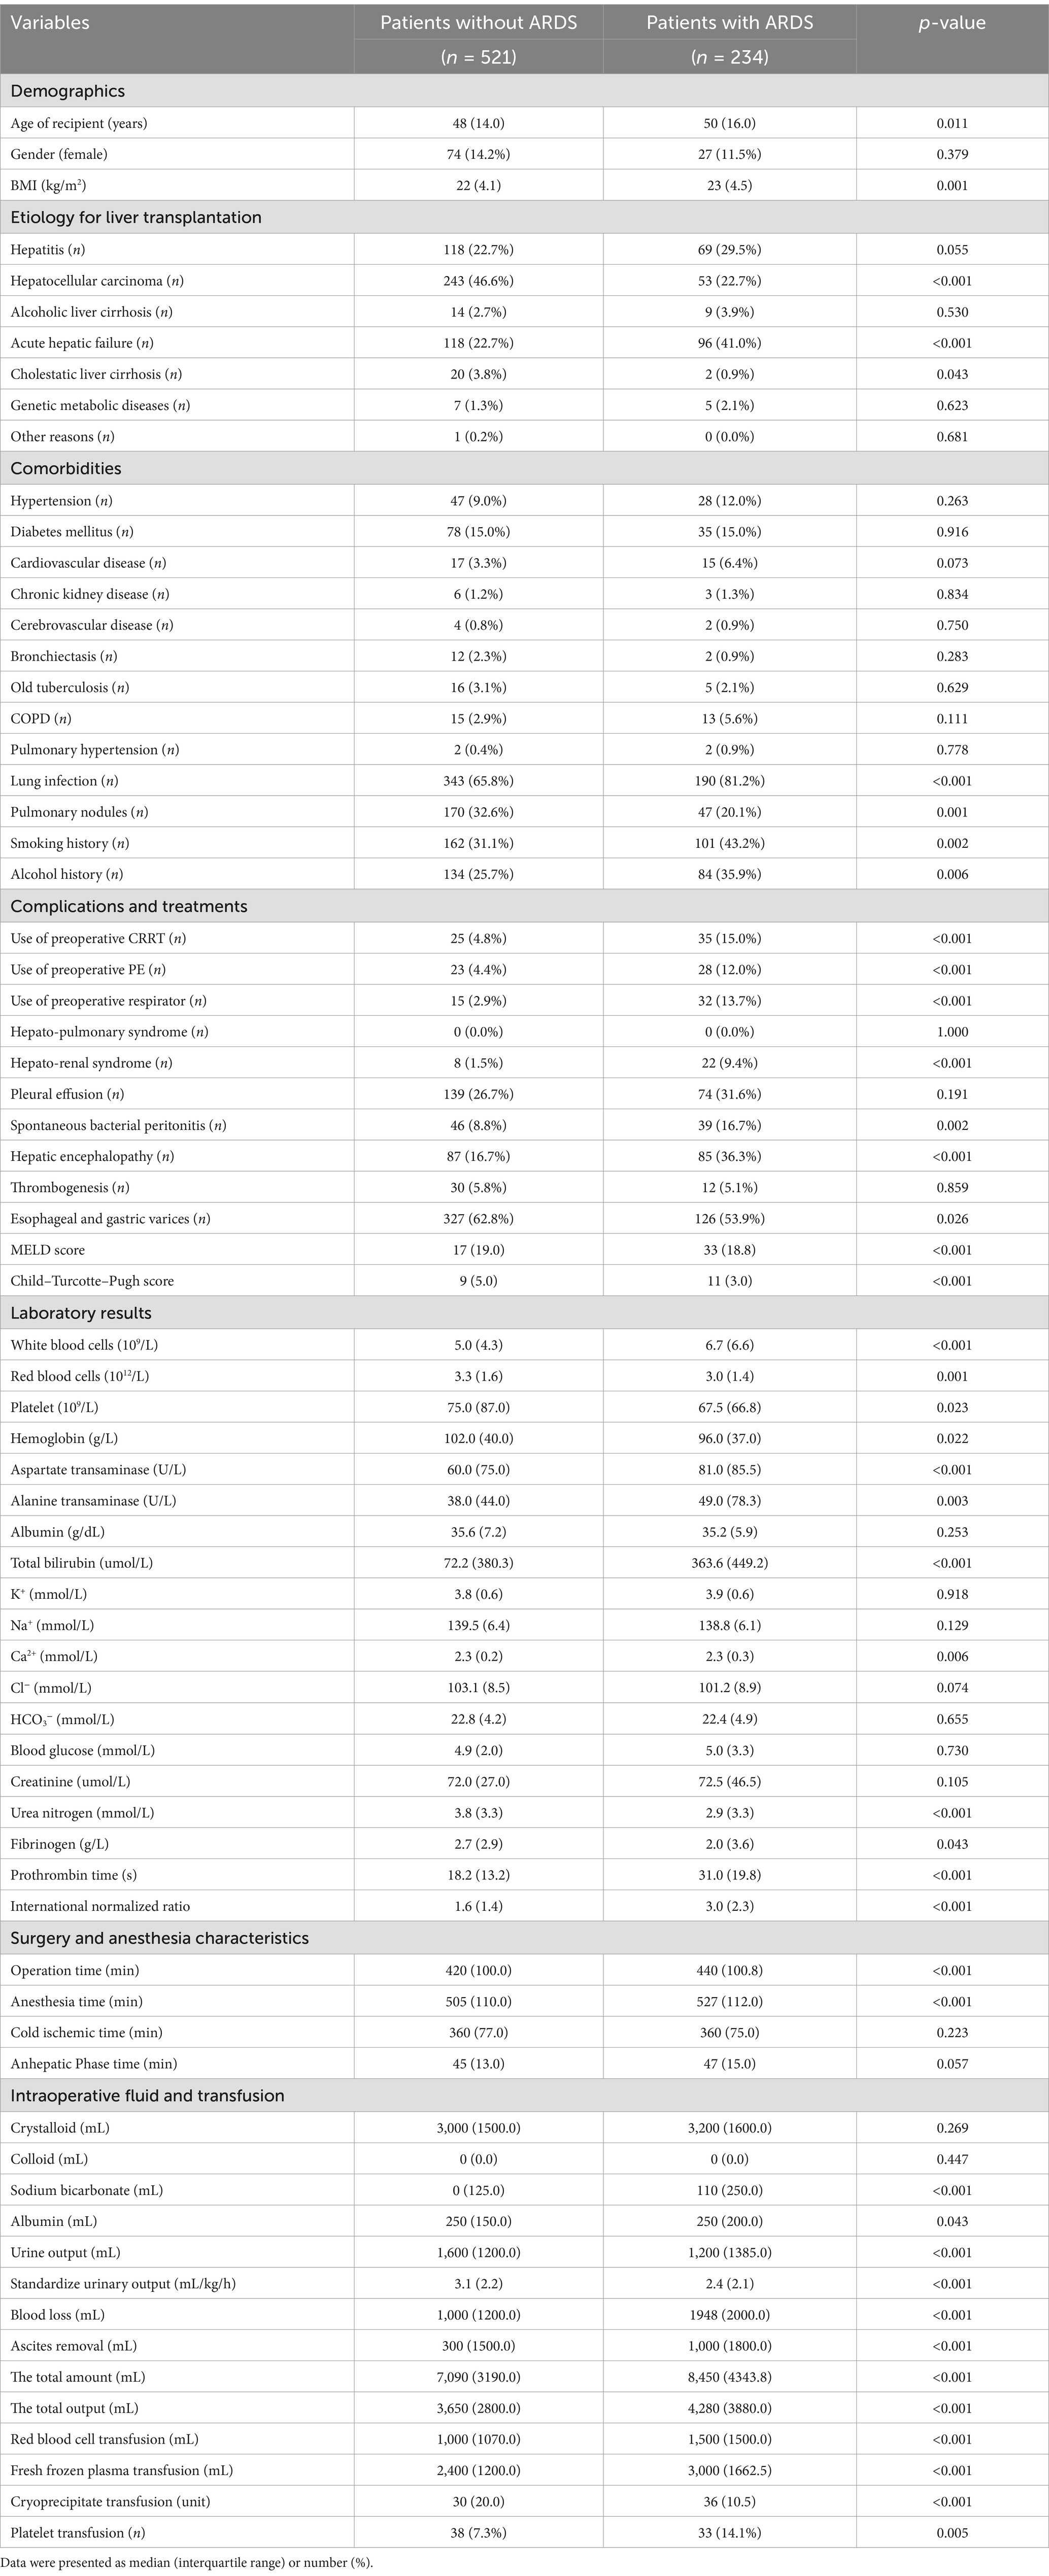
Table 1. Clinical basic characteristics.
The patients with ARDS had significantly increased ICU stay hours (169.1 vs. 79.3 h, p < 0.001), hospital stay days (26.9 vs. 24.5 d, p = 0.003), total hospitalization cost (413513.0 vs. 305144.8, p < 0.001), and decreased 7-day survival rate (94.0% vs. 98.7%, p = 0.001), 1-month survival rate (82.9% vs. 96.0%, p < 0.001), 6-month survival rate (76.5% vs. 92.7%, p < 0.001), 1-year survival rate (73.5% vs. 88.7%, p ≤ 0.001). The postoperative prognosis of the LT patients is shown in Table 2.
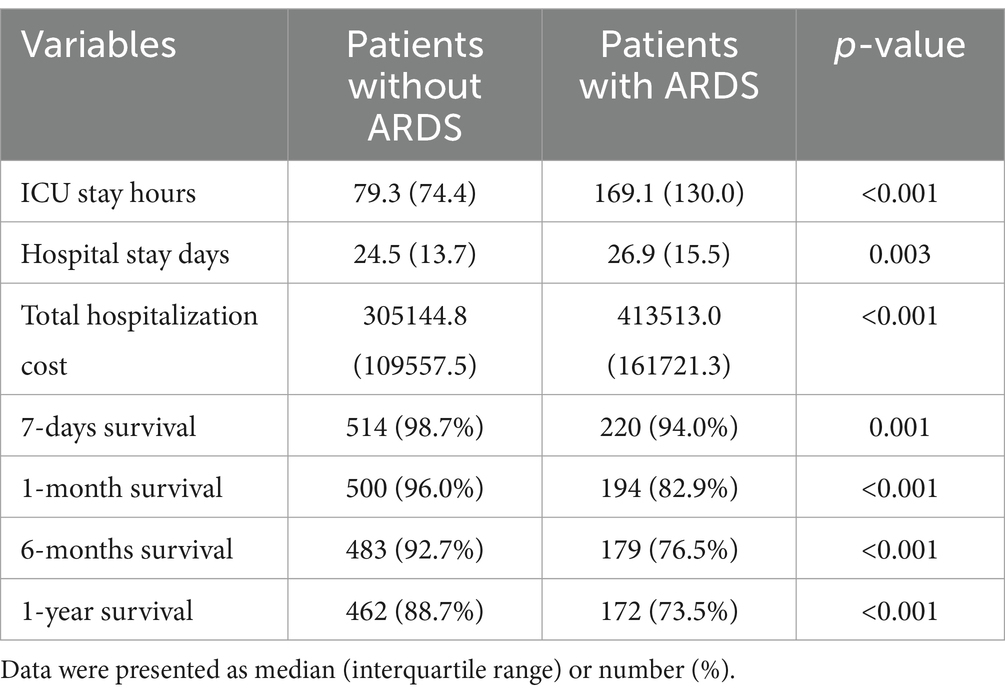
Table 2. The postoperative prognosis of LT patients.
3.2 Internal validation performance of the machine learning models
The AUROC, accuracy, specificity, sensitivity, and F1-value of the internal validation of the machine learning models are shown in Table 3 and Figure 3. Among the seven models, LGBM had the largest AUROC (0.769, 95% CI 0.699–0.830) and highest specificity (0.700, 95% CI 0.350–1.000). DT had the smallest AUROC (0.707, 95% CI 0.617–0.781). RF (0.766, 95% CI 0.693–0.825) had a better AUROC than the other models, with the exception of LGBM. XGB showed the highest accuracy (0.735, 95% CI 0.665–0.795), while LR had the lowest accuracy (0.649, 95% CI 0.579–0.715) and the highest sensitivity (0.682, 95% CI 0.548–0.814). RF had the highest F1-value (0.574, 95% CI 0.467–0.667). Since the RF model had the greatest comprehensive prediction performance in the internal validation set, we eventually chose the RF model for further analysis and application.
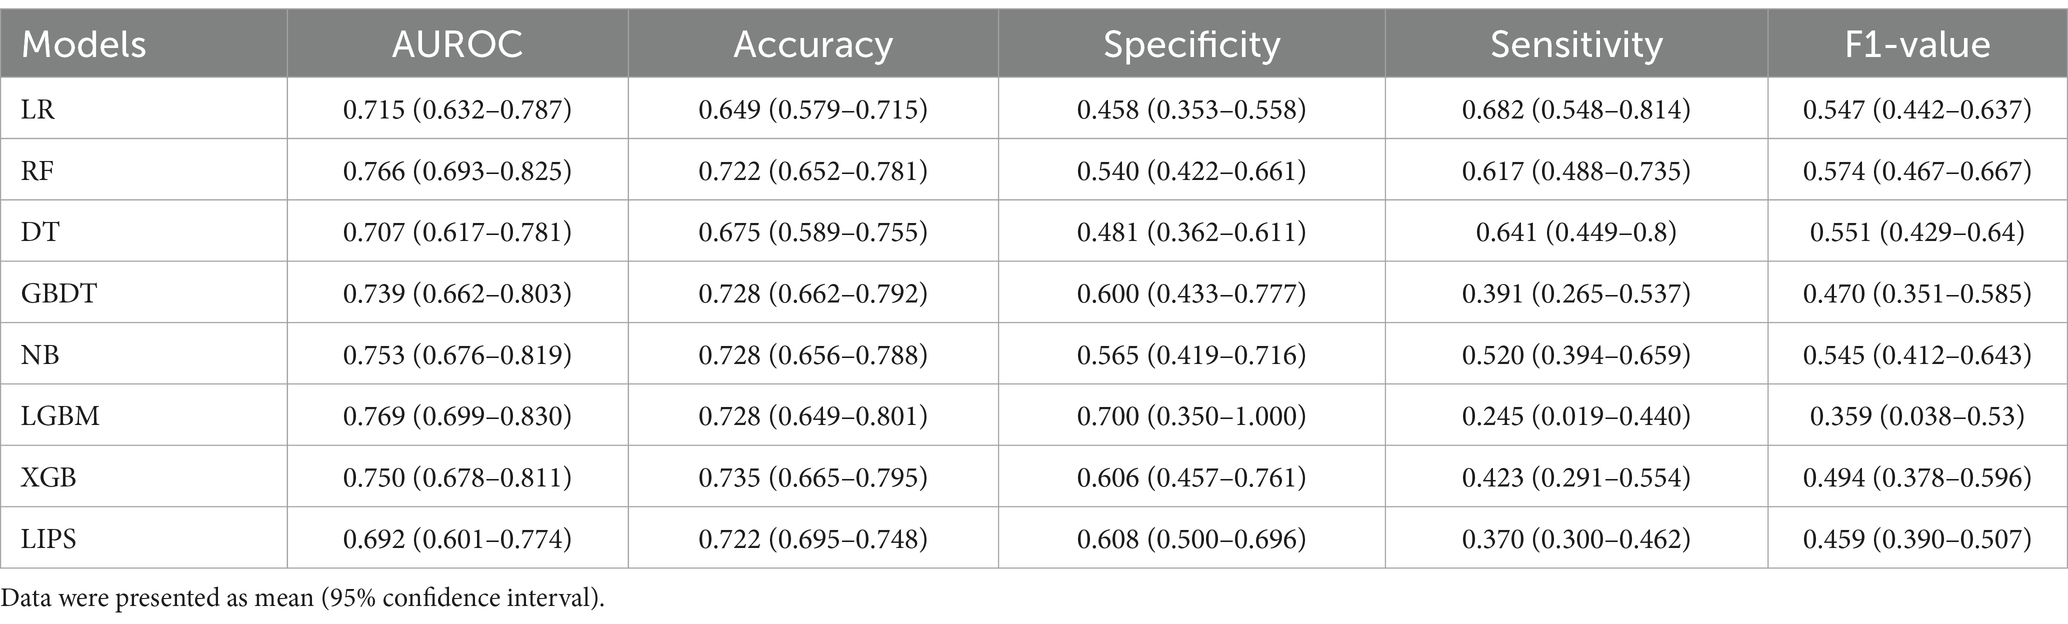
Table 3. Performance of machine learning models and LIPS in the internal validation set.
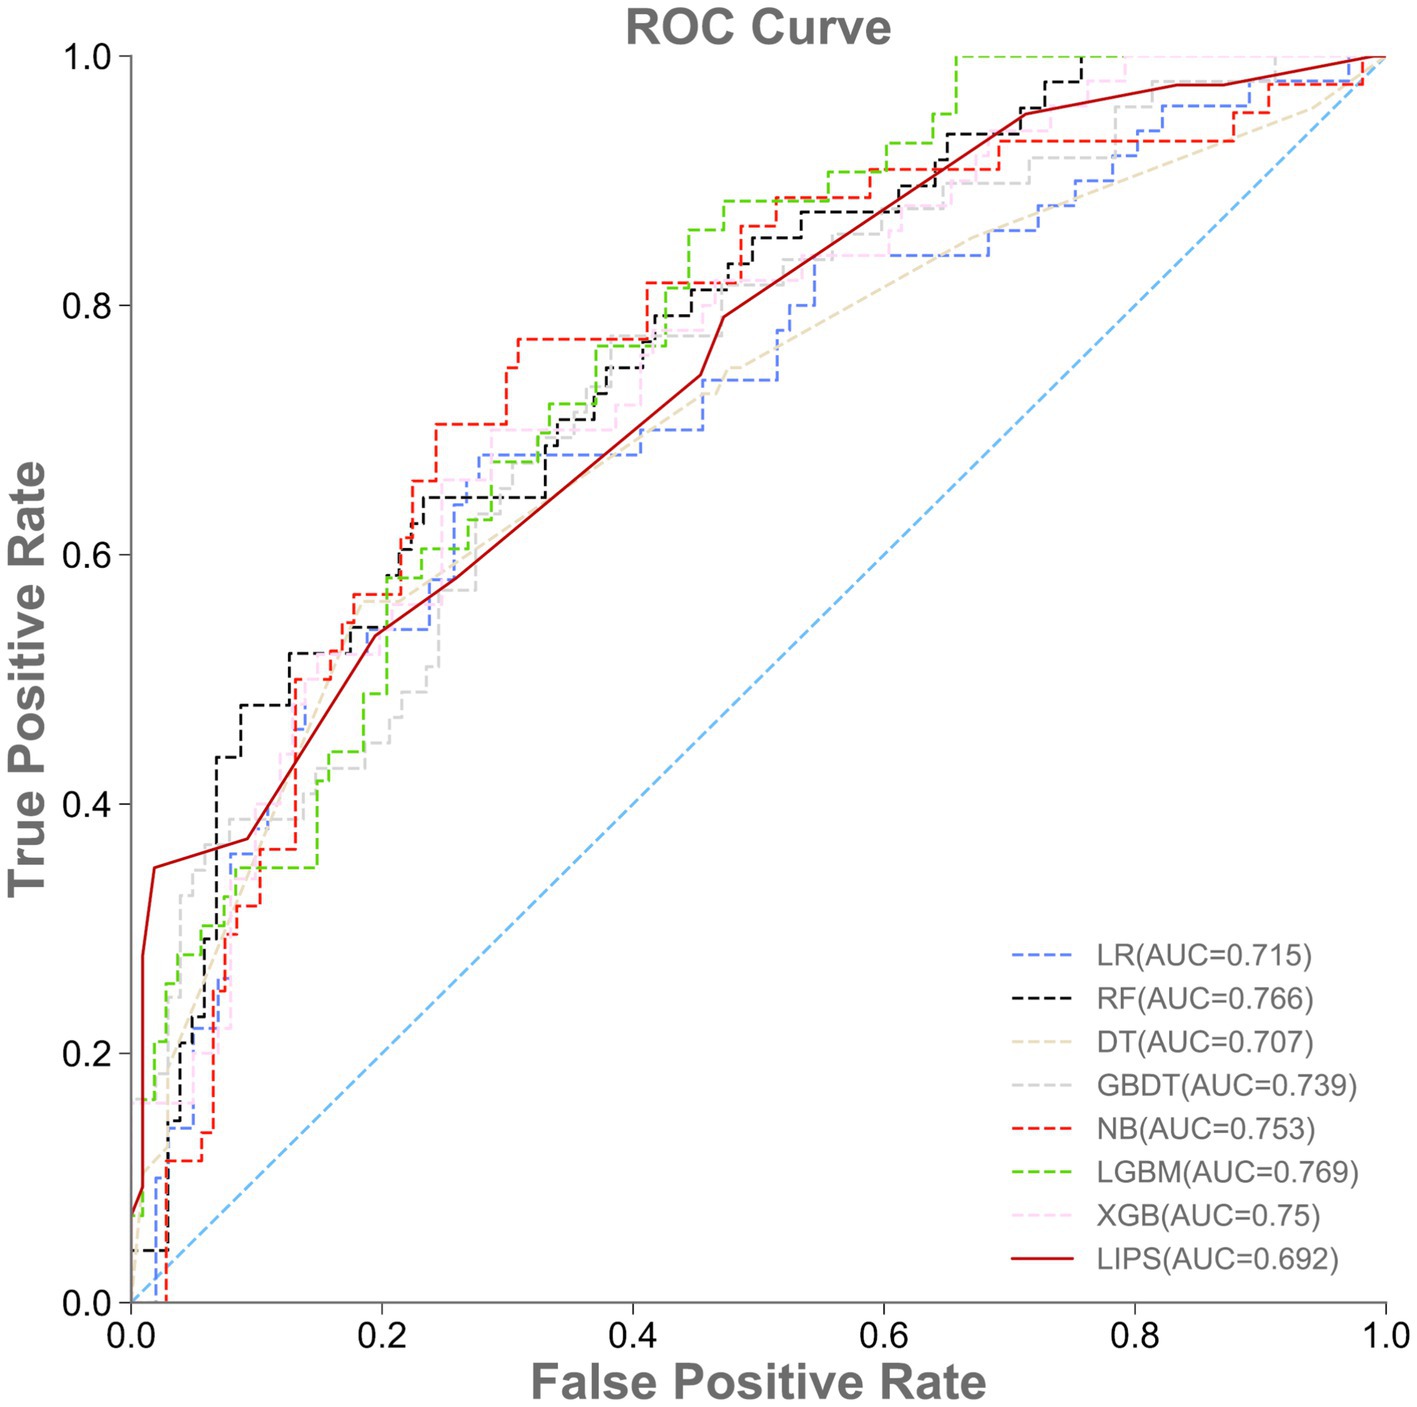
Figure 3. Performance of machine learning models and LIPS in the internal validation set. ROC, area under the receiver operating characteristic curve.
3.3 External validation performance of the machine learning models
A total of 115 patients were included in the external validation set, including 28 (24.35%) with ARDS and 87 (75.65%) without ARDS. The AUROC, accuracy, specificity, sensitivity, and F1-value of the various machine learning models are shown in Table 4 and Figure 4. Among the seven models, LGBM had the largest AUROC (0.849, 95% CI 0.831–0.865) and highest specificity (0.667, 95% CI 0.158–1.000). DT had the smallest AUROC (0.790, 95% CI 0.661–0.855). Similarly, the AUROC of the RF model (0.844, 95% CI 0.823–0.862) was better than that of the other models but worse than that of the LGBM model. NB showed the highest accuracy (0.826, 95% CI 0.817–0.835), while LR showed the lowest accuracy (0.748, 95% CI 0.713–0.783) and the highest sensitivity rate (0.821, 95% CI 0.750–0.857). RF had the highest F1-value (0.646, 95% CI 0.606–0.688). The RF model also had the best comprehensive performance for predicting ARDS after LT in the temporal validation set.
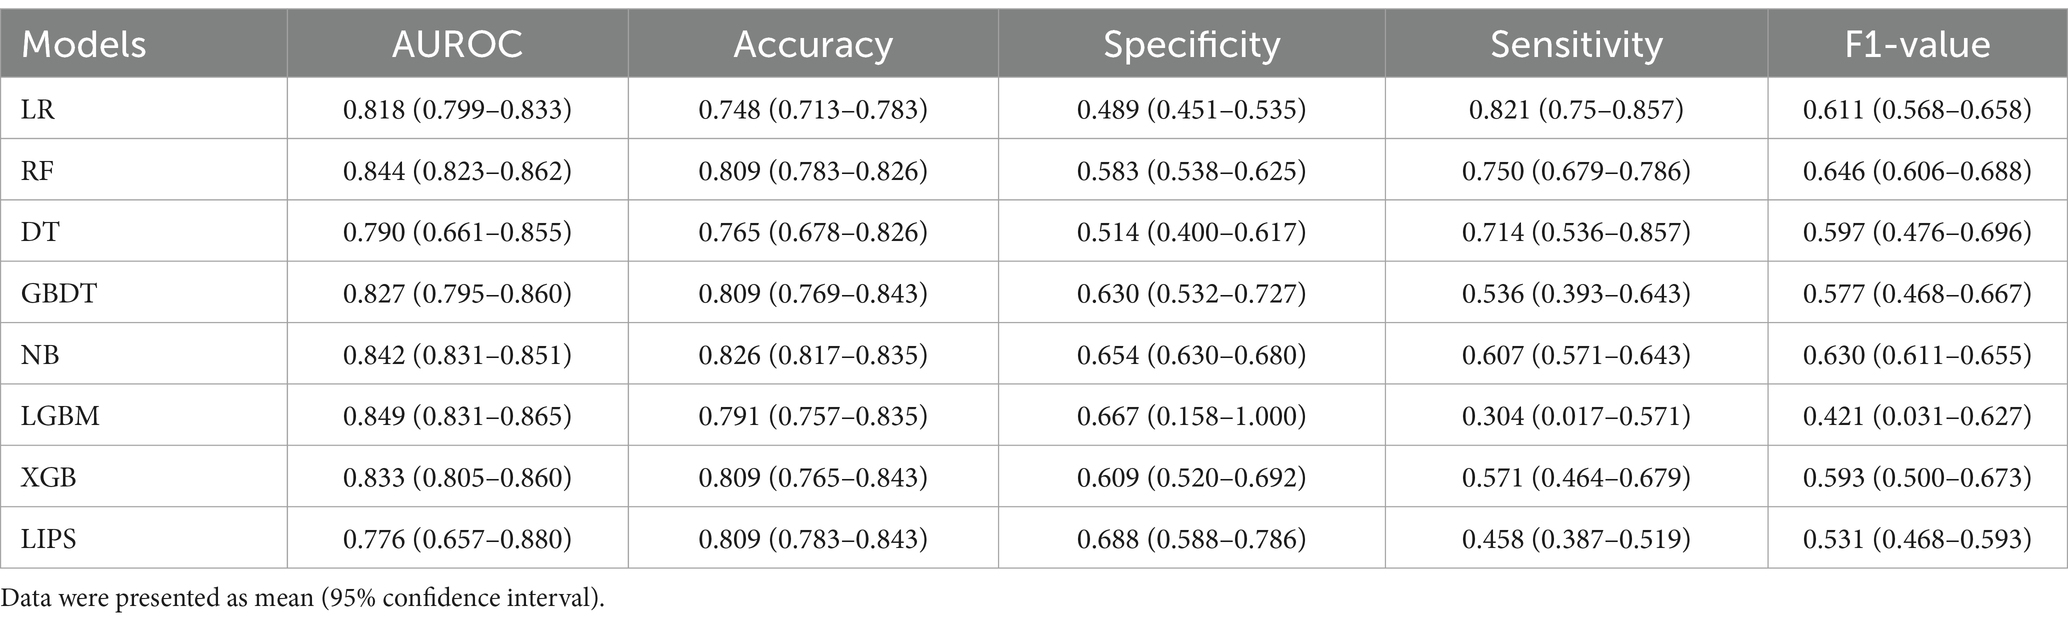
Table 4. Performance of machine learning models and LIPS in the external validation set.
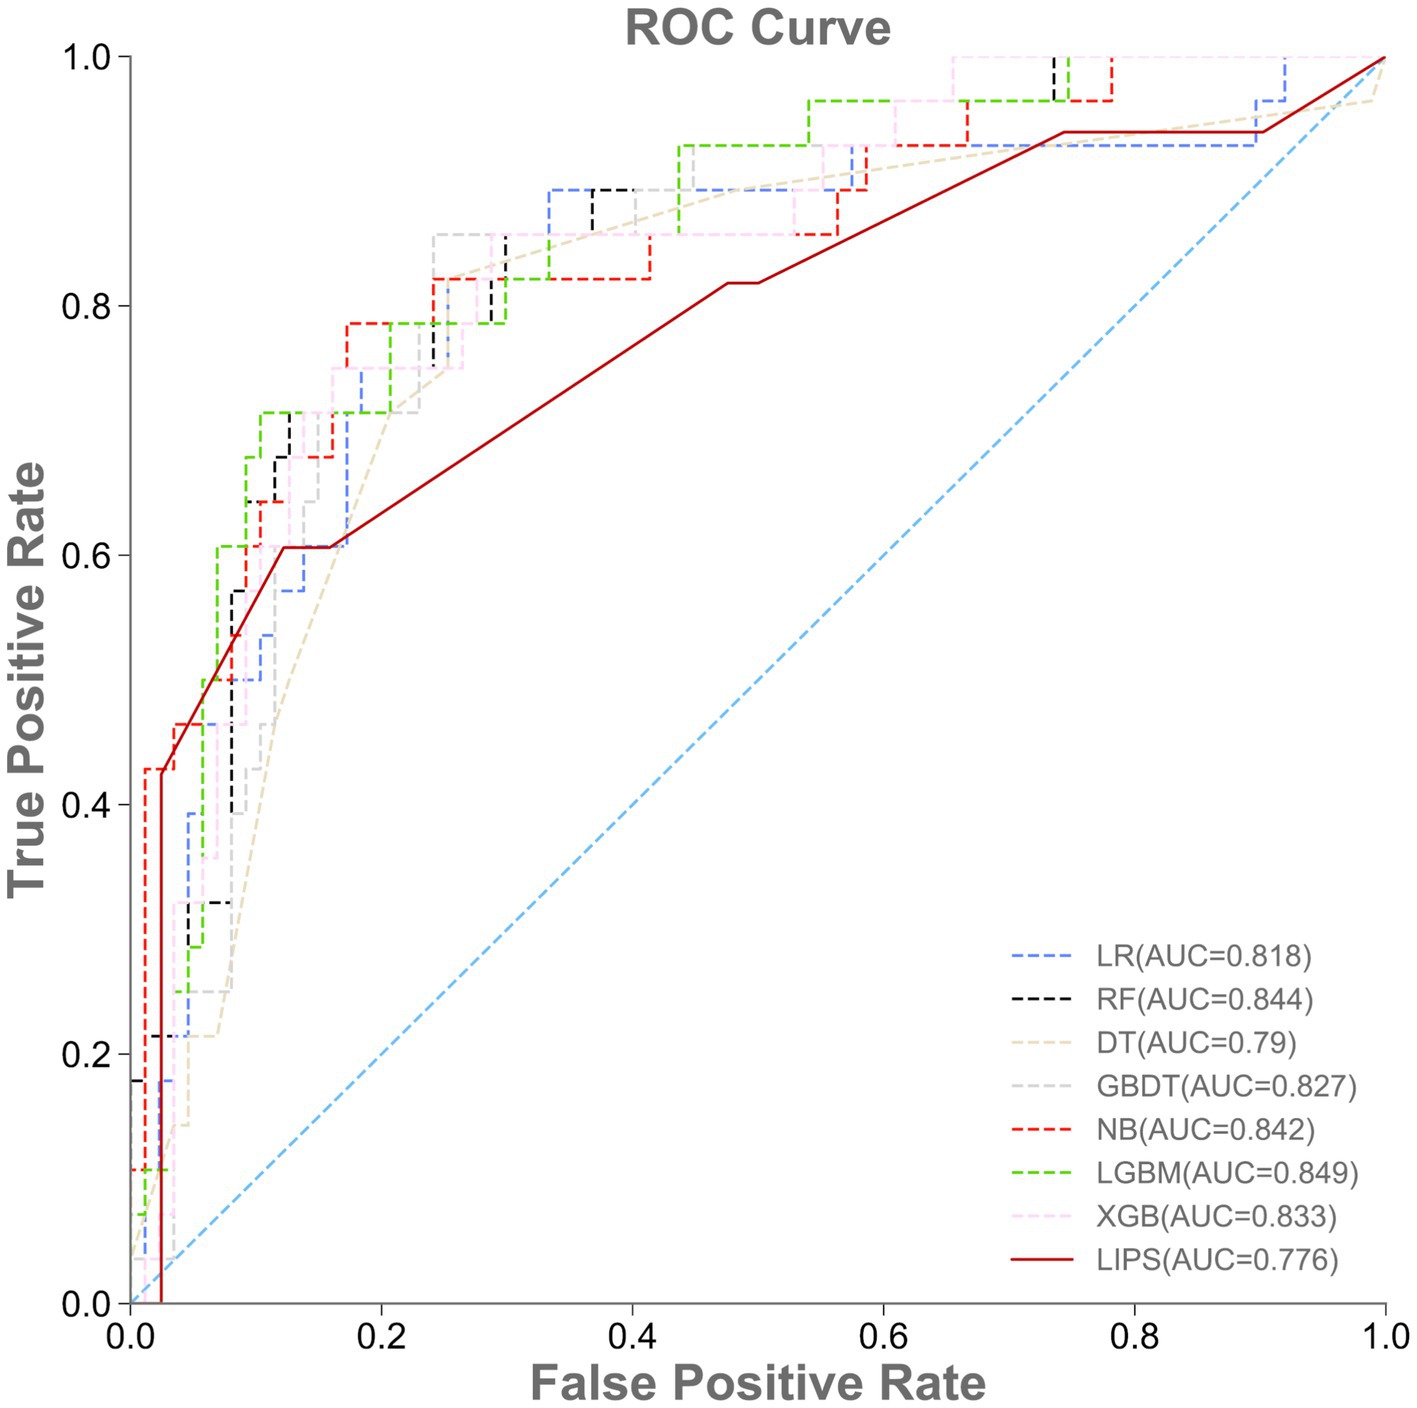
Figure 4. Performance of machine learning models and LIPS in the external validation set. ROC, area under the receiver operating characteristic curve.
3.4 Comparison of the prediction performance: the machine learning models vs. LIPS
The prediction performance of the lung injury prediction score (LIPS) in the internal validation set is shown in Table 3 and Figure 3. The AUROC was 0.692, 95% CI 0.601–0.774. The accuracy was 0.722, 95% CI 0.695–0.748. The specificity was 0.608, 95% CI 0.500–0.696; the sensitivity was 0.370, 95% CI 0.300–0.462; and the F1-value was 0.459, 95% CI 0.390–0.507. The prediction performance of the LIPS model in the temporal validation set is shown in Table 4 and Figure 4: the AUROC was 0.776, 95% CI 0.657–0.880; the accuracy was 0.809, 95% CI 0.783–0.843; the specificity was 0.688, 95% CI 0.588–0.786; the sensitivity was 0.458, 95% CI 0.387–0.519; and the F1-value was 0.531, 95% CI 0.468–0.593. Surprisingly, the prediction performance of all the machine learning models was better than that of LIPS. These results indicated the poor ability of the LIPS model to predict postoperative ARDS in LT patients.
3.5 The SHAP value and feature importance
The feature importance evaluated using the SHAP value in the RF prediction model is shown in Figure 5. MELD score, prothrombin time, and red blood cell infusion volume ranked as the top three important predictors. The transparency of the prediction made by the RF model was increased according to the SHAP summary plot. Each point represents a sample, and a wide area means a large number of samples are gathered. The color on the right indicates the value of the feature, red indicates that the feature value is high, and blue indicates that the feature value is low. Therefore, the results showed that the age of the recipient, BMI, MELD score, total bilirubin, prothrombin time, operation time, total intake volume, and red blood cell infusion volume was associated with higher SHAP value output, indicating a higher likelihood of ARDS after liver transplantation. Conversely, the standard urine volume was associated with a lower probability of postoperative ARDS. These results are consistent with what we observed in clinical practice.
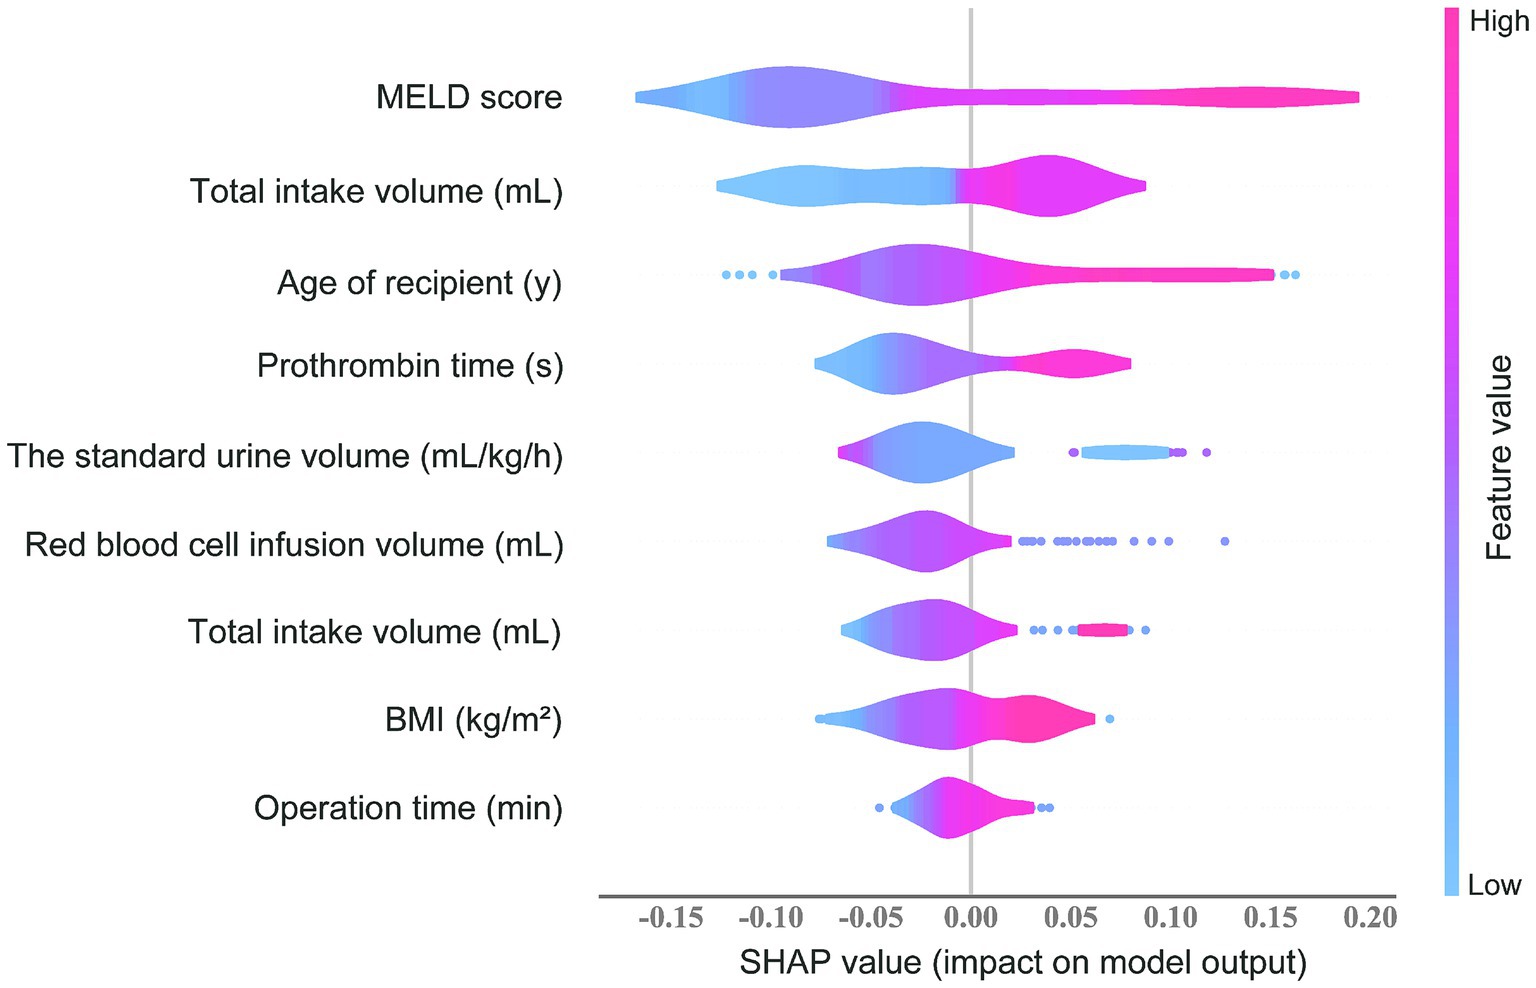
Figure 5. The SHAP value plot by combining feature importance with feature effects in RF model.
To achieve clinical application and improve clinical practice, we developed a forecasting website based on the RF model. There were nine blank inset boxes for users to input the main relevant variables, and the incidence of ARDS after LT could be calculated and shown on this page. The results were expressed as a binary outcome with the probability (%) of developing postoperative ARDS. Visit the website at http://wb.aidcloud.cn/zssy/ards.html.
4 Discussion
Early recognition and prompt medical intervention of postoperative ARDS in LT patients are imperative for diminishing the risks of ARDS progression and improving the survival rate of patients (Wu et al., 2022). A reliable and accurate prediction model is needed to improve the prognosis of ARDS after LT. In our study, for the early prediction of postoperative ARDS after LT, we developed and validated the prediction performance of seven machine learning models and LIPS. The results showed that the random forest model performed optimally in predicting ARDS after LT among the above prediction models. Moreover, the RF model indicated that the age of the recipient, BMI, MELD score, total bilirubin, prothrombin time, operation time, standard urine volume, total intake volume, and red blood cell infusion volume were the nine most important weights for ARDS after LT. Based on the RF model, we developed an online risk predictor for timely detection and intervention at ICU admission, and this predictor can ultimately improve clinical practices.
In the last few decades, the current donor allocation system prioritized patients with the most severe liver disease (Lee et al., 2019), as evidenced by a large percentage of patients with multiorgan dysfunction and high MELD scores in our study cohort (Kim W. R. et al., 2021). Therefore, various underlying respiratory disorders might be present in patients with end-stage liver disease before transplantation. Our study showed that the length of ICU stay, postoperative hospital stay, hospitalization cost, and mortality rate in LT patients suffering from ARDS were increased significantly. The findings of the present study were consistent with those of previous studies (Ripoll et al., 2020). Notably, our results demonstrated that the incidence of ARDS was 30.99%. However, the studies available in the literature with a comparable LT population reported an incidence of ARDS of less than 5% after the introduction of the Berlin definition (Ripoll et al., 2020; Zhao et al., 2016). One probable reason was that the proportion of LT patients with severe hepatitis and acute liver failure in our center was significantly higher than the proportion of patients in the above two studies. Higher degrees of hepatic impairment resulted in a higher incidence of postoperative ARDS (Ketcham et al., 2020).
To date, ML prediction models have already shown excellent performance in predicting diseases and clinical conditions, and personalized risk probabilities could be generated for each patient (Abdullah, 2024; Maddali et al., 2022). These models could provide decision-support tools to assist clinicians in targeting interventions (Cheng et al., 2025). After the development and validation of various machine learning models, our study showed that the RF model had the best performance in both internal (AUROC: 0.766) and external validation (AUROC: 0.844) for predicting ARDS after LT. This can be attributed to RF’s ensemble structure, which aggregates predictions from multiple decision trees to minimize overfitting, and its ability to handle nonlinear relationships through feature importance ranking. In contrast, simpler models like LR and DT showed lower sensitivity and specificity, likely due to their linear assumptions or susceptibility to noise. LGBM achieved the highest AUROC in external validation (0.849) but exhibited lower sensitivity (0.304), suggesting a trade-off between specificity and sensitivity in imbalanced datasets. Random forest is an extension of the traditional decision tree classifier. Each tree was constructed from a random subset of the explanatory variables and a random subset of the original training data. By voting for these randomly generated trees, random forests could minimize overfitting by making the decision (Hu and Szymczak, 2023).
For statistical validation, we divided 500 repeat samples of patients into different training and test datasets (80% training and 20% test sets) and 5-fold cross-validation confirmed the robustness of RF, with tight confidence intervals for AUROC and F1-scores (Tables 3, 4). The results of the training dataset were validated using a temporal external validation set. Remarkably, in our study, some of the data distributions of the internal and temporal external validation sets had significant differences, reflecting the strong robustness and adaptability of the RF model on data with different distributions. Moreover, the wide application of structured data and database systems has created the technical foundation for applying complex big data algorithms in clinical settings (Swinckels et al., 2024). In this study, the perioperative database system included a variety of in-hospital data such as demographic data, medical history, preoperative test and examination results, and anesthetic and surgical records, as shown in Tables 1, 2.
Previous studies have shown that a variety of risk factors are associated with postoperative ARDS (Ketcham et al., 2020; Rubulotta et al., 2024). All features of the RF model identified in our study were in accordance with previous research on the risk factors for ARDS, and these results reflect the advantage of capturing correlations between independent variables in large complex datasets and finding trends in subsets of data. Our study highlights the limitations of the LIPS model, which showed suboptimal performance in predicting post-LT ARDS (AUROC: 0.692–0.776). Unlike LIPS, which relies on linear risk scoring, ML models like RF dynamically integrate nonlinear interactions between variables (e.g., the interplay between MELD score and red blood cell transfusions). This aligns with recent literature emphasizing the superiority of ML in complex clinical scenarios. For instance, the SHAP analysis of the RF model revealed that intraoperative factors (e.g., red blood cell infusion volume) and preoperative liver dysfunction (e.g., MELD score) synergistically contribute to ARDS risk—a relationship undetectable by traditional scoring systems. These findings underscore the need for data-driven, ML-based tools in perioperative critical care. In addition, the features are routinely recorded and widely used in clinical practice, and none of these factors are obtained by special instruments or equipment, indicating that our model is feasible and suitable for use in hospitals in a wide range of settings. Although the internal mechanisms remain unclear, the high clinical relevance of these factors has established a solid foundation for the subsequent development of machine learning models and has made the conclusions clinically and practically valuable.
Finally, we developed an internet-based risk estimator based on the RF model of this study, which was easy to use for clinicians. The forecasting website could facilitate the translation and clinical application of our research findings (Li et al., 2022). Our model was able to calculate the likelihood of developing postoperative ARDS in LT patients at ICU admission, allowing the output to reflect the risk of the target event rather than just providing a binary outcome. A definite time window before the event would probably make potential intervention more realistic. However, to optimize the model performance and to improve the accuracy of risk prediction, prospective multicenter datasets should be collected to validate the prediction performance of our machine learning model in the future.
This study had several limitations. First, this study is a single-center retrospective study with a small sample size. The results need to be interpreted with caution because they lacked variables of intraoperative respiratory parameters, which might be critical. Second, it is more difficult to interpret the results of machine learning models than traditional methods. The different datasets in machine learning models might show different performances and results. Additionally, AUROC values could vary depending on the different parameters used in machine learning. The models need to correspond to the different occasions based on the requirements. Excessive prioritization of AUC values should be avoided because this might make models unreliable in real-world applications. Third, many of the important variables reported in our study are not clinically modifiable. Therefore, it is not certain that our results could turn into a viable alternative to improve the clinical outcomes of patients undergoing liver transplantation. However, personalized prevention might be appropriate based on risk information.
5 Conclusion
In conclusion, this study focused on ARDS, a life-threatening complication following liver transplantation, by constructing machine learning predictive models through the integration of multidimensional perioperative clinical data. Feature selection identified nine core predictors. Comparative analysis revealed that predictive models developed using seven machine learning algorithms demonstrated significantly superior performance to conventional pulmonary injury prediction scores, with the random forest model exhibiting optimal predictive capability. To facilitate clinical translation, we developed an online risk calculator (accessible at http://wb.aidcloud.cn/zssy/ards.html) based on the optimal model, which enables real-time individualized risk assessment through a dynamic interactive interface, thereby providing decision support for preoperative risk evaluation and intraoperative precision management. The findings not only enhance understanding of risk factors for post-transplant ARDS but more importantly establish a clinically applicable intelligent early-warning system, demonstrating substantial practical implications for improving patient prognosis.
Data availability statement
The raw data supporting the conclusions of this article will be made available by the authors, without undue reservation.
Ethics statement
The studies involving humans were approved by Medical Ethics Committee, The Third Affiliated Hospital of Sun Yat-sen University. The studies were conducted in accordance with the local legislation and institutional requirements. The participants provided their written informed consent to participate in this study.
Author contributions
WW: Conceptualization, Data curation, Formal analysis, Funding acquisition, Investigation, Methodology, Resources, Software, Visualization, Writing – original draft. ZZ: Formal analysis, Funding acquisition, Resources, Visualization, Writing – review & editing. SW: Data curation, Formal analysis, Resources, Writing – original draft. RX: Data curation, Validation, Writing – original draft. DY: Software, Visualization, Writing – original draft. WY: Conceptualization, Methodology, Supervision, Writing – review & editing. ZH: Conceptualization, Investigation, Methodology, Supervision, Writing – review & editing. CC: Conceptualization, Formal analysis, Writing – review & editing. GL: Funding acquisition, Project administration, Supervision, Validation, Writing – review & editing.
Funding
The author(s) declare that financial support was received for the research and/or publication of this article. This study was supported by the Special Support Project of Guangdong Province (Grant No. 0720240209), Science and Technology Program of Guangzhou City (No. 2024A04J4246), Joint Funds of the National Natural Science Foundation of China (No. U22A20276), Science and Technology Planning Project of Guangdong Province-Regional Innovation Capacity and Support System Construction (No. 2023B110006), “Five and five” Project of the Third Affiliated Hospital of Sun Yat-Sen University (No. 2023WW501), Basic and Applied Basic Research Foundation of Guangdong Province (Grant No. 2021A1515111153, 2022A1515012611), and the Guangzhou Basic and Applied Basic Research Foundation (Grant No. 202102020167).
Acknowledgments
We greatly appreciate the cooperation in data processing and model building provided by Mr. Xiang Liu and his colleagues from Guangzhou AID Cloud Technology Co., Ltd. Meanwhile, we would like to thank Prof. Yang Yang and Prof. Hui Zhao from the Department of Liver Transplant of our hospital, who have authorized access to the China Organ Transplant Response Systems for their kind help in collecting and collating the data of the donors. We also give our cordial gratitude to Mr. Shilong Gao from the Department of Information of our hospital for his help in providing access to data extraction.
Conflict of interest
DY was employed by Guangzhou AID Cloud Technology Co., LTD.
The remaining authors declare that the research was conducted in the absence of any commercial or financial relationships that could be construed as a potential conflict of interest.
Generative AI statement
The authors declare that no Gen AI was used in the creation of this manuscript.
Publisher’s note
All claims expressed in this article are solely those of the authors and do not necessarily represent those of their affiliated organizations, or those of the publisher, the editors and the reviewers. Any product that may be evaluated in this article, or claim that may be made by its manufacturer, is not guaranteed or endorsed by the publisher.
Abbreviations
ARDS, Acute Respiratory Distress Syndrome; ICU, Intensive Care Unit; LR, Logistic Regression; DT, Decision Tree; RF, Random Forest; GBDT, Gradient Boosting Decision Tree; NB, Naïve Bayes; LGBM, Light Gradient Boosting Machine; XGB, eXtreme Gradient Boosting; LIPS, Lung Injury Prediction Score; MELD, Model for End-stage Liver Disease; SpO2, Saturation of Peripheral Oxygen; FiO2, Fraction of Inspiration O2; BMI, Body Mass Index; RFE, Recursive Feature Elimination; SHAP, SHapley Additive exPlanations; ALI, Acute Lung Injury; AUROC, Area Under the Receiver Operating Characteristic curve.
References
Abdullah, M. (2024). Artificial intelligence-based framework for early detection of heart disease using enhanced multilayer perceptron. Front Artif Intell 7:1539588. doi: 10.3389/frai.2024.1539588
Bayman, E. O., and Dexter, F. (2021). Multicollinearity in logistic regression models. Anesth. Analg. 133, 362–365. doi: 10.1213/ane.0000000000005593
Becker, T., Rousseau, A. J., Geubbelmans, M., Burzykowski, T., and Valkenborg, D. (2023). Decision trees and random forests. Am. J. Orthod. Dentofacial Orthop. 164, 894–897. doi: 10.1016/j.ajodo.2023.09.011
Bhat, M., Rabindranath, M., Chara, B. S., and Simonetto, D. A. (2023). Artificial intelligence, machine learning, and deep learning in liver transplantation. J. Hepatol. 78, 1216–1233. doi: 10.1016/j.jhep.2023.01.006
Cheng, W., Yu, C., and Liu, X. (2025). Construction of a prediction and visualization system for cognitive impairment in elderly COPD patients based on self-assigning feature weights and residual evolution model. Front Artif Intell 8:1473223. doi: 10.3389/frai.2025.1473223
Feltracco, P., Carollo, C., Barbieri, S., Pettenuzzo, T., and Ori, C. (2013). Early respiratory complications after liver transplantation. World J. Gastroenterol. 19, 9271–9281. doi: 10.3748/wjg.v19.i48.9271
Gorman, E. A., O'Kane, C. M., and McAuley, D. F. (2022). Acute respiratory distress syndrome in adults: diagnosis, outcomes, long-term sequelae, and management. Lancet 400, 1157–1170. doi: 10.1016/s0140-6736(22)01439-8
Gotlieb, N., Azhie, A., Sharma, D., Spann, A., Suo, N. J., Tran, J., et al. (2022). The promise of machine learning applications in solid organ transplantation. NPJ Digit Med 5:89. doi: 10.1038/s41746-022-00637-2
Grasselli, G., Calfee, C. S., Camporota, L., Poole, D., Amato, M. B. P., Antonelli, M., et al. (2023). ESICM guidelines on acute respiratory distress syndrome: definition, phenotyping and respiratory support strategies. Intensive Care Med. 49, 727–759. doi: 10.1007/s00134-023-07050-7
Haug, C. J., and Drazen, J. M. (2023). Artificial intelligence and machine learning in clinical medicine, 2023. N. Engl. J. Med. 388, 1201–1208. doi: 10.1056/NEJMra2302038
Hou, N., Li, M., He, L., Xie, B., Wang, L., Zhang, R., et al. (2020). Predicting 30-days mortality for MIMIC-III patients with sepsis-3: a machine learning approach using XGboost. J. Transl. Med. 18:462. doi: 10.1186/s12967-020-02620-5
Hu, J., and Szymczak, S. (2023). A review on longitudinal data analysis with random forest. Brief. Bioinform. 24:bbad002. doi: 10.1093/bib/bbad002
Ketcham, S. W., Sedhai, Y. R., Miller, H. C., Bolig, T. C., Ludwig, A., Co, I., et al. (2020). Causes and characteristics of death in patients with acute hypoxemic respiratory failure and acute respiratory distress syndrome: a retrospective cohort study. Crit. Care 24:391. doi: 10.1186/s13054-020-03108-w
Kim, B. K., Kim, S., Kim, C. Y., Kim, Y. J., Lee, S. H., Cha, J. H., et al. (2021). Predictive role of lung injury prediction score in the development of acute respiratory distress syndrome in Korea. Yonsei Med. J. 62, 417–423. doi: 10.3349/ymj.2021.62.5.417
Kim, W. R., Mannalithara, A., Heimbach, J. K., Kamath, P. S., Asrani, S. K., Biggins, S. W., et al. (2021). MELD 3.0: the model for end-stage liver disease updated for the modern era. Gastroenterology 161, 1887–1895.e4. doi: 10.1053/j.gastro.2021.08.050
Lee, J., Kim, D. G., Lee, J. Y., Lee, J. G., Joo, D. J., Kim, S. I., et al. (2019). Impact of model for end-stage liver disease score-based allocation system in Korea: a Nationwide study. Transplantation 103, 2515–2522. doi: 10.1097/tp.0000000000002755
Li, D., Li, K., Xia, Y., Dong, J., and Lu, R. (2024). Joint hybrid recursive feature elimination based channel selection and ResGCN for cross session MI recognition. Sci. Rep. 14:23549. doi: 10.1038/s41598-024-73536-z
Li, J., Liu, S., Hu, Y., Zhu, L., Mao, Y., and Liu, J. (2022). Predicting mortality in intensive care unit patients with heart failure using an interpretable machine learning model: retrospective cohort study. J. Med. Internet Res. 24:e38082. doi: 10.2196/38082
Liu, Y., Chen, P. C., Krause, J., and Peng, L. (2019). How to read articles that use machine learning: Users' guides to the medical literature. JAMA 322, 1806–1816. doi: 10.1001/jama.2019.16489
Luo, X., Wen, X., Zhou, M., Abusorrah, A., and Huang, L. (2022). Decision-tree-initialized dendritic neuron model for fast and accurate data classification. IEEE Trans Neural Netw Learn Syst 33, 4173–4183. doi: 10.1109/tnnls.2021.3055991
Maddali, M. V., Churpek, M., Pham, T., Rezoagli, E., Zhuo, H., Zhao, W., et al. (2022). Validation and utility of ARDS subphenotypes identified by machine-learning models using clinical data: an observational, multicohort, retrospective analysis. Lancet Respir. Med. 10, 367–377. doi: 10.1016/s2213-2600(21)00461-6
Oh, E. J., Kim, J., Kim, B. G., Han, S., Ko, J. S., Gwak, M. S., et al. (2023). Intraoperative factors modifying the risk of postoperative pulmonary complications after living donor liver transplantation. Transplantation 107, 1748–1755. doi: 10.1097/tp.0000000000004544
Ranieri, V. M., Rubenfeld, G. D., Thompson, B. T., Ferguson, N. D., Caldwell, E., Fan, E., et al. (2012). Acute respiratory distress syndrome: the Berlin definition. JAMA 307, 2526–2533. doi: 10.1001/jama.2012.5669
Ripoll, J. G., Wanta, B. T., Wetzel, D. R., Frank, R. D., Findlay, J. Y., and Vogt, M. N. P. (2020). Association of perioperative variables and the acute respiratory distress syndrome in liver transplant recipients. Transplant. Direct 6:e520. doi: 10.1097/txd.0000000000000965
Rubulotta, F., Bahrami, S., Marshall, D. C., and Komorowski, M. (2024). Machine learning tools for acute respiratory distress syndrome detection and prediction. Crit. Care Med. 52, 1768–1780. doi: 10.1097/ccm.0000000000006390
Samuel, D., De Martin, E., Berg, T., Berenguer, M., Burra, P., Fondevila, C., et al. (2024). EASL clinical practice guidelines on liver transplantation. J. Hepatol. 81, 1040–1086. doi: 10.1016/j.jhep.2024.07.032
Seto, H., Oyama, A., Kitora, S., Toki, H., Yamamoto, R., Kotoku, J., et al. (2022). Gradient boosting decision tree becomes more reliable than logistic regression in predicting probability for diabetes with big data. Sci. Rep. 12:15889. doi: 10.1038/s41598-022-20149-z
Swinckels, L., Bennis, F. C., Ziesemer, K. A., Scheerman, J. F. M., Bijwaard, H., de Keijzer, A., et al. (2024). The use of deep learning and machine learning on longitudinal electronic health records for the early detection and prevention of diseases: scoping review. J. Med. Internet Res. 26:e48320. doi: 10.2196/48320
Tariparast, P. A., Roedl, K., Horvatits, T., Drolz, A., Kluge, S., and Fuhrmann, V. (2025). Impact of acute respiratory distress syndrome on outcome in critically ill patients with liver cirrhosis. Sci. Rep. 15:4301. doi: 10.1038/s41598-025-88606-z
Tran, J., Sharma, D., Gotlieb, N., Xu, W., and Bhat, M. (2022). Application of machine learning in liver transplantation: a review. Hepatol. Int. 16, 495–508. doi: 10.1007/s12072-021-10291-7
Tran, T. K., Tran, M. C., Joseph, A., Phan, P. A., Grau, V., and Farmery, A. D. (2024). A systematic review of machine learning models for management, prediction and classification of ARDS. Respir. Res. 25:232. doi: 10.1186/s12931-024-02834-x
Wei, S., Zhang, H., Li, H., Li, C., Shen, Z., Yin, Y., et al. (2025). Establishment and validation of predictive model of ARDS in critically ill patients. J. Transl. Med. 23:64. doi: 10.1186/s12967-024-06054-1
Wu, J., Liu, C., Xie, L., Li, X., Xiao, K., Xie, G., et al. (2022). Early prediction of moderate-to-severe condition of inhalation-induced acute respiratory distress syndrome via interpretable machine learning. BMC Pulm. Med. 22:193. doi: 10.1186/s12890-022-01963-7
Yanagawa, R., Iwadoh, K., Akabane, M., Imaoka, Y., Bozhilov, K. K., Melcher, M. L., et al. (2024). LightGBM outperforms other machine learning techniques in predicting graft failure after liver transplantation: creation of a predictive model through large-scale analysis. Clin. Transpl. 38:e15316. doi: 10.1111/ctr.15316
Zabor, E. C., Reddy, C. A., Tendulkar, R. D., and Patil, S. (2022). Logistic regression in clinical studies. Int. J. Radiat. Oncol. Biol. Phys. 112, 271–277. doi: 10.1016/j.ijrobp.2021.08.007
Zhang, Z. (2016). Naïve Bayes classification in R. Ann. Transl. Med. 4:241. doi: 10.21037/atm.2016.03.38
Keywords: liver transplantation, acute respiratory distress syndrome, machine learning, prediction model, random forest
Citation: Wu W, Zhang Z, Wang S, Xin R, Yang D, Yao W, Hei Z, Chen C and Luo G (2025) Novel machine learning models for the prediction of acute respiratory distress syndrome after liver transplantation. Front. Artif. Intell. 8:1548131. doi: 10.3389/frai.2025.1548131
Edited by:
Xiaorong Ding, University of Electronic Science and Technology of China, ChinaReviewed by:
Murat Kirisci, Istanbul University-Cerrahpasa, TürkiyeMichael Döllinger, University Hospital Erlangen, Germany
Copyright © 2025 Wu, Zhang, Wang, Xin, Yang, Yao, Hei, Chen and Luo. This is an open-access article distributed under the terms of the Creative Commons Attribution License (CC BY). The use, distribution or reproduction in other forums is permitted, provided the original author(s) and the copyright owner(s) are credited and that the original publication in this journal is cited, in accordance with accepted academic practice. No use, distribution or reproduction is permitted which does not comply with these terms.
*Correspondence: Gangjian Luo, bHVvZ2pAbWFpbC5zeXN1LmVkdS5jbg==; Chaojin Chen, Y2hlbmNoajI4QG1haWwuc3lzdS5lZHUuY24=
†These authors have contributed equally to this work