 Kit Prendergast
 Mark V. Murphy3
 Peter G. Kevan
 Zong-Xin Ren
- 1School of Molecular and Life Sciences, Curtin University, Bentley, WA, Australia
- 2Centre for Sustainable Agricultural Systems, University of Southern Queensland, Toowoomba, QLD, Australia
- 3School of Biological Science, University of Western Australia, Crawley, WA, Australia
- 4School of Environmental Sciences, University of Guelph, Guelph, ON, Canada
- 5Key Laboratory for Plant Diversity and Biogeography of East Asia, Kunming Institute of Botany, Chinese Academy of Sciences, Kunming, China
- 6School of Earth and Planetary Sciences, Curtin University, Bentley, WA, Australia
Introduction: In Australia, as well as many other regions of the world, European honey bees Apis mellifera are an introduced species and may harm native bee fauna by competing with them for food resources. Field studies have revealed negative associations between honey bee and native bee abundance, but whether this translates to fitness costs for native bees is unclear.
Methods: Using drilled wooden-block trap nests, we evaluated whether honey bee abundance is associated with fitness parameters (number of nests, provisioned cells per nest, offspring number, mortality rate, sex ratio, and body size) of cavity-nesting native bees over 2 years. We also conducted palynological analyses to measure pollen resource overlap and evaluate whether this impacts native bee fitness.
Results and discussion: Greater honey bee abundance was associated with a male-biased sex ratio in the native bee progeny across years and an increased mortality rate of native bee progeny in the first year. Most non-significant associations were also in the directions predicted from honey bees adversely impacting native bee fitness. In the first year, greater pollen morphospecies overlap was associated with fewer provisioned cells. In conclusion, we demonstrated that honey bees have the potential to have harmful consequences for native bee fitness.
1 Introduction
Native bees are important pollinators of flowering plants (Ollerton, 2021), which in turn provide numerous ecosystem services to ecosystems and society (Potts et al., 2016). However, there is evidence that native bees are declining globally, and this could have important consequences for pollination services (Kevan and Phillips, 2001; Biesmeijer et al., 2006; Potts et al., 2010; Pauw and Hawkins, 2011; Goulson and Nicholls, 2016; Potts et al., 2016). This global decline in pollinators and pollination services is also playing out in Australia (Pyke et al., 2023). One factor suspected to be implicated in this decline is competitive pressure for floral resources from introduced species, in particular the European honey bee Apis mellifera (Beaurepaire et al., 2025; Paini, 2004; Goulson and Sparrow, 2009; Shavit et al., 2009; Herbertsson et al., 2016; Lindström et al., 2016; Geslin et al., 2017; Layek et al., 2021). In contrast to many native bees, the European honey bee is not of global conservation concern (Herrera, 2020; Wood et al., 2020), despite media coverage to the contrary (Colla, 2022). This is especially so in Australia, where honey bees have largely avoided many diseases currently causing colony losses in Europe and the USA (Le Conte et al., 2010) and where this introduced species often dominates pollinator communities (Prendergast et al., 2021a, Prendergast et al., 2021b; Prendergast and Ollerton, 2022a; see also Prendergast et al., 2022a; and references within). The European honey bee is a eusocial species forming perennial colonies with tens of thousands of workers with high pollen and nectar requirements (Cane and Tepedino, 2016). As super-generalists, they are able to exploit a wide range of floral resources, and their communication systems make them extremely effective at foraging (Geslin et al., 2017). In contrast, most Australian native bees are solitary, and a substantial proportion are relatively specialised having co-evolved with the local flora for millions of years in isolation from other biotic influences from other continents (Batley and Hogendoorn, 2009). As such, they may be highly vulnerable to competition from honey bees (Prendergast et al., 2022a), introduced approximately 200 years ago and now spread through much of the continent as both managed and feral colonies (NSW Threatened Species Scientific Committee, 2011).
Addressing competition in observational studies requires demonstrating three criteria: 1) there is overlap in the resources used by honey bees and native bees, 2) there are negative impacts on native bee fitness where they spatially and temporally co-occur, and 3) such fitness impacts are not driven by other factors such as environmental or anthropogenic disturbances. Carefully designed trap-nesting studies can be insightful, as they allow addressing these criteria for investigating competition. Trap nests (known as “bee blocks” or “bee hotels” in popular literature) are artificial nesting resources for native bees that nest in pre-made cavities (hereafter referred to as cavity-nesting bees) (Krombein, 1967; Macivor, 2016). Constructed from drilled wooden blocks or bundles of hollow stems (Macivor, 2016; Dorey et al., 2021), they can facilitate studies of the reproductive fitness of the occupying species (e.g. Sexton et al., 2021; Knauer et al., 2022). Key fitness measures such as the number of provisioned brood cells, the number of reared offspring, and the sex ratio and body size of emerged adults can be easily quantified (Pitts-Singer and James, 2005; Peterson and Roitberg, 2006; Radmacher and Strohm, 2010). The consequences of reduced resources and/or nutrition may not be detected until the next generation, rather than in the parental generation (e.g. Gustafsson, 1987). The next generation, however, is critical when considering fitness effects, given that the currency of fitness is passing on genes. This represents a major advantage of trap-nesting studies when investigating the impacts of competition, for trap nests also enable detecting how interspecific competition may impact reproductive output and offspring parameters that contribute to future survival and reproduction such as body size.
Previous studies examining the impact of honey bees on trap-nesting bee fitness have generated mixed results. Importantly, experimental cage studies in Europe and the USA have found evidence that honey bees can reduce native bee fitness by reducing the number of nest cells completed (Hudewenz and Klein, 2015) and rates of brood cell construction (Goodell, 2000). These studies demonstrated that, in principle, competition can occur with fitness consequences for native bees. However, it remains unknown whether such findings from controlled environments can be reliably translated to real-world community effects in natural ecosystems. Two single-species studies conducted in a nature reserve in southwest Western Australia have produced conflicting results: no negative effects were observed for a generalist Megachilidae during the hottest months (Paini et al., 2005), whereas negative impacts were observed for a specialist Hylaeinae during cooler months (Paini and Roberts, 2005). Such contrasting findings for different species highlight the importance of larger-scale simultaneous multi-species studies in determining the community-wide effects of competition between honey bees and native bees.
Landscape context, such as urbanisation, is known to influence competition dynamics (Herbertsson et al., 2016; Pape Møller and Díaz, 2018). Urban areas are becoming increasingly important for the conservation of native pollinators (Prendergast et al., 2022b). However, no trap-nesting studies have examined honey bee competitive effects on native bee nesting success in urban environments, meaning that a potentially important factor contributing to the response of native bees to urbanisation remains unquantified (Macivor, 2015; Macivor and Packer, 2016; Makinson et al., 2016; Prendergast et al., 2022b). As many cities generally offer a greater diversity of flora than surrounding areas (Mckinney, 2008), it may be that honey bees can forage on a greater range of flora, thus reducing resource overlap with native bees (Carvalho et al., 2014). Alternatively, reduced native floral resources in cities (Mckinney, 2006) for native bees and the fragmented nature of resource patches may intensify competition (Aizen and Feinsinger, 1994; Prendergast et al., 2021a, Prendergast et al., 2022c). To reconcile such potentially divergent urban influences on competition, more high-quality observational studies of competitive effects in urban environments are needed, in particular those measuring a range of relevant fitness responses in addition to population changes.
Urban landscapes are furthermore highly heterogeneous and have different habitat types, which differ in their ability to support different pollinators (Dylewski et al., 2019, Dylewski et al., 2020; Zaninotto et al., 2023). In particular, within the urban matrix, there are different types of greenspaces, ranging from remnant native wildland habitat patches to managed gardens. It is known that these two habitat types differ in their ability to support native bee biodiversity, have different floristic composition, and, at least based on observations between honey bee densities and native bee densities foraging on flowers, can alter the competitive impact of honey bees (Prendergast and Ollerton, 2021; Prendergast et al., 2021a; Prendergast and Ollerton, 2022a; Prendergast et al., 2022c; Prendergast, 2023b; a). Further research is required, however, to determine if this translates into differences in fitness outcomes.
Research to date suggests that native bee taxa that have a high overlap with honey bees in the flowering plant species they forage on have reduced abundances (Paini and Roberts, 2005; Prendergast et al., 2021a). Furthermore, many native bees in Australia are highly specialised (oligolectic) such as the diverse and endemic Euryglossinae (Michener, 2007), whereas honey bees are supergeneralists and can forage in a huge diversity of flowers (Michener, 2007), including those that oligoleges rely upon (Prendergast, 2023b); this places native bees at risk of exploitative competition. However, to what extent honey bees are impacting Australian native bees remains a point of unresolved controversy (Pyke, 1990, Pyke, 1999). In Australia, results remain equivocal with positive, negative, and no associations being reported (Prendergast et al., 2021a, Prendergast et al., 2022a). The majority of these studies have examined changes in the abundance of native bees in relation to honey bees, which, due to potentially unmeasured underlying factors driving population dynamics in one or both groups (e.g. changing resource availability) (Prendergast et al., 2022a), cannot be conclusive in demonstrating competition effects.
If honey bees are outcompeting native bees via resource competition, it can be predicted that resource limitation will lead to fewer cells being produced and high mortality (Goodell, 2003). It can also be predicted that under resource limitation, female native bees will have fewer resources to provision nest cells, leading to smaller offspring (Goodell, 2003). This, in turn, can have fitness implications for these smaller-bodied progeny, as smaller-bodied bees can have lower foraging activity, wintering survival, nest provisioning rates, fecundity, and mating success (Sugiura, 1991; Alcock and Houston, 1996; Kim, 1997; Kapustjanskij et al., 2007; Bosch, 2008; O’neill et al., 2014). Reduced resource availability or quality experienced by native bees when faced with resource competition may also lead to a biased sex ratio towards the “less expensive sex” (Hoogland, 1981). In the majority of bee species, females are the larger sex, and so variation in the distribution of resources can be predicted to impact the sex ratio (Frank, 1995). Indeed, this has been previously demonstrated for a solitary cavity-nesting bee species with larger females than males, which, therefore, requires less investment to produce a viable son compared with a daughter. Faced with resource challenges, females of these species produced a greater proportion of sons (Peterson et al., 2006). Ongoing male-biased sex ratios can compound loss of reproductive potential, and in bees, having haplodiploid sex determination, populations suffering from small population size and inbreeding depression, can result in detrimental diploid male production instead of female offspring, leading to population declines (Zayed and Packer, 2005). Due to honeybees depleting resources through exploitative competition, females may also have to forage for longer durations per foraging trip to find enough resources, leading to increased nest parasitism (Goodell, 2003). This is because for solitary female bees, the longer a female spends away from the nest, the greater the risk that a parasitoid will attack the nest.
The aim of this study was to assess how honey bee density in urban areas influenced the fitness of cavity-nesting bees, as measured in terms of nest occupancy, number of provisioned cells in each nest, number of offspring to emerge as adults, mortality rate, sex ratio, body size of emerged adults for each sex, and parasitism. We also investigated the contemporaneous overlap in pollen use between honey bees and cavity-nesting native bees and determined if resource overlap influenced native bees’ fitness. We hypothesised that greater honey bee densities at a site would result in fewer native bee nests, fewer provisioned brood cells and offspring, a male-biased sex ratio, smaller offspring, and increased mortality rates and parasitism (Figure 1). We also hypothesised that greater resource overlap in pollen use between native bees and honey bees would increase the likelihood of observing these negative impacts (Figure 1).
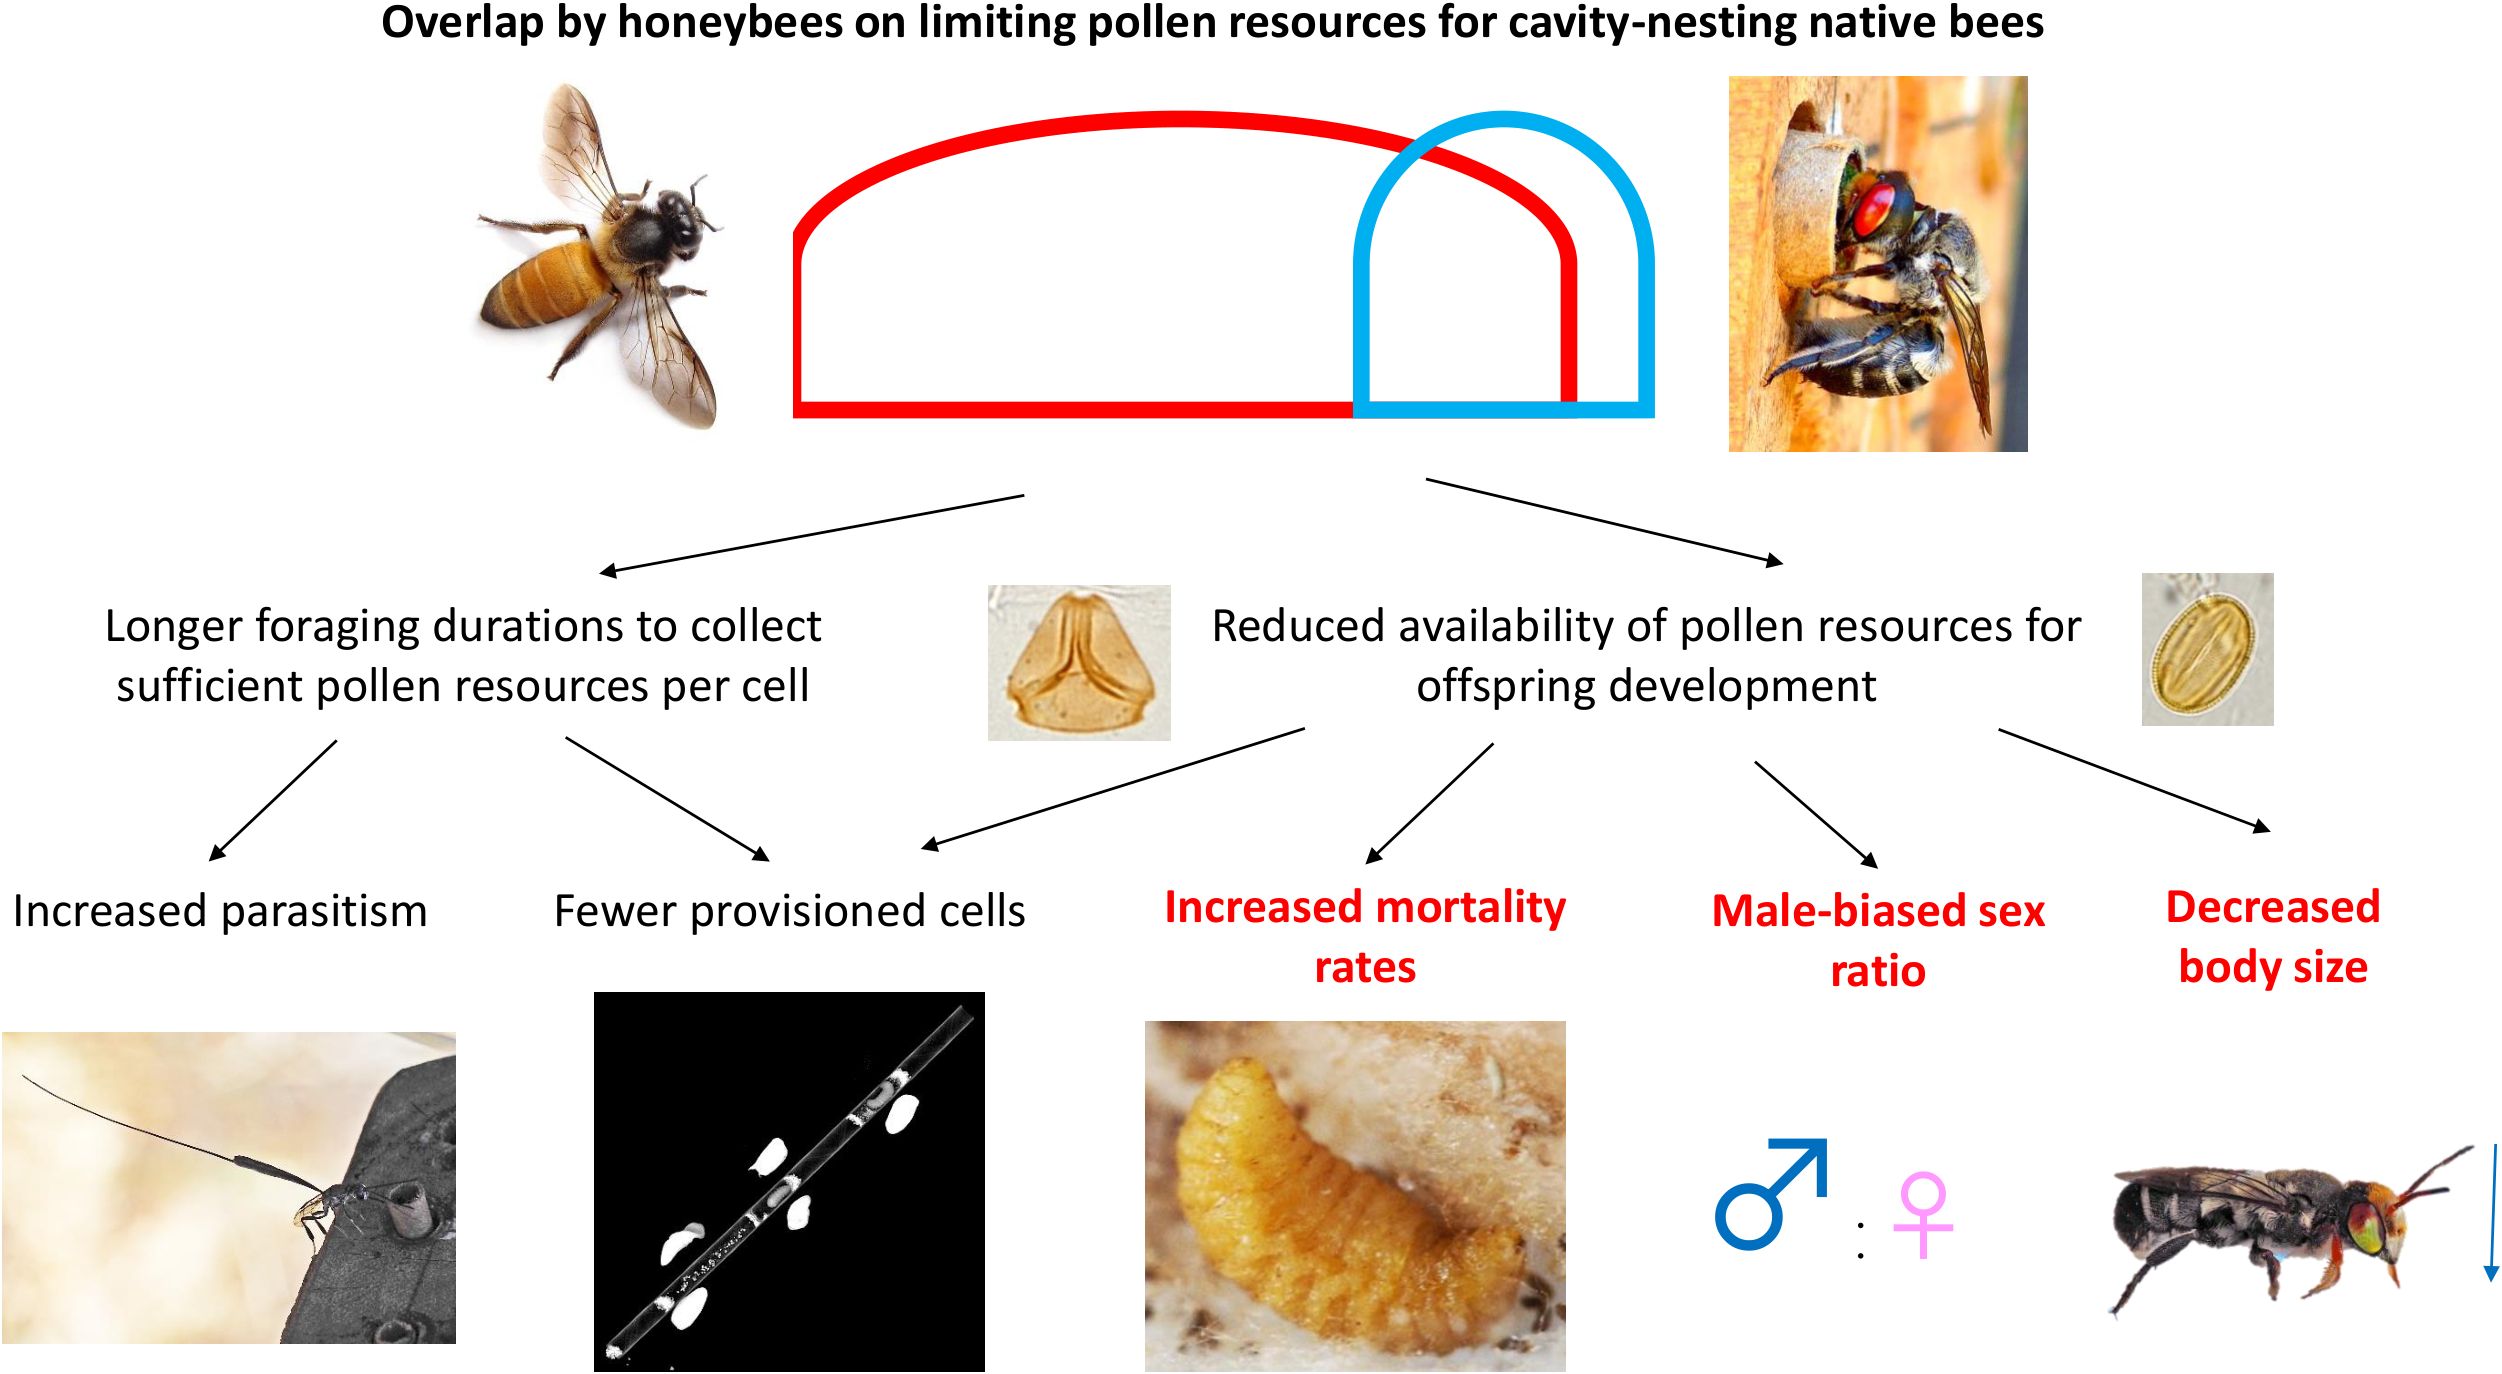
Figure 1. Hypothesised relationships for how pollen resource overlap between honey bees and native bees (interspecific resource competition) impacts cavity-nesting bee fitness parameters. Photographs by Dr Kit Prendergast, with the exception of the honey bee image (Karunakar Rayker on Flickr: https://www.flickr.com/photos/krayker/4312985916). The red and blue lines represent the pollen niche breadth of Apis mellifera vs. a native solitary cavity-nesting bee, respectively, and the area of overlap represents resource overlap. The fitness parameters in red and bold are those where, at least in some contexts, the hypothesised effects from honey bee competition were supported by the results of the present study.
2 Methods
2.1 Study system and site selection
We sampled bees across 14 sites in the Perth metropolitan region, Western Australia. Within this urbanised region, we surveyed two urban greenspace habitat types: seven bushland remnants and seven residential gardens (Figure 2). For further information about the study sites and site selection, refer to Prendergast et al. (2020). The study sites are located in the Southwest Floristic Region, an internationally recognised biodiversity hotspot (Hopper and Gioia, 2004). This region hosts a high biodiversity of native bees (at least 153 species), with 70 of these species being above-ground nesters—a relatively high proportion compared with global averages (Prendergast et al., 2022c). Bushland remnant sites were selected on the basis of being dispersed throughout the metropolitan region, whilst residential garden sites were selected on the basis of being interspersed with the selected bushland remnants (appropriate permission was obtained to sample all sites). Study sites encompassed a representative range of variation in habitat characteristics for each site type regarding flower abundance, diversity, proportion of native flora, built space, and habitat size (Prendergast et al., 2022c).

Figure 2. Map of study sites (triangles) and locations of honey bee pollen traps (circles) all located within the urbanised region (Perth) of the Southwest–Western Australian biodiversity hotspot.
2.2 Trap-nest sampling
Eight trap nests, consisting of 150 × 100 × 100 mm wooden Jarrah (Eucalyptus marginata Donn ex Sm.) blocks (Figure 3a), were used to sample cavity-nesting native bees at all 14 sites (with a total of 1,690 nesting blocks in total). Fifteen holes were drilled to a depth of 120 mm in each block, with five each of the following hole diameters: 4, 7, and 10 mm. Cardboard bee tubes (Custom Paper Tubes, Cleveland, OH, USA) were then inserted into the holes. These three sizes were chosen to cover a range of cavity-nesting bee body sizes.

Figure 3. Trap-nest and rearing set-up. (a) Trap nests used in the present study consisted of wooden jarrah blocks with 15 holes of 4-, 7-, and 10-mm diameters into which cardboard nesting tubes were inserted. Here, a Megachile erythropyga female is provisioning one of the 7-mm-diameter tubes. Another 7-mm-diameter tube and two 4-mm-diameter tubes have been completed, as evidenced by the capped nests. (b) Completed bee tubes (nests) were placed in labelled take-away containers and stored in the lab. (c) M. erythropyga male and female that emerged in the lab and Gasteruptiidae parasitoids that emerged. (d) X-rayed bee tube (120 mm long, 7 mm diameter) showing number of occupied cells. Photos, Kit Prendergast.
Trap nests were installed within a 100 m × 100 m area at each site on trees, or fences when there were insufficient trees at residential sites at approximately 1.4-m height, with one trap nest installed per location. Where possible, the trap nests were relatively evenly placed across the 100 m × 100 m area. They were installed in November 2016 and checked monthly until February 2017, and again installed in September 2017 and checked monthly until March 2019 (Supplementary Material S1). During each survey, trap nests were checked, and any “capped” bee tubes (i.e. completed nests) were removed and replaced. Completed nests were individually placed in labelled plastic containers in the field and returned to the lab for rearing at room temperature (23°C) (Figure 3b). Containers were ventilated with five tiny holes (<1 mm) to prevent the build-up of excessive humidity levels whilst preventing insect escape.
Nests were checked twice weekly for adult emergence (Figure 3c). The emergence date, species, sex, and body size of the adults were measured (see Supplementary Material S2). Body size was measured using electronic Vernier callipers, measured as intertegular span to a resolution of 0.01 mm. Species were identified by KSP, who is experienced in native bee identification and taxonomy, using keys in the literature and collections at the Western Australian Museum. Species that did not match a described species were given a unique morphospecies code. All specimens have been deposited in the WA Museum’s Entomology Collection.
Instances and details of parasitism of the nests were also recorded (Figure 3c) in terms of presence/absence, taxon of emerged parasitoid (Bombyliidae, Meloidae, Gasteruptiidae, and Melittobia australica), number and sex of individuals (for all parasitoid species except M. australica, owing to their gregarious reproduction, with hundreds of tiny individuals emerging), date of emergence, and number of cells parasitised. Emerged nests were carefully opened to count the total number of cells, provisioned cells, and offspring that failed to develop. For nests that did not rear any adults prior to winter (June) each year, the number of cells and provisioned cells were quantified using X-rays (Faxitron Specimen Radiography System MX-20Cabinet) (Figure 3d). The mortality rate was calculated as the number of dead bees as a proportion of provisioned cells. Mortality was assessed where dead bees were identified as larvae that failed to develop either from opening tubes that adults had emerged from or via X-ray. Both of these procedures do not cause any additional mortality from that which occurred naturally.
2.3 Honey bee density observations
Honey bee abundance at each of the 14 sites was recorded during 3-hour (during peak bee activity between 10:45 am and 1:45 pm) monthly surveys that took place on the same day when trap nests were being checked at a given site. Within the 100 m × 100 m area at each site where the trap nests were installed, a single observer (KSP) slowly traversed the site without any preordained path, recording the numbers of honey bees observed. When a flowering patch was encountered, this was observed for 5 min before moving to another patch within the 100 m × 100 m survey area. All surveys were conducted under weather conditions conducive to bee activity. One site was sampled per day, and the order of sites visited was randomised.
Further information including details on bee sampling, floral resources, and trap nest occupancy can be found in Prendergast et al. (2020, 2021a) and Prendergast (2023a).
2.4 Pollen collection and analysis
Resource overlap was analysed using the pollen provisions of honey bees and trap-nesting native bees. Pollen from honey bee hives was collected monthly at four of the trap-nesting sites (Figure 2) (Bibra Lake, Nedlands, Shenton Park, and Wilson; see Supplementary Material S3) using pollen traps (under hive pollen trap, Apico WA). The pollen traps were deployed for 1 week each month at the same time the trap nests were deployed. The collected pollen was placed in sterile containers and stored in a freezer to prevent contamination from other pollen sources and prevent mould. Native bee pollen from these same four sites was collected using nest provision residues (remains of pollen and bee faeces—see also Paini and Roberts, 2005). As each collected native bee tube represented the pollen provisions collected by the female in the month leading up to completing the nest, and the honey bee pollen, collected monthly, was sampled on the same day as when the nests were collected each month, this allowed an estimation of pollen overlap over each month. The selection of sites for honey bee pollen samples was based on the availability of beekeepers with established hives that permitted hive sampling. Consequently, only one (Shenton Park) of the four sites was a bushland remnant site that could be analysed for pollen overlap. Two of the sites had a honey bee colony (approx. 500 m away from the trap nests for Shenton Park and approximately 200 m away from the trap nests for Bibra Lake). The other sites had the colonies located approximately 1 km away from the location of the trap nests. These are all within the local foraging range of a honey bee colony (Garbuzov et al., 2015; Van Der Steen, 2015). Approximately 20 mL of pollen (as measured in a sterile specimen container) was collected from each pollen trap. Pollen was mixed using mortar and pestle to reduce clumping of one pollen type prior to analysis. At Bibra Lake, Nedlands, Shenton Park, and Wilson, within the 100 m × 100 m survey area, pollen was collected from each plant species flowering to create a pollen reference library. Reference pollen was acetolysed (Erdtman, 1960) to remove the outer sticky coating (pollenkitt) and inner protoplasm, enabling the morphological features of each species to be clearly seen and recorded. Pollen was examined and photographed using an OLYMPUS-BX51 transmitted light biological microscope and an OLYMPUS P71 digital camera attachment.
In season 1 (2016/17), pollen samples collected from the honey bee hives and the native bee nest provision residues were acetolysed. Two slides per sample were scanned until 200 grains were counted and identified. In season 2 (2017/18), a scanning electron microscope (SEM) (Jeol 35CF scanning electron microscope at Curtin University’s Centre for Crop and Disease Management) was used to count and identify pollen types. Five separate fields of view at ×400 magnification were counted. The number of pollen grains was thus dependent upon how many were in the field of view for the SEM analysis.
2.5 Calculation of resource use overlap
We calculated resource overlap in terms of the extent to which pollen from the honey bees overlapped with the pollen resources that each native bee used to provision its nest. This was calculated on the basis of the number of pollen grains of a given species/morphospecies. We used the MacArthur and Levins (1967) equation:
where RO is resource overlap, pin is the proportion that each resource used (i) is of the total resources used by a native bee species (n), and pih is the proportion that each resource used (i) is of the total resources used by the European honey bee (h). RO was calculated at both the pollen species and family levels, given the difficulties in distinguishing pollen to species level for some plant taxa (Bruni et al., 2015; Bell et al., 2017) [especially the dominant Australian family, Myrtaceae (Thornhill and Crisp, 2012)] and also because most oligolectic bees are specialists at the family level (Michener, 2007).
For overlap comparisons, native bee samples were compared with honey bee samples taken only from the same site and collection month. As such, this provides a more realistic measure of resource competition, given that honey bees and a native bee species can both use a particular flowering plant but would not come into competition if they forage in different locations or months (i.e. avoiding competition by partitioning resources in space and time).
2.6 Calculation of native bee reproductive fitness measures
The effects of honey bee abundance were tested on the following reproductive fitness measures in native trap-nesting bees at all sites: number of nest tubes completed, number of provisioned cells in each nest, number of offspring to emerge as adults, mortality rate, sex ratio, body size of emerged adults for each sex, and parasitism.
Note that the total number of nest tubes used in the calculations of provisioned cell numbers is less than the total number of tubes collected. This is because a number of bee tubes were found to contain no provisions, i.e. were entirely empty with no signs of cell construction or provisioning despite being capped. In year 1, 12.2% had no provisions, and of the tubes collected in year 2, 7.7% had no provisions.
2.7 Statistical analysis
All analyses were performed in RStudio v2021.09.0 + 351 (R Core Team, 2014) (see also Supplementary Material S5). The effects of honey bee abundance on native bee reproductive fitness parameters (response variables) were analysed using generalised linear mixed-effect models (package “lme4”), with honey bee abundance specified as the independent variable. The level of replication was at the nesting tube level. As 14 sites were visited each month, site was included as a random factor. Samples across months and years were not pooled due to phenological variation in trap nest occupancy (Prendergast, 2023a) and in flowering periods (Prendergast and Ollerton, 2022a; b). Initially, generalised linear mixed-effect models were used, but when there were convergence issues and warnings to rescale variables, honey bee abundance was ln+1 transformed for analyses, and a linear mixed model was used. Models were tested for overdispersion with the package “DHARMa”. The Poisson error distribution was specified for all models involving count responses (number of nests completed, number of cells completed, and number of offspring to emerge). The binomial distribution was used for binomial proportion data (mortality rate and sex ratio), with the sample size of each data point accounted for using a “weights” argument. Continuous response variables (i.e. body size) were analysed using a Gaussian error distribution. Overdispersion of residuals was accounted for by specifying an observation-level random effect (Tube ID), which was the same as an observation-level random effect (equivalent numbers of observations) (Harrison, 2014). Honey bee abundance was ln+1 transformed due to scaling warnings. Due to singularity, the site was removed as a random effect after comparing the Akaike Information Criterion (AICcs) with and without this random effect whilst retaining Tube ID, as this encompassed the site as well as the month, i.e. spatial and temporal variations, given that Tube ID was unique to each site and month (Frohlich and Tepedino, 1986), whilst allowing us to still deal with overdispersion. Tube ID was also retained because each nest, being produced by a different female at a site, was an independent unit of replication. The significance of honey bee density on the response parameters was assessed by performing an ANOVA between models [anova() function] with and without honey bee abundance (log-likelihood approach), where significance was determined by a chi-squared test statistic corresponding to p < 0.05. When the difference between models was <0.1, this was interpreted as below statistical significance but warrants attention, as it may indicate a biologically meaningful association (EFSA Scientific Committee, 2011) between honey bee abundance and the response variable of interest, given that the p-value is influenced by statistical power. We also report the effect size (estimate and standard error from a summary of the model, using restricted maximum likelihood) of honey bee abundance on native bee response variables to quantify the magnitude of how much a change in native bee fitness can be attributed to a change in honey bee abundance.
The relationship between resource overlap and native bee reproductive fitness (all measures above except body size) was analysed using generalised linear mixed-effect models with a Poisson distribution, with the site as a random effect. A log-likelihood approach was used to provide an estimate and associated SE and p-value on the relation between overlap and fitness parameters. Whether overlap varied between native bee species was analysed using resource overlap as the response variable and bee taxon as the explanatory variable. This model was then compared with a null model, using the method described above involving performing an ANOVA between models.
We also investigated interaction effects, where the effect of honey bee density on native bee response variables interacted with, i.e. were modulated by, variation in other factors. The following factors were investigated for honey bee × factor interactions:
● Year: with two levels, year 1 (data collected in the first field season, Nov–Feb 2016/17) and year 2 (data collected in the second field season, Oct–March 2017/18) (Prendergast et al., 2022c).
● Cohort: there were two main periods of emergence each year: pre-winter, and post-winter, the latter being larvae that overwintered and emerged the following season, for both the first year and second year, representing four levels (Prendergast, 2023a).
● Habitat type: bee hotels were installed in two habitat types (two levels), bushland remnant vs. residential gardens (Prendergast and Ollerton, 2021; Prendergast et al., 2021a; Prendergast and Ollerton, 2022a; Prendergast et al., 2022c).
● Native bee subfamily: with two levels, Megachilinae (comprising, in this study, Megachile and Rozenapis) and Hylaeinae (comprising, in this study, Hylaeus and Meroglossa).
The significance of interaction effects was tested using a log-likelihood approach, where an anova (anova() function) was performed between models with and without an interaction effect, i.e. response~honeybees × response~factor vs. honeybees + factor. If an interaction effect was significant (p < 0.05), analyses were also performed with models using a subset of data separated by each level of the factor (see Supplementary Material S5 for an example).
Year interaction effects were performed given that activity seasons are not continuous and represent independent environmental conditions and a unique assemblage each year. As the study was conducted over 2 years of bee activity seasons, this also investigated interannual differences, given that differences in weather parameters, flowering of plants and their nutritional quality, and native bee population pools may vary between years (Prendergast et al., 2022c). Each cohort of the first and second year’s offspring that emerged prior to winter (no diapause) and after winter (diapausing) represent independent emergence events (Prendergast, 2023a). Investigation of the emergence data for a cohort interaction was conducted because factors other than honey bee abundance may impact the emergence parameters of larvae that diapause over winter vs. those that do not. This is especially apparent in the data from the second year, where the majority of overwintering nests were infested to varying degrees by parasitoid wasps M. australica (Eulophidae). These likely originated from one or a few nests and escaped through the tiny punctures or crevices under the lids of the containers in which each nesting tube was placed and spread throughout nests in the lab. A habitat type interaction was investigated because bushland remnants vs. residential gardens differ in plant composition (resource conditions in terms of floral type and amount), urbanisation (Prendergast and Ollerton, 2021; Prendergast et al., 2022c), and potential for competition (Prendergast et al., 2021a; Prendergast and Ollerton, 2022a).
A native bee subfamily (Megachilinae: Megachile and Rozenapis) vs. Hylaeinae: Hylaeus and Meroglossa) interaction effect was investigated for emergence data, mortality rate, and pollen overlap, given that phylogeny, i.e. bees from different families, can influence sensitivity to competition due to differences in life-history traits that could influence competition (body size, tongue length, and pollen preferences).
Due to variation in sample size between species, and for many, insufficient sample size, models could not be performed for each native bee species to test how that particular species was associated with honey bee density. We also did not include species as a random effect (or fixed effect, if we were particularly interested in these particular species) because of, as above, big differences in sample size, and this would result in overfitting our models and singularity. To still be able to account for potential taxon differences, we did look at a potential interaction between subfamilies (Megachilinae and Hylaeinae), and due to phylogenetic inertia (i.e. bee species and their traits are phylogenetically non-independent), species within a subfamily are more similar in life-history traits than species in another subfamily (Webb et al., 2002; Wiens et al., 2010).
3 Results
3.1 Impact of honey bees on nesting and reproductive success of cavity-nesting bees
3.1.1 Bee tube occupancy
A total of 1,029 nests were completed (413 in year 1 and 616 in year 2). There was no association between honey bee abundance and number of completed nests (est = −6.2^−5, se = 1.6^−5, X^2 = 1.6, p = 0.662). There was no interaction effect with year (p > 0.05). There was an interaction effect with habitat type (X^2 = 704.5, p < 0.001). However, the relationship remained non-significant in both bushland remnants and residential gardens, with the difference being the valence of the association (bushland remnants: est = −7.0^−4, se = 1.0^−4, X^2 = 0.25, p = 0.617 vs. residential gardens: est = 0.001, se = 0.001, X^2 = 1.48, p = 0.225).
3.1.2 Nesting success: provisioned cells, offspring emergence, and mortality rate
A total of 6,287 cells were created, of which 4,069 were provisioned (the difference comprising empty “intercalary” or “vestibular” spaces). In year 1, a total of 1,603 cells were provisioned, and 2,466 cells were provisioned in year 2.
For the number of provisioned cells per nest, honey bee abundance had a negative but non-significant association (est = −0.03, se = 0.02, X^2 = 1.64, p = 0.193). There was no significant interaction effect by year (X^2 = 0.42, p = 0.516), habitat (X^2 = 0.28, p = 0.595), or cohort (X^2 = 0.92, p = 0.820).
For the number of offspring to successfully emerge (i.e. eclose), there was again a negative but non-significant association with honey bee abundance (est = −0.04, se = 0.03, X^2 = 2.34, p = 0.126). There was no interaction effect by year (X^2 = 2.65, p = 0.103), habitat (X^2 = 1.48, p = 0.223), or cohort (X^2 = 2.35, p = 0.503).
There was no association between mortality rate and honey bee abundance (est = 0.013, se = 0.09, X^2 = 0.02, p = 0.890). There was no interaction effect by habitat (X^2 = 1.68, p = 0.195). However, there was a significant interaction effect with year (X^2 = 22.68, p < 0.001) and cohort (X^2 = 9.07, p = 0.030). In year 1, there was a significant positive association between mortality rate and honey bee abundance (est = 1.04, se = 0.23, X^2 = 4.58, p < 0.001), whereas there was no association in year 2 (est = −1.34, se = 0.11, X^2 = 1.45, p = 0.23) (Figure 4a). When analysed by cohort, there was a significant positive association between honey bee abundance and mortality rate in the cohort to emerge prior to winter in the first year (est = 1.12, se = 0.45, X^2 = 6.89, p = 0.009), but the association was non-significant for the cohort to emerge after winter in the first year (est = 0.19, se = 0.21, X^2 = 0.83, p = 0.363). There was no association for mortality of the pre-winter cohort in year 2 (est = −0.10, se = 0.15, X^2 = 0.02, p = 0.894) or the post-winter cohort in year 2 (est = −0.09, se = 0.09, X^2 = 1.16, p = 0.282).
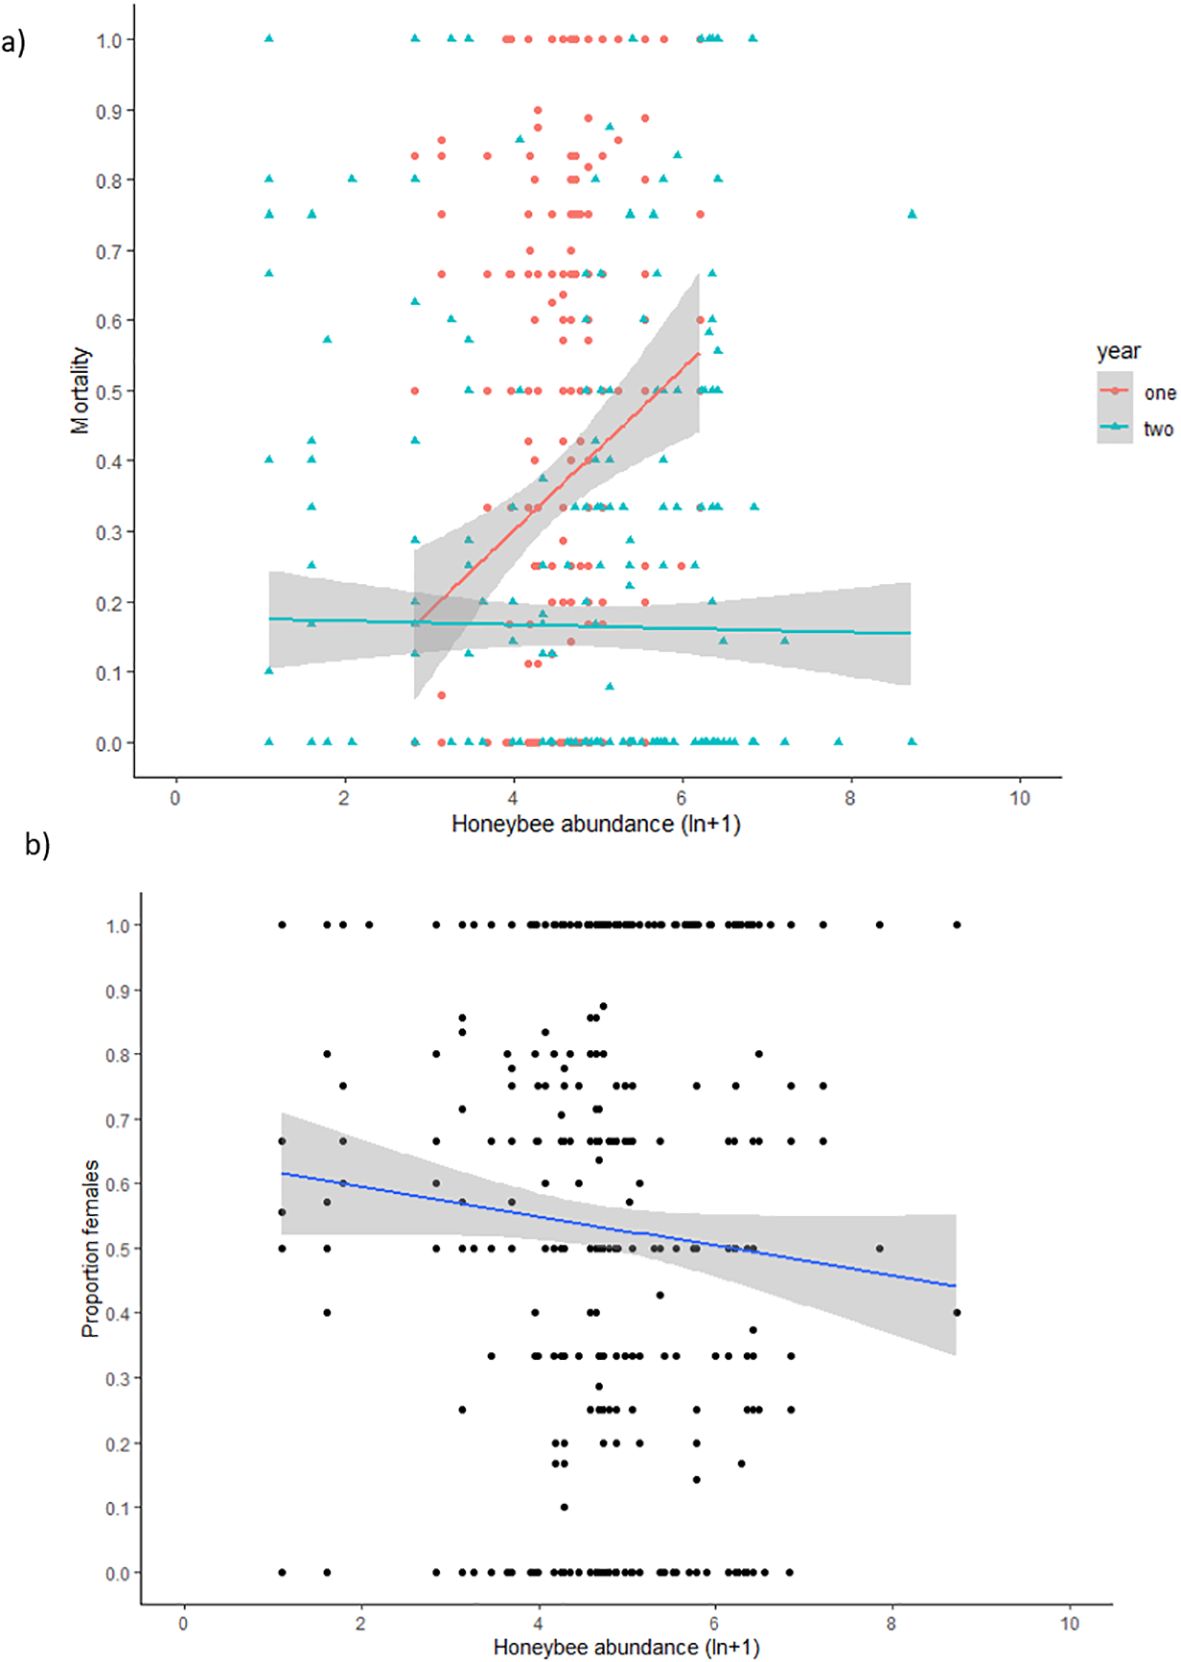
Figure 4. Relationship between honey bee abundance (ln+1 transformed) and (a) mortality rate (number of bees that failed to emerge as a proportion of the total number of provisioned cells per nest) by year and (b) sex ratio (proportion of females).
Species to emerge from the nests were from two subfamilies, Megachilinae (family Megachilidae, primarily in the genus Megachile, along with one species of Rozenapis) and Hylaeinae (family Colletidae, primarily in the genus Hylaeus, along with one species of Meroglossa). A total of 565 nests were made by Megachilinae, comprising 18 species, whilst 72 nests were made by Hylaeinae, comprising seven species (Table 1, see also Supplementary Material S2). The two subfamilies, Megachilinae and Hylaeinae, did not differ in the association of honey bees with provisioned cells (X^2 = 0.727, p = 0.394), number of offspring emerged (X^2 = 0.002, p = 0.967), or mortality (X^2 = 2.95, p = 0.086).
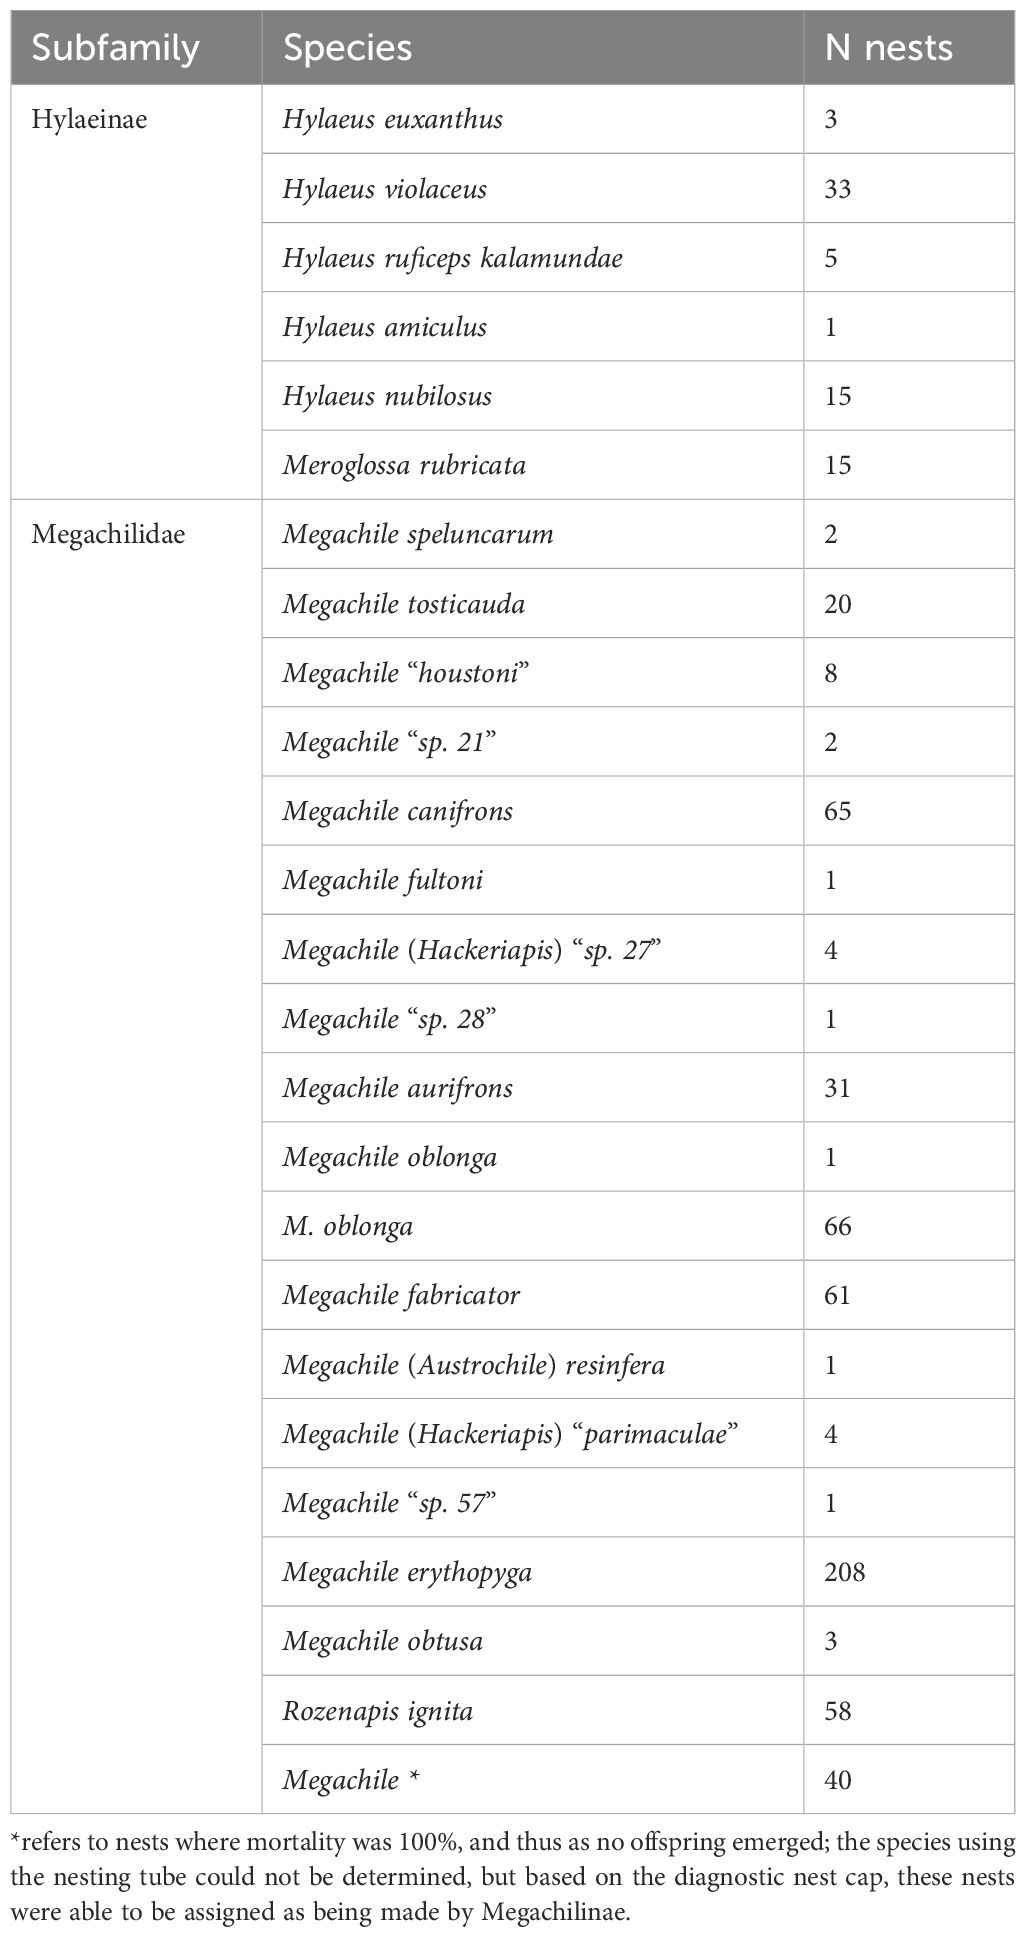
Table 1. Summary of the cavity-nesting bee species using bee hotels.
3.1.3 Sex ratio
There was a significant negative relationship between sex ratio (proportion of females) and honey bee abundance (est = −0.16, se = 0.06, X^2 = 6.36, p = 0.012). There was no interaction with habitat type (X^2 = 2.22, p = 0.137), year (X^2 = 1.88, p = 0.170), or cohort (X^2 = 1.88, p = 0.170).
3.1.4 Body size
There was no effect of honey bee abundance on female body size (est = 0.02, se = 0.03, X^2 = 0.76, p = 0.413) and male body size (est = 0.02, se = 0.03, X^2 = 0.25, p = 0.601). For both sexes, there was no interaction effect with habitat type, year, or cohort (all p > 0.05), except for male body size, which interacted with cohort (X^2 = 12.1, p = 0.006). There was no association in the pre-winter year 2 cohort (est = 0.04, se = 0.04, X^2 = 1.26, p = 0.261) and post-winter year 1 cohort (est = −0.04, se = 0.15, X^2 = 0.09, p = 0.754). Associations did not reach statistical significance for the pre-winter year 1 cohort (est = 0.22, se = 0.12, X^2 = 3.48, p = 0.06) and post-winter year 2 cohort (est = −0.02, se = 0.05, X^2 = 3.19, p = 0.07).
3.1.5 Parasitism
There was no effect of honey bee abundance on parasitism rates (est = 0.02, se = 0.09, X^2 = 0.05, p = 0.829). There was no significant interaction effect with the year (p > 0.05). However, there was a significant interaction effect with habitat (X^2 = 4.23, p = 0.040). There was no association in bushland remnants (est = −0.05, se = 0.13, X^2 = 0.14, p = 0.710), whereas there was a trend towards a significant association, with a much greater estimated coefficient between honey bee abundance and parasitism rates in residential gardens (est = 0.20, se = 0.12, X^2 = 2.81, p = 0.093).
3.1.6 Summary of associations between honey bee abundance and native bee fitness
The majority of associations between honey bee abundance and the parameters measured from the trap-nesting native bees in terms of nesting and fitness were statistically non-significant. There were, however, more associations (12:9) in the direction predicted under the hypothesis of honey bee competition occurring and adversely impacting native bees (Table 2).
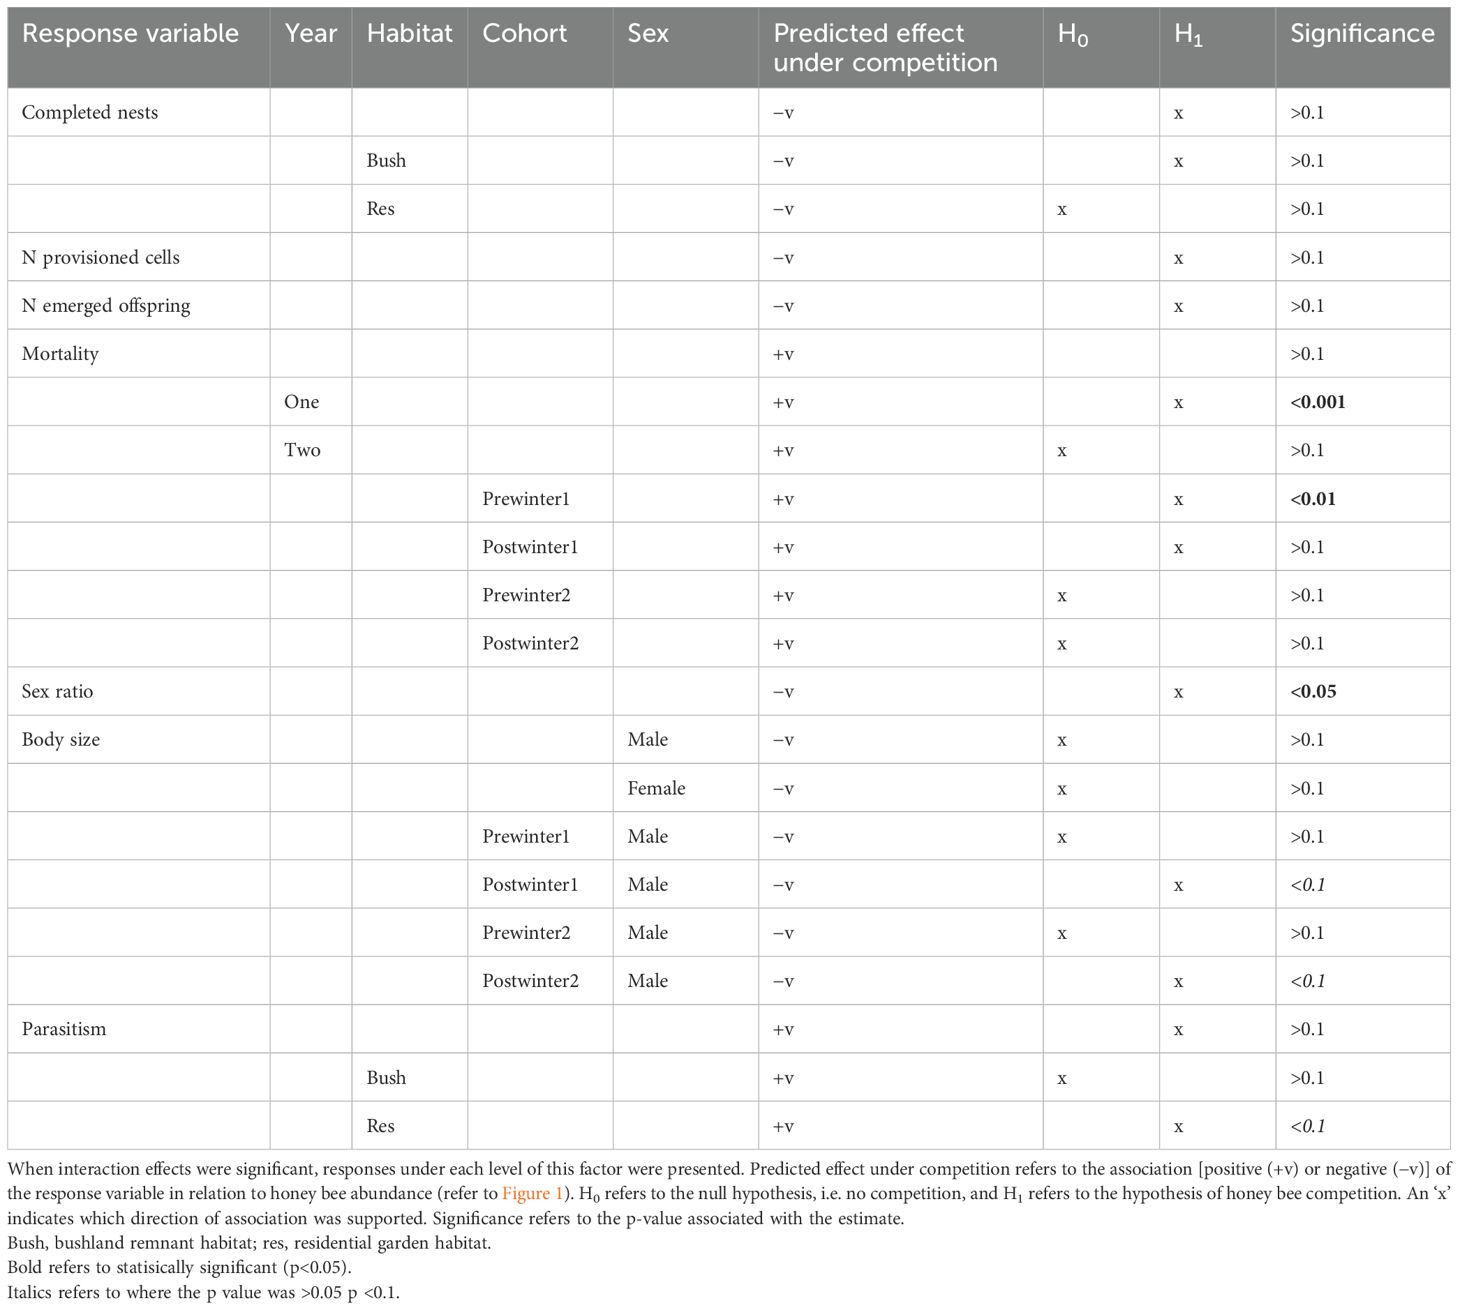
Table 2. Summary of native cavity-nesting bee response variables in relation to honey bee competition.
3.2 Relationship between pollen overlap and reproductive success
3.2.1 Acetolysed sample analyses (year 1)
Nineteen bee tubes, created by seven species and collected across the four pollen overlap sites, had progeny that emerged prior to winter in the first season (i.e. cohort one) [note that one of these bee tubes was parasitised by Anthrax incomptus (Diptera: Bombyliidae) and no offspring emerged]. Microscopic analysis of acetolysed pollen from these bee tubes and honey bee pollen traps revealed that honey bees collected pollen from over twice as many species as native bees (mean no. species for native bees: 4.26 ± 0.556 vs. mean no. species for honey bees: 10.3 ± 1.01). The average overlap was 0.18 ± 0.06 at the pollen morphospecies level and 0.43 ± 0.08 at the family level (Supplementary Material S3).
There was a significant negative relationship between the niche overlap of pollen morphospecies and the number of provisioned cells that were filled (est = −1.16, se = 0.47, X^2 = 6.95, p = 0.008). This relationship did not occur when analysed at the family level of pollen (est = 0.06, se = 0.28, X^2 = 0.05, p = 0.832). There was no association with mortality at the pollen morphospecies level (est = −1.01, se = 1.51, X^2 = 0.47, p = 0.492) or the family level (est = −1.57, se = 0.92, X^2 = 2.98, p = 0.089), and there was no association with the sex ratio at the pollen morphospecies level (est = 0.22, se = 1.06, X^2 = 0.04, p = 0.835) or the family level (est = 0.19, se = 0.83, X^2 = 0.05, p = 0.825).
3.2.2 SEM analyses (year 2)
Twenty-four tubes from six species had offspring that emerged from the second year of collections that were paired with honey bee pollen collection sites. Using scanning electron microscopy to identify pollen species in samples, honey bees again collected over twice as many pollen types as native bees. Native bees collected on average 2.79 ± 0.29 pollen species, whereas honey bees were more generalised at 8.13 ± 0.06. The average overlap was 0.48 ± 0.07 at the pollen morphospecies level and 0.62 ± 0.06 at the family level (Supplementary Material S3).
There was no relationship between the number of provisioned cells and overlap at the pollen morphospecies level (est = −0.19, se = 0.35, X^2 = 0.30, p = 0.58) or family level (est = 0.02, se = 0.36, X^2 = 0.001, p = 0.97), nor was mortality related to overlap at the species level (est = −1.70, se = 1.10, X^2 = 1.2, p = 0.24), the family level (est = −0.11, se = 1.15, X^2 = 0.01, p = 0.92), or sex ratio (morphospecies: est = 0.09, se = 0.63, X^2 = 0.02, p = 0.87, family: est = −0.19, se = 0.70, X^2 = 0.07, p = 0.79).
3.3 Pollen species used by honey bees and native bees
Forty-one pollen species were found in the nests of native bee species samples that were acetolysed in the first year, and 24 species from samples were analysed with SEM in the second year (Supplementary Material S4). A total of 58 pollen species were used by A. mellifera in the first year, and 41 pollen species were used by A. mellifera in the second year (Supplementary Material S4). The average number of pollen morphospecies collected across native bee nests in year 1 was 4.3 ± 0.6 species and 10.2 ± 1.4 morphospecies from A. mellifera hives (Supplementary Material S4). In year 2, the average number of pollen morphospecies collected across native bee nests was 2.8 ± 0.3, and an average of 6.4 ± 1.1 pollen morphospecies were collected from A. mellifera colonies (Supplementary Material S4). Therefore, A. mellifera collected a greater total number (1.4× more in year 1 and 1.7× more in year 2) and an average number of pollen morphospecies (2.4× more in year 1 and 2.3× more in year 2), despite these results being from just one species rather than a multi-species guild of native bee. The top five species used by native bees in the first were Melaleuca sp., E. marginata, Corymbia calophylla, Jacksonia sternbergiana, and Eucalyptus erythrocorys for abundance and Melaleuca sp., E. marginata, C. calophylla, J. sternbergiana, and “NFI 29” for frequency (Supplementary Material S4). The top five species used by A. mellifera from the year 1 samples were C. calophylla, E. erythrocorys, Casuarina sp., Lagerstroemia indica × Lagerstroemia fauriei, and “NFI 5” for both abundance and frequency (Supplementary Material S4).
In the second year, using SEM to identify the pollen, the top five species used by native bees were E. marginata, C. calophylla, Melaleuca sp., Myrtaceae sp., and
Melaleuca huegelii for abundance and E. marginata, Melaleuca viminalis, C. calophylla, Melaleuca sp., and Myrtaceae sp. for frequency (Supplementary Material S4). The top five species used by A. mellifera were E. marginata, C. calophylla, “NFI ‘Big-lips’”, Myrtaceae “sp. large”, and “NFI ‘AsteraceaeBibraLake’” for both abundance and frequency (Supplementary Material S4).
4 Discussion
In the face of an under-researched pollination crisis in Australia (Pyke et al., 2023) and concerns over introduced bees having harmful impacts on native bees (Pyke, 1990, Pyke, 1999; Iwasaki and Hogendoorn, 2021), it is important to quantify the fitness consequences of the introduced honey bee on native bee populations (Prendergast et al., 2022a). Here, we highlight the utility of using trap nests to quantify resource competition from honey bees upon cavity-nesting native bee assemblages in urban areas, filling an urgent knowledge gap with regard to assessing conservation-relevant parameters about the effects of this introduced species on wild bee populations (Beaurepaire et al., 2025). In our present study, increasing honey bee density did not have significant associations with completed nests, the number of provisioned cells, or the number of offspring. However, under certain contexts, greater honey bee density resulted in a significant increase in the mortality rate of native cavity-nesting bee progeny, a greater male-biased sex ratio, and smaller-bodied male offspring; in general, greater honey bee densities had effects on native bee fitness components consistent with those predicted under the hypothesis of resource competition (Table 2, Figure 1). The clearest association was the increasing male-biased sex ratio under higher honey bee densities. The association between honey density and mortality varied by cohort and year, with a significant increase in native bee offspring mortality in year 1, particularly the pre-winter cohort. Male body size was reduced under honey bee competition in both post-winter cohorts, but this association failed to reach statistical significance (0.5 > p < 0.1). Similarly, parasitism was higher in residential gardens under higher honey bee densities but failed to reach statistical significance (0.5 > p < 0.1). Further investigations with a larger sample size are required to determine if with greater power significant effects are detected, given that theory and previous research have supported such associations (as cited in the Introduction of this article). We acknowledge that the majority of analyses, however, did not reach statistical significance—which is not uncommon in ecological studies of honey bee competition (Prendergast et al., 2022a). This may be due to honey bees having no effect on these fitness parameters in this system, but we also cannot be confident in asserting this; given that estimated effects were in the direction predicted under the hypothesis of honey bee competition in the majority of analyses, the precautionary principle should be adopted (Pyke, 1999). We also acknowledge that our sample size may have been too low to have the power to detect statistically significant associations, and we also acknowledge that other interacting factors (such as diffuse competition), intraspecific competition, and differences in vulnerability between species to honey bee competition may mask an overall effect of interspecific resource competition from honey bees on native bee fitness (Barabás et al., 2016; Kelly and Bowler, 2005; Pianka, 1974).
4.1 Associations between honey bee abundance and cavity-nesting bee fitness
There were few significant associations between cavity-nesting bee fitness parameters and honey bee abundance. However, whilst non-significant, increasing honey bee abundance during a survey was associated with fewer nests being completed. This negative impact was more severe in residential gardens than bushland remnants. A reduced number of nests due to pollen resource competition could occur where each female completes fewer nests and/or fewer females complete nests. We also found that, although non-significant, the direction of association between the number of provisioned cells and the number of offspring to emerge was in the direction predicted under competition.
The impacts of honey bee abundance also appeared at times to be context-dependent. As noted above, whilst non-significant, there was a greater negative association between honey bee density and the number of nests completed in residential gardens compared with urban bushland remnants, and likewise, for parasitism rates, there was a trend towards a significant association between honey bee abundance and parasitism rates in residential gardens. That the suggested competitive effects were more severe in residential gardens is concordant with other research on overall honey bee-native bee interactions, where resource overlap and proxies for the competition were more severe in residential gardens (Prendergast et al., 2021a; Prendergast and Ollerton, 2022a). This relates to the reduced proportion of preferred native flora in more anthropogenic urban greenspaces where exotic plants comprise a greater proportion of the flora (Pyšek, 1998; Ward and Amatangelo, 2018; Prendergast et al., 2022c). Native bees may also have to spend longer away from the nest searching for their host plants in these more resource-poor habitat types, which, compounded with resource competition from honey bees, means a greater risk of nest parasitism. Context-dependent effects also were observed in terms of interannual differences. Whilst increasing honey bee abundance did not significantly impact the mortality rate in the second year, it was significantly associated with the increased mortality rate in the first year. This is not unexpected, as other studies have found that the intensity of competition can vary between years due to, for example, differences in environmental conditions like drought, which impacts resource levels (Roubik et al., 1986; Roubik and Wolda, 2001; Thomson, 2016). The incidence of Melittobia infection in year 2 cohort nests and resultant mortality—which was, therefore, for many nests, a lab artefact—may also have obscured the influence of honey bee competition.
Previous studies have found that the impact of honey bees depends on the taxa of native bees. For example, honey bees were found to adversely impact the reproductive output of a Hylaeus species (Paini and Roberts, 2005), but not a Megachile species (Paini et al., 2005), and Hylainae have been found to exhibit higher potential for apparent competition with honey bees than Megachilidae, which in turn was associated with reduced abundances observed foraging in the field (Prendergast et al., 2021a). In the present study, however, there was no significant difference between Hylaeinae and Megachilinae. This may be due to the unequal sample sizes between the two taxa whereby there was a greater number of Megachilinae nests than Hylaeinae. It may also be that the particular species using the trap nests were equally vulnerable to the impact of honey bees on fitness. Greater sample sizes per species would enable discerning if there were species-specific differences in resource overlap with honey bees and any fitness parameters.
One clear finding on a potentially negative impact of honey bees on native bee fitness was the negative relationship between honey bee abundance and the relative proportion of native bee female offspring. In many native bees, and indeed the taxa collected here, females have larger body sizes than males (see Prendergast, 2023a), and offspring destined to be female will require more resources. Mother bees can “control” whether they lay a fertilised female egg or an unfertilised male egg (Werren, 1987; Heimpel and De Boer, 2008), and thus, sex allocation is an important life-history property (Wittmann et al., 2023). If competition is reducing access to sufficient resources, then this can lead to reduced numbers of female offspring (Torchio and Tepedino, 1980; Peterson et al., 2006). Other studies have likewise found that low provisioning performance leads to a bias towards producing more sons (the smaller sex) (Kim, 1999; Seidelmann et al., 2010). The observed male-biased sex ratios under increasing honey bee densities may have harmful impacts on population stability. Other studies have found male-biased sex ratios in solitary bees resulting from environmental challenges (Sandrock et al., 2014; Fitch et al., 2019), which, if sustained, could have impacts on effective population size (Zayed, 2009).
Our study suggests that high honey bee densities have the potential to impact aspects of native bee fitness. We provided data on honey bee densities foraging at our sites but were unable to access data on honey bee colony density. In the region, there is no requirement for beekeepers to register hives in some councils, and even for those where there is, backyard beekeepers often do not (Prendergast, personal observation). There are also feral colonies, and in this region, feral colonies can be relatively high at 18.57 colonies per km2 (Mcveigh, 2024). Such densities exceed those in studies conducted in urban France, where colony densities of 6.5 colonies per km2 adversely influenced visitation rates of wild pollinators (Ropars et al., 2019). As such, we suggest that to ameliorate the potential for negative fitness impacts on native bees observed here, as well as in previous studies (Ropars et al., 2019; Prendergast et al., 2021a), feral colonies should be removed where possible in places where honey bees are an introduced species, and backyard beekeeper densities should be regulated. Another important mitigation strategy, especially when the aforementioned regulation of honey bee densities is impractical, is to increase the carrying capacity of the environment for native bees by increasing foraging resources that native bees specifically forage on, which reduces the potential for fitness impacts from apparent competition (Prendergast et al., 2021a; Prendergast, 2023b). The present study, by identifying the key pollen resources used by native bees, provides an indication of how to improve the pollen resource landscape for cavity-nesting bees in this context.
4.2 Pollen overlap
Consistent with the foraging ecology of honey bees compared with native Western Australian megachilids and hylaeine bees (Houston, 2000), DNA barcoding studies of pollen loads of honey bees and native bees in Queensland (Elliott et al., 2021), and foraging observations in this system (Prendergast and Ollerton, 2022a), honey bees collected a greater number of pollen morphotypes than native bees. This can mean that native bees may have limited flexibility to avoid competition by switching to alternative resources if the resources they utilise become unavailable (Potts et al., 2010).
To complement our analyses relating honey bee density to cavity-nesting bee fitness at a particular site, the pollen analysis resource overlap calculations were able to directly relate pollen overlap from a local honey bee colony with that of a particular nest and how this influenced native bee fitness parameters from that nest. There was evidence that in the first year, a greater overlap at the morphospecies level was associated with a reduced number of provisioned cells. The lack of an association at the family level may be due to how even specialists can forage on alternative resources in the same family, enabling niche partitioning at finer species levels. The negative association suggests that for native bee species that have the same pollen preferences as honey bees, their fitness may be negatively impacted, whereby competition for limited resources means they are unable to provision as many cells, and, therefore, their reproductive output is reduced.
Native Myrtaceae species were clearly important pollen sources for native bees. All were trees or shrubs, emphasising the need to retain and plant native woody trees in urbanised areas (Tyrväinen et al., 2005; Hausmann et al., 2015; Somme et al., 2016). Concerningly, the most used pollen species by native bees were also those used by A. mellifera. That native bees and honey bees both prefer the same species does raise the risk of exploitation competition, especially if due to factors such as land clearing for urban development or poor flowering due to climate change, and these resources thus becoming depleted. These data on pollen overlap can pave the way for planting strategies to enhance the carrying capacity of the environment as a tool to reduce the intensity of potential competitive impacts (Beaurepaire et al., 2025).
The pollen analyses also revealed that, unlike native bees, A. mellifera used a large proportion of exotic plants, which is in accordance with previous studies that observed their visits to flowers (Prendergast and Ollerton, 2022a; Prendergast, 2023b). This may give A. mellifera a competitive advantage in residential gardens, as they can exploit these resources (Prendergast and Ollerton, 2022a; Prendergast, 2023b), and also raises concerns, as they may be vectors to assist with the spread of exotic invasive garden plants (Goulson and Derwent, 2004; Invasive Species Council, 2009).
4.3 Further research considerations
We acknowledge that our study is correlational. This has been a limitation of most studies tackling the issue of honey bee competition to date (Prendergast et al., 2022a). This is due to some very real constraints in manipulative experiments. Given that there is accumulating evidence and concerns for adverse impacts on native bees (as well as other fauna and potentially flora) in Australian ecosystems, increasing hive numbers poses ethical questions, as it risks harming wildlife (Pyke, 1990; Gross, 2001; Goulson and Derwent, 2004; Paini and Roberts, 2005; Goulson and Sparrow, 2009; Prendergast et al., 2022a; Prendergast and Ollerton, 2022a). Decreasing hives is also challenging, as not many beekeepers in urbanised areas would be happy to relocate their hives. The eradication of feral colonies is costly and challenging. Furthermore, even with experimental manipulation, given the large flight distances of honey bees (up to 10 km; Visscher and Seeley, 1982) and that they do not forage very close to their nests, it is unclear how increasing or decreasing honey bee hive densities experimentally would be a valid way to experimentally test competition.
Adverse impacts from a competitor also involve being able to rule out such impacts that are not driven by other factors such as environmental or anthropogenic disturbances. This is more difficult for mensurative studies as opposed to experimental studies. However, we included site as a random factor to control for site-specific environmental or anthropogenic disturbances and also included habitat type (bushland remnant vs. residential garden) in our models, which is associated with differences in urban disturbance variables including the percentage of impervious surfaces, number of woody trees, and exotic vs. native flower composition (Prendergast et al., 2022c).
Pollen analyses offer a number of advantages over using foraging observations: it enables quantifications of the different resources used, it enables looking at pollen resources per bee over longer durations (approx. weeks) rather than a single day, and it is the main limiting currency for oligolectic bees (Cane and Sipes, 2006; Bogusch et al., 2020). However, there are some drawbacks: our ability to assign a pollen type to a species is dependent upon our reference library. Bees can forage distances much greater than the 100-m radius in which we collected reference samples, and this is especially the case for honey bees. This factor will not pose constraints in homogenous landscapes; however, in urbanised landscapes that have a high alpha diversity of flora, often exotics (in each garden) and high beta diversity between gardens, in addition to pollen from native bushland remnants, verges, and media strips, and parks, this means sampling reference pollen is a challenge. For example, a larger number (50) of pollen types could not be formally identified based on the reference collection. This, however, does not limit the ability to calculate resource overlap.
It would be of interest in future research to compare acetolysis, SEM, and DNA barcoding techniques. Each has advantages and disadvantages in terms of the ability to resolve pollen to species level, costs, equipment, and expertise required. Genetic techniques are becoming increasingly common but remain costly and have difficulty quantifying relative pollen species amounts (Bell et al., 2019). All methods rely on a representative pollen reference library.
We also note the potential for there to be not a perfect temporal overlap between the pollen from the trap nests and the pollen from the honey bee pollen traps. Each was collected once a month, ensuring that they were collected during the same monthly period. However, the honey bee pollen was collected from pollen traps over a week, potentially missing part of the monthly flowering phenology. The trap nests may or may not have perfectly coincided, depending on how long it took a female to provision her nest and when she completed it.
We also note that this study was primarily focussed on pollen, which is a key factor influencing reproduction (Franzén and Larsson, 2007; Cane, 2016). Pollen also is the main resource that is considered when investigating the specialisation, i.e. lecty of bees (Michener, 2007). However, nectar is also important for bee fitness (Burkle and Irwin, 2009) and can be rapidly depleted by honey bees. Competition for nectar may be occurring (e.g. Page and Williams, 2023) but was outside the scope of the present study.
Whilst it was a potential constraint using the two different pollen identification methods (SEM and acetolysis), meaning the sample size per method was smaller, it enabled us to compare and contrast the two methods. The drawbacks of the SEM were that we did not first remove the pollenkitt, and nectar remained around the pollen, causing clumping and potentially obscuring some morphological features. However, despite this, with the SEM, the sculpturing on pollen was more apparent and distinctive, provided it was not covered with pollenkitt. The data were from two different years, so it would be useful to explicitly compare both techniques with the same dataset.
We also recommend that future studies consider a greater number of sites to sample pollen overlap. In our current study, we were limited to four sites, based on the availability of beekeepers permitting us to sample honey bee pollen within a suitable radius around our study sites pre-selected to allow us to compare bee assemblages across bushland remnant and residential garden habitats. Having a greater number of beekeepers permitting us to install pollen traps and sample their pollen and then installing trap nests around these sites would be a fruitful avenue to investigate this topic further.
In the present study system, the number of nest sites did not appear to be limiting, given that during each monthly survey at each site, there always remained nesting holes or even entire bee hotels that were not occupied, with 13.3% and 6.34% of available tubes occupied in the first and second survey years, respectively (see results in Prendergast, 2023a). This suggests that competition for food resources was more influential than competition for nests. There have been mixed results on the relative importance of food vs. nesting resources in limiting native bee populations (Roulston and Goodell, 2011). However, in systems where nesting opportunities are the primary limiting factor, honey bee competition for floral resources may be a less influential factor in limiting populations (Hudewenz and Klein, 2013).
5 Conclusion
This research has revealed that greater honey bee density can be negatively associated with components of native bee fitness (Figure 1). Whilst not all measures of fitness were significantly negatively impacted, the precautionary principle suggests that there is potential for high honey bee densities to have adverse consequences on native bee populations. We advise against further increasing the density of urban beekeepers and recommend, where practical, that feral honey bee colonies should be eliminated or removed, especially from conservation lands, including state and national parks. We have also revealed key pollen resources for cavity-nesting bees in this urbanised region. The species utilised by native bees exclusively should be planted to provide a “refuge” from the competition, whilst those used extensively by both honey bees and native bees should be targeted at being increased in abundance so that shared resources do not become limiting.
Data availability statement
The original contributions presented in the study are included in the article/Supplementary Material. Further inquiries can be directed to the corresponding author.
Ethics statement
The manuscript presents research on animals that do not require ethical approval for their study.
Author contributions
KP: Conceptualization, Data curation, Formal Analysis, Funding acquisition, Investigation, Methodology, Project administration, Resources, Visualization, Writing – original draft, Writing – review & editing. MM: Formal Analysis, Writing – review & editing. PK: Writing – review & editing. Z-XR: Writing – review & editing. LM: Methodology, Supervision, Writing – review & editing.
Funding
The author(s) declare that financial support was received for the research and/or publication of this article. KP received funding from Hesperia, the Australian Wildlife Society, the Forrest Research Foundation, and the City of Stirling.
Acknowledgments
KP would like to thank the local councils and homeowners for permitting her to survey their bushland areas and gardens, respectively. KP would also like to thank Kings Park and Botanic Gardens for permitting her to use their seed X-ray machine. KP would like to thank A/Prof Bill Bateman for providing so much lab space for the hundreds of take-away containers filled with bees and her parents Liz and Steve Prendergast for helping her clean out Melittobia-infested nests.
Conflict of interest
The authors declare that the research was conducted in the absence of any commercial or financial relationships that could be construed as a potential conflict of interest.
Generative AI statement
The author(s) declare that no Generative AI was used in the creation of this manuscript.
Publisher’s note
All claims expressed in this article are solely those of the authors and do not necessarily represent those of their affiliated organizations, or those of the publisher, the editors and the reviewers. Any product that may be evaluated in this article, or claim that may be made by its manufacturer, is not guaranteed or endorsed by the publisher.
Supplementary material
The Supplementary Material for this article can be found online at: https://www.frontiersin.org/articles/10.3389/frbee.2025.1508958/full#supplementary-material
References
Aizen M. A., Feinsinger P. (1994). Habitat fragmentation, native insect pollinators, and feral honey bees in Argentine’Chaco Serrano’. Ecol. Appl. 4, 378–392. doi: 10.2307/1941941
Alcock J., Houston T. F. (1996). Mating systems and male size in Australian hylaeine bees (Hymenoptera: Colletidae). Ethology 102, 591–610. doi: 10.1111/j.1439-0310.1996.tb01151.x
Barabás G., J. Michalska-Smith M., Allesina S. (2016). The effect of intra-and interspecific competition on coexistence in multispecies communities. Am. Nat. 188, E1–E12. doi: 10.1086/686901
Batley M., Hogendoorn K. (2009). Diversity and conservation status of native Australian bees. Apidologie 40, 347–354. doi: 10.1051/apido/2009018
Beaurepaire A. L., Hogendoorn K., Kleijn D., Otis G. W., Potts S. G., Singer T. L., et al. (2025). Avenues towards reconciling wild and managed bee proponents. Trends Ecol. Evol. 40, 7–10. doi: 10.1016/j.tree.2024.11.009
Bell K. L., Burgess K. S., Botsch J. C., Dobbs E. K., Read T. D., Brosi B. J. (2019). Quantitative and qualitative assessment of pollen DNA metabarcoding using constructed species mixtures. Mol. Ecol. 28, 431–455.prac. doi: 10.1111/mec.2019.28.issue-2
Bell K. L., Fowler J., Burgess K. S., Dobbs E. K., Gruenewald D., Lawley B., et al. (2017). Applying pollen DNA metabarcoding to the study of plant–pollinator interactions. Appl. Plant Sci. 5, apps.1600124. doi: 10.3732/apps.1600124
Biesmeijer J. C., Roberts S., Reemer M., Ohlemüller R., Edwards M., Peeters T., et al. (2006). Parallel declines in pollinators and insect-pollinated plants in Britain and the Netherlands. Science 313, 351–354. doi: 10.1126/science.1127863
Bogusch P., Bláhová E., Horák J. (2020). Pollen specialists are more endangered than non-specialised bees even though they collect pollen on flowers of non-endangered plants. Arthropod-Plant Interact. 14, 759–769. doi: 10.1007/s11829-020-09789-y
Bosch J. (2008). Production of undersized offspring in a solitary bee. Anim. Behav. 75, 809–816. doi: 10.1016/j.anbehav.2007.06.018
Bruni I., Galimberti A., Caridi L., Scaccabarozzi D., De Mattia F., Casiraghi M., et al. (2015). A DNA barcoding approach to identify plant species in multiflower honey. Food Chem. 170, 308–315. doi: 10.1016/j.foodchem.2014.08.060
Burkle L., Irwin R. (2009). Nectar sugar limits larval growth of solitary bees (Hymenoptera: Megachilidae). Environ. Entomology 38, 1293–1300. doi: 10.1603/022.038.0441
Cane J. H. (2016). Adult pollen diet essential for egg maturation by a solitary Osmia bee. J. Insect Physiol. 95, 105–109. doi: 10.1016/j.jinsphys.2016.09.011
Cane J. H., Sipes S. (2006). “Characterizing floral specialization by bees: analytical methods and a revised lexicon for oligolecty,” in Plant-pollinator interactions: from specialization to generalization. Eds. Waser N. M., Ollerton J. (University of Chicago Press, Chicago, USA), 99–122.
Cane J. H., Tepedino V. J. (2016). Gauging the effect of honey bee pollen collection on native bee communities. Conserv. Lett. 10, 205–210. doi: 10.1111/conl.2017.10.issue-2
Carvalho D. M., Presley S. J., Santos G. M. M. (2014). Niche overlap and network specialization of flower-visiting bees in an agricultural system. Neotropical Entomology 43, 489–499. doi: 10.1007/s13744-014-0239-4
Colla S. R. (2022). The potential consequences of ‘bee washing’ on wild bee health and conservation. Int. J. Parasitology: Parasites Wildlife 18, 30–32. doi: 10.1016/j.ijppaw.2022.03.011
Dorey J. B., Rebola C. M., Davies O. K., Prendergast K. S., Parslow B. A., Hogendoorn K., et al. (2021). Continental risk assessment for understudied taxa post-catastrophic wildfire indicates severe impacts on the Australian bee fauna. Global Change Biol. 27, 6551–6567. doi: 10.1111/gcb.v27.24
Dylewski Ł., Maćkowiak Ł., Banaszak-Cibicka W. (2019). Are all urban green spaces a favourable habitat for pollinator communities? Bees, butterflies and hoverflies in different urban green areas. Ecol. Entomology 44, 678–689. doi: 10.1111/een.12744
Dylewski Ł., Maćkowiak Ł., Banaszak-Cibicka W. (2020). Linking pollinators and city flora: How vegetation composition and environmental features shapes pollinators composition in urban environment. Urban forestry urban greening 56, 126795. doi: 10.1016/j.ufug.2020.126795
EFSA Scientific Committee. (2011). Statistical significance and biological relevance. EFSA J. 9 (9), 2372. doi: 10.2903/j.efsa.2011.2372
Elliott B., Wilson R., Shapcott A., Keller A., Newis R., Cannizzaro C., et al. (2021). Pollen diets and niche overlap of honey bees and native bees in protected areas. Basic Appl. Ecol. 50, 169–180. doi: 10.1016/j.baae.2020.12.002
Fitch G., Glaum P., Simao M.-C., Vaidya C., Matthijs J., Iuliano B., et al. (2019). Changes in adult sex ratio in wild bee communities are linked to urbanization. Sci. Rep. 9, 3767. doi: 10.1038/s41598-019-39601-8
Frank S. A. (1995). Sex allocation in solitary bees and wasps. Am. Nat. 146, 316–323. doi: 10.1086/285802
Franzén M., Larsson M. (2007). Pollen harvesting and reproductive rates in specialized solitary bees. Annales Zoologici Fennici. 44 (6), 405–414. Available online at: https://www.jstor.org/stable/23736842.
Frohlich D., Tepedino V. J. (1986). Sex ratio, parental investment, and interparent variability in nesting success in a solitary bee. Evolution 40, 142–151. doi: 10.2307/2408611
Garbuzov M., Schürch R., Ratnieks F. L. (2015). Eating locally: dance decoding demonstrates that urban honey bees in Brighton, UK, forage mainly in the surrounding urban area. Urban Ecosystems 18, 411–418. doi: 10.1007/s11252-014-0403-y
Geslin B., Gauzens B., Baude M., Dajoz I., Fontaine C., Henry M., et al. (2017). “Massively introduced managed species and their consequences for plant–pollinator interactions,” in Advances in Ecological Research (Academic Press), 147–199.
Goodell K. (2000). The impact of introduced honey bees on native solitary bees: Competition and indirect effects (Doctor of Philosophy, State University of New York).
Goodell K. (2003). Food availability affects Osmia pumila (Hymenoptera: Megachilidae) foraging, reproduction, and brood parasitism. Oecologia 134, 518–527. doi: 10.1007/s00442-002-1159-2
Goulson D., Derwent L. C. (2004). Synergistic interactions between an exotic honeybee and an exotic weed: pollination of Lantana camara in Australia. Weed Res. 44, 195–202. doi: 10.1111/j.1365-3180.2004.00391.x
Goulson D., Nicholls E. (2016). The canary in the coalmine; bee declines as an indicator of environmental health. Sci. Prog. 99, 312–326. doi: 10.3184/003685016X14685000479908
Goulson D., Sparrow K. R. (2009). Evidence for competition between honeybees and bumblebees; effects on bumblebee worker size. J. Insect Conserv. 13, 177–181. doi: 10.1007/s10841-008-9140-y
Gross C. (2001). The effect of introduced honeybees on native bee visitation and fruit-set in Dillwynia juniperina (Fabaceae) in a fragmented ecosystem. Biol. Conserv. 102, 89–95. doi: 10.1016/S0006-3207(01)00088-X
Gustafsson L. (1987). Interspecific competition lowers fitness in collared flycatchers Ficedula albicollis: an experimental demonstration. Ecology 68, 291–296. doi: 10.2307/1939260
Harrison X. A. (2014). Using observation-level random effects to model overdispersion in count data in ecology and evolution. PeerJ 2, e616. doi: 10.7717/peerj.616
Hausmann S. L., Petermann J. S., Rolff J. (2015). Wild bees as pollinators of city trees. Insect Conserv. Diversity 9, 97–107. doi: 10.1111/icad.2016.9.issue-2
Heimpel G. E., De Boer J. G. (2008). Sex determination in the hymenoptera. Annu. Rev. Entomol. 53, 209–230. doi: 10.1146/annurev.ento.53.103106.093441
Herbertsson L., Lindström S. A., Rundlöf M., Bommarco R., Smith H. G. (2016). Competition between managed honeybees and wild bumblebees depends on landscape context. Basic Appl. Ecol. 17, 609–616. doi: 10.1016/j.baae.2016.05.001
Herrera C. M. (2020). Gradual replacement of wild bees by honeybees in flowers of the Mediterranean Basin over the last 50 years. Proc. R. Soc. B: Biol. Sci. 287, 20192657. doi: 10.1098/rspb.2019.2657
Hoogland J. L. (1981). Sex ratio and local resource competition. Am. Nat. 117, 796–797. doi: 10.1086/283764
Hopper S. D., Gioia P. (2004). The southwest Australian floristic region: evolution and conservation of a global hot spot of biodiversity. Annu. Rev. Ecology Evolution Systematics 35, 623–650. doi: 10.1146/annurev.ecolsys.35.112202.130201
Houston T. F. (2000). Native bees on wildflowers in Western Australia (Western Australian Insect Study Society).
Hudewenz A., Klein A.-M. (2013). Competition between honey bees and wild bees and the role of nesting resources in a nature reserve. J. Insect Conserv. 17, 1275–1283. doi: 10.1007/s10841-013-9609-1
Hudewenz A., Klein A. M. (2015). Red mason bees cannot compete with honey bees for floral resources in a cage experiment. Ecol. Evol. 5, 5049–5056. doi: 10.1002/ece3.2015.5.issue-21
Invasive Species Council (2009). ESCAPED GARDEN PLANTS AS A KEY THREATENING PROCESS: Submission in response to the nomination ‘Loss and degradation of native plant and animal habitat by invasion of escaped garden plants, including cultivated and aquatic plants’ (Fairfield, VIC: Invasive Species Council). Available online at: https://invasives.org.au/wp-content/uploads/2014/02/sub-escaped_garden_KTP_april09B.pdf.
Iwasaki J. M., Hogendoorn K. (2021). How protection of honey bees can help and hinder bee conservation. Curr. Opin. Insect Sci. 46, 112–118. doi: 10.1016/j.cois.2021.05.005
Kapustjanskij A., Streinzer M., Paulus H. F., Spaethe J. (2007). Bigger is better: implications of body size for flight ability under different light conditions and the evolution of alloethism in bumblebees. Funct. Ecol. 21, 1130–1136. doi: 10.1111/j.1365-2435.2007.01329.x
Kelly C. K., Bowler M. G. (2005). A new application of storage dynamics: differential sensitivity, diffuse competition, and temporal niches. Ecology 86, 1012–1022. doi: 10.1890/04-0091
Kevan P. G., Phillips T. P. (2001). The economic impacts of pollinator declines: an approach to assessing the consequences. Conserv. Ecol. 5, 8. doi: 10.5751/ES-00272-050108
Kim J.-Y. (1997). Female size and fitness in the leaf-cutter bee MegaChile apicalis. Ecol. Entomology 22, 275–282. doi: 10.1046/j.1365-2311.1997.00062.x
Kim J.-Y. (1999). Influence of resource level on maternal investment in a leaf-cutter bee (Hymenoptera: Megachilidae). Behav. Ecol. 10, 552–556. doi: 10.1093/beheco/10.5.552
Knauer A. C., Alaux C., Allan M. J., Dean R. R., Dievart V., Glauser G., et al. (2022). Nutritional stress exacerbates impact of a novel insecticide on solitary bees’ behaviour, reproduction and survival. Proc. R. Soc. B: Biol. Sci. 289, 20221013. doi: 10.1098/rspb.2022.1013
Krombein K. V. (1967). Trap-nesting wasps and bees: life histories, nests, and associates (Washington, DC: Smithsonian Press).
Layek U., Kundu A., Bisui S., Karmakar P. (2021). Impact of managed stingless bee and western honey bee colonies on native pollinators and yield of watermelon: A comparative study. Ann. Agric. Sci. 66, 38–45. doi: 10.1016/j.aoas.2021.02.004
Le Conte Y., Ellis M., Ritter W. (2010). Varroa mites and honey bee health: can Varroa explain part of the colony losses? Apidologie 41, 353–363. doi: 10.1051/apido/2010017
Lindström S., Herbertsson L., Rundlöf M., Bommarco R., Smith H. G. (2016). Experimental evidence that honeybees depress wild insect densities in a flowering crop. Proc. R. Soc. B 283. doi: 10.1098/rspb.2016.1641
Maclvor J. S. (2015). Building height matters: nesting activity of bees and wasps on vegetated roofs. Israel J. Ecol. Evol. 1, 1–9. doi: 10.1080/15659801.2015.1052635
Macivor J. S. (2016). Cavity-nest boxes for solitary bees: a century of design and research. Apidologie 48, 311–327. doi: 10.1007/s13592-016-0477-z
Macivor J. S., Packer L. (2016). The bees among us: modelling occupancy of solitary bees. PLoS One 11, e0164764. doi: 10.1371/journal.pone.0164764
Makinson J. C., Threlfall C. G., Latty T. (2016). Bee-friendly community gardens: Impact of environmental variables on the richness and abundance of exotic and native bees. Urban Ecosystems 20, 1–14. doi: 10.1007/s11252-016-0607-4
MacArthur R., Levins R. (1967). The limiting similarity, convergence, and divergence of coexisting species. Am. Nat. 101 (921), 377–385.
Mckinney M. L. (2006). Urbanization as a major cause of biotic homogenization. Biol. Conserv. 127, 247–260. doi: 10.1016/j.biocon.2005.09.005
Mckinney M. L. (2008). Effects of urbanization on species richness: a review of plants and animals. Urban ecosystems 11, 161–176. doi: 10.1007/s11252-007-0045-4
Mcveigh A. (2024). Densities of feral honey bee colonies utilising tree hollows in central Perth, Western Australia. Records Of Western Aust. Museum 63, 066. doi: 10.18195/issn.0312-3162.39.2024.063-066
NSW Threatened Species Scientific Committee. (2011). Competition from feral honeybees - key threatening process listing (NSW, Australia: NSW Government: Office of Environment & Heritage). Available at: http://www.environment.nsw.gov.au/determinations/feralhoneybeesktplisting.htm.
O’neill K. M., Delphia C. M., O’neill R. P. (2014). Oocyte size, egg index, and body lipid content in relation to body size in the solitary bee MegaChile rotundata. PeerJ 2, e314. doi: 10.7717/peerj.314
Page M. L., Williams N. M. (2023). Evidence of exploitative competition between honey bees and native bees in two California landscapes. J. Anim. Ecol. 92, 1802–1814. doi: 10.1111/1365-2656.13973
Paini D. R. (2004). Impact of the introduced honey bee (Apis mellifera) (Hymenoptera: Apidae) on native bees: a review. Austral Ecol. 29, 399–407. doi: 10.1111/j.1442-9993.2004.01376.x
Paini D. R., Roberts J. D. (2005). Commercial honey bees (Apis mellifera) reduce the fecundity of an Australian native bee (Hylaeus alcyoneus). Biol. Conserv. 123, 103–112. doi: 10.1016/j.biocon.2004.11.001
Paini D. R., Williams M. R., Roberts J. D. (2005). No short-term impact of honey bees on the reproductive success of an Australian native bee. Apidologie 36, 613–621. doi: 10.1051/apido:2005046
Pape Møller A., Díaz M. (2018). Niche segregation, competition, and urbanization. Curr. Zoology 64, 145–152. doi: 10.1093/cz/zox025
Pauw A., Hawkins J. A. (2011). Reconstruction of historical pollination rates reveals linked declines of pollinators and plants. Oikos 120, 344–349. doi: 10.1111/j.1600-0706.2010.19039.x
Peterson J. H., Roitberg B. D. (2006). Impact of resource levels on sex ratio and resource allocation in the solitary bee, megaChile rotundata. Environ. Entomology 35, 1404–1410. doi: 10.1603/0046-225X(2006)35[1404:IORLOS]2.0.CO;2
Peterson J. H., Roitberg B. D., Peterson J. (2006). Impacts of flight distance on sex ratio and resource allocation to offspring in the leafcutter bee, MegaChile rotundata. Behav. Ecol. Sociobiology 59, 589–596. doi: 10.1007/s00265-005-0085-9
Pianka E. R. (1974). Niche overlap and diffuse competition. Proc. Natl. Acad. Sci. 71, 2141–2145. doi: 10.1073/pnas.71.5.2141
Pitts-Singer T. L., James R. R. (2005). Emergence success and sex ratio of commercial alfalfa leafcutting bees from the United States and Canada. J. economic entomology 98, 1785–1790. doi: 10.1093/jee/98.6.1785
Potts S. G., Biesmeijer J. C., Kremen C., Neumann P., Schweiger O., Kunin W. E. (2010). Global pollinator declines: trends, impacts and drivers. Trends Ecol. Evol. 25, 345–353. doi: 10.1016/j.tree.2010.01.007
Potts S. G., Imperatriz-Fonseca V., Ngo H., Biesmeijer J., Breeze T. D., Dicks L., et al. (2016). Summary for policymakers of the assessment report of the Intergovernmental Science-Policy Platform on Biodiversity and Ecosystem Services on pollinators, pollination and food production (Bonn, Germany: Intergovernmental Science-Policy Platform on Biodiversity and Ecosystem Services).
Prendergast K. S. (2023a). Checking in at bee hotels: trap-nesting occupancy and fitness of cavity-nesting bees in an urbanised biodiversity hotspot. Urban Ecosystems 26, 1381–1395. doi: 10.1007/s11252-023-01381-5
Prendergast K. S. (2023b). Native flora receive more visits than exotics from bees, especially native bees, in an urbanised biodiversity hotspot. Pacific Conserv. Biol. 30, PC22033. doi: 10.1071/PC22033
Prendergast K. S., Dixon K. W., Bateman P. W. (2021a). Interactions between the introduced European honey bee and native bees in urban areas varies by year, habitat type and native bee guild. Biol. J. Linn. Soc. 133, 725–743. doi: 10.1093/biolinnean/blab024
Prendergast K. S., Dixon K. W., Bateman P. W. (2022a). The evidence for and against competition between the European honeybee and Australian native bees. Pacific Conserv. Biol. 29, 89–109. doi: 10.1071/PC21064
Prendergast K. S., Dixon K. W., Bateman P. W. (2022b). A global review of determinants of native bee assemblages in urbanised landscapes. Insect Conserv. Diversity 15, 385–405. doi: 10.1111/icad.12569
Prendergast K. S., Leclercq N., Vereecken N. J. (2021b). Honey bees (Hymenoptera: Apidae) outnumber native bees in Tasmanian apple orchards: Perspectives for balancing crop production and native bee conservation. Austral Entomology 60, 422–435. doi: 10.1111/aen.12521
Prendergast K., Menz M. H., Bateman B., Dixon K. (2020). The relative performance of sampling methods for native bees: an empirical test and review of the literature. Ecosphere 11, e03076. doi: 10.1002/ecs2.v11.5
Prendergast K., Ollerton J. (2021). Plant-pollinator networks in Australian urban bushland remnants are not structurally equivalent to those in residential gardens. Urban Ecosystems 24, 973–987. doi: 10.1007/s11252-020-01089-w
Prendergast K. S., Ollerton J. (2022a). Impacts of the introduced European honeybee on Australian bee-flower network properties in urban bushland remnants and residential gardens. Austral Ecol. 47, 35–53. doi: 10.1111/aec.13040
Prendergast K. S., Ollerton J. (2022b). Spatial and temporal scale of analysis alter conclusions about the effects of urbanisation on plant–pollinator networks. Arthropod-Plant Interactions. 16, 553–565. doi: 10.1007/s11829-022-09925-w
Prendergast K. S., Tomlinson S., Dixon K. W., Bateman P. W., Menz M. H. M. (2022c). Urban native vegetation remnants support more diverse native bee communities than residential gardens in Australia’s southwest biodiversity hotspot. Biol. Conserv. 265, 109408. doi: 10.1016/j.biocon.2021.109408
Pyke G. H. (1999). The introduced honeybee Apis mellifera and the precautionary principle: Reducing the conflict. Aust. Zoologist 31, 181–186. doi: 10.7882/AZ.1999.018
Pyke G. H., Prendergast K. S., Ren Z.-X. (2023). Pollination crisis Down-Under: Has Australasia dodged the bullet? Ecol. Evol. 13, e10639. doi: 10.1002/ece3.v13.11
Pyšek P. (1998). Alien and native species in Central European urban floras: a quantitative comparison. J. Biogeography 25, 155–163. doi: 10.1046/j.1365-2699.1998.251177.x
Radmacher S., Strohm E. (2010). Factors affecting offspring body size in the solitary bee Osmia bicornis (Hymenoptera, Megachilidae). Apidologie 41, 169–177. doi: 10.1051/apido/2009064
R Core Team (2014). R: A language and environment for statistical computing (Vienna, Austria: R Foundation for Statistical Computing).
Ropars L., Dajoz I., Fontaine C., Muratet A., Geslin B. (2019). Wild pollinator activity negatively related to honey bee colony densities in urban context. PLoS One 14, e0222316. doi: 10.1371/journal.pone.0222316
Roubik D. W., Moreno J. E., Vergara C., Wittmann D. (1986). Sporadic food competition with the African honey bee: projected impact on neotropical social bees. J. Trop. Ecol. 2, 97–111. doi: 10.1017/S0266467400000699
Roubik D. W., Wolda H. (2001). Do competing honey bees matter? Dynamics and abundance of native bees before and after honey bee invasion. Population Ecol. 43, 53–62. doi: 10.1007/PL00012016
Roulston T. H., Goodell K. (2011). The role of resources and risks in regulating wild bee populations. Annu. Rev. entomology 56, 293–312. doi: 10.1146/annurev-ento-120709-144802
Sandrock C., Tanadini L. G., Pettis J. S., Biesmeijer J. C., Potts S. G., Neumann P. (2014). Sublethal neonicotinoid insecticide exposure reduces solitary bee reproductive success. Agric. For. Entomol. 16 (2), 119–128.
Seidelmann K., Ulbrich K., Mielenz N. (2010). Conditional sex allocation in the Red Mason bee, Osmia rufa. Behav. Ecol. Sociobiol. 64, 337–347.
Sexton A. N., Benton S., Browning A. C., Emery S. M. (2021). Reproductive patterns of solitary cavity-nesting bees responsive to both local and landscape factors. Urban Ecosystems 24, 1271–1280. doi: 10.1007/s11252-021-01116-4
Shavit O., Dafni A., Ne’eman G. (2009). Competition between honeybees (Apis mellifera) and native solitary bees in the Mediterranean region of Israel—Implications for conservation. Israel J. Plant Sci. 57, 171–183. doi: 10.1560/IJPS.57.3.171
Somme L., Moquet L., Quinet M., Vanderplanck M., Michez D., Lognay G., et al. (2016). Food in a row: urban trees offer valuable floral resources to pollinating insects. Urban ecosystems 19, 1149–1161. doi: 10.1007/s11252-016-0555-z
Sugiura N. (1991). Male territoriality and mating tactics in the wool-carder bee, Anthidium septemspinosum Lepeletier (Hymenoptera: Megachilidae). J. Ethology 9, 95–103. doi: 10.1007/BF02350213
Thomson D. M. (2016). Local bumble bee decline linked to recovery of honey bees, drought effects on floral resources. Ecol. Lett. 10, 1247–1255. doi: 10.1111/ele.2016.19.issue-10
Thornhill A. H., Crisp M. D. (2012). Phylogenetic assessment of pollen characters in Myrtaceae. Aust. Systematic Bot. 25, 171–187. doi: 10.1071/SB11019
Torchio P. F., Tepedino V. J. (1980). Sex Ratio, Body Size and Seasonality in a Solitary Bee, Osmia lignaria propinqua Cresson (Hymenoptera: Megachilidae). Evolution 34, 993–1003. doi: 10.2307/2408004
Tyrväinen L., Pauleit S., Seeland K., De Vries S. (2005). “Benefits and uses of urban forests and trees,” in Urban forests and trees (Springer), 81–114.
Visscher P. K., Seeley T. D. (1982). Foraging strategy of honeybee colonies in a temperate deciduous forest. Ecology 63, 1790–1801. doi: 10.2307/1940121
Ward S. G., Amatangelo K. L. (2018). Suburban gardening in Rochester, New York: Exotic plant preference and risk of invasion. Landscape Urban Plann. 180, 161–165. doi: 10.1016/j.landurbplan.2018.09.004
Webb C. O., Ackerly D. D., Mcpeek M. A., Donoghue M. J. (2002). Phylogenies and community ecology. Annu. Rev. Ecol. systematics 33, 475–505. doi: 10.1146/annurev.ecolsys.33.010802.150448
Werren J. H. (1987). Labile sex ratios in wasps and bees. Bioscience 37, 498–506. doi: 10.2307/1310422
Wiens J. J., Ackerly D. D., Allen A. P., Anacker B. L., Buckley L. B., Cornell H. V., et al. (2010). Niche conservatism as an emerging principle in ecology and conservation biology. Ecol. Lett. 13, 1310–1324. doi: 10.1111/j.1461-0248.2010.01515.x
Wittmann K., Klein A.-M., Staab M. (2023). The influence of habitat properties on sex determination in cavity-nesting Hymenoptera. Basic Appl. Ecol. 70, 1–11. doi: 10.1016/j.baae.2023.04.001
Wood T., Michez D., Paxton R., Drossart M., Neumann P., Gérard M., et al. (2020). Managed honey bees as a radar for wild bee decline? Apidologie 51, 1–17. doi: 10.1007/s13592-020-00788-9
Zaninotto V., Fauviau A., Dajoz I. (2023). Diversity of greenspace design and management impacts pollinator communities in a densely urbanized landscape: the city of Paris, France. Urban Ecosystems 26, 503–515. doi: 10.1007/s11252-023-01351-x
Keywords: bee hotels, competition, fitness, introduced species, native bees, pollen, resource overlap, trap-nests
Citation: Prendergast K, Murphy MV, Kevan PG, Ren Z-X and Milne LA (2025) Introduced honey bees (Apis mellifera) potentially reduce fitness of cavity-nesting native bees through a male-bias sex ratio, brood mortality and reduced reproduction. Front. Bee Sci. 3:1508958. doi: 10.3389/frbee.2025.1508958
Received: 10 October 2024; Accepted: 21 April 2025;
Published: 20 May 2025.
Edited by:
Patrícia Nunes-Silva, University of the Rio dos Sinos Valley, BrazilReviewed by:
Stephen Buchmann, University of Arizona, United StatesVincent Dietemann, Agroscope - Swiss Bee Research Centre, Switzerland
Copyright © 2025 Prendergast, Murphy, Kevan, Ren and Milne. This is an open-access article distributed under the terms of the Creative Commons Attribution License (CC BY). The use, distribution or reproduction in other forums is permitted, provided the original author(s) and the copyright owner(s) are credited and that the original publication in this journal is cited, in accordance with accepted academic practice. No use, distribution or reproduction is permitted which does not comply with these terms.
*Correspondence: Kit Prendergast, a2l0cHJlbmRlcmdhc3QyMUBnbWFpbC5jb20=
‡ORCID: Kit Prendergast, orcid.org/0000-0002-1164-6099
Zong-Xin Ren, orcid.org/0000-0001-7265-065X