 Chih-Chung Ting
 Sebastian Gluth
- Department of Psychology and Hamburg Center of Neuroscience, Universität Hamburg, Hamburg, Germany
Eye movements are strongly linked to the perception of visual information and can be used to infer mental processes during decision-making. While eye-tracking technology has been available for several decades, the incorporation of eye-tracking data into computational models of decision making is relatively new in neuroeconomics. This review article provides an overview of the interaction between eye movement and choices, highlighting the value of eye-tracking data in decision-making research. First, we provide an overview of empirical work studying the interaction between eye movement and choices. In the second part, we present existing models that incorporate eye-tracking data into process models of decision-making, emphasizing their assumptions regarding the role of attention in choice formation and contrasting models that use gaze data to inform behavioral predictions with those that attempt to predict eye movements themselves. Additionally, we discuss the potential of using cognitive models to understand the connection between choice and gaze patterns and normative aspects of decision-making. Overall, this review underscores the significant role of eye-tracking data in understanding decision-making processes, particularly in the field of neuroeconomics, and its potential to provide valuable insights into individual differences in decision-making behavior.
1 Introduction
When making decisions in both real-life and laboratory settings, individuals selectively attend to specific information, search for relevant details, but also appear to overlook certain cues deliberately and systematically (Sims, 2003; Gluth et al., 2020; Sepulveda et al., 2020; for review, see Orquin et al., 2018; Wedel et al., 2023). Consequently, different sources of information usually receive unequal amounts of attention, and it is crucial to consider “what” information is perceived and “how” this information is processed when investigating decision-making. Over the past few decades, two powerful tools—eye-tracking technology and cognitive models—have been adopted to unravel these fundamental questions. Eye-tracking allows recording dynamic eye movements throughout the task, thereby offering invaluable insights into the role of visual (mostly overt) attention1 in information search and acquisition. In parallel, cognitive models specify the latent mechanism underlying decision-making. Yet, to date, only a few cognitive models recognize the integral role of eye movement in information processing and attempt to account for or even predict eye-movement patterns.
The emergence of this evolving class of models aligned in time with eye-tracking studies that revealed a robust link between option values, eye-movement patterns, and choice behavior, by now known as the Gaze cascade effect: people tend to look at more attractive options, and looking at an option increases its preference (Shimojo et al., 2003). The association between eye movements and choice behaviors is further supported by studies investigating the causal role of visual attention on choices. For instance, when the duration of option presentation was experimentally manipulated, participants tended to choose the option that was displayed relatively longer (Armel et al., 2008; Lim et al., 2011; Pärnamets et al., 2015; Tavares et al., 2017; Ghaffari and Fiedler, 2018; Pleskac et al., 2022). At the neural level, Lim et al. (2011) directed participants' gaze to one of two options using a cue, and the authors observed that the brain's representation of subjective value to identical options was modulated by participants' gaze positions. These findings, again, suggest that visual attention is involved in decision-making, emphasizing the importance of considering eye movements in cognitive models when studying mental processes.
The present review aims to introduce cognitive models that incorporate eye-tracking data. In particular, we elaborate on how these models utilize eye-movement data to capture the variability in choice patterns. Among the various forms of variability that are captured by these models, we mention inter- and intra-individual differences in speed-accuracy tradeoffs, variability in choices due to varying fixation patterns or varying strength gaze effects on preference formation, and variability in fixation patterns (as well as choice accuracy and response times) due to differences in search costs. To ensure accessibility for readers unfamiliar with eye-tracking studies, we will first introduce the visualization of eye-tracking data and how these measurements have been used to study choice behaviors. Subsequently, we will introduce existing models that incorporate eye-tracking data to predict purely behavioral measures (i.e., choices and response times) and their association with eye-tracking data. Then, we will discuss existing models that do not only predict behavior but also eye movements. In the final section, we will summarize the insights gained from these models and outline promising avenues for future research.
2 Eye movement basics and measures
Eyes serve as a mechanism for filtering visual information through gaze. Although the human eyes cover a broad visual field, detailed processing occurs primarily at the center of gaze (Figure 1A), as this spot refers to the fovea on the eye's retina (Loschky et al., 2005; Leigh and Zee, 2015). Consequently, monitoring gaze position provides a proxy for identifying what visual information is processed in detail. Modern eye trackers allow recording of this gaze position by detecting near-infrared light reflections from both the pupil and cornea. Gaze position is then measured in x-y coordinates based on the screen resolution (Figure 1B). With high temporal resolution, such as 1 kHz, it is possible to record gaze positions at very rapid rates at the millisecond level.
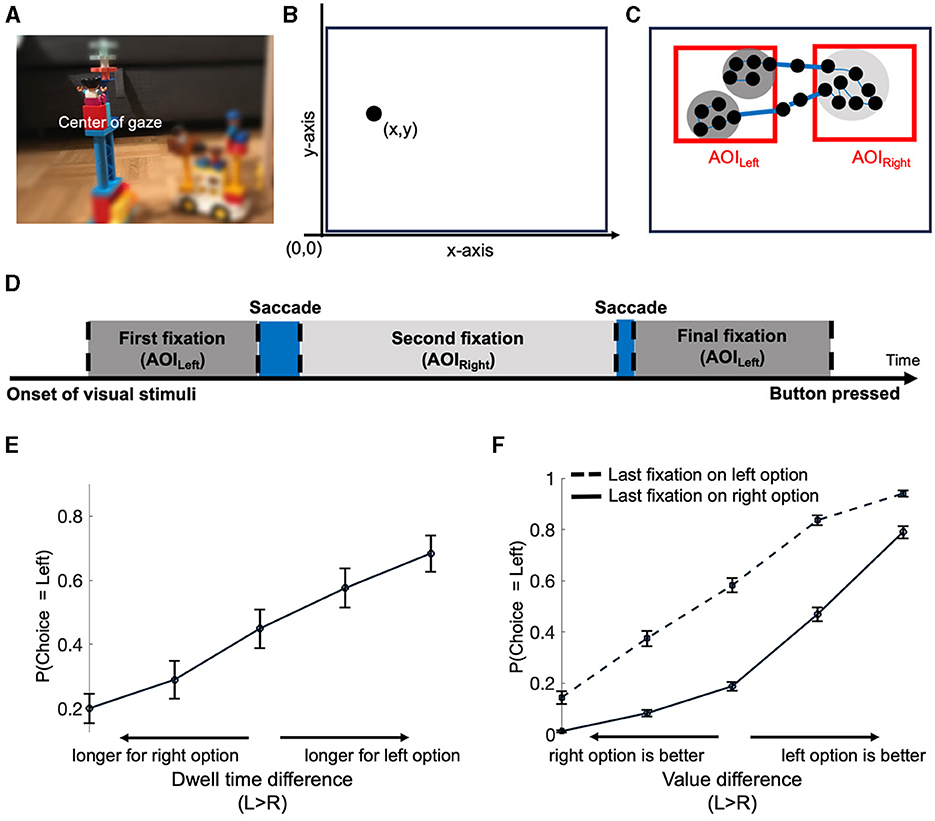
Figure 1. Tracking eye movements and their relationship with choices. (A) An example illustrating that only the central gaze point provides clear and sharp visual information, while peripheral areas exhibit blur and reduced clarity. (B) Presentation of an individual eye-tracking data point, quantified as an x-y coordinate relative to the reference point. In this example, the reference point is defined as the left-bottom corner of the screen (another typical reference point would be the center of the screen). (C) Dynamic eye movements recorded as multiple data points (samples), with successive samples forming fixations. Red rectangles on the left and right denote Areas of interest (AOIs) for the left and right options, respectively. Thick blue lines depict saccades between AOIs, while thin blue lines represent movements within an AOI. Each black dot corresponds to one data point. (D) Timeline summary of the example in (C), starting from displaying options to the moment of making a decision marked by the button-press. Dashed lines denote the separation of two eye-movement events (fixations and saccades). (E, F) Illustrations of gaze-related choice biases. (E) Relationship between choice and dwell time difference. Options with longer dwell times are associated with a higher probability of being chosen. (F) Association of the final fixation with the final choice. The option looked at last is more likely to be chosen, especially when the value difference is smaller. The data presented in (E, F) are taken from Ting and Gluth (2023).
The sequence of x-y coordinates is typically categorized based on spatial and temporal proximity, resulting in saccades which indicate dynamic shifts in gaze position, and fixations which represent time periods of (relatively) immobile gaze positions (Figures 1C, D). These sets of x-y coordinates are then labeled in terms of order (e.g., first, second fixation; first, second saccade) and areas of interest (AOIs) (Figure 1D). Summing up the same labeled x-y coordinates can be further used to quantify the tendency of focusing on specific AOIs, the so-called dwell time. For instance, in Figure 1D the dwell time of AOILeft is the combined duration of the two fixations within AOILeft (dark gray areas).
With respect to decision-making research, the described measures have revealed two robust relationships between gaze patterns (e.g., final fixation and dwell time) and choices. First, a longer dwell time on an option increases the likelihood of it being selected. Second, the last-fixated option is most often on the chosen option (Krajbich et al., 2010; Smith and Krajbich, 2019). To illustrate the former effect, the probability of selecting a particular option is depicted as a function of the dwell time difference (or dwell-time advantage) between options (e.g., Dwellleft – Dwellright) (Figure 1E). The latter effect is typically illustrated by the probability of choosing the left option as a function of the value difference between the left and right option (i.e., Valueleft – Valueright), separately for decisions in which the left option was fixated last and those with the final fixation on the right option (Figure 1F). Note that both effects indicate that people choose what they look at longer or/and last, which in turn seems to hint toward a causal influence of gaze's location on choice. In the next section, we will introduce cognitive models that implement this putative influence before turning to other theories that challenge this (uni-)directional interpretation (Section 4; see also Mormann and Russo, 2021).
3 Cognitive models incorporating eye-tracking data
Cognitive modeling of decisions has been widely used to quantify latent mental processes that underlie certain choice patterns. However, many choice models in behavioral economics, consumer psychology, and judgement and decision-making research only account for choices but not response times (e.g., Prospect Theory; Kahneman and Tversky, 1979). This could pose challenges when making inferences about information processing, because participants may address the speed-accuracy tradeoff (SAT) differently in the same task. Specifically, the observation of varied levels of choice consistency (i.e., probabilities of choosing options with higher subjective values) might originate from distinct levels of noise in the choice process or different SAT strategies. To resolve this ambiguity, it is necessary to take response times (RTs) into account (Smith and Ratcliff, 2004; Busemeyer et al., 2019). Following the same logic, if a cognitive model does not consider eye movements as part of information processing, then gaze-related choice biases such as the ones described above may be misattributed to other cognitive functions (Shevlin and Krajbich, 2021).
3.1 Sequential sampling models
With respect to the SAT ambiguity, sequential sampling models (SSMs) resolve this concern by accounting for choice and RT simultaneously. In the framework of SSMs, a decision is viewed as the outcome of accumulating noisy evidence (e.g., value differences between options) over time until that accumulated evidence reaches a threshold. In the case of the Diffusion Decision Model (DDM), arguably the most dominant variant of SSM (Smith and Ratcliff, 2004; Ratcliff et al., 2016), the evidence for the left option vs. the right option in a value-based decision-making task is assumed to be accumulated from one time point to the next as follows:
where RDVt−1 refers to relative decision value at time point t−1, ν refers to the drift rate or the strength of the evidence, and ε is the noise sampled from a normal distribution (mean = 0, standard deviation = σ). The drift rate (ν) is computed as the value2 difference between options with scaling parameter d that governs the overall speed of accumulation:
It is notable that the way we introduce DDMs in this paper differs from the original version of DDMs in two key aspects. Firstly, we assume evidence accumulation to occur at discrete time points (e.g., every millisecond). While this is different from the classical DDM assuming continuous evidence accumulation over time (Ratcliff, 1978; Smith and Ratcliff, 2004), discrete evidence accumulation can approximate continuous evidence accumulation when time steps become minuscule. Secondly, our assumption that the drift rate (ν) is a function of value difference between options (and thus the difficulty of a decision) in Equation 2 does not need to be made. It can also be estimated as a free parameter. Note, however, that a strong link between drift rate and difficulty has been established for both perceptual (Ratcliff and Rouder, 1998) and value-based decision-making contexts (Krajbich et al., 2010; Fisher, 2017).
Another standard sub-class of SSM are accumulator models (or race models), which assume an accumulation trace for the value of each option. Unlike DDMs, the existence of multiple parallel accumulation processes allows these models to be easily extended to contexts with more than two options (i.e., multiple-alternative decisions): n accumulators for n options race against each other until one reaches the threshold.
Diffusion and accumulator models correctly predict that value difference positively influences the probability of choosing the option of higher value and negatively influences RT. That is, when one option has a much larger value than the rest (e.g., VLeft > VRight), the rate of accumulation will be accelerated toward the threshold of that option (aLeft or aRight),3 resulting in a faster decision and higher probability of choosing that option. Apart from value difference, the threshold in SSMs also affects choice and RT, as it determines the amount of evidence needed for eliciting a choice and thus plays a crucial role in the SAT. Specifically, when the threshold is low, decisions are made rapidly and are more prone to errors (e.g., choosing the option of lower value). This increased susceptibility to wrong choices is due to the greater impact of random noise on the decision process. With lower thresholds, there is less time for the accumulation process to approximate the mean of drift rate. On the contrary, decisions are made more deliberately and are more likely to be accurate when the threshold is higher. Thus, SSMs allow disambiguating changes in task difficulty (e.g., intensity of stimuli or value difference) and SAT adjustments by considering RT in addition to choices themselves. Alongside these model predictions, both variants of SSM introduced above have been used as the basic frameworks for incorporating eye-tracking data and elucidating gaze-related choice biases. Next, we will introduce two of such extensions of the diffusion model and the accumulator model.
3.2 Diffusion model incorporating eye movements
The attentional drift-diffusion model (aDDM; Krajbich et al., 2010) extends the DDM by incorporating eye movements as integral components of information processing and assumes that visual attention amplifies the value difference between attended and unattended options. Specifically, unlike the conventional DDMs assuming that all available information equally contributes to the evidence accumulation process, the aDDM discounts the unattended option by multiplying it with parameter θ (with 0 ≤ θ ≤ 1):
Hence, alongside the value difference (Vleft – Vright), the strength of evidence, quantified as drift rate ν at the time point t, is jointly determined by the fixation location (e.g., on the left or right option) and the discounting parameter θ.
The inclusion of θ and gaze location in Equation 3 allows the aDDM to capture gaze-related choice biases. In particular, the aDDM predicts that the probability of choosing an option is increased when it is viewed longer than other options (Figure 1D). To illustrate, consider a scenario where you are deciding between two comparable options (i.e., VLeft = VRight = 10) and you look at the left option 90% of the time in a trial.4 According to Equation 3 and assuming d = 1 and θ = 0.3, 90% of the time evidence will be accumulated according to VLeft – θ × VRight and thus 10 – 0.3*10 = 7, and only 10% of the time the accumulation will follow θ × VLeft – VRight and thus 0.3*10 – 10 = −7. Stated differently, we can specify an average drift rate in favor of the left option (see also below) as ν = 0.9*7 – 0.1*7 = 5.6, indicating an accumulation dynamic toward the left option despite equal subjective values (see also Section 3.2.3). The same example demonstrates how the other gaze-related choice bias can be explained: the final fixation is more likely to be on the final choice (Figure 1E), because the accumulation process is most often heading toward (and ultimately ending at) the currently fixated option.
In addition to gaze-related choice biases, the multiplicative aDDM also accounts for a critical RT pattern: the magnitude effect. This phenomenon refers to a negative correlation between RT and the overall attractiveness or intensity of the available options. Numerous studies have demonstrated that individuals often decide quicker when confronted with more salient options in perceptual tasks (e.g., choosing between two bright options) or more appealing choices in value-based decisions (e.g., selecting between favorite snacks) (Polanía et al., 2014; Teodorescu et al., 2016; Gluth et al., 2018, 2020; Frömer et al., 2019; Smith and Krajbich, 2019; Sepulveda et al., 2020; Shevlin et al., 2022; Ting and Gluth, 2023). The multiplicative aDDM has been employed to model and explain this specific behavioral tendency (Ratcliff, 2018; Smith and Krajbich, 2019; Pirrone and Gobet, 2021; Pirrone et al., 2022). Recall that in Equation 3 the drift rate is defined by both individual options' values and θ. Therefore, even when the value difference and θ are fixed, the drift rate is larger when option values are generally higher. Imagine you are choosing between two options, either from set A (with values 10 vs. 10) or from set B (with values 5 vs. 5). When the scaling parameter d is 1 and the discounting parameter θ is 0.3, the value of the unattended option will be discounted more when the overall values of the options are higher (set A: 10 – 0.3 * 10 = 7 or 0.3 * 10 – 10 = −7) compared to when the option values are lower (set B: 5 – 0.3 * 5 = 3.5 or 0.3 * 5 – 5 = −3.5). As a consequence, the evidence trace tends to move toward the threshold of the attended option, facilitating the speed of evidence accumulation and resulting in shorter RTs (Figure 2A). In contrast, when the discounting parameter θ is 1, the drift rate remains identical in both sets regardless of the gaze location resulting in no relationship between RT and overall value (Figure 2B).
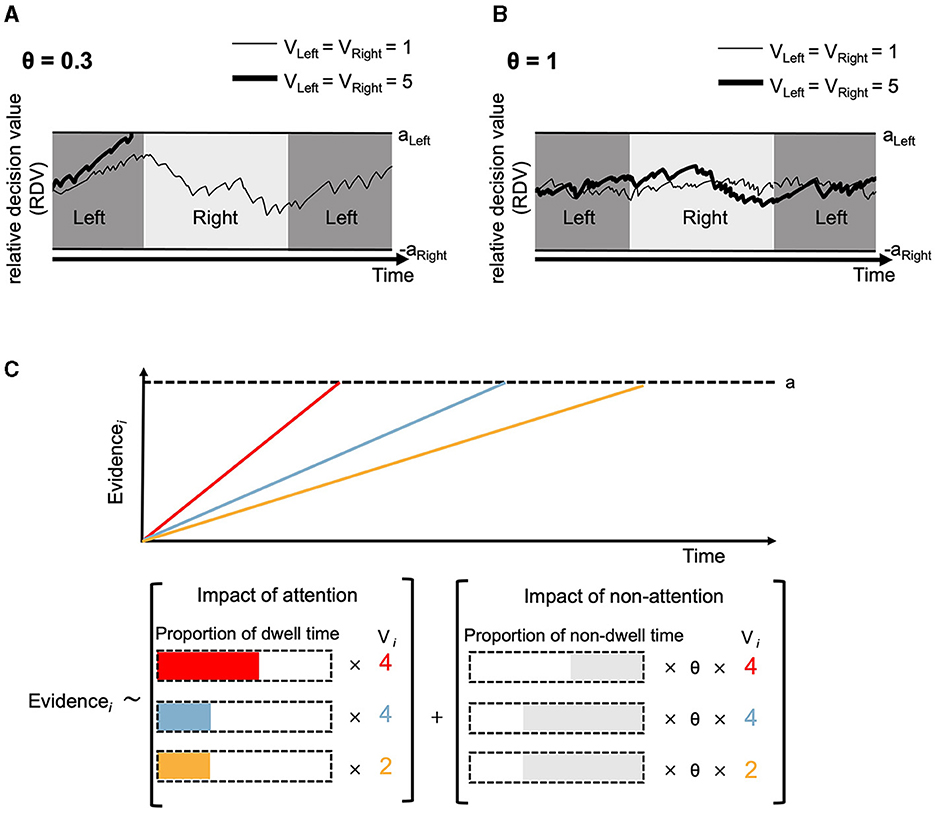
Figure 2. Illustrations of evidence accumulation predicted by aDDM in a two-alternative choice (A, B) and by GLAM in a three-alternative choice (C). (A) Evidence accumulation is affected by attention (θ = 0.3). When θ is smaller than 1 and the two options share the same value, the value difference is amplified as the non-fixated option is discounted by θ. This effect is more pronounced when option values are generally high (thick line) than when they are generally low (thin line). Consequently, it leads to accelerated evidence accumulation (i.e., drift) rate, reaching the threshold (aLeft or aRight) earlier, hence, resulting in shorter RT. (B) When the discounting factor θ in the aDDM is 1 and two options share the same values, the relative decision value is primarily determined by noise, irrespective of the fixation location. (C) Upper panel: GLAM assumes evidence for three options are accumulated separately over time. Each color line represents the path of evidence accumulation for each option. To facilitate parameter estimation, GLAM does not model within-trial noise in accumulation (semi-transparent line) but instead use the drift rate as the slope of a linear and noiseless accumulation process. This figure is reproduced from Thomas et al. (2019). Lower panel: the drift rate for each option depends on the option's value Vi, but also on how much this option has been looked at in a given trial.
To amplify the value difference between attended and unattended options, an alternative approach is adding a specific value to the attended option (Cavanagh et al., 2014). In contrast to the multiplicative aDDM, this additive version of aDDM assumes a general influence of attention on drift rate regardless of option value. Specifically, given the fixation location, the drift rate is increased or decreased with a constant value η (with η > 0), independent of option value:
While both multiplicative aDDM and additive aDDM encompass the notion that attention plays a causal role in valuation and successfully predict gaze-related biases, it is noteworthy that the additive aDDM cannot explain the negative relationship of overall value and RT. Note, however, that other accounts of the overall value effect on RT are conceivable (Mormann and Russo, 2021; Pirrone et al., 2021), and that a recent study (Westbrook et al., 2020) proposed a hybrid account of first multiplicative but then additive effects of attention within single choices.
3.2.1 Extending the aDDM to multi-alternative decisions
With the same idea of discounting unattended options, the aDDM has been extended for multi-alternative choice problems (i.e., choosing between three or more options) (Krajbich and Rangel, 2011). For example, Krajbich and Rangel (2011) conducted an experiment in which participants had to make a decision among three options presented on the right, left and the center of the screen. In order to adapt the aDDM to the data from this ternary decision, the researchers computed a drift rate in one accumulator for each option given their option values (V), gaze location, and the discounting parameter θ:
When attention is directed toward an option, the drift rate associated with that option is calculated without attentional bias (i.e., θ = 1). For each option i, evidence (Ei, t) at timepoint t is then updated by the drift rate in Equation 5. This accumulated evidence is then used to compute the relative decision value (RDV). Unlike Equation 1 directly comparing two latent values and forming a single RDV, three RDVs are computed for three options by comparing the accumulated evidence of one option to the maximum of the rest of accumulated evidence.
As a result of Equation 6, RDV of an option is greater and more likely to reach the threshold first when the option is fixated longer and when the option value is higher.
3.2.2 aDDM in multi-attribute decisions
Real-life decisions often involve considering multiple attributes for each option. In order to investigate how people evaluate options and make decisions in such scenarios, individual attributes of options are presented separately on the screen in a laboratory setting (e.g., two attributes of two options are presented at the four corners of the screen). This setup allows tracking eye-movement patterns at the attribute level and, for instance, categorizing fixations into two key search patterns: within-attribute search (comparing options within the same attribute) and within-alternative search (evaluating all attributes within an option). Notably, many previous studies found that gaze patterns were more in line with the view that participants' choices emerge from the comparison of one or two attributes between options, rather than integrating all attributes within an option into a single value (Noguchi and Stewart, 2014, 2018; but see Glickman et al., 2019). These findings imply that attentional effects may not be restricted to the assessment of options as a whole but rather extend to the evaluation of attributes.
To take the attribute level into account, variants of attention-dependent SSM have been proposed (Amasino et al., 2019; Glickman et al., 2019; Fisher, 2021; Molter et al., 2022; Yang and Krajbich, 2023). For example, Yang and Krajbich's (2023) multi-attribute attentional drift-diffusion model (maaDDM) discounts both unattended options and unattended attributes with discounting parameters θ and ϕ, respectively. When faced with a choice between the left option and right options, each comprising attributes A (e.g., VLeft, A and VRight, A) and B (e.g., VLeft, B and VRight, B), the drift rate can be expressed as:
Estimates of these two discounting parameters (i.e., θ and ϕ) were taken from the best fitting model and compared (θ – ϕ). The authors found that the impact of attention at the alternative level (θ) is smaller than its impact at the attribute level (ϕ) (Fisher, 2021; Yang and Krajbich, 2023). Furthermore, the unattended option's attribute is discounted most as it is discounted by both discounting parameters. However, it remains unclear whether this is due to the more cognitive element of currently not “thinking about” the unattended attribute of the unattended option, or the more perceptual element of “not seeing” the unattended attribute of the unattended option as it is furthest away from the fixation center. Overall, these models not only account for gaze-related biases but also quantify the impact of visual attention in multi-attribute decisions.
3.2.3 Enhancing efficiency in parameter estimation
First instantiations of the aDDM (e.g., Krajbich et al., 2010) used a time-consuming parameter estimation approach. This involved simulating the model and identifying parameter values that approximated the maximum likelihood given the data through grid search. To enhance the efficiency of estimating the aDDM, Cavanagh et al. (2014) summarized the dynamic fixation patterns as the proportion of dwell time on each option and computed the average drift rate per trial. Specifically, Equation 3 is reformulated by incorporating the proportion of dwell time (PD) for each option:
where β1 represents the impact of fixated option and β2 represented the impact of non-fixated option. In comparison to Equation 3, β1 and β2 are equivalent to d and d*θ, respectively. Thus, the discounting factor θ can be written as β1/β2 in Equation 8. The advantage of this approach is that a single average drift rate per trial can be defined, once the dwell time for each option is known. This allows using the DDM's closed-form solution of the first passage time problem (i.e., the question of when the first crossing of a decision threshold is to be expected), which is implemented in many toolboxes such as the hierarchical DDM package (Wiecki et al., 2013), which in turn greatly simplifies, accelerates, and improves parameter estimation (see also our 90/10% example above as well as Lombardi and Hare, 2021).
3.3 Gaze-weighted Linear Accumulator Model
The aDDMs have been applied to both two and multiple-alternative decisions. However, only the traditional aDDMs for the two-alternative decision possess a closed-form solution (Cavanagh et al., 2014). To enhance efficiency in parameter estimation for multi-alternative aDDMs, one potential approach involves accumulating evidence for each option based on the proportion of dwell time on that option. The Gaze-weighted Linear Accumulator Model (GLAM; Thomas et al., 2019) implements this idea. Specifically, GLAM uses the framework of accumulator models and assumes that the average drift rate (νi) for each option in each trial is computed as a linear combination of option value (Vi) and the proportion of dwell time on the option, expressed by the following equation:
where PDi represents the proportion of dwell time spent on option i, and θ denotes the discounting factor for the proportion of time the option is not attended (see Figure 2C for visual illustration). The average drift rates in Equation 9 are then used to compute the relative decision values (RDV)
which are subsequently scaled to a range of 0–1. In Equation 10, these scaled values are then employed to update the evidence for each option (Figure 2C, top).
It has been shown that GLAM is capable of predicting the gaze-related choice biases in binary, ternary and even 36-alternative decisions (Thomas et al., 2019, 2021; Weilbächer et al., 2021). Unlike most other SSMs, GLAM does not estimate non-decision time (NDT), which usually accounts for motor and perceptual processing that is unrelated to the decision or accumulation process itself. This might be problematic, as the model may misattribute the variability of RT caused by purely sensory or motor components to changes in information processing.
3.4 Applications
The parameter θ in aDDM and GLAM not only quantifies the impact of gaze on valuation during evidence accumulation but also provides an opportunity to explore how visual attention influences valuation in different contexts. For example, Weilbächer et al. (2021) observed a heightened influence of gaze on information processing and choices when participants needed to retrieve options from memory. This effect was evident through lower θ (i.e., discounting the unattended option more) in memory-demanding conditions, suggesting that the attentional bias is further amplified by memory demands. Relatedly, Eum et al. (2023) manipulated the visibility of the unattended option via a gaze-contingent design and observed that the influence of attention on valuation is more pronounced (i.e., lower θ) when the unattended option is hidden compared to when it is visible. This suggests that peripheral viewing, beyond the center of gaze, also plays a role in determining the level of discounting. Overall, these findings not only demonstrated that the strength of the association between gaze and choice is modulated by factors such as memory demand and peripheral viewing but also emphasize the usefulness of θ in quantifying the extent of attentional impact across various contexts.
The inclusion of eye-movement data in models also improves comprehension of the mechanisms contributing to variability in choice patterns, like the probability of choosing an option (Thomas et al., 2019), confidence (Brus et al., 2021), and risk attitude (Zilker and Pachur, 2023). For instance, Thomas et al. (2019) reanalyzed data from perceptual and preferential tasks using GLAM and found that individual difference in task performance (i.e., probability of choosing the correct item) can be predicted by the estimated gaze-bias parameter. Zilker and Pachur (2022) employed the aDDM to simulate and reanalyze data involving choices between risky (i.e., outcomes with probabilities < 1) and safe options (i.e., certain outcomes). Their findings revealed that the aDDM with θ < 1 predicted a positive relationship between choice and gaze allocation: the probability of choosing the safe option increased when the likelihood of evaluating the safe option was higher. Additionally, the strength of the distortion in subjective probability, as predicted by the Cumulative Prospect Theory (CPT; Kahneman and Tversky, 1979), exhibited a systematic association with the probability of fixating on the safe option. Notably, these associations were not observed when employing aDDM with θ of 1, indicating a pivotal role of visual attention in subjective probability formation and risk attitude. Overall, although descriptive models of choice (e.g., CPT) are widely used to quantify individual differences in decision-making, cognitive models incorporating eye-movement data possibly offer a more fine-grained, mechanistic understanding of the underlying processes.
3.5 Considerations for implementing aDDMs and GLAM
The models introduced in Section 3 allow researchers to take gaze data into account when predicting the relationship between valuation, attention, and choice. Yet, these model predictions rely on many, often implicit assumptions. Some of assumptions have been empirically tested. For instance, Pirrone and Gobet (2021) tested the implicit assumption that θ has a constant value regardless of option values. By reanalyzing two existing datasets, the authors found that the impact of visual attention on choice are not significantly different between the high and low overall value condition (but see Ting and Gluth, 2023). Other assumptions, like the additive or multiplicative role of fixation on valuation (see Equations 3, 4), are still under debate. In particular, despite the additive aDDM not predicting a negative relationship of overall value and response time, some studies found that additive aDDM outperformed multiplicative aDDM in the context of reinforcement learning tasks (Cavanagh et al., 2014; Smith and Krajbich, 2019). Another assumption of the aDDM under debate is the definition and measurement of attention (Mormann and Russo, 2021): whether visual attention is equivalent to the center of gaze if people can perceive specific visual information without moving their eyes. For instance, a recent study demonstrated that participants can selectively use visual features (i.e., the color and direction of moving dots) to make decisions, even when the stimuli were concurrently presented at the center of the screen (Shenhav et al., 2018). The finding implies that people can implement feature-based attention without moving their eyes. However, whether feature-based attention biases decisions in a manner predicted by the aDDM remains an open question at this point.
Last but not least, these models assume that attention plays a causal role in preference formation. This assumption is supported by several studies that manipulated when or how long each option is looked at (Armel et al., 2008; Lim et al., 2011; Pärnamets et al., 2015; Tavares et al., 2017; Ghaffari and Fiedler, 2018; Pleskac et al., 2022). For example, Pärnamets et al. (2015) found that, in moral decision tasks, participants were more likely to choose a target option that they were forced to fixate longer. Similarly, Pleskac et al. (2022) showed that spatial cueing could successfully alter gaze patterns and influence final decisions in both perceptual and value-based tasks. A recent meta-analysis by Bhatnagar and Orquin (2022) looked at 21 studies using different attention manipulation paradigms, finding that changes in gaze patterns on average positively affect final choices, confirming the causal role of gaze in preference formation. While the assumption about the impact of attention on choice is consistent with empirical evidence, these models do not account for the possibility that preference may also influence gaze allocation: People tend to look at more attractive options (Shimojo et al., 2003; Fiedler and Glöckner, 2012; Orquin and Mueller Loose, 2013; Gluth et al., 2018, 2020), suggesting a bi-directional relationship of valuation and attention. As discussed in the next section, other models have thus been put forward to predict where and when people move their eyes while making decisions.
4 Models predicting fixation patterns and gaze-related choice biases
In this section, we will introduce two groups of models that extend evidence accumulation concept and include algorithms to allow the prediction of fixation patterns.
4.1 Predicting fixations
Inspired by the fact that fixation patterns are robustly influenced by bottom-up factors (e.g., the brightness of an option) and top-down considerations (e.g., maximize payoff) (Awh et al., 2012; Orquin et al., 2021), some models have attempted to link fixation allocation to uncertainty about the stimuli (Cassey et al., 2013; Song et al., 2019), physical salience (Towal et al., 2013) and the latent option value (Towal et al., 2013; Gluth et al., 2020). With respect to the latter, Gluth et al. (2020) extended the aDDM by assuming that the probability of looking at one option i is driven by accumulated evidence E (see Equation 7 and aDDM in multi-alternative decisions). This assumption is realized using a softmax function as follows:
where γ is a free parameter determining how strongly fixations are driven by value (if γ = 0, the probability to fixate at each option is independent of option value). The algorithm extended by Equation 11 maintains the original aDDM's ability to capture the distribution of choice and RT as well as the gaze-related choice biases. Additionally, the model accounts for the fact that people tend to look more and more at the most promising choice candidates, which aligns with Gaze cascade effect (Shimojo et al., 2003; Krajbich et al., 2010; Smith and Krajbich, 2019).
4.2 Predicting gaze patterns while accounting for cognitive costs
The final category of models discussed in this review article is rooted in the Bayesian framework and inspired by rationality considerations. Given that information search and acquisition are time-consuming and (cognitively) costly, these models address the question of how to move the eyes efficiently in order to save resources while still making good decisions. Generally speaking, this question has been raised in different fields, including neuroscience (Tajima et al., 2016), economics (Sims, 2003), and psychology (Lieder and Griffiths, 2020). Using the Bayesian framework, these models assume that beliefs about stimuli are updated by integrating the initial value representation of each stimulus (prior) with new incoming evidence (likelihood).
When participants decide between two options, they may not initially possess a clear value representation for each stimulus. As a result, the mean value of each option should be centered around 0 with high uncertainty (represented by the variance of the value distribution). The uncertainty in the value representation of the option decreases as more visual information is sampled by looking at the option. Figure 3A illustrates this process and depicts how the integration of prior and likelihood results in a new distribution where the mean and variance deviate from the initial value representation. This feature distinguishes Bayesian evidence accumulation models from aDDM in two key aspects. First, in aDDMs and GLAM, fixations are used to sample and update a point of the belief (i.e., the mean of the value representation) at each time step. In contrast, Bayesian evidence accumulation models dynamically update both the mean and variance of the value representation with an increase in the number of fixations within a trial. Second, the Bayesian evidence accumulation models offer researchers a means to explore the relationship between the variance of value representation and fixation patterns. This concept has been integrated into models to predict the probability of switching gaze in both two-alternative tasks (Song et al., 2019; Jang et al., 2021) and multi-alternative tasks (Callaway et al., 2021; Li and Ma, 2021). For example, the models predict that people are more likely to look at options that received less attention so far within a trial, so that the variance of value representation for those options would be reduced by more samples. They also predict that the durations of later fixations are longer compared to early fixations, as more samples are needed to change beliefs when those beliefs have reached some precision already due to earlier fixations (Song et al., 2019; Callaway et al., 2021).
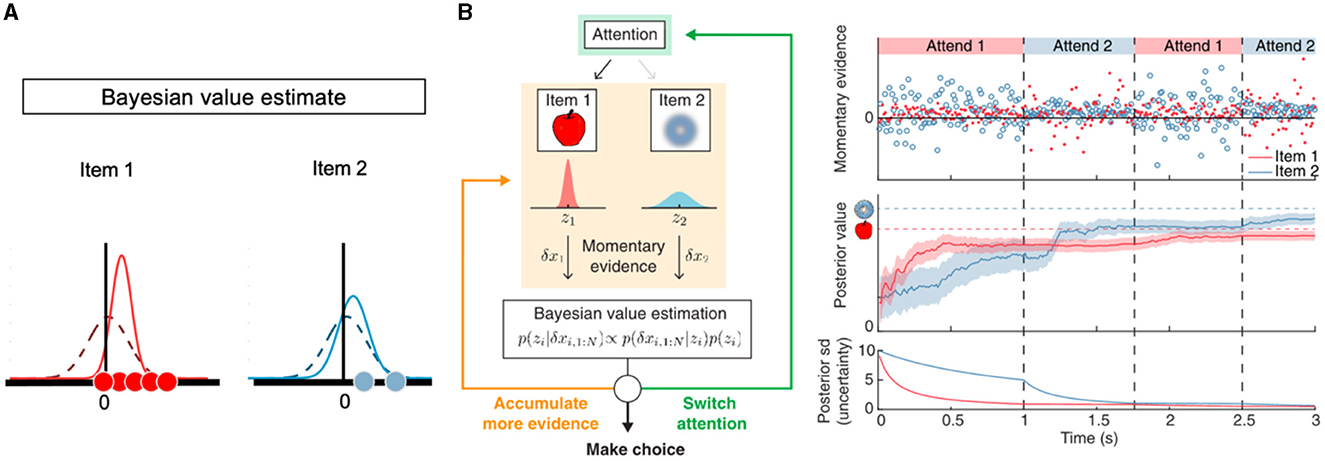
Figure 3. Illustrations of Bayesian updating models that incorporate attention. (A) In the Bayesian framework, a value representation of each option is updated by integrating prior knowledge and incoming information. Initially, the prior knowledge for two options (red and blue) is modeled as two Gaussian distributions centered at 0 with equal variance (dashed curves). Upon gathering new evidence (dots), the mean and variance of these distributions are updated, resulting in posterior distributions (solid curves). Notably, the posterior distributions become narrower when the size of new evidence is larger and more reliable. (B) Left panel: At each time point, individuals face the decision to choose one of the options, switch gaze allocation (shown in green), or maintain attention on the same option to sample more information (depicted in orange). When visual attention is directed to a specific option, momentary information from that option is sampled and utilized to update the value representation in a Bayesian manner. Right panel: attention-determined momentary information not only updates the value of the option but also reduces the uncertainty associated with the value representation for the option. This figure is adapted from Jang et al. (2021).
Moving eyes to the relevant information takes time and effort (Gabaix et al., 2006; Manohar and Husain, 2013). Therefore, sampling information through gaze forever would be irrational for a decision-maker with limited time and resources, especially when more than two options are available (Reutskaja et al., 2011, 2018; Thomas et al., 2021). Thus, decision-makers must determine when to cease exploration and commit to a choice. The models address this dilemma by assessing the (expected) benefits and costs associated with three actions: choose one option, switch the gaze allocation, or stay in the same option to sample more information (Figure 3B). While some of these models use this framework to approximate “optimal observers” capable of maximizing the accuracy or expected reward of an action (e.g., Callaway et al., 2021; Jang et al., 2021), others acknowledge the high complexity of these computations and build in psychologically plausible simplifications such as looking only one step ahead (e.g., Gabaix et al., 2006). Despite these subtle differences, these models share the feature of not only predicting eye movements (e.g., negative relationship between the number of fixations and value difference) but also making testable predictions on how changing the costs of computations should shape information search in value-based decisions.
It is worth noting that both DDMs and Bayesian evidence accumulation models predict negative relationship between the number of fixations and value difference but based on different assumptions. In DDMs, a larger drift rate (scaling with value difference) reduces response time and fixations as the decision threshold is reached faster. By contrast, Bayesian models that consider the balance between the benefits and costs of additional fixations find it rational to use fewer fixations when value differences are larger.
The Bayesian evidence accumulation models effectively capture behavioral patterns and gaze-related choice biases without assuming a causal influence of attention on valuation (a key feature in aDDMs). In binary decisions, however, the Bayesian models can only account for the positive association of dwell time and choice probability when assuming that the prior distribution of option values underestimates the actual values (Callaway et al., 2021; Jang et al., 2021). This is because by default these models predict that sampling the better option is as informative as sampling the worse option. In case of underestimated values, however, more sampling will lead to more positive updating and thus increase the probability of choice. It appears at least questionable whether people systematically underestimate values at the beginning of a (binary) choice, and future investigations should assess this speculation empirically.
4.3 Considerations for predicting fixation patterns
Although models discussed in Section 4 assume that attention is influenced by factors such as value, physical salience, or uncertainty, some studies indicate that visual attention can also be driven by the goal of the task (Kovach et al., 2014; Sepulveda et al., 2020 for review, see Frömer and Shenhav, 2022). For instance, Sepulveda et al. (2020) found that participants devoted more time to looking at low/high option values when the goal of the task was to choose unattractive/attractive options, suggesting that gaze allocation might reflect high-level cognitive processes. However, a recent meta-analysis suggested that bottom-up factors, like the surface and the position of the visual stimuli, might exert a similar or even stronger impact on gaze patterns (Orquin et al., 2021). These findings highlight an ongoing debate regarding the factors that influence visual attention toward options in value-based decisions.
5 Summary and future directions
An emerging body of literature underscores the significance of eye-tracking data and cognitive models in investigating the mechanisms of decision-making (Itti and Koch, 2001; Krajbich, 2019; Wedel et al., 2023). Our review focuses on the models conceptualizing information processes as dynamic evidence accumulation (aDDMs and Bayesian sampling models), where eye movements represent an integral part of this process. The inclusion of eye-movement data enables the models to investigate the association between choice and fixation patterns across decision domains. More importantly, they quantify the hypothetical role of eye movement in decision formation, offering a chance for future studies to testify their predictions under different contexts.
5.1 Future directions of using cognitive models incorporating eye-movement data
The integration of eye-movement data into cognitive models provides researchers with a powerful tool to explore the behavioral and neural mechanisms underlying choice pattern variability. Here, we propose three potential avenues for future research using the models introduced in this review. First of all, models incorporating stopping rules and the parameters quantifying attentional bias could be further used to investigate inter- and intra-individual differences in decision processes or in cognitive capacities (e.g., working memory capacity) between groups. For instance, Reutskaja et al. (2011, 2018) employed tasks with relatively large set sizes (e.g., choosing between 4, 9, or 16 options) and found that both fixation duration and the speed of eye movement increased linearly with larger set sizes. Reanalyzing these data using the cognitive models introduced in this review could provide valuable insights into how final decisions are formed and whether these models can be generalized to decisions involving more options. Second, these models offer a pathway to investigate the role of eye movements in context effects, which refer to changes in preference between two options triggered by the introduction of a third option. While many studies have extended SSMs by incorporating attention components, such as attribute weight and order of attention allocation, to address individual differences in context effects (Trueblood et al., 2014, 2022; Spektor et al., 2021; Hayes et al., 2023; for review, see Busemeyer et al., 2019), only few attempts have been made to quantify visual attention using eye-movement data (Noguchi and Stewart, 2018; Molter et al., 2022). Currently, neither the aDDMs nor Bayesian evidence accumulation models adequately account for context effects, opening avenues for further exploration. To bridge these disconnected branches of decision-making research, future studies could delve deeper into these concepts by leveraging eye-movement data to identify specific metrics of gaze patterns that more accurately reflect hypothetical attention weights. Moreover, future studies could also identify the gaze allocation before/after the third option is introduced and implement these observations to inform the refinement or development of models in this area.
Third, considering SSMs and eye movements often quantify information processing at high temporal resolution (i.e., each time step of evidence accumulation lasts just 10 milliseconds or less), future studies could leverage this feature to delve deeper into the neural mechanisms underlying the impact of visual attention on decision-making. Previous studies have looked into the impact of gaze allocation on the neural valuation system (Hare et al., 2011a; Lim et al., 2011) and analyzed brain imaging data with model predictions from SSM (Smith and Ratcliff, 2004; Hare et al., 2011b; Gluth et al., 2012), separately. The integration of cognitive models, eye-movement data and neuroscientific methods open an opportunity for future studies to investigate human behaviors from different level of analysis simultaneously. Furthermore, the connection between model predictions and neural signals can further substantiate the hypothetical role of visual information with biological evidence (Smith and Ratcliff, 2004).
5.2 Concluding remarks
While numerous models take attention into account, only those integrating eye movement components, such as data measured by eye trackers, explain the relationship between visual attention and choices. Incorporating dynamic visual attention into decision-making mechanisms via cognitive models not only mirror real-life information acquisition and processing but also enables researchers to explain more variability in choice patterns. Crucially, these cognitive models provide a framework for future studies to extensively examine the interaction between visual attention, options, and preferences, spanning both behavioral and neural levels.
Author contributions
C-CT: Conceptualization, Software, Visualization, Writing – original draft, Writing – review & editing. SG: Conceptualization, Supervision, Writing – original draft, Writing – review & editing.
Funding
The author(s) declare financial support was received for the research, authorship, and/or publication of this article. This work was funded by the European Research Council (ERC) under the European Union's Horizon 2020 Research and Innovation Program (Grant Agreement No. 948545 to SG) as well as by the German Research Foundation (Grant no. GL 984/1-1 to SG).
Conflict of interest
The authors declare that the research was conducted in the absence of any commercial or financial relationships that could be construed as a potential conflict of interest.
Publisher's note
All claims expressed in this article are solely those of the authors and do not necessarily represent those of their affiliated organizations, or those of the publisher, the editors and the reviewers. Any product that may be evaluated in this article, or claim that may be made by its manufacturer, is not guaranteed or endorsed by the publisher.
Footnotes
1. ^Unlike covert attention, which selectively processes information without orienting the eyes, eye movements measured by eye-tracker are commonly used to infer visual overt attention and where a participant is looking. Despite controversies surrounding the interchangeability of eye movement and attention (Mormann and Russo, 2021), these two terms play similar roles in selecting and filtering information. While visual information can be perceived without directly looking at items (i.e., covert attention), the looked-at items are often processed in more detail (Deubel and Schneider, 1996). Furthermore, eye movement and attention might share the same neural mechanisms as they are associated with the activation of the superior colliculus, a brain region associated with saccade preparation (Kustov and Lee Robinson, 1996). Given the strong connection and similar functions observed between eye movements and attention, we use these two terms interchangeably throughout the rest of the review.
2. ^In studies using consumer products, the value of each option is usually measured as the level of liking, wanting, or willingness to pay (Gluth et al., 2015; Frömer et al., 2019; Amasino et al., 2023). In studies using intertemporal choices or risky gambles, value is often transformed by a function such as hyperbolic discounting or Prospect Theory's value and weighting functions (Gluth et al., 2017; Amasino et al., 2019; Zilker and Pachur, 2023).
3. ^In diffusion models, upper and lower thresholds are respectively associated with two options, typically represented as a and -a (Figure 2A) or a and 0. In accumulator models, each option has its own accumulator, usually starting a 0 and racing toward its threshold of height a.
4. ^The percentage of time allocated to each option discussed here serves merely as a simplistic illustration and is not directly forecasted by the models. In practical application, fixation durations in these models are typically derived from actual data. While gaze patterns are associated with option features such as attractiveness or salience, we will delve into this aspect in Section 4.
References
Amasino, D. R., Dolgin, J., and Huettel, S. A. (2023). Eyes on the account size: interactions between attention and budget in consumer choice. J. Econ. Psychol. 97:102632. doi: 10.1016/j.joep.2023.102632
Amasino, D. R., Sullivan, N. J., Kranton, R. E., and Huettel, S. A. (2019). Amount and time exert independent influences on intertemporal choice. Nat. Hum. Behav. 3, 383–392. doi: 10.1038/s41562-019-0537-2
Armel, K. C., Beaumel, A., and Rangel, A. (2008). Biasing simple choices by manipulating relative visual attention. Judgm. Decis. Mak. 3, 396–403. doi: 10.1017/S1930297500000413
Awh, E., Belopolsky, A. V., and Theeuwes, J. (2012). Top-down versus bottom-up attentional control: a failed theoretical dichotomy. Trends Cogn. Sci. 16, 437–443. doi: 10.1016/j.tics.2012.06.010
Bhatnagar, R., and Orquin, J. L. (2022). A meta-analysis on the effect of visual attention on choice. J. Exp. Psychol. Gen. 151, 2265–2283. doi: 10.1037/xge0001204
Brus, J., Aebersold, H., Grueschow, M., and Polania, R. (2021). Sources of confidence in value-based choice. Nat. Commun. 12:7337. doi: 10.1038/s41467-021-27618-5
Busemeyer, J. R., Gluth, S., Rieskamp, J., and Turner, B. M. (2019). Cognitive and neural bases of multi-attribute, multi-alternative, value-based decisions. Trends Cogn. Sci. 23, 251–263. doi: 10.1016/j.tics.2018.12.003
Callaway, F., Rangel, A., and Griffiths, T. L. (2021). Fixation patterns in simple choice reflect optimal information sampling. PLoS Comput. Biol. 17:e1008863. doi: 10.1371/journal.pcbi.1008863
Cassey, T. C., Evens, D. R., Bogacz, R., Marshall, J. A. R., and Ludwig, C. J. H. (2013). Adaptive sampling of information in perceptual decision-making. PLoS ONE 8:e78993. doi: 10.1371/journal.pone.0078993
Cavanagh, J. F., Wiecki, T. V., Kochar, A., and Frank, M. J. (2014). Eye tracking and pupillometry are indicators of dissociable latent decision processes. J. Exp. Psychol. Gen. 143, 1476–1488. doi: 10.1037/a0035813
Deubel, H., and Schneider, W. X. (1996). Saccade target selection and object recognition: evidence for a common attentional mechanism. Vis. Res. 36, 1827–1837. doi: 10.1016/0042-6989(95)00294-4
Eum, B., Dolbier, S., and Rangel, A. (2023). Peripheral visual information halves attentional choice biases. Psychol. Sci. 34, 984–998. doi: 10.1177/09567976231184878
Fiedler, S., and Glöckner, A. (2012). The dynamics of decision making in risky choice: an eye-tracking analysis. Front. Psychol. 3:335. doi: 10.3389/fpsyg.2012.00335
Fisher, G. (2017). An attentional drift diffusion model over binary-attribute choice. Cognition 168, 34–45. doi: 10.1016/j.cognition.2017.06.007
Fisher, G. (2021). A multiattribute attentional drift diffusion model. Organ. Behav. Hum. Decis. Process. 165, 167–182. doi: 10.1016/j.obhdp.2021.04.004
Frömer, R., Dean Wolf, C. K., and Shenhav, A. (2019). Goal congruency dominates reward value in accounting for behavioral and neural correlates of value-based decision-making. Nat. Commun. 10:4926. doi: 10.1038/s41467-019-12931-x
Frömer, R., and Shenhav, A. (2022). Filling the gaps: cognitive control as a critical lens for understanding mechanisms of value-based decision-making. Neurosci. Biobehav. Rev. 134:104483. doi: 10.1016/j.neubiorev.2021.12.006
Gabaix, X., Laibson, D., Moloche, G., and Weinberg, S. (2006). Costly information acquisition: experimental analysis of a boundedly rational model. Am. Econ. Rev. 96:1043. doi: 10.1257/aer.96.4.1043
Ghaffari, M., and Fiedler, S. (2018). The power of attention: using eye gaze to predict other-regarding and moral choices. Psychol. Sci. 29, 1878–1889. doi: 10.1177/0956797618799301
Glickman, M., Sharoni, O., Levy, D. J., Niebur, E., Stuphorn, V., and Usher, M. (2019). The formation of preference in risky choice. PLoS Comput. Biol. 15:e1007201. doi: 10.1371/journal.pcbi.1007201
Gluth, S., Hotaling, J. M., and Rieskamp, J. (2017). The attraction effect modulates reward prediction errors and intertemporal choices. J. Neurosci. 37, 371–382. doi: 10.1523/JNEUROSCI.2532-16.2016
Gluth, S., Kern, N., Kortmann, M., and Vitali, C. L. (2020). Value-based attention but not divisive normalization influences decisions with multiple alternatives. Nat. Hum. Behav. 4, 634–645. doi: 10.1038/s41562-020-0822-0
Gluth, S., Rieskamp, J., and Buchel, C. (2012). Deciding when to decide: time-variant sequential sampling models explain the emergence of value-based decisions in the human brain. J. Neurosci. 32, 10686–10698. doi: 10.1523/JNEUROSCI.0727-12.2012
Gluth, S., Sommer, T., Rieskamp, J., and Büchel, C. (2015). Effective connectivity between hippocampus and ventromedial prefrontal cortex controls preferential choices from memory. Neuron 86, 1078–1090. doi: 10.1016/j.neuron.2015.04.023
Gluth, S., Spektor, M. S., and Rieskamp, J. (2018). Value-based attentional capture affects multi-alternative decision making. Elife 7:e39659. doi: 10.7554/eLife.39659.029
Hare, T. A., Malmaud, J., and Rangel, A. (2011a). Focusing attention on the health aspects of foods changes value signals in vmPFC and improves dietary choice. J. Neurosci. 31, 11077–11087. doi: 10.1523/JNEUROSCI.6383-10.2011
Hare, T. A., Schultz, W., Camerer, C. F., O'Doherty, J. P., and Rangel, A. (2011b). Transformation of stimulus value signals into motor commands during simple choice. Proc. Nat. Acad. Sci. U. S. A. 108, 18120–18125. doi: 10.1073/pnas.1109322108
Hayes, W. M., Holmes, W., and Trueblood, J. S. (2023). Attribute comparability and context effects in preferential choice [Preprint]. PsyArXiv. doi: 10.31234/osf.io/cq79y
Itti, L., and Koch, C. (2001). Computational modelling of visual attention. Nat. Rev. Neurosci. 2, 194–203. doi: 10.1038/35058500
Jang, A. I., Sharma, R., and Drugowitsch, J. (2021). Optimal policy for attention-modulated decisions explains human fixation behavior. Elife 10:e63436. doi: 10.7554/eLife.63436.sa2
Kahneman, D., and Tversky, A. (1979). Prospect theory: an analysis of decision under risk. Econometrica 47:263. doi: 10.2307/1914185
Kovach, C. K., Sutterer, M. J., Rushia, S. N., Teriakidis, A., and Jenison, R. L. (2014). Two systems drive attention to rewards. Front. Psychol. 5:46. doi: 10.3389/fpsyg.2014.00046
Krajbich, I. (2019). Accounting for attention in sequential sampling models of decision making. Curr. Opin. Psychol. 29, 6–11. doi: 10.1016/j.copsyc.2018.10.008
Krajbich, I., Armel, C., and Rangel, A. (2010). Visual fixations and the computation and comparison of value in simple choice. Nat. Neurosci. 13:10. doi: 10.1038/nn.2635
Krajbich, I., and Rangel, A. (2011). Multialternative drift-diffusion model predicts the relationship between visual fixations and choice in value-based decisions. Proc. Nat. Acad. Sci. U. S. A. 108, 13852–13857. doi: 10.1073/pnas.1101328108
Kustov, A. A., and Lee Robinson, D. (1996). Shared neural control of attentional shifts and eye movements. Nature 384, 74–77. doi: 10.1038/384074a0
Leigh, R. J., and Zee, D. S. (2015). The Neurology of Eye Movements, 5th Edn. Oxford: Oxford University Press.
Li, Z.-W., and Ma, W. J. (2021). An uncertainty-based model of the effects of fixation on choice. PLoS Comput. Biol. 17:e1009190. doi: 10.1371/journal.pcbi.1009190
Lieder, F., and Griffiths, T. L. (2020). Resource-rational analysis: understanding human cognition as the optimal use of limited computational resources. Behav. Brain Sci. 43:e1. doi: 10.1017/S0140525X1900061X
Lim, S.-L., O'Doherty, J. P., and Rangel, A. (2011). The decision value computations in the vmPFC and striatum use a relative value code that is guided by visual attention. J. Neurosci. 31, 13214–13223. doi: 10.1523/JNEUROSCI.1246-11.2011
Lombardi, G., and Hare, T. (2021). Piecewise constant averaging methods allow for fast and accurate hierarchical Bayesian estimation of drift diffusion models with time-varying evidence accumulation rates [Preprint]. PsyArXiv. doi: 10.31234/osf.io/5azyx
Loschky, L., McConkie, G., Yang, J., and Miller, M. (2005). The limits of visual resolution in natural scene viewing. Vis. cogn. 12, 1057–1092. doi: 10.1080/13506280444000652
Manohar, S. G., and Husain, M. (2013). Attention as foraging for information and value. Front. Hum. Neurosci. 7:711. doi: 10.3389/fnhum.2013.00711
Molter, F., Thomas, A. W., Huettel, S. A., Heekeren, H. R., and Mohr, P. N. C. (2022). Gaze-dependent evidence accumulation predicts multi-alternative risky choice behaviour. PLoS Comput. Biol. 18:e1010283. doi: 10.1371/journal.pcbi.1010283
Mormann, M., and Russo, J. E. (2021). Does attention increase the value of choice alternatives? Trends Cogn. Sci. 25, 305–315. doi: 10.1016/j.tics.2021.01.004
Noguchi, T., and Stewart, N. (2014). In the attraction, compromise, and similarity effects, alternatives are repeatedly compared in pairs on single dimensions. Cognition 132, 44–56. doi: 10.1016/j.cognition.2014.03.006
Noguchi, T., and Stewart, N. (2018). Multialternative decision by sampling: a model of decision making constrained by process data. Psychol. Rev. 125, 512–544. doi: 10.1037/rev0000102
Orquin, J. L., Lahm, E. S., and Stojić, H. (2021). The visual environment and attention in decision making. Psychol. Bull. 147, 597–617. doi: 10.1037/bul0000328
Orquin, J. L., and Mueller Loose, S. (2013). Attention and choice: a review on eye movements in decision making. Acta Psychol. 144, 190–206. doi: 10.1016/j.actpsy.2013.06.003
Orquin, J. L., Perkovic, S., and Grunert, K. G. (2018). Visual biases in decision making. Appl. Econ. Perspect. Policy 40, 523–537. doi: 10.1093/aepp/ppy020
Pärnamets, P., Johansson, P., Hall, L., Balkenius, C., Spivey, M. J., and Richardson, D. C. (2015). Biasing moral decisions by exploiting the dynamics of eye gaze. Proc. Nat. Acad. Sci. U. S. A. 112, 4170–4175. doi: 10.1073/pnas.1415250112
Pirrone, A., and Gobet, F. (2021). Is attentional discounting in value-based decision making magnitude sensitive? J. Cogn. Psychol. 33, 327–336. doi: 10.1080/20445911.2021.1890091
Pirrone, A., Reina, A., and Gobet, F. (2021). Input-dependent noise can explain magnitude-sensitivity in optimal value-based decision-making. Judgm. Decis. Mak. 16, 1221–1233. doi: 10.1017/S1930297500008408
Pirrone, A., Reina, A., Stafford, T., Marshall, J. A. R., and Gobet, F. (2022). Magnitude-sensitivity: rethinking decision-making. Trends Cogn. Sci. 26, 66–80. doi: 10.1016/j.tics.2021.10.006
Pleskac, T. J., Yu, S., Grunevski, S., and Liu, T. (2022). Attention biases preferential choice by enhancing an option's value. J. Exp. Psychol. 152, 993–1010 doi: 10.31234/osf.io/n3ghb
Polanía, R., Krajbich, I., Grueschow, M., and Ruff, C. C. (2014). Neural oscillations and synchronization differentially support evidence accumulation in perceptual and value-based decision making. Neuron 82, 709–720. doi: 10.1016/j.neuron.2014.03.014
Ratcliff, R. (1978). A theory of memory retrieval. Psychol. Rev. 85, 59–108. doi: 10.1037/0033-295X.85.2.59
Ratcliff, R. (2018). Modeling 2-alternative forced-choice tasks accounting for both magnitude and difference effects. Cogn. Psychol. 22:2. doi: 10.1016/j.cogpsych.2018.02.002
Ratcliff, R., and Rouder, J. N. (1998). Modeling response times for two-choice decisions. Psychol. Sci. 9, 347–356. doi: 10.1111/1467-9280.00067
Ratcliff, R., Smith, P. L., Brown, S. D., and McKoon, G. (2016). Diffusion decision model: current issues and history. Trends Cogn. Sci. 20, 260–281. doi: 10.1016/j.tics.2016.01.007
Reutskaja, E., Lindner, A., Nagel, R., Andersen, R. A., and Camerer, C. F. (2018). Choice overload reduces neural signatures of choice set value in dorsal striatum and anterior cingulate cortex. Nat. Hum. Behav. 2, 925–935. doi: 10.1038/s41562-018-0440-2
Reutskaja, E., Nagel, R., Camerer, C. F., and Rangel, A. (2011). Search dynamics in consumer choice under time pressure: an eye-tracking study. Am. Econ. Rev. 101, 900–926. doi: 10.1257/aer.101.2.900
Sepulveda, P., Usher, M., Davies, N., Benson, A. A., Ortoleva, P., and De Martino, B. (2020). Visual attention modulates the integration of goal-relevant evidence and not value. Elife 9:e60705. doi: 10.7554/eLife.60705.sa2
Shenhav, A., Straccia, M. A., Musslick, S., Cohen, J. D., and Botvinick, M. M. (2018). Dissociable neural mechanisms track evidence accumulation for selection of attention versus action. Nat. Commun. 9:2485. doi: 10.1038/s41467-018-04841-1
Shevlin, B. R. K., and Krajbich, I. (2021). Attention as a source of variability in decision-making: accounting for overall-value effects with diffusion models. J. Math. Psychol. 105:102594. doi: 10.1016/j.jmp.2021.102594
Shevlin, B. R. K., Smith, S. M., Hausfeld, J., and Krajbich, I. (2022). High-value decisions are fast and accurate, inconsistent with diminishing value sensitivity. Proc. Nat. Acad. Sci. U. S. A. 119:e2101508119. doi: 10.1073/pnas.2101508119
Shimojo, S., Simion, C., Shimojo, E., and Scheier, C. (2003). Gaze bias both reflects and influences preference. Nat. Neurosci. 6, 1317–1322. doi: 10.1038/nn1150
Sims, C. A. (2003). Implications of rational inattention. J. Monet. Econ. 50, 665–690. doi: 10.1016/S0304-3932(03)00029-1
Smith, P. L., and Ratcliff, R. (2004). Psychology and neurobiology of simple decisions. Trends Neurosci. 27, 161–168. doi: 10.1016/j.tins.2004.01.006
Smith, S. M., and Krajbich, I. (2019). Gaze amplifies value in decision making. Psychol. Sci. 30, 116–128. doi: 10.1177/0956797618810521
Song, M., Wang, X., Zhang, H., and Li, J. (2019). Proactive information sampling in value-based decision-making: deciding when and where to saccade. Front. Hum. Neurosci. 13:35. doi: 10.3389/fnhum.2019.00035
Spektor, M. S., Bhatia, S., and Gluth, S. (2021). The elusiveness of context effects in decision making. Trends Cogn. Sci. 25, 843–854. doi: 10.1016/j.tics.2021.07.011
Tajima, S., Drugowitsch, J., and Pouget, A. (2016). Optimal policy for value-based decision-making. Nat. Commun. 7:12400. doi: 10.1038/ncomms12400
Tavares, G., Perona, P., and Rangel, A. (2017). The attentional drift diffusion model of simple perceptual decision-making. Front. Neurosci. 11:468. doi: 10.3389/fnins.2017.00468
Teodorescu, A. R., Moran, R., and Usher, M. (2016). Absolutely relative or relatively absolute: violations of value invariance in human decision making. Psychon. Bull. Rev. 23, 22–38. doi: 10.3758/s13423-015-0858-8
Thomas, A. W., Molter, F., and Krajbich, I. (2021). Uncovering the computational mechanisms underlying many-alternative choice. Elife 10:e57012. doi: 10.7554/eLife.57012
Thomas, A. W., Molter, F., Krajbich, I., Heekeren, H. R., and Mohr, P. N. C. (2019). Gaze bias differences capture individual choice behaviour. Nat. Hum. Behav. 3, 625–635. doi: 10.1038/s41562-019-0584-8
Ting, C.-C., and Gluth, S. (2023). High overall values mitigate gaze-related effects in perceptual and preferential choices [Preprint]. PsyArXiv. doi: 10.31234/osf.io/dvj7z
Towal, R. B., Mormann, M., and Koch, C. (2013). Simultaneous modeling of visual saliency and value computation improves predictions of economic choice. Proc. Nat. Acad. Sci. U. S. A. 110, E3858–E3867. doi: 10.1073/pnas.1304429110
Trueblood, J. S., Brown, S. D., and Heathcote, A. (2014). The multiattribute linear ballistic accumulator model of context effects in multialternative choice. Psychol. Rev. 121, 179–205. doi: 10.1037/a0036137
Trueblood, J. S., Liu, Y., Murrow, M., Hayes, W. M., and Holmes, W. (2022). Attentional Dynamics Explain the Elusive Nature of Context Effects [Preprint]. PsyArXiv. doi: 10.31234/osf.io/hj8dg
Wedel, M., Pieters, R., and Van Der Lans, R. (2023). modeling eye movements during decision making: a review. Psychometrika 88, 697–729. doi: 10.1007/s11336-022-09876-4
Weilbächer, R. A., Krajbich, I., Rieskamp, J., and Gluth, S. (2021). The influence of visual attention on memory-based preferential choice. Cognition 215:104804. doi: 10.1016/j.cognition.2021.104804
Westbrook, A., van den Bosch, R., Määtt,ä, J. I., Hofmans, L., Papadopetraki, D., Cools, R., et al. (2020). Dopamine promotes cognitive effort by biasing the benefits versus costs of cognitive work. Science 367, 1362–1366. doi: 10.1126/science.aaz5891
Wiecki, T. V., Sofer, I., and Frank, M. J. (2013). HDDM: hierarchical bayesian estimation of the drift-diffusion model in Python. Front. Neuroinf. 7:14. doi: 10.3389/fninf.2013.00014
Yang, X., and Krajbich, I. (2023). A dynamic computational model of gaze and choice in multi-attribute decisions. Psychol. Rev. 130, 52–70. doi: 10.1037/rev0000350
Zilker, V., and Pachur, T. (2022). Nonlinear probability weighting can reflect attentional biases in sequential sampling [Preprint]. PsyArXiv. doi: 10.31234/osf.io/dqexn
Keywords: attention, eye-movement, cognitive model, decision-making, drift-diffusion model (DDM), Bayesian
Citation: Ting C-C and Gluth S (2024) Unraveling information processes of decision-making with eye-tracking data. Front. Behav. Econ. 3:1384713. doi: 10.3389/frbhe.2024.1384713
Received: 10 February 2024; Accepted: 24 July 2024;
Published: 16 August 2024.
Edited by:
Rosemarie Nagel, University Pompeu Fabra University, SpainReviewed by:
Veronika Zilker, Max Planck Institute for Human Development, GermanySzonya Durant, University of London, United Kingdom
Joanne Harris, University of South Australia Online, Australia
Copyright © 2024 Ting and Gluth. This is an open-access article distributed under the terms of the Creative Commons Attribution License (CC BY). The use, distribution or reproduction in other forums is permitted, provided the original author(s) and the copyright owner(s) are credited and that the original publication in this journal is cited, in accordance with accepted academic practice. No use, distribution or reproduction is permitted which does not comply with these terms.
*Correspondence: Chih-Chung Ting, Y2hpaGNodW5nLnRpbmdAdW5pLWhhbWJ1cmcuZGU=