Abstract
Introduction:
Employment screening based on personalities gives applicants incentives to misrepresent themselves. Studies of group differences on personality measures primarily examine differences on measures taken without incentives for misrepresentation. Incentives may matter for group differences for at least two reasons. First, groups with different unincentivized means have different scope to distort their responses—differences in “opportunity-to-fake.” Second, groups may differ in their notions of what constitutes a desirable personality.
Methods:
We use a within-subject laboratory experiment to examine group differences on Big Five measures. Subjects first responded without incentives. A week later, subjects viewed a job ad and were informed that bonuses would be paid to subjects best fitting the hiring criteria. The treatments varied the information in the ad about desired personality traits.
Results:
Controlling for opportunity-to-fake, we find evidence of racial but not gender differences in faking. Incentives attenuate gender differences on unincentivized personality measures but lead to racial differences where no differences exist on unincentivized measures. In every instance where a gap emerged on an incentivized measure where none existed on the unincentivized measure, the minority group would be disadvantaged were hiring based on the measure. We assess whether protected groups would be adversely impacted from selection on incentivized measures using the realized group differences in the experiment and the Equal Employment Opportunity Commission's “four-fifth's” rule. We find no evidence that women would be adversely affected by selection on incentivized personality measures, but racial minorities would be adversely impacted in the majority of trait-treatment comparisons.
Discussion:
Given the prevalence of personality testing in employment screening, more research is needed on how the incentives for response distortion present in hiring influence racial differences on personality measures and whether any such differences influence hiring outcomes.
1 Introduction
Meta-analyses document small to medium-sized associations between personality measures and job performance (Barrick and Mount, 1991; Tett et al., 1991; Salgado, 1997; He et al., 2019; Watrin et al., 2023), and the use of personality tests in applicant screening has been shown to improve firm performance and selection outcomes (Ichniowski et al., 1997; Autor and Scarborough, 2008; Hoffman et al., 2018). Despite their widespread use in selection, evidence concerning the effects on protected groups of personality testing in hiring is limited. Autor and Scarborough (2008) found that minority hiring rates at a firm's establishments were no different when screening was based on personality testing than when based on informal interviews, and meta-analyses in psychology have found little evidence of potential adverse impacts from personality testing on women (Hough et al., 2001) and minorities (Foldes et al., 2008). The studies in these meta-analyses, however, primarily examine group differences on unincentivized measures even though tests in selection are necessarily incentivized. Furthermore, the U.S. Equal Employment Opportunity Commission (EEOC) in 2018 found it probable that Best Buy adversely impacted applicants based on race through its use of personality tests (U. S. Equal Employment Opportunity Commission, 2018).
This study investigates how incentives influence gender and race differences on personality tests in a within-subject, laboratory experiment. Subjects first completed Big Five personality measures without incentives.1 About a week later, the subjects were given a job ad and took personality and IQ tests. Subjects were informed that a bonus would be paid to subjects who best met the hiring criteria. In the Extroversion (Introversion) treatment, the ad indicated that an extrovert (introvert) was desired, while in the No Priming treatment the ad contained no information about desired personality.
Using the unincentivized measures, women in our sample were more agreeable but less open and emotionally stable than men. Incentives, however, proved a great equalizer as we fail to reject the gender equality of the mean scores for all traits in all treatments using the incentivized measures.
Turning to racial differences, East Asian subjects were less extroverted, open, and emotionally stable than White subjects using the unincentivized measures. These differences, however, are not attenuated in many cases when measured with incentives. Given a clear indication of the desired personality trait in the Extroversion treatment, the East Asian-White gaps in extroversion and openness attenuate. Given no information in the No Priming treatment or counterintuitive priming in the Introversion treatment, the East Asian-White gaps fail to attenuate and in some cases gaps emerge that did not exist using the unincentivized measures.
Our “other race” category consists of non-White, non-East Asian subjects. These subjects were more conscientious than White subjects using the unincentivized measures, but there were no significant differences for other traits. By contrast, we find significant differences using the incentivized extroversion, agreeableness and emotional stability measures in the Introversion treatment. For conscientiousness, the gap favoring subjects of other races using the unincentivized measure reverses signs and is insignificant using the incentivized measure. Similar patterns exist in the No Priming treatment, suggesting that unusual personality requirements or the absence of cues result in incentivized measures that disadvantage subjects of other races relative to White subjects.
To assess whether hypothetical hiring based on incentivized measures would adversely impact women or minorities, we apply the EEOC's “four-fifths rule” under which a protected group is deemed adversely impacted by a hiring practice if the fraction of the protected group selected is < 80% of the fraction selected from the reference group. Using this rule, we find little evidence that women would be adversely impacted by selection based on any incentivized measure in any treatment. By contrast, East Asians and individuals of other races would be adversely impacted by selection on incentivized personality scores in half to two-thirds of the trait-treatment combinations in the experiment.
The data used in our study were originally examined in McGee and McGee (2024), which tested hypotheses about the correlations between incentivized and unincentivized personality measures, the influence of subject characteristics on incentivized measures, and the mediating effects of information about desired traits. That study documented that incentivized personality scores were weakly to moderately correlated with unincentivized personality scores, but the information provided in the job ads had little effect on these correlations. Most relevant for our study, McGee and McGee (2024) found little evidence that the subject characteristics they hypothesized would influence incentivized personality measures (e.g., IQ, Machiavellianism, impression management, willingness to lie) could explain the heterogeneity in these measures.2 By contrast, our secondary analysis of the same data suggests that racial differences—characteristics that were not hypothesized to influence incentivized personality measures when the experiment was conceived—might underpin some of the heterogeneity in incentivized scores.
Our study makes two primary contributions. First, we contribute to the literature on non-cognitive traits by highlighting that incentives and the information available to test-takers can influence gender and race differences on personality measures. In their review of personality psychology, Almlund et al. (2011) stress accounting for the role of incentives and situations when measuring personality. Our findings suggest that these factors may also influence measured group differences. In this respect, the study complements (Gneezy et al., 2019), who find that incentives influence group differences on cognitive tests between students in the United States and China.
Second, we demonstrate that the racial differences on incentivized Big Five measures in our sample are large enough to adversely impact minorities in hypothetical selection. Understanding the effects of personality testing on protected groups is particularly important as algorithmic screening using personality tests becomes more widespread in recruitment. While several studies evaluate the biases that machine learning may introduce in hiring (e.g., Li et al., 2020; Cowgill, 2020), there is little evidence on the biases that personality tests may introduce.3 Especially noteworthy from our study is that where racial differences emerge on incentivized tests where no similar differences exist on the unincentivized tests, in every instance these racial differences would disadvantage minorities relative to their white peers. Personalities are assessed in many contexts, and selection on incentivized personality measures has been shown to influence the racial distribution of selected individuals.4 Were our findings to generalize to other settings, racial differences in personality misrepresentation could disadvantage minorities in outcomes ranging from university admissions to promotion decisions.
2 Background
Whether personality tests adversely impact protected groups in hiring has been examined largely by extrapolating from group differences on unincentivized tests (e.g., Feingold, 1994; Goldberg et al., 1998; Weisberg et al., 2011). The standardized mean gender and race differences in these studies tend to be small. Hough et al. (2001) report in a meta-analysis that women were less extroverted (d = −0.09), open to experience (d = −0.07), and emotionally stable (d = −0.24) than men but more conscientious (d = 0.08) and agreeable (d = 0.39). Also in a meta-analysis, Foldes et al. (2008) find that Blacks and Hispanics are more conscientious than Whites (d = 0.17 and d = 0.20, respectively), while Asians were more agreeable (d = 0.63) and open (d = 0.11), but less extroverted (d = −0.07) and emotionally stable (d = −0.16) than Whites. While the meta-analyses in Hough et al. (2001) and Foldes et al. (2008) include a few incentivized applicant samples, the incentivized samples in Foldes et al. (2008), for instance, made up only 14% of their database.
Incentives for misrepresentation may matter for group differences for at least two reasons. First, groups may have different notions about optimal personalities (Hofstede and McRae, 2004; Ryan et al., 2021) that result in differences in faking (Fell and König, 2016). Second, group differences in traits result in differences in “opportunity-to-fake” (McFarland and Ryan, 2000; Tett and Simonet, 2011). That is, members of a group with lower scores can increase their scores by more on average than members of the higher scoring group given that the scores are bounded above. This dynamic should attenuate group differences when personalities are measured with incentives for misrepresentation. Leveraging its within-subject design, ours is the first study to document how opportunity-to-fake dynamics influence gender and race gaps on incentivized personality measures.
A within-subject experiment also identifies the effects of incentives without the sampling variation present when comparing applicant and incumbent samples (e.g., Hough et al., 1990; Rosse et al., 1998; Weekley et al., 2004). Hu and Connelly (2021) identified only ten published and seven unpublished within-subject studies comparing incentivized responses in selection settings to unincentivized responses in low-stakes settings—what might be considered the ideal experiment. Studies such as Griffith et al. (2007), Ellingson et al. (2007), and Isaacson et al. (2009) highlight the difficulties of this research: small samples, high non-response rates, and idiosyncratic settings. Ellingson et al. (2007), for example, identify 218 individuals who took tests in a development setting and when applying for actual jobs, but the tests were for different jobs and taken as much as seven years apart.
In the only within-subject study we are aware to examine racial differences on incentivized measures, Isaacson et al. (2009) find no Black–White difference in faking on a conscientiousness measure among individuals completing the measure both in a job application and for research purposes.5 They report that men faked more frequently than women, but they do not report means under the honest-reporting conditions making it impossible to assess the role of opportunity-to-fake. By contrast, our study assesses whether faking differs by gender and race on all Big Five traits while accounting for differences in opportunity-to-fake.
We are aware of only two studies that adopt the EEOC's “four-fifths” rule to assess the potential for adverse impacts from personality tests on women and racial minorities. Powell et al. (2011) assess whether women applying for positions at an oil refinery would be adversely impacted by selection on extroversion and conscientiousness scores or the related facet scores. While they find the potential for adverse gender impacts from selection on facet scores, they find little such evidence using the factor scores—suggesting that gender differences at the facet level cancel each other out when aggregated to the factor-level. We likewise find little evidence of the potential for adverse gender impacts based on the incentivized factor measures. In our case, however, the absence of adverse impacts appears to stem from opportunity-to-fake dynamics that attenuate gender differences in the unincentivized measures.
Finally, Foldes et al. (2008) evaluate whether adverse impacts on racial minorities are likely to arise when selection is based on each of the Big Five factors using the standardized mean differences from their meta-analysis and assuming standard normal distributions. They find evidence of advantages for Blacks and Hispanics when selection is based on conscientiousness measures—similar to our findings for non-White, non-East Asian subjects—but conclude that there is some potential for adverse impacts on Blacks when selection is based on emotional stability or extroversion scores. For Asians, they find some potential for adverse impact using emotional stability, but again their inferences are based largely on studies using unincentivized measures.
3 Experimental design
The study conducts an exploratory analysis using data from the experiment in McGee and McGee (2024). Subjects participated in two sessions. In the Baseline session lasting ~15 min, subjects responded to a Big Five assessment (DeYoung et al., 2007), other psychometric instruments detailed in the Appendix, and demographic questions.6,7 The demographic questions including race and gender were part of a standard code module we used when initiating experiments, but we did not ex ante have hypotheses regarding the relationships between race and gender and incentivized personality measures. Subjects earned $7 for participating. Afterwards, subjects were invited to sign up for the Evaluation session a week later.
In the Evaluation session lasting approximately an hour, subjects received a job ad and completed the same personality test and Raven's Progressive Matrices (RPM) (Raven, 1998), an intelligence test. The instructions informed subjects that after these tests a $25 bonus would be awarded to one subject in each group of four subjects. After the bonus was awarded, subjects completed other psychometric instruments, a risk preferences measure (Holt and Laury, 2002), and questions about work experiences.
The treatments varied the job description in the Evaluation session given that applicants are often routed to tests from ads, and the information in ads likely influences applicants' understanding of personality demands.8 In the Extroversion treatment, the instructions indicated that “All members of a group will receive the same job description. We will then administer an intelligence test and a personality test to determine who to “hire” for the job. We will weigh these two tests according to some criteria and one subject within each group who best meets these criteria will receive a bonus of $25; the remaining subjects in each group will not receive any bonus.” Subjects received an ad for a “client services representative” based on an actual ad. To indicate that an extrovert was desired, the job description incorporated words and phrases associated with extroversion such as “outgoing” and “able to take initiative, be assertive” while attempting to avoid indicating that the firm sought other personality traits.
Subjects in the Introversion and No Priming treatments received the same instructions. In the Introversion treatment, the ad indicated that an introvert was desired through the use of words and phrases associated with introversion such as “contemplative” and “reserved.” In the No Priming treatment, the ad contained little detail beyond listing tasks and requirements common to all of the ads. In contrast to much of the psychology literature on faking, at no point did we direct subjects to fake or suggest strategies for responding.9 For each trait, the incentivized measure from the Evaluation session minus the unincentivized measure from the Baseline session serves as our measure of faking.10
Concerning the differences in incentives between subjects and job applicants, we argue that these incentives are reasonably similar. Most job applicants take personality tests at the same time that they submit resumés and other application materials. Job boards hosting job ads in some cases even provide employers with personality tests for applicants, who presumably take these tests not long after reading the job ad. Similar to our instructions, employers do not explicitly reveal how this information (i.e., resumés, references, test scores) will be used, but applicants understand that a decision will be reached using this information: they will either hear back from the employer or they will not. Personality tests at this stage are unlikely to be used to select applicants to hire so much as to eliminate applicants from consideration.11 Applicants likely understand that in order to be hired, they must avoid being in that fraction of the applicant pool eliminated from consideration based on these early signals to employers in order to advance to the next stage of hiring (typically job interviews). Similarly, subjects in our experiment understand that they must be in the top quartile within their group to win the group. Both applicants and subjects likely view personality testing as a hurdle to be passed, and their test-taking strategies presumably reflect this.12
The client services representative occupation was selected as the sort of job to which young graduates might apply. In the 2016 American Community Survey, 25% of respondents in the services sales representative occupation were age 30 or less and 91% had a bachelor's degree or less (authors' calculations). Brenčič and McGee (2023) find in a sample of job ads that 42% of ads in this occupation signaled a demand for extroverts through terms associated with extroversion (nearly twice the proportion expressing demands for any other trait), while less than 1% of such ads indicated a demand for introversion. At the same time, 36% of ads for this occupation used no terms associated with desired personality traits. As such, we view the Extroversion and No Priming treatments as representative of the ads job seekers in this occupation encounter.13
In addition to a $7 participation fee and (if applicable) the $25 bonus, subjects were paid $0.20 for each correct answer on the RPM and earnings from one randomly selected realization of a paired lottery of the risk preference instrument.
4 Experimental sample
Between 2014 and 2016, 474 undergraduates at Simon Fraser University participated in both a Baseline and Evaluation session: 167 in the Extroversion treatment, 160 in the Introversion treatment, and 147 in the No Priming treatment. Subjects were recruited via email from the registered subject pool at Simon Fraser's experimental lab consisting of students from all majors. Subjects self-reported their gender and race with 48% of the sample identifying as men. Subjects who identified as White were coded as such, while subjects who identified as Chinese, Filipino, Japanese, Korean, or Asian were categorized as East Asian. All remaining subjects identifying as Indian, Pakistani, Black, Latino, or an unspecified race were placed in the “other race” category.14 In the sample, 23% of subjects reported being White, 49% East Asian, and 28% another race.15,16
The experiment did not attempt to balance the treatments by gender and race. In the Extroversion treatment, 57% of subjects indicated that they were women, 19% White, and 59% East Asian. In the No Priming (Introversion) treatment, 49% (51%) indicated that they were women, 25% (29%) White, and 50% (36%) East Asian. Using Pearson chi-squared tests, we fail to reject the hypothesis of independence between gender and treatment (p = 0.67), but we reject the independence hypothesis between the race categories and treatment (p = 0.001). This lack of balance primarily affects our statistical power to detect small group differences, an issue we elaborate on in the Discussion section. See Appendix A Tables 1–4 for summary statistics for all measures by treatment and group.
5 Results
5.1 Gender
The first row in Panel A of Table 1 reports standardized effect sizes—the mean for women minus the mean for men divided by the full sample standard deviation—for each personality trait pooling Baseline scores from all treatments. Women were more agreeable (0.29), less open to experience (−0.28), and less emotionally stable (−0.40) than men. Standardized effects of 0.2, 0.5, and 0.8 standard deviations are considered small, medium, and large, respectively, in the psychology literature (Cohen, 1988), and thus these gender differences would be viewed as small to medium-sized. Moreover, the gender differences in mean agreeableness, openness, and emotional stability are statistically significant even after correcting for the 40 hypotheses in Panel A using Benjamini et al.'s (2006) sharpened q-values given that the data were not collected to test for gender differences.17
Table 1
| Personality trait | |||||
|---|---|---|---|---|---|
| Extroversion | Conscientious. | Agreeableness | Openness | Em. Stab. | |
| (1) | (2) | (3) | (4) | (5) | |
| Panel A. Women-men standardized differences | |||||
| Pooled baseline | −0.09 | 0.01 | 0.29 † | −0.28 † | −0.40! |
| Pooled evaluation | 0.01 | −0.04 | −0.01 | −0.09 | −0.12 |
| (E) Baseline | 0.04 | 0.00 | 0.11 | −0.17 | −0.28 |
| (E) Evaluation | 0.08 | −0.03 | −0.15 | −0.03 | −0.13 |
| (NP) Baseline | −0.19 | 0.10 | 0.49 † | −0.37 | −0.67! |
| (NP) Evaluation | −0.11 | −0.06 | 0.20 | −0.15 | −0.26 |
| (I) Baseline | −0.13 | −0.12 | 0.28 | −0.29 | −0.29 |
| (I) Evaluation | −0.08 | −0.06 | −0.07 | −0.20 | −0.06 |
| Panel B. East Asian-White standardized differences | |||||
| Pooled baseline | −0.45! | 0.07 | −0.14 | −0.56! | −0.35 † |
| Pooled evaluation | 0.06 | −0.32 † | −0.48! | −0.23 | −0.39 † |
| (E) Baseline | −0.60 † | −0.10 | −0.14 | −0.45 # | −0.32 |
| (E) Evaluation | −0.23 | −0.13 | −0.61 † | −0.05 | −0.32 |
| (NP) Baseline | −0.41 | 0.16 | 0.08 | −0.65 † | −0.38 |
| (NP) Evaluation | −0.15 | −0.34 | −0.25 | −0.41 | −0.49 # |
| (I) Baseline | −0.30 | 0.03 | −0.29 | −0.52 † | −0.39 |
| (I) Evaluation | 0.10 | −0.46 # | −0.49 # | −0.54 † | −0.55 † |
| Panel C. Other race-White standardized differences | |||||
| Pooled baseline | −0.05 | 0.30 # | 0.02 | −0.13 | −0.20 |
| Pooled evaluation | 0.08 | −0.11 | −0.30 # | −0.13 | −0.39 † |
| (E) Baseline | −0.09 | −0.20 | 0.12 | −0.09 | −0.56 # |
| (E) Evaluation | −0.13 | 0.21 | −0.23 | 0.10 | −0.30 |
| (NP) Baseline | −0.05 | 0.58 # | 0.07 | −0.14 | 0.07 |
| (NP) Evaluation | −0.24 | −0.21 | −0.12 | −0.26 | −0.46 # |
| (I) Baseline | 0.22 | 0.45 # | −0.10 | −0.15 | −0.16 |
| (I) Evaluation | 0.49 # | −0.26 | −0.50 # | −0.23 | −0.43 # |
| Panel D: Power calculations and sample sizes | |||||
| d = 0.2 | d = 0.5 | d = 0.8 | |||
| Women-men | N (Men) | N (Women) | |||
| Pooled scores | 0.58 | 1.00 | 1.00 | 228 | 256 |
| Extroversion | 0.25 | 0.89 | 1.00 | 74 | 93 |
| No Priming | 0.23 | 0.85 | 1.00 | 75 | 72 |
| Introversion | 0.24 | 0.88 | 1.00 | 79 | 91 |
| East Asian-White | N (White) | N (Asian) | |||
| Pooled scores | 0.41 | 0.99 | 1.00 | 113 | 230 |
| Extroversion | 0.16 | 0.67 | 0.97 | 31 | 98 |
| No Priming | 0.16 | 0.68 | 0.97 | 36 | 74 |
| Introversion | 0.17 | 0.71 | 0.98 | 46 | 58 |
| Other race-white | N (White) | N (Other) | |||
| Pooled scores | 0.34 | 0.97 | 1.00 | 113 | 131 |
| Extroversion | 0.13 | 0.53 | 0.90 | 31 | 38 |
| No Priming | 0.13 | 0.56 | 0.92 | 36 | 37 |
| Introversion | 0.17 | 0.70 | 0.98 | 46 | 56 |
Standardized effect sizes (d), power calculations and sample sizes.
Panels A, B and C report the difference between the group means specified in a cell (i.e., the mean for women minus the mean for men or the minority group mean minus the white mean) divided by the standard deviation of the pooled scores from the same session (Baseline or Evaluation) and treatment or across treatments where the table refers to pooled scores. E indicates the Extroversion treatment, NP the No Priming treatment, and I the Introversion treatment. Panels A, B, and C also report significance levels for two-sided t-tests of the equality of means. For d-statistics in italics, we reject the equality at the 10% significance level. In bold, we reject the equality at the 5% significance level. In bold and italics, we reject the equality at the 1% significance level. Beside each d-statistic, we report the significance level for the same tests using sharpened q-values to account for the 40 hypotheses in Panel A and the 80 hypotheses in Panels B and C. Significance levels: !p < 0.01,†p < 0.05, #p < 0.10. Panel D reports power calculations for a significance level of 0.05 for effect sizes of 0.2, 0.5, and 0.8 for the groups given in the panels while also reporting the sample sizes for each group by treatment informing these power calculations. The calculations assume that the groups' scores have common variance, which we assume equals one so that the effects correspond to the standardized effects in the upper panels.
The second row of Panel A reports standardized effect sizes for each personality trait pooling the Evaluation scores from all treatments. McGee and McGee (2024) fail to reject the equality of the correlations between the incentivized and unincentivized personality measures across treatments—suggesting that the information in the job ads has only second-order effects on responding behavior relative to the effects of the incentives themselves. Notably, all of the standardized gender differences in the pooled Evaluation scores are < 0.12 in absolute value, and none are statistically significant even before the multiple hypotheses corrections. At first glance, incentives for misrepresentation alone appear sufficient to attenuate the gender differences in personality trait measures.
The remainder of Panel A reports the standardized gender differences by trait and treatment for the Baseline and Evaluation scores, but we would reach similar conclusions analyzing the scores by treatment. The Baseline gender differences by treatment are mostly consistent with the pooled differences, but the variability in magnitudes highlights the role of sampling variance in smaller treatment-specific samples and the importance of within-subject designs. Turning to the Evaluation measures, the gender differences for every trait in every treatment are uniformly small. Eight of the 15 treatment-specific gender differences in the Evaluation measures are < 0.1 in absolute value, while only one is >0.2.
Figure 1 displays by treatment the mean faking levels by gender and the quartile in which the subject falls of the pooled Baseline score distribution for each trait. Two things are apparent. First, opportunity-to-fake matters as mean faking levels decrease monotonically moving from the lowest to the highest quartile of Baseline scores. Second, one can infer from the confidence intervals that we fail to reject the gender equality of mean faking in virtually every quartile for every trait in every treatment.
Figure 1
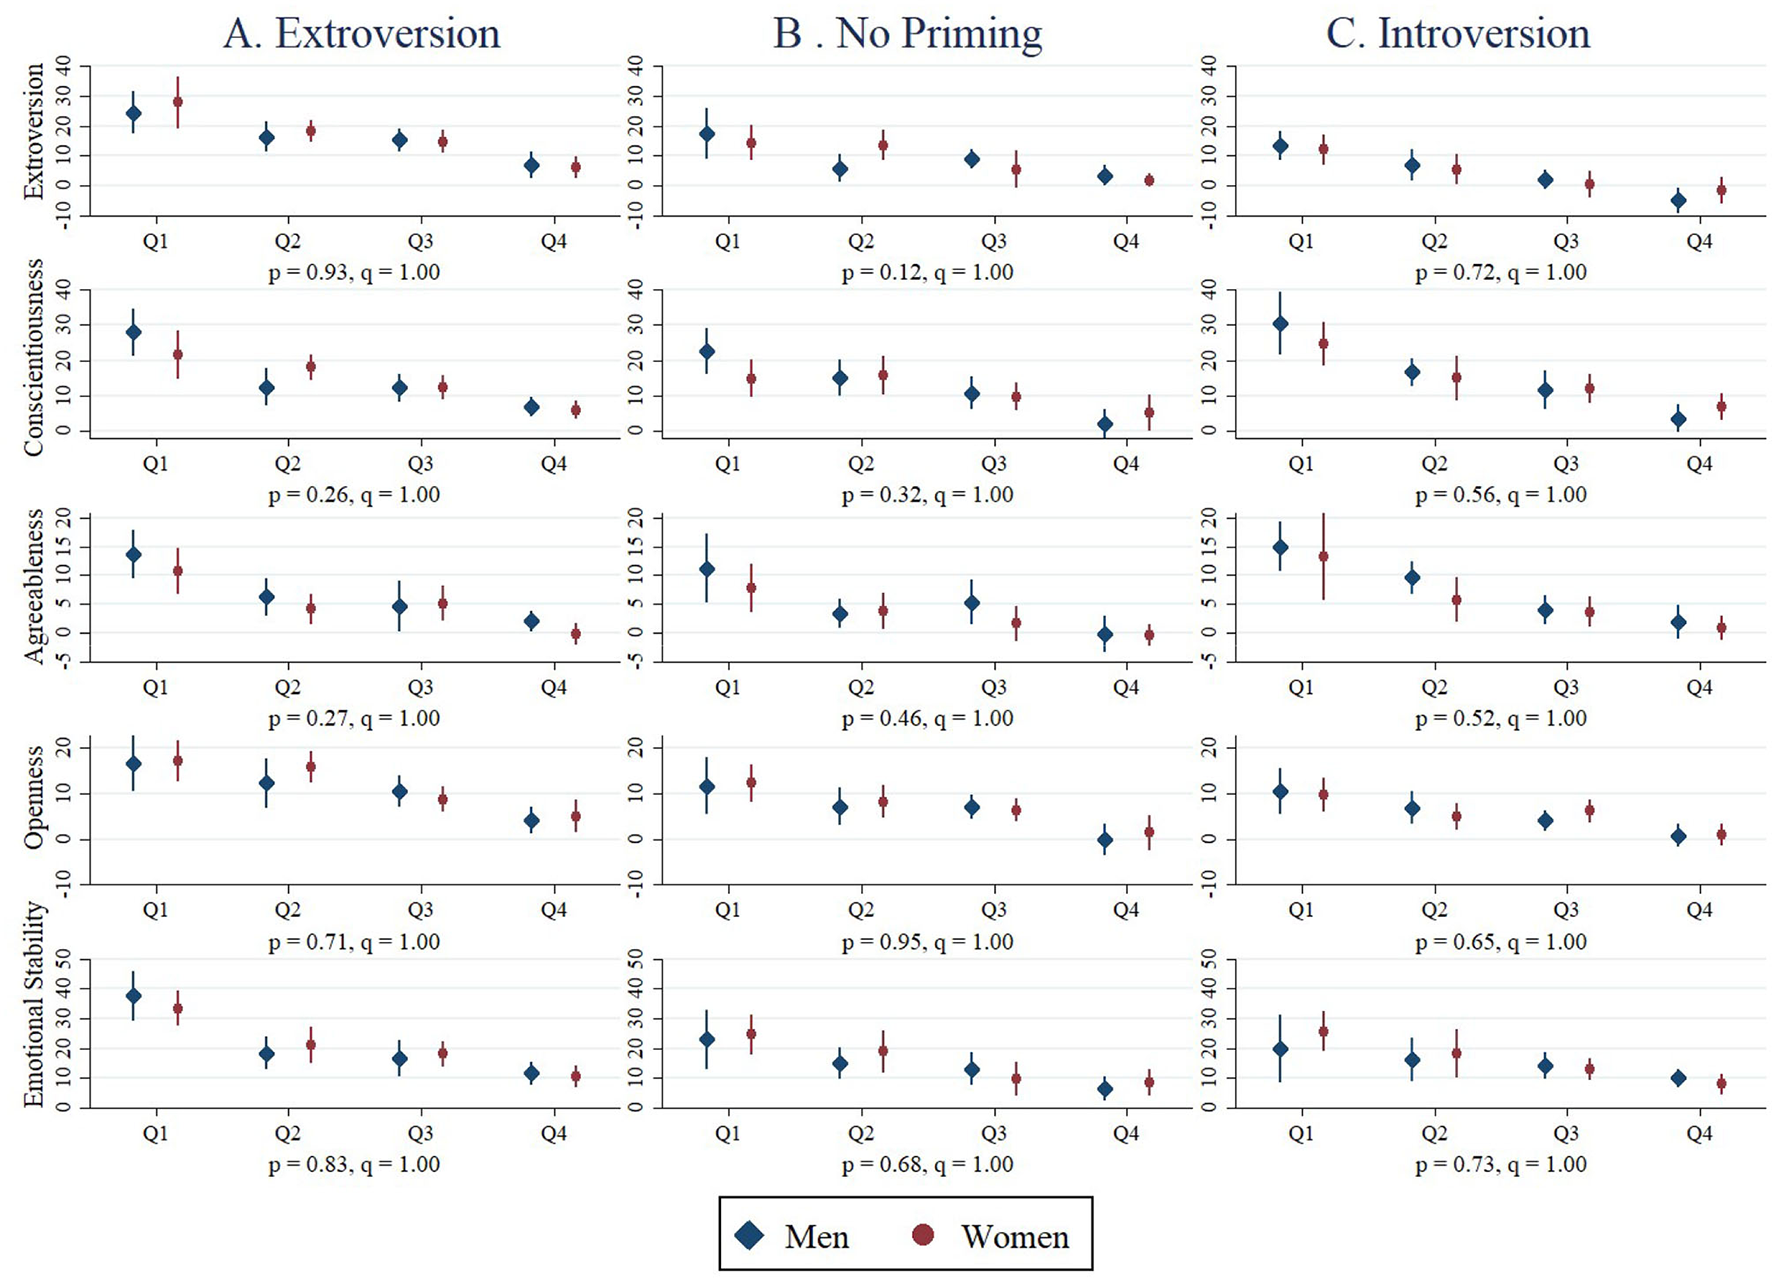
Mean faking by gender, trait, quartile and treatment. Each graph depicts the gender-specific mean changes in trait scores from the Baseline to Evaluation sessions for subjects in a given quartile of the Baseline trait score distribution (pooling subjects across treatments) along with 95% confidence intervals for the gender-specific means. For the treatment specified in the column and the Big Five trait specified in the row, we regress the change in scores (i.e., Evaluation score minus Baseline score) on indicators for the quartile of the pooled, Baseline score distribution in which the subject fell and interactions between these quartile indicators and the indicator for being a woman with the intercept omitted. Below each plot we report the p-value from a heteroscedasticity-robust F-test of the null hypothesis that the quartile-female interactions are jointly significant followed after a comma by the sharpened q-values for the same hypothesis test accounting for the 15 hypotheses tested. (A) Extroversion. (B) No priming. (C) Introversion.
To test for gender differences in responses to incentives accounting for opportunity-to-fake, we regress each subject's change in scores on indicators for the quartile in which the subject falls of the pooled Baseline score distribution for a given trait along with interactions between the indicator for being a woman and the quartile indicators. Below each plot in Figure 1, we report the p-values from heteroskedasticity-robust F-tests of the joint significance of the woman-quartile interactions for each regression along with sharpened q-values to account for the 15 hypotheses tested in Figure 1. Using either the p- or q-values, we fail to reject the joint insignificance of the woman-quartile interactions for all 15 hypotheses. Men and women appear to respond similarly to incentives when misrepresenting themselves.18
To test whether incentives or the combination of incentives and information attenuate the gender differences in the Baseline scores, we estimate for each trait:
where Ti, j, k is the raw (i.e., non-standardized) score for trait i for respondent j from session k (i.e., Baseline or Evaluation), Womanj and Evaluationk indicators for whether a subject is a woman and the score from the Evaluation session, respectively, and εi, j, k an econometric error term. These estimates are reported in the odd-numbered columns of Table 2 for each trait. We test the hypothesis that a1+a3 = 0. The null hypothesis is that the gender difference in Baseline scores for a given trait is completely attenuated by the incentives in the Evaluation session. This hypothesis can be violated in many ways (e.g., partial attenuation, exacerbation of gender differences, reversals of gender differences), but for every trait we fail to reject the null that incentives completely attenuate the gender differences in unincentivized personality measures.
Table 2
| Dependent variable | ||||||||||
|---|---|---|---|---|---|---|---|---|---|---|
| Ext. | Con. | Agr. | Ope. | Em. Stab. | ||||||
| Controls | (1) | (2) | (3) | (4) | (5) | (6) | (7) | (8) | (9) | (10) |
| Woman (a1) | −1.1 | 0.1 | 2.7! | −2.6! | −5.1! | |||||
| (1.1) | (1.0) | (0.9) | (0.9) | (1.1) | ||||||
| Evaluation (a2) | 9.4! | 14.6! | 7.1! | 7.3! | 15.7! | |||||
| (1.1) | (1.0) | (0.9) | (0.9) | (1.2) | ||||||
| Woman* | 1.2 | −0.5 | −2.7† | 1.8 | 3.4† | |||||
| Evaluation (a3) | (1.6) | (1.5) | (1.2) | (1.2) | (1.7) | |||||
| No Priming (b1) | 2.8 | −3.3# | −2.0 | 1.9 | 1.4 | |||||
| (1.9) | (1.8) | (1.5) | (1.6) | (2.0) | ||||||
| Introversion (b2) | 3.4# | −0.7 | −0.1 | 2.8# | 0.9 | |||||
| (1.9) | (1.5) | (1.5) | (1.5) | (1.9) | ||||||
| Extroversion* | 0.5 | 0.0 | 1.0 | −1.7 | −3.5# | |||||
| Woman (b3) | (1.9) | (1.7) | (1.4) | (1.6) | (2.0) | |||||
| No Priming* | −2.1 | 1.1 | 4.6! | −3.5† | −8.8! | |||||
| Woman (b4) | (1.9) | (1.8) | (1.5) | (1.6) | (2.1) | |||||
| Introversion* | −1.4 | −1.2 | 2.7# | −2.6# | −3.5# | |||||
| Woman (b5) | (1.7) | (1.6) | (1.5) | (1.4) | (1.9) | |||||
| Extroversion* | 16.8! | 14.5! | 7.2! | 11.2! | 20.0! | |||||
| Evaluation (b6) | (2.1) | (1.7) | (1.5) | (1.7) | (2.0) | |||||
| No Priming* | 8.3! | 13.9! | 5.8! | 6.2! | 13.2! | |||||
| Evaluation (b7) | (1.9) | (1.9) | (1.5) | (1.5) | (2.1) | |||||
| Introversion* | 3.4# | 15.3! | 8.2! | 4.7! | 14.1! | |||||
| Evaluation (b8) | (1.7) | (1.6) | (1.5) | (1.3) | (2.0) | |||||
| Evaluation*Woman | 0.6 | −0.4 | −2.2 | 1.4 | 1.9 | |||||
| *Extroversion (b9) | (2.8) | (2.4) | (2.0) | (2.2) | (2.8) | |||||
| Evaluation*Woman | 0.8 | −1.8 | −2.8 | 2.0 | 4.9 | |||||
| *No Priming (b10) | (2.7) | (2.7) | (2.1) | (2.2) | (3.2) | |||||
| Evaluation*Woman | 0.5 | 0.5 | −3.4 | 1.0 | 2.8 | |||||
| *Introversion (b11) | (2.5) | (2.5) | (2.1) | (1.9) | (2.9) | |||||
| Constant | 68.9! | 66.8! | 66.4! | 67.7! | 72.9! | 73.6! | 73.5! | 71.9! | 64.4! | 63.6! |
| (0.8) | (1.4) | (0.7) | (1.2) | (0.6) | (1.1) | (0.6) | (1.2) | (0.8) | (1.5) | |
| R2 | 0.14 | 0.21 | 0.29 | 0.30 | 0.10 | 0.11 | 0.17 | 0.19 | 0.32 | 0.34 |
| Hypothesis tests ( p -value, sharpened q- value) | ||||||||||
| (1) a1+a3 = 0 | (0.93, 1.00) | (0.68, 1.00) | (0.95, 1.00) | (0.32, 1.00) | (0.18, 1.00) | |||||
| (2) b3+b9 = 0 | (0.61, 1.00) | (0.83, 1.00) | (0.36, 1.00) | (0.87, 1.00) | (0.42, 1.00) | |||||
| (3) b4+b10 = 0 | (0.51, 1.00) | (0.73, 1.00) | (0.23, 1.00) | (0.36, 1.00) | (0.11, 1.00) | |||||
| (4) b5+b11 = 0 | (0.62, 1.00) | (0.69, 1.00) | (0.67, 1.00) | (0.21, 1.00) | (0.71, 1.00) | |||||
| (2) & (3) & (4) | (0.81, 1.00) | (0.96, 1.00) | (0.47, 1.00) | (0.49, 1.00) | (0.34, 1.00) | |||||
Testing for attenuation of gender gaps in evaluation scores.
The odd-numbered columns report coefficients from regressions of the scores for the personality trait indicated in the column on indicators for whether the subject was a woman, whether the score comes from an Evaluation session, and the interaction between the woman and Evaluation indicators. The omitted category represents Baseline scores for men pooled across treatments. The even-numbered columns report coefficients from regressions of the scores for the personality trait indicated in the column on indicators for whether the score comes from the No Priming or Introversion treatments, interactions between the indicator for being a woman and three treatment indicators, interactions between the treatment indicators and the indicator for scores from Evaluation sessions, and the triple interaction terms for the woman-treatment-Evaluation combinations. The omitted category represents Baseline scores for men in the Extroversion treatment. Heteroskedasticity-robust standard errors are given in parentheses. Significance levels: !p < 0.01,†p < 0.05, #p < 0.10. The bottom of the table reports p-values and sharpened q-values accounting for the 25 hypotheses tested for the hypothesis indicated in the row for the regression given in the column. The hypothesis “(2), (3), and (4)” refers to the joint hypothesis test for the hypotheses as numbered in the table. *is the multiplication operator, indicating that the coefficient in the row is the coefficient of an interaction between two or more variables (i.e., they are multiplied together).
Pooling the Evaluation sessions, however, may obscure differences across treatments given the different priming in the job ads. To evaluate this possibility, we estimate for each trait:
These estimates are reported in the even-numbered columns of Table 2. Here we test the hypotheses of complete attenuation of the treatment-specific gender differences in Baseline scores in the Evaluation scores for the same treatment: b3+b9 = 0, b4+b10 = 0, and b5+b11 = 0. Similar to the tests pooling the treatments, however, we fail to reject the complete attenuation of the unincentivized gender differences for every trait and treatment combination when measured with incentives. We also fail to reject the joint hypothesis of complete attenuation in all three treatments. For women, incentives for misrepresentation alone appear sufficient to attenuate gender differences in unincentivized personality trait measures.
5.2 Race
Panels B and C of Table 1 report the standardized mean differences between East Asian and White subjects and between subjects of other races and White subjects, respectively. East Asian subjects were moderately less extroverted (−0.45), open to experience (−0.56), and emotionally stable (−0.35) than White subjects pooling Baseline scores, and similar differences exist in most treatments. Subjects of other races were more conscientious (0.30) than White subjects in the pooled Baseline scores (though not in the Extroversion treatment), but we observe no other significant differences.
More intriguing are the racial differences in incentivized scores. Pooling the Evaluation scores across treatments, the East Asian-White differences in conscientiousness, agreeableness, and emotional stability are statistically significant after accounting for multiple hypotheses using the sharpened q-values. Indeed, only the East Asian-White difference in extroversion is not significant prior to accounting for multiple hypotheses, but this is also the trait for which pooling the Evaluation scores is problematic given the countervailing priming in the Extroversion and Introversion treatments. Notably, the East Asian-White differences in conscientiousness and agreeableness were not present in the Baseline scores. Likewise, statistically significant differences between White subjects and subjects of other races in agreeableness and emotional stability emerge using the pooled Evaluation scores where no similar differences existed in the pooled Baseline scores.
That incentives do not appear to attenuate racial differences in the unincentivized scores is also apparent when looking at the treatment-specific standardized differences. Where there were seven significant gender differences in Baseline scores by treatment in Panel A, none of the gender differences were significant using the Evaluation scores. By contrast, four (three) East Asian-White (other race-White) Baseline score differences by treatment are significant in Panels B and C, but six (four) differences in Evaluation scores are significant. Moreover, five (four) of these East Asian-White (other race-White) Evaluation differences occur where no significant difference in Baseline scores existed. Where only small differences between subjects of other races and White subjects exist in the pooled Baseline scores, many of the differences in Evaluation scores would be described as medium-sized, and all would disadvantage subjects of other races.19
To formally test whether incentives attenuate racial differences in unincentivized scores, we estimate regressions similar to those described in Table 2 replacing the indicator for being a woman with indicators for being East Asian or another race. Pooling the treatments and interacting the race indicators with only an indicator for the Evaluation session in the odd-numbered columns of Table 3, we reject the hypotheses of complete attenuation of the East Asian-White differences in unincentivized measures when measured with incentives for every trait except extroversion even after correcting for multiple hypotheses. Likewise we reject the complete attenuation of the other race-White differences for agreeableness and emotional stability pooling the treatments. Disaggregating the Evaluation sessions and including treatment indicators in the second set of regressions in the even-numbered columns of Table 3, we continue to reject the complete attenuation hypotheses in the majority of trait-treatment-group comparisons. After accounting for the 55 hypotheses tested in Table 3, we reject 28 of these hypotheses at the 10% significance level using the sharpened q-values.
Table 3
| Dependent variable | ||||||||||
|---|---|---|---|---|---|---|---|---|---|---|
| Ext. | Con. | Agr. | Ope. | Em. Stab. | ||||||
| Controls | (1) | (2) | (3) | (4) | (5) | (6) | (7) | (8) | (9) | (10) |
| East Asian (a1) | −5.2! | 0.8 | −1.3 | −5.3! | −4.5! | |||||
| (1.3) | (1.2) | (1.2) | (1.0) | (1.5) | ||||||
| Other race (a2) | 0.5 | 3.3† | 0.2 | −1.2 | −2.5 | |||||
| (1.4) | (1.5) | (1.3) | (1.2) | (1.6) | ||||||
| Evaluation (a3) | 6.9! | 17.8! | 7.9! | 6.7! | 18.8! | |||||
| (1.7) | (1.5) | (1.4) | (1.1) | (1.7) | ||||||
| East Asian* | 6.0! | −4.6† | −3.0# | 3.1† | −1.0 | |||||
| Evaluation (a4) | (2.1) | (1.8) | (1.6) | (1.5) | (2.1) | |||||
| Other race* | 0.5 | −4.6† | −2.9 | 0.0 | −2.8 | |||||
| Evaluation (a5) | (2.1) | (2.1) | (1.9) | (1.6) | (2.3) | |||||
| No Priming (b1) | −0.6 | −6.3† | −1.4 | 1.7 | −2.8 | |||||
| (2.9) | (2.6) | (2.7) | (2.2) | (3.3) | ||||||
| Introversion (b2) | −1.8 | −4.2# | 1.6 | 1.7 | −0.5 | |||||
| (3.0) | (2.5) | (2.7) | (2.1) | (3.0) | ||||||
| Extroversion* | −7.4! | −1.1 | −1.3 | −4.5† | −4.1 | |||||
| East Asian (b3) | (2.7) | (2.1) | (2.2) | (2.0) | (2.6) | |||||
| No Priming* | −4.6† | 1.7 | 0.8 | −6.2! | −5.0# | |||||
| East Asian (b4) | (2.2) | (2.1) | (2.1) | (1.7) | (2.8) | |||||
| Introversion* | −3.3 | 0.3 | −2.8 | −4.6! | −4.8#$ | |||||
| East Asian (b5) | (2.2) | (2.1) | (2.1) | (1.7) | (2.5) | |||||
| Extroversion* | −1.1 | −2.2 | 1.1 | −0.9 | −7.2† | |||||
| Other race (b6) | (2.9) | (2.9) | (2.5) | (2.5) | (3.0) | |||||
| No Priming* | −0.5 | 6.2† | 0.6 | −1.3 | 1.0 | |||||
| Other race (b7) | (2.2) | (2.7) | (2.4) | (2.1) | (3.2) | |||||
| Introversion* | 2.4 | 4.7† | −1.0 | −1.3 | −2.0 | |||||
| Other race (b8) | (2.3) | (2.1) | (2.1) | (1.7) | (2.5) | |||||
| Extroversion* | 14.7! | 13.5! | 8.9! | 9.3! | 20.3! | |||||
| Evaluation (b9) | (3.5) | (2.5) | (2.5) | (2.3) | (2.9) | |||||
| No Priming* | 7.9! | 18.3! | 6.4! | 6.4! | 18.8! | |||||
| Evaluation (b10) | (2.5) | (2.7) | (2.4) | (2.1) | (3.2) | |||||
| Introversion* | 0.9 | 20.3! | 8.5! | 5.3! | 17.8! | |||||
| Evaluation (b11) | (2.6) | (2.5) | (2.4) | (1.7) | (2.6) | |||||
| Evaluation*Asian | 4.4 | −0.3 | −3.9 | 4.0 | 0.0 | |||||
| *Extroversion (b12) | (4.0) | (2.9) | (2.8) | (2.8) | (3.5) | |||||
| Evaluation*Asian | 2.7 | −6.0#$ | −3.0 | 2.2 | −2.3 | |||||
| *No Priming (b13) | (3.3) | (3.3) | (2.8) | (2.6) | (4.0) | |||||
| Evaluation*Asian | 4.4 | −5.8#$ | −1.8 | 0.3 | −2.5 | |||||
| *Introversion (b14) | (3.2) | (3.2) | (2.8) | (2.3) | (3.6) | |||||
| Evaluation*Other | −0.5 | 4.4 | −3.0 | 1.9 | 3.4 | |||||
| *Extroversion (b15) | (4.2) | (3.9) | (3.1) | (3.3) | (3.9) | |||||
| Evaluation*Other | −2.4 | −8.8† | −1.7 | −1.2 | −7.8# | |||||
| *No Priming (b16) | (3.4) | (3.9) | (3.2) | (3.0) | (4.5) | |||||
| Evaluation*Other | 3.2 | −7.8† | −3.7 | −0.5 | −3.8 | |||||
| *Introversion (b17) | (3.2) | (3.2) | (2.9) | (2.3) | (3.5) | |||||
| Constant | 70.7! | 71.6! | 65.2! | 68.9! | 74.8! | 74.6! | 75.0! | 73.8! | 64.6! | 65.7! |
| (1.1) | (2.4) | (1.0) | (1.8) | (1.1) | (2.0) | (0.8) | (1.7) | (1.2) | (2.3) | |
| R 2 | 0.17 | 0.24 | 0.30 | 0.32 | 0.11 | 0.12 | 0.19 | 0.21 | 0.32 | 0.34 |
| Hypothesis tests ( p -value, sharpened q- value) | ||||||||||
| (1) a1+a4 = 0 | (0.61, 0.41) | (0.01, 0.02) | (0.00, 0.01) | (0.03, 0.06) | (0.00, 0.01) | |||||
| (2) a2+a5 = 0 | (0.52, 0.36) | (0.39, 0.29) | (0.02, 0.05) | (0.27, 0.23) | (0.00, 0.01) | |||||
| (1) & (2) | (0.81, 0.51) | (0.01, 0.04) | (0.00, 0.01) | (0.10, 0.11) | (0.00, 0.01) | |||||
| (3) b3+b12 = 0 | (0.31, 0.26) | (0.49, 0.35) | (0.00, 0.01) | (0.81, 0.51) | (0.07, 0.10) | |||||
| (4) b4+b13 = 0 | (0.46, 0.34) | (0.09, 0.11) | (0.23, 0.22) | (0.04, 0.06) | (0.01, 0.03) | |||||
| (5) b5+b14 = 0 | (0.63, 0.41) | (0.02, 0.05) | (0.02, 0.04) | (0.00, 0.02) | (0.00, 0.02) | |||||
| (3) & (4) & (5) | (0.61, 0.41) | (0.04, 0.06) | (0.00, 0.01) | (0.01, 0.02) | (0.00, 0.01) | |||||
| (6) b6+b15 = 0 | (0.60, 0.41) | (0.38, 0.29) | (0.32, 0.26) | (0.64, 0.41) | (0.15, 0.16) | |||||
| (7) b7+b16 = 0 | (0.27, 0.23) | (0.37, 0.29) | (0.61, 0.41) | (0.24, 0.22) | (0.03, 0.06) | |||||
| (8) b8+b17 = 0 | (0.01, 0.04) | (0.19, 0.19) | (0.02, 0.04) | (0.24, 0.22) | (0.02, 0.04) | |||||
| (6) & (7) & (8) | (0.05, 0.07) | (0.35, 0.28) | (0.08, 0.10) | (0.39, 0.29) | (0.01, 0.02) | |||||
Testing for attenuation of racial gaps in evaluation scores.
The odd-numbered columns report coefficients from regressions of the scores for the personality trait indicated in the column on indicators for being East Asian or other race, whether the score comes from an Evaluation session, and the interaction between the race indicators and the Evaluation indicator. The omitted category represents Baseline scores for White subjects pooled across treatments. The even-numbered columns report coefficients from regressions of the scores for the personality trait indicated in the column on indicators for whether the score comes from the No Priming or Introversion treatments, interactions between the race indicators and three treatment indicators, interactions between the treatment indicators and the indicator for scores from Evaluation sessions, and the triple interaction terms for the race-treatment-Evaluation combinations. The omitted category represents Baseline scores for White subjects in the Extroversion treatment. Heteroskedasticity-robust standard errors are given in parentheses. Significance levels: !p < 0.01,†p < 0.05, #p < 0.10. The bottom of the table reports p-values and sharpened q-values accounting for the 55 hypotheses tested for the hypothesis indicated in the row for the regression given in the column. The hypothesis “(1) & (2)”, “(3) & (4) & (5)”, and “(6) & (7) & (8)” refer to the joint hypothesis tests for the hypotheses as numbered in the table. *is the multiplication operator, indicating that the coefficient in the row is the coefficient of an interaction between two or more variables (i.e., they are multiplied together).
The failure of so many of the racial differences to attenuate strongly suggests racial differences in responses to the incentives and treatment manipulations. To test for racial differences in faking relative to White subjects accounting for opportunity-to-fake, we again regress the change in trait scores on indicators for the quartile in which the subject falls of the pooled Baseline score distribution for a given trait along with interactions between these quartile indicators and the East Asian and other race indicators. Figure 2 displays the quartile-by-race mean faking levels for each trait and treatment while also reporting the p-values and sharpened q-values for tests of the joint significance of the race-quartile interactions. Using the p-values, we reject the joint insignificance of the race-quartile interactions for 13 of the 30 hypotheses at the 10% level and 10 of the 30 hypotheses at the 5% level. At either significance level, we reject far more of the hypotheses than one would expect by chance, but some rejections are likely Type I errors given the number of hypotheses tested. Using the sharpened q-values, we reject at the 10% level 10 out of the 30 null hypotheses tested—still more than one would expect by chance.20
Figure 2
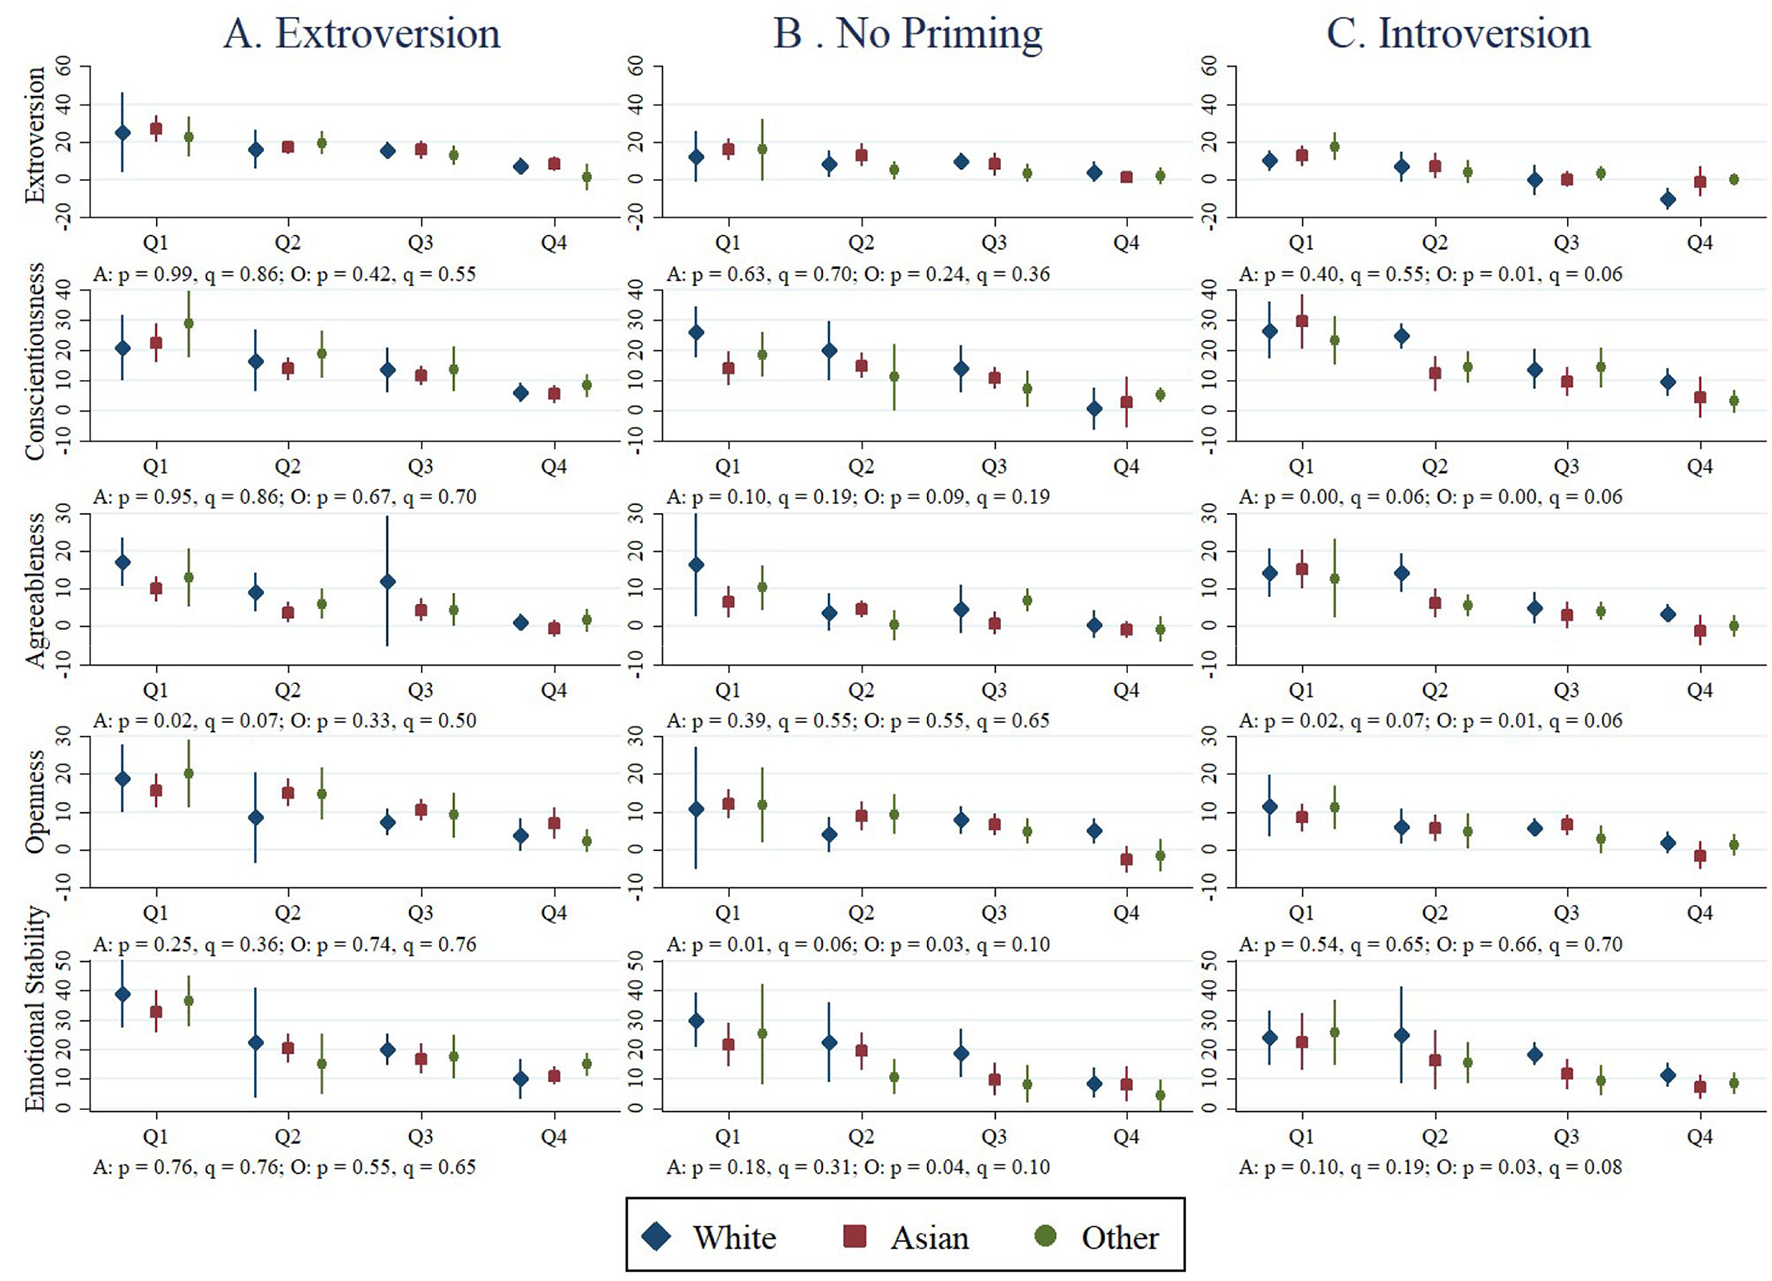
Mean faking by race, trait, quartile and treatment. Each graph depicts the mean changes in trait scores from the Baseline to Evaluation sessions for subjects in a given race category in a given quartile of the Baseline trait score distribution (pooling subjects across treatments) along with 95% confidence intervals for the race-specific means. For the treatment specified in the column and the Big Five trait specified in the row, we regress the change in scores on indicators for the quartile of the pooled, Baseline score distribution in which a subject fell and interactions between these quartile indicators and the East Asian and other race indicators with the intercept omitted. Below each plot we report first the p-value from a heteroscedasticity-robust F-test of the null hypothesis that the quartile-race interactions are jointly significant followed (after a comma) by the sharpened q-values for the same hypothesis test accounting for the 30 hypotheses tested (“A:” for the East Asian-White p- and q- values and “O:” for the other race-white p- and q-values). (A) Extroversion. (B) No priming. (C) Introversion.
5.3 Would the differences matter for selection?
In the experiment, racial differences on incentivized personality measures were clearly consequential. White subjects were more likely to win the bonus and had higher earnings than East Asian subjects and subjects of other races in all treatments. Pooling the treatments, the East Asian-White and other race-White differences in winning the bonus and earnings are significant at the 1% level.21
To assess the potential for adverse impacts in the labor market, we assume as in Foldes et al. (2008) that the trait scores for each group are drawn from standard normal distributions with the mean differences as given in Table 1. For each trait and for majority group selection ratios (i.e., the share of majority group members selected) ranging from 1% to 99%, we identify the cut-off score associated with the selection ratio. We then calculate the share of members from the protected group that would be selected given this cutoff.22
Table 4 reports the majority group selection ratios below which the share of protected group applicants would be less than four-fifths of the majority group selection ratio for each trait and protected vs. majority group comparison by treatment using both unincentivized and incentivized scores. When small mean differences imply that the share of protected group applicants selected would never be less than four-fifths of the majority group selection ratio, Table 4 indicates that adverse impacts are “unlikely.” For other comparisons, the mean differences imply that the protected group would enjoy an advantage were hiring based on the trait scores in the cell. For these comparisons (indicated by the “+” prefix), we report the majority group selection ratios below which the share of the protected group selected would be more than 1.25 times the majority group selection ratio.
Table 4
| Personality trait on which hypothetical selection based | |||||
|---|---|---|---|---|---|
| Treatment | Extroversion | Conscientiousness | Agreeableness | Openness | Emotional stability |
| (1) | (2) | (3) | (4) | (5) | |
| Panel A. Female–male | |||||
| Baseline | –SR < 0.02 | Unlikely | +SR < 0.46 | –SR < 0.56 | –SR < 0.73 |
| Evaluation | Unlikely | Unlikely | Unlikely | –SR < 0.02 | –SR < 0.09 |
| (E) Baseline | Unlikely | Unlikely | +SR < 0.04 | –SR < 0.26 | –SR < 0.56 |
| (E) Evaluation | Unlikely | Unlikely | –SR < 0.20 | Unlikely | –SR < 0.13 |
| (NP) Baseline | –SR < 0.33 | +SR < 0.02 | +SR < 0.64 | –SR < 0.70 | –SR < 0.90 |
| (NP) Evaluation | –SR < 0.07 | Unlikely | +SR < 0.28 | –SR < 0.20 | –SR < 0.52 |
| (I) Baseline | +SR < 0.09 | –SR < 0.09 | +SR < 0.44 | –SR < 0.58 | –SR < 0.58 |
| (I) Evaluation | Unlikely | Unlikely | Unlikely | –SR < 0.36 | Unlikely |
| Panel B. East Asian-White | |||||
| Baseline | –SR < 0.78 | Unlikely | –SR < 0.16 | –SR < 0.85 | –SR < 0.68 |
| Evaluation | Unlikely | –SR < 0.63 | –SR < 0.80 | –SR < 0.45 | –SR < 0.72 |
| (E) Baseline | –SR < 0.87 | –SR < 0.04 | –SR < 0.16 | –SR < 0.78 | –SR < 0.63 |
| (E) Evaluation | –SR < 0.45 | –SR < 0.13 | –SR < 0.87 | Unlikely | –SR < 0.63 |
| (NP) Baseline | –SR < 0.74 | +SR < 0.18 | Unlikely | –SR < 0.89 | –SR < 0.71 |
| (NP) Evaluation | –SR < 0.20 | –SR < 0.66 | –SR < 0.50 | –SR < 0.74 | –SR < 0.81 |
| (I) Baseline | +SR < 0.47 | Unlikely | –SR < 0.58 | –SR < 0.83 | –SR < 0.72 |
| (I) Evaluation | –SR < 0.04 | –SR < 0.79 | –SR < 0.81 | –SR < 0.84 | –SR < 0.85 |
| Panel C. Other race-White | |||||
| Baseline | Unlikely | +SR < 0.47 | Unlikely | –SR < 0.13 | –SR < 0.36 |
| Evaluation | Unlikely | –SR < 0.07 | –SR < 0.60 | –SR < 0.13 | –SR < 0.72 |
| (E) Baseline | –SR < 0.02 | –SR < 0.36 | +SR < 0.07 | –SR < 0.02 | –SR < 0.85 |
| (E) Evaluation | –SR < 0.13 | +SR < 0.30 | –SR < 0.45 | +SR < 0.02 | –SR < 0.60 |
| (NP) Baseline | Unlikely | +SR < 0.68 | Unlikely | –SR < 0.16 | Unlikely |
| (NP) Evaluation | –SR < 0.47 | –SR < 0.39 | –SR < 0.09 | –SR < 0.52 | –SR < 0.79 |
| (I) Baseline | –SR < 0.42 | +SR < 0.62 | –SR < 0.04 | –SR < 0.20 | –SR < 0.23 |
| (I) Evaluation | –SR < 0.81 | –SR < 0.52 | –SR < 0.82 | –SR < 0.45 | –SR < 0.76 |
Evaluating the potential for adverse impacts using incentivized and unincentivized scores.
We use the standardized mean differences reported in Table 1 assuming standard normal distributions to evaluate at which reference group selection ratios members of the protected group would be adversely or positively impacted by selection based on the trait specified in the column. When preceded by “–”, the share of the protected group selected would be < 80% of the share of the reference group selected at all selection ratios less than the selection ratio given in the cell. When preceded by a “+”, the share of the protected group selected would be more than 1.25 times the share of the reference group at all selection ratios less than the selection ratio given in the cell. E indicates the Extroversion treatment, NP indicates the No Priming treatment, and I indicates the Introversion treatment. The first two rows in each panel use the pooled Baseline or Evaluation scores across all treatments.
Interpreting Table 4, however, requires understanding how employers use personality tests to cull their applicant pools. Low selection ratios and high cutoff scores are more likely to identify good fits if personality tests are predictive of performance, but they also make adverse impacts more likely if there are differences in distributions across groups. Test providers highlight this tradeoff when marketing their services to employers.23 Given that personality tests are likely noisy signals used in combination with other assessments, we suspect that selection ratios for personality tests are seldom very low. Indeed, small standardized differences between groups of 0.2—comparable in magnitude to some of the racial differences documented in Foldes et al. (2008)—under our assumptions would result in adverse impacts at selection ratios up to 0.36. Given that firms are wary of adverse impacts, firms would probably not be so selective when using personality tests to screen applicants.24 As such, we focus on trait-treatment cells in Table 4 in which adverse impacts would occur at selection ratios >0.5, but we acknowledge that this threshold is somewhat arbitrary.
Regardless of what one believes plausible selection ratios to be, however, focusing on instances when adverse impact would occur at selection ratios >0.5 is a conservative approach to identifying trait-treatment cells where adverse impact might occur. If an adverse impact would occur at a selection ratio above 0.5 using our approach, it will also occur at all lower selection ratios when assuming both distributions are standard normal distributions. This is because, when a small number of applicants are selected at low selection ratios, these will be drawn first from the right-tail of the distribution with the higher mean. Effectively what we report in Table 4 is the highest selection ratio at which adverse impact would occur.
Panel A of Table 4 reports this analysis for women (the protected group) and men (the majority group). Women would experience adverse impacts at selection ratios >0.5 from selection on openness and emotional stability given the mean differences on the unincentivized scores pooling treatments and in the No Priming and Introversion treatments. Using the pooled incentivized scores, however, women would only be adversely impacted at selection ratios < 0.1 for openness and emotional stability. In the trait-treatment cells, women would only be adversely impacted at selection ratios >0.5 from selection on emotional stability in the No Priming treatment.
By contrast, the potential for adverse impacts on East Asians relative to Whites from selection on incentivized personality scores is readily apparent in Panel B. Were applicants' scores drawn from the unincentivized score distributions, adverse impacts on East Asians would occur at selection ratios >0.5 in 9 of 15 trait-treatment cases. In six of these cases, adverse impacts would persist at selection ratios >0.5 using the incentivized scores. Of the five trait-treatment cases in which selection on unincentivized scores would be unlikely to result in adverse impacts or occur only at selection ratios < 0.2, adverse impacts would occur at selection ratios >0.5 in four of these cases from selection on incentivized scores. Overall, adverse impacts on East Asians relative to Whites would occur at selection ratios >0.5 from selection on incentivized scores in 10 of the 15 trait-treatment cases. Using the pooled Evaluation scores, adverse impacts on East Asians would occur at selection ratios >0.5 for conscientiousness, agreeableness and emotional stability.
The potential for adverse impacts on individuals of other races relative to Whites is also apparent in Panel C. Adverse impacts would occur at selection ratios >0.5 for none of the traits using the pooled Baseline scores and in only one of 15 trait-treatment cases were applicants' scores drawn from the unincentivized score distributions. By contrast, adverse impacts would occur at selection ratios >0.5 for agreeableness and emotional stability using the pooled Evaluation scores and in seven of 15 trait-treatment cases were applicants' scores drawn from the incentivized score distributions. Overall, our findings imply that selection on incentivized personality scores would adversely impact East Asians and individuals of other races at selection ratios >0.5 in half to two-thirds of the trait-treatment combinations in the experiment.25
6 Discussion
We investigate how incentives influence gender and race differences on personality measures. Gender gaps on unincentivized measures essentially disappear when subjects have incentives for misrepresentation. The attenuating effect of incentives highlights the importance of “opportunity-to-fake” dynamics: if two groups respond to incentives similarly (as we show that men and women do), then the lower scoring group on unincentivized measures will tend to close the gap when incentives are provided because they have more scope to manipulate their responses.
Incentives have very different effects on racial gaps. For East Asian subjects and subjects of other races, gaps relative to white subjects on unincentivized measures are in many cases not attenuated by incentives, or gaps appear where no similar gaps existed in the unincentivized scores. It should give researchers pause that in every instance where racial differences appear on incentivized personality measures where none existed on unincentivized measures, racial minorities would be adversely affected relative to Whites were hiring based on these measures.
In the experiment, most racial differences on incentivized measures occur where cues are absent or counterintuitive, which might reflect differences in norms and expectations concerning ideal personalities. Differences in cultural norms have been shown to contribute to personality differences in cross-country studies (Hofstede and McRae, 2004). Likewise, Ryan et al. (2021) find evidence of cultural differences in the social desirability of personality traits for Confucian Asian and South Asian contexts relative to Germanic and Eastern Europe. Future research should investigate why racial differences on incentivized personality measures emerge. A potential implication for employers wishing to avoid adverse impacts is that they should be explicit about what they are looking for when screening applicants using personality tests—a suggestion that echoes Ziegler's (2011) observation that providing job information before personality tests may be necessary to “level the playing field” given differences in applicants' prior knowledge of jobs.
We note two important limitations of our study. First, the experiment was not designed to study the effects of incentives on gender and race differences. As a consequence, our exploratory analysis is underpowered for identifying small group differences (i.e., d ≤ 0.2), but we have power >0.5 to detect medium-sized group differences as indicated by the power calculations reported in Panel D of Table 1. In our view, the lack of power to detect plausible but small group differences is a second-order concern given that such differences are less likely to influence hiring. More important is the fact that the racial differences that emerge with incentives in many cases are as large as half of a standard deviation and would almost certainly influence selection.
Second, differences between the laboratory and hiring limit the external validity of our findings. Subjects' incentives were not the same as those of actual job applicants, and our subjects may not resemble the applicants for any given job. We attempted to minimize these concerns by using ads based on an actual ad for a job to which young graduates might apply without directing subjects to fake.
In view of these limitations, we conclude by stressing the need for additional evidence regarding whether personality testing in hiring adversely impacts minorities. Evidence from a single firm as in Autor and Scarborough (2008) cannot settle the issue given the importance of information, applicant populations, and other factors.26 Likewise the evidence from this study is not definitive. Research using larger, more diverse samples ideally in a hiring setting is necessary. Larger samples would offer greater power to identify small racial differences while also permitting the investigation of differences among racial groups under-represented in our study.
7 Materials and methods
The project was approved by Simon Fraser University's Research Ethics Board (2012s0590). The experimental method is described in the Section 3. Further materials can be found in the Appendices. Appendix A reports additional summary statistics. Appendix B provides the instructions, job ads, and the instruments used in the experiment. Appendix C discusses the potential for adverse impacts from hypothetical selection using the realized distributions of subjects' scores rather than assuming that the scores are drawn from standard normal distributions as in the main text.
Statements
Data availability statement
The datasets presented in this study can be found in online repositories. The names of the repository/repositories and accession number(s) can be found below: Andrew D. McGee ECIN Replication Package for “Whoever you want me to be: personality and incentives.” Ann Arbor, MI: Inter-university Consortium for Political and Social Research [distributor], 2024-02-05. https://doi.org/10.3886/E194887V5.
Ethics statement
The studies involving humans were approved by Simon Fraser University Research Ethics Board. The studies were conducted in accordance with the local legislation and institutional requirements. The participants provided their written informed consent to participate in this study.
Author contributions
AM: Conceptualization, Formal analysis, Funding acquisition, Methodology, Project administration, Writing – original draft, Writing – review & editing. PM: Conceptualization, Data curation, Methodology, Writing – review & editing.
Funding
The author(s) declare that financial support was received for the research and/or publication of this article. AM gratefully acknowledges financial support from a Social Sciences and Humanities Research Council Insight Development Grant (#430-2013-00700).
Conflict of interest
The authors declare that the research was conducted in the absence of any commercial or financial relationships that could be construed as a potential conflict of interest.
The author(s) declared that they were an editorial board member of Frontiers, at the time of submission. This had no impact on the peer review process and the final decision.
Publisher’s note
All claims expressed in this article are solely those of the authors and do not necessarily represent those of their affiliated organizations, or those of the publisher, the editors and the reviewers. Any product that may be evaluated in this article, or claim that may be made by its manufacturer, is not guaranteed or endorsed by the publisher.
Supplementary material
The Supplementary Material for this article can be found online at: https://www.frontiersin.org/articles/10.3389/frbhe.2025.1499464/full#supplementary-material
Footnotes
1.^ The Five Factor Model (Goldberg, 1992) organizes personality into five broad traits: extroversion, conscientiousness, agreeableness, openness/intellect, and neuroticism. According to McCrae and John (1992), individuals high in extroversion tend to be more energetic, outgoing, ambitious, and assertive. Individuals high in conscientiousness tend to be diligent, well-organized, and neat. Individuals high in agreeableness tend to be more trusting, modest, and compliant. Individuals high in openness/intellect have greater need for varied and novel experiences, greater aesthetic sensitivity, and greater curiosity. Individuals high in neuroticism experience more depression, feelings of guilt, and anxiety.
2.^ McGee and McGee (2024) found that IQ and locus of control beliefs were correlated with incentivized scores in some instances. In particular, IQ was correlated with incentivized extroversion scores in the Extroversion and Introversion treatments when the ad provided information concerning the desired degree of extroversion, suggesting that IQ influenced the incentivized extroversion scores through an information acquisition or processing channel.
3.^ Raghavan et al. (2020) note that vendors may have difficulty establishing the effects of screening tools outside of testing samples in applicant samples given that protected attributes may not be collected in the hiring process.
4.^ Arcidiacono et al. (2020) show that Asian applicants to Harvard received lower “personal ratings” than other applicants despite being stronger on characteristics correlated with the personal rating. Incorporating this rating explains about half of the admissions “penalty” that they find imposed on Asian applicants.
5.^ Only 6% of applicants responded to the research survey.
6.^ The experiment was conducted using z-Tree (Fischbacher, 2007).
7.^ DeYoung et al.'s (2007) Big Five assessment asks subjects to indicate how well a statement describes them using a 5-point Likert scale. Each trait score sums the values of the 20 items associated with that trait, resulting in scores between 20 and 100. We reverse the neuroticism scale and refer to it as emotional stability.
8.^ König et al. (2012) report that applicants reference the expectations of organizations when describing faking strategies. Roulin and Krings (2020) find that individuals adapt their responses to match an organization's culture.
9.^ In so-called “fake good” studies, subjects are explicitly directed to misrepresent themselves in favorable ways or to fake as they think workers in particular occupations would (e.g., Velicer and Weiner, 1975; Furnham, 1990, 1997; McFarland and Ryan, 2000).
10.^ Using the difference between incentivized and unincentivized scores as a measure of faking could be problematic if subjects attempt to match a desired personality profile without regard to their own personalities. In this case, the incentivized scores would be uncorrelated with the unincentivized scores, but this is not what we observe. The correlations between the incentivized and non-incentivized scores reported in McGee and McGee (2024) range between 0.4 and 0.6 for every trait and treatment. Likewise, if subjects attempt to match a desired profile without using their actual personalities as a reference point, the incentivized scores might be greater than or less than the non-incentivized scores. In the scatterplots of the incentivized scores against the non-incentivized scores reported in McGee and McGee (2024), however, the incentivized scores almost never lie below the 45° line. That is, subjects inflate their unincentivized responses.
11.^ Hoffman et al. (2018), for instance, study a firm that used test scores to produce “green-yellow-red” recommendations to hiring managers concerning applicants. Approximately 21% of applicants received red scores indicating the lowest potential; these applicants had a probability of being hired of just 0.08.
12.^ Another concern regarding incentives is that actual job applicants might worry about their “fit” for a position when faking if they actually have to fill the position to which they are applying. Individuals worried about fit, however, can choose not to apply for a position. Likewise, advancing to later stages of hiring does not require applicants to take a job for which they determine they would be a bad fit. Allowing fit concerns to influence one's responses at this stage would not seem very sensible given that applicants have assessed this fit and chosen to apply. Undoubtedly some applicants prefer to be honest when responding, but some subjects in our experiment also exhibit this preference for honest responding.
13.^ The counterintuitive priming in the Introversion treatment was used to investigate the mediating effect of information about desired personalities on the correlates of faking behavior in McGee and McGee (2024).
14.^ Subjects of Indian or Pakistani heritage make up 60% of our “other race” category, Black subjects 15%, Latino subjects 5%, and subjects who selected the “Other” category 20%.
15.^ The racial distribution of subjects is similar to the representation of these groups in Burnaby, British Columbia, where Simon Fraser University is located (Statistics Canada, 2017).
16.^ Subjects were not obliged to participate in the Evaluation session, but 80% did so. There were no significant differences between non-returnees and returnees; see McGee and McGee (2024). Most importantly, the gender and race distributions of returnees and non-returnees were nearly identical. Among subjects who participated in only a Baseline session, 21% identified as White, 50% as East Asian, and 29% another race, while 49% identified as men.
17.^ Sharpened q-values control the false discovery rate, the proportion of rejections that are Type I errors. In the first step, the p-values are sorted by magnitude. The largest p-value is compared to the acceptable proportion of false positives times the ratio of the number of tests with p-values no larger than the current p-value to the total number of tests. The procedure then rejects all hypotheses with p-values less than or equal to this product. The second step repeats this process but adjusts the acceptable number of false positives to account for the hypotheses rejected in the first stage. The process ends when the number of hypotheses rejected in the first stage is zero. This algorithm indicates which hypotheses should be rejected for a given false discovery rate, but obtaining the smallest possible rate at which the hypothesis is rejected involves running the algorithm for every possible rate, e.g., 1, 0.99, 0.98, …, 0 and reporting the value at which the test ceases to be rejected, which is the reported q-value.
18.^ Alternatively we might fail to reject the null hypotheses that faking does not depend on gender after accounting for opportunity to fake due to a lack of statistical power. Our power calculations, however, suggest that we could detect changes in the R of ~0.03 at the five percent significance level with 80% power depending on the treatment and the R in the regressions without the gender-quartile interactions. Effect sizes of this magnitude are common for the regressions used to construct Figure 2. In the regressions used to generate Figure 1, however, the R increases by < 0.01 in most cases. Thus while it is true that we are underpowered to detect effect sizes of this magnitude, the reality is that the observed changes in R suggest that gender has little explanatory power where faking is concerned, which is consistent with what we observe in Figure 1.
19.^ The positive other race-White difference in incentivized extroversion in the Introversion treatment would adversely affect subjects of other races as the ad indicated that the firm sought an introvert.
20.^ Racial differences in effort or attentiveness when responding on the unincentivized measures could produce differences in faking. In this case, opportunity-to-fake arises not from differences in the underlying traits (as we assume) but from differences in effort in the Baseline: subjects who supply low effort and reply randomly or with little attentiveness have greater scope to improve their scores when incentivized. To assess this possibility, we constructed two measures to identify subjects who supplied low Baseline effort. Notably, all of our results are robust to simply excluding subjects who supplied low effort in the Baseline. Furthermore, East Asian subjects and subjects of other races were more likely than White subjects to supply low effort according to these measures, implying that they had more scope for improving their scores relative to white subjects on the incentivized tests. As such, racial differences in effort or attentiveness in the Baseline cannot explain the differences in faking that we observe. See Appendix A Table 5 for these summary statistics. In Appendix A Table 6, we also demonstrate that other measured subject characteristics cannot explain the racial differences in faking. This is largely unsurprising given that McGee and McGee (2024) found that most of these characteristics were uncorrelated with the incentivized scores.
21.^ These differences in earnings and the probability of winning the bonus could reflect racial differences in IQ given that both were influenced directly by IQ scores. In regressions of earnings and an indicator for winning the bonus on the race indicators, however, the race coefficients are significant at the 1% level even after controlling for IQ.
22.^ Firms may use tests to identify workers with a particular trait (Hough and Oswald, 2000), but they might also create composite scores from multiple measures to mitigate group differences on any one measure. We follow Foldes et al. (2008) and Powell et al. (2011) in considering adverse impacts on a trait-by-trait basis because such composite measures are firm-specific. Moreover, Sackett and Ellingson (1997) show that it is difficult to add measures to a selection test to mitigate large group differences (i.e., d = 1.0)—an observation confirmed in studies of personality testing such as Ryan et al. (1998). While the standardized effects in our study are not that large, it would still be difficult to mitigate effects of the sizes in our study (d = 0.6 in some cases) given the correlations between measures.
23.^ See, for instance, https://www.testpartnership.com/blog/impact-cut-off-scores-recruitment.html.
24.^ Unfortunately, little evidence on how employers use personality tests exists. Applicants to the retail firm studied by Hoffman et al. (2018) received “green–yellow–red” scores from job tests with 21% receiving “red” scores indicating low potential candidates, which suggests a selection ratio of around 0.8. On the other hand, Ock and Oswald (2018) use values of 0.1, 0.2, and 0.4 as plausible selection ratios in a simulation study of selection decisions.
25.^ In Appendix C, we investigate the potential for adverse impacts from hypothetical selection using the realized distributions of subjects' scores following Powell et al. (2011) rather than assuming that the scores are drawn from standard normal distributions. We reach similar conclusions regarding the prospects for adverse impacts.
26.^ In over a decade since Autor and Scarborough published their study, not a single paper citing their study has estimated the effects of personality testing on minority hiring outcomes.
References
1
Almlund M. Duckworth A. L. Heckman J. Kautz T. (2011). “Personality psychology and econoimcs,” in Handbook of the Economics of Education, Vol. 4, 1–181.
2
Arcidiacono P. Kinsler J. Ransom T. (2020). Asian American Discrimination in Harvard Admissions (Bonn: IZA Discussion Paper), 13172.
3
Autor D. Scarborough D. (2008). Does job testing harm minority workers? Evidence from retail establishments. Q. J. Econ.123, 219–277. 10.1162/qjec.2008.123.1.219
4
Barrick M. R. Mount M. K. (1991). The big five personality dimensions and job performance: a meta-analysis. Pers. Psychol.44, 1–26. 10.1111/j.1744-6570.1991.tb00688.x
5
Benjamini Y. Krieger A. Yekutieli D. (2006). Adaptive linear step-up procedures that control the false discovery rate. Biometrika93, 491–507. 10.1093/biomet/93.3.491
6
Brenčič V. McGee A. (2023). Employers' Demand for Personality Traits.Bonn: Institute for the Study of Labor.
7
Cohen J. (1988). Standard Power Analysis for the Behavioral Sciences. (2nd Edn.). Hillsdale, NJ: Lawrence Erlbaum.
8
Cowgill B. (2020). Bias and Productivity in Humans and Algorithms: Theory and Evidence from Resume Screening. New York: Columbia Business School.
9
DeYoung C. G. Quilty L. C. Peterson J. B. (2007). Between facets and domains: 10 aspects of the Big Five. J. Pers. Soc. Psychol.93, 880. 10.1037/0022-3514.93.5.880
10
Ellingson J. E. Sackett P. R. Connelly B. S. (2007). Personality assessment across selection and development contexts: insights into response distortion. J. Appl. Psychol.92, 386–395. 10.1037/0021-9010.92.2.386
11
Feingold A. (1994). Gender differences in personality: a meta-analysis. Psychol. Bull.116, 429–456. 10.1037/0033-2909.116.3.429
12
Fell C. B. König C. J. (2016). Cross-cultural differences in applicant faking on personality tests: a 43-nation study. Appl. Psychol. Int. Rev.65, 671–717. 10.1111/apps.12078
13
Fischbacher U. (2007). z-Tree: Zurich toolbox for ready-made economic experiments. Exp. Econ.10, 171–178. 10.1007/s10683-006-9159-4
14
Foldes H. Duehr E. Ones D. (2008). Group differences in personality: meta-analyses comparing five U.S. racial groups. Pers. Psychol.61, 579–616. 10.1111/j.1744-6570.2008.00123.x
15
Furnham A. (1990). Faking personality questionnaires: fabricating different profiles for different purposes. Curr. Psychol. Res. Rev.9, 46–55. 10.1007/BF02686767
16
Furnham A. (1997). Knowing and faking one's five-factor personality score. J. Pers. Assess.69, 229–243. 10.1207/s15327752jpa6901_14
17
Gneezy U. List J. Livingston J. Qin X. Sadoff S. Xu Y. (2019). Measuring success in education: the role of effort on the test itself. Am. Econ. Rev.: Insights1, 291–308.
18
Goldberg L. R. (1992). The development of markers for the Big-Five factor structure. Psychol. Assess.4, 26–42. 10.1037/1040-3590.4.1.26
19
Goldberg L. R. Sweeney D. Merenda P. F. Hughes J. E. (1998). Demographic variables and personality: the effects of gender, age, education, and ethnic/racial status on self-descriptions of personality attributes. Pers. Individ. Diff.24, 393–403. 10.1016/S0191-8869(97)00110-4
20
Griffith R. L. Chmielowski T. Yoshita Y. (2007). Do applicants fake? An examination of applicant faking frequency. Pers. Rev.36, 341–355. 10.1108/00483480710731310
21
He Y. Donnellan M. B. Mendoza A. M. (2019). Five-factor personality domains and job performance: a second order meta-analysis. J. Res. Pers.82, 103848. 10.1016/j.jrp.2019.103848
22
Hoffman M. Kahn L. B. Li D. (2018). Discretion in hiring. Q. J. Econ.133, 765–800. 10.1093/qje/qjx042
23
Hofstede G. McRae R. R. (2004). Personality and culture revisited: linking traits and dimensions of culture. Cross-Cult. Res.38, 52–88. 10.1177/1069397103259443
24
Holt C. A. Laury S. K. (2002). Risk Aversion and Incentive Effects. Am. Econ. Rev.92, 1644–1655. 10.1257/000282802762024700
25
Hough L. Eaton N. Dunnette M. Kamp J. McCloy R. (1990). Criterion-related validities of personality constructs and the effect of response distortion on those validities. J. Appl. Psychol.75, 581–595. 10.1037/0021-9010.75.5.581
26
Hough L. M. Oswald F. L. (2000). Personnel selection: looking toward the future—remembering the past. Ann. Rev. Psychol.51, 631–664. 10.1146/annurev.psych.51.1.631
27
Hough L. M. Oswald F. L. Ployhart R. E. (2001). Determinants, detection and amelioration of adverse impact in personnel selection procedures: issues, evidence and lessons learned. Int. J. Select. Assess.9, 152–194. 10.1111/1468-2389.00171
28
Hu J. Connelly B. S. (2021). Faking by actual applicants on personality tests: a meta-analysis of within-subject studies. Int. J. Select. Assess.29, 412–426. 10.1111/ijsa.12338
29
Ichniowski C. Shaw K. Prennushi G. (1997). The effects of human resource management practices on productivity: a study of steel finishing lines. Am. Econ. Rev.87, 291–313.
30
Isaacson J. Peterson M. Turner S. Griffith R. Kung M-. C. (2009). “Investigating response distortion in selection settings: evaluating subgroup differences,” in 24th Annual Conference of the Society for Industrial and Organizational Psychology. New Orleans.
31
König C. J. Merz A. -S. Trauffer N. (2012). What is in applicants' minds when they fill out a personality test? Insights from a qualitative study. Int. J. Select. Assess.20, 442–452. 10.1111/ijsa.12007
32
Li D. Raymond L. R. Bergman P. (2020). “Hiring as exploration,” in National Bureau of Economic Research Working Paper No. w27736. MA: National Bureau of Economic Research.
33
McCrae R. R. John O. P. (1992). An introduction to the five-factor model and its applications. J. Pers.60, 175–215. 10.1111/j.1467-6494.1992.tb00970.x
34
McFarland L. A. Ryan A. M. (2000). Variance in faking across noncognitive measures. J. Appl. Psychol.85, 812–821. 10.1037/0021-9010.85.5.812
35
McGee A. D. McGee P. J. (2024). Whoever you want me to be: personality and incentives. Econ. Inq.62, 1268–1291. 10.1111/ecin.13220
36
Ock J. Oswald F. L. (2018). The utility of personnel selection decisions: comparing compensatory aand multiple-hurdle selection models. J. Pers. Psychol.17, 172–182. 10.1027/1866-5888/a000205
37
Powell D. Goffin R. Gellatly I. (2011). Gender differences in personality scores: implications for differential hiring rates. Pers. Indiv. Diff.50, 106–110. 10.1016/j.paid.2010.09.010
38
Raghavan M. Barocas S. Kleinberg J. Levy K. (2020). “Mitigating bias in algorithmic hiring: evaluating claims and practices,” in FAT* '20: Proceedings of the 2020 Conference on Fairness, Accountability, and Transparency (Barcelona, Spain: ACM), 469–480.
39
Raven J. C. (1998). Raven's Progressive Matrices.Oxford: Oxford Psychologists Press.
40
Rosse J. G. Stecher M. D. Miller J. L. Levin R. A. (1998). The impact of response distortion on preemployment personality testing and hiring decisions. J. Appl. Psychol.83, 634. 10.1037/0021-9010.83.4.634
41
Roulin N. Krings F. (2020). Faking to fit in: applicants' response strategies to match organizational culture. J. Appl. Psychol.105, 130–145. 10.1037/apl0000431
42
Ryan A. M. Bradburn J. Bhatia S. Beals E. Boyce A. S. Martin N. et al . (2021). In the eye of the beholder: considering culture in assessing the social desirability of personality. J. Appl. Psychol.106, 452–466. 10.1037/apl0000514
43
Ryan A. M. Ployhart R. E. Friedel L. A. (1998). Using personality testing to reduce adverse impact: a cautionary note. J. Appl. Psychol.83, 298–307. 10.1037/0021-9010.83.2.298
44
Sackett P. R. Ellingson J. E. (1997). The effects of forming multi-predictor composites on group differences and adverse impact. Pers. Psychol.50, 707–722.
45
Salgado J. F. (1997). The five factor model of personality and job performance in the European Community. J. Appl. Psychol.82, 30–43. 10.1037/0021-9010.82.1.30
46
Statistics Canada (2017). Burnaby, CY [Census Subdivision], British Columbia and Greater Vancouver, RD [Census Division], British Columbia (Table). Census Profile.Ottawa: Statistics Canada.
47
Tett R. Jackson D. Rothstein M. (1991). Personality measures as predictors of job performance: a meta-analytic review. Pers. Psychol.44, 703–742. 10.1111/j.1744-6570.1991.tb00696.x
48
Tett R. Simonet D. (2011). Faking in personality assessment: a “multisaturation” perspective on faking as performance. Hum. Perform.24, 302–321. 10.1080/08959285.2011.597472
49
U. S. Equal Employment Opportunity Commission (2018). Best Buy and EEOC Reach Agreement to Resolve Discrimination Charge. Washington, D.C.: U.S. Equal Employment Opportunity Commission.
50
Velicer W. Weiner B. (1975). Effects of sophistication and faking sets on the eysenck personality inventory. Psychol. Rep.37, 71–73. 10.2466/pr0.1975.37.1.71
51
Watrin L. Weihrauch L. Wilhelm O. (2023). The criterion-related validity of conscientiousness in personnel selection: a meta-analytic reality check. Int. J. Select. Assess.31, 286–301. 10.1111/ijsa.12413
52
Weekley J. A. Ployhart R. E. Herold C. M. (2004). Personality and situational judgment tests across applicant and incumbent settings: an examination of validity, measurement, and subgroup differences. Human Perform.17, 433–461. 10.1207/s15327043hup1704_5
53
Weisberg Y. J. DeYoung C. G. Hirsch J. B. (2011). Gender differences in personality across 10 aspects of the Big Five. Front. Psychol.2, 178. 10.3389/fpsyg.2011.00178
54
Ziegler M. (2011). Applicant Faking: a Look into the Black Box. Indus. Organ. Psycholog.49, 29–36.
Summary
Keywords
personality, measurement, hiring, race, gender
Citation
McGee AD and McGee PJ (2025) Gender and race differences on incentivized personality measures. Front. Behav. Econ. 4:1499464. doi: 10.3389/frbhe.2025.1499464
Received
20 September 2024
Accepted
31 March 2025
Published
25 April 2025
Volume
4 - 2025
Edited by
Pedro Rey-Biel, ESADE Business School, Spain
Reviewed by
Christiane Schwieren, Heidelberg University, Germany
Pau Balart, University of the Balearic Islands, Spain
Updates
Copyright
© 2025 McGee and McGee.
This is an open-access article distributed under the terms of the Creative Commons Attribution License (CC BY). The use, distribution or reproduction in other forums is permitted, provided the original author(s) and the copyright owner(s) are credited and that the original publication in this journal is cited, in accordance with accepted academic practice. No use, distribution or reproduction is permitted which does not comply with these terms.
*Correspondence: Andrew D. McGee mcgee1@ualberta.ca
Disclaimer
All claims expressed in this article are solely those of the authors and do not necessarily represent those of their affiliated organizations, or those of the publisher, the editors and the reviewers. Any product that may be evaluated in this article or claim that may be made by its manufacturer is not guaranteed or endorsed by the publisher.