 Huakai Zhang
 Shiguang Wang
 Yongchao Huang
 Lei Xiu
 Yan Wang
- 1Medical College, Zhengzhou University of Industrial Technology, Zhengzhou, Henan, China
- 2Henan Province Smart Health Care Engineering Technology Research Center, Zhengzhou, Henan, China
Background: Physical activity is linked to mental health, yet the dose–response shape remains debated.
Methods: In a cross-sectional sample of Chinese university students, 820 participants (mean age 21.5 years; 51.8% women) wore wrist accelerometers for 7 days. Subjective well-being (SWB) was measured with the WHO-5 (0–100). Restricted cubic spline models adjusted for age, sex, sleep quality, perceived stress, and socioeconomic status. Sensitivity analyses included quadratic and segmented models, trimming/winsorization, and E-value assessment. Peaks/plateaus were estimated via the delta method and bootstrap-BCa confidence intervals.
Results: The steps–SWB association was non-linear (overall p<0.05). SWB rose steeply up to ~8,650 steps/day and then leveled off, with a statistical plateau near ~19,300 steps/day (bootstrap-BCa 95% CI: 7,997–17,896; delta-method 95% CI: 9,394–14,462). No contrast versus 4,000 steps/day exceeded the prespecified minimal clinically important difference (MCID=10 points). Findings were consistent across specifications; right-tail precision was limited due to few very high step counts.
Conclusion: Among university students, higher daily steps are associated with better SWB up to ~8,000–12,000 steps/day, beyond which benefits plateau with diminishing returns rather than harm. Results support range-based, progressive step guidance for student mental health. Please replace the current abstract with the structured IMRaD version provided above.
1 Introduction
Subjective wellbeing (SWB) is a core indicator of mental health and quality of life. A large body of research links physical activity (PA) with higher SWB across age groups and across multiple facets of wellbeing (e.g., affective wellbeing and life satisfaction; Buecker et al., 2021; Li et al., 2023; Patria, 2022; Bernstein and McNally, 2017; Bernstein and McNally, 2018; Wang et al., 2025; Weinstein et al., 2024). Building on this literature, accumulating evidence suggests that the PA–wellbeing relationship is non-linear: benefits are greater within moderate levels of PA, with diminishing returns—and in some cases, a slight decline—beyond higher doses (Chekroud et al., 2018; Shimura et al., 2022).
For quantifying behavioral dose, the daily step count offers a low-biased, continuously scaled exposure. Recent systematic reviews and meta-analyses show dose–response associations between more daily steps and lower risk or symptoms of depression, with plateaus or attenuated gains often observed at approximately 7,000–10,000 steps/day, supporting the use of step counts for actionable recommendations (Bizzozero-Peroni et al., 2024; Inoue et al., 2023). Evidence on steps and multiple health outcomes—including mental health-related endpoints—has been growing rapidly, underscoring the advantages and comparability of device-measured steps (Ding et al., 2025).
University students represent a particularly important population for this line of inquiry: their daily routines are irregular, and academic and social pressures are salient (Haruna et al., 2025; Pérez-Jorge et al., 2025), and they are heavy users of wearable devices, making them both vulnerable to fluctuations in wellbeing and highly suitable for step-based monitoring (Abd-Alrazaq et al., 2024; Pope et al., 2019). Despite these features, little is known about the precise dose–response relationship between step counts and SWB in this group. Addressing this gap not only advances theory on non-linear PA–wellbeing links but also yields practical, range-based targets for campus health promotion (Bizzozero-Peroni et al., 2024; Ding et al., 2025).
Against this background, we investigated Chinese university students using wearable-recorded daily step count as exposure and WHO-5 as the outcome. We explicitly hypothesized that SWB would increase with step count up to a threshold, after which the association would plateau or modestly decline, forming an inverted-U pattern.
2 Materials and methods
2.1 Study design and participants
This cross-sectional observational study recruited university students from a campus in Zhengzhou, China, between 1 May 2025 and 1 July 2025.
The inclusion criteria were as follows: patients aged ≥18 years; those able to independently complete questionnaires and provide written informed consent; those who provided at least 7 consecutive days of wearable step-count data; and those who completed the World Health Organization-Five Well-Being Index (WHO-5), the Pittsburgh Sleep Quality Index (PSQI), and the Perceived Stress Scale-4 (PSS-4).
The exclusion criteria were as follows: those who were previously diagnosed with severe neurological or psychiatric disorders, those with missing or invalid step data (>30% missing), and the use of assistive devices that substantially affect gait.
Of the 1,050 students invited, 912 agreed to participate (86.9% responses). After excluding 92 with insufficient step-count device wear (<4 valid days) and 0 with incomplete questionnaires, 820 participants (78.1% of those invited) were retained for analysis.
All participants provided written informed consent. The study complied with the Declaration of Helsinki and was approved by the Institutional Review Board of Zhengzhou University of Industrial Technology (protocol code 202504036).
2.2 Measures and variable definitions
2.2.1 Exposure: daily step count
Participants were wearing a HUAWEI Band 8 (Huawei Device Co., Ltd., Shenzhen, China) on the non-dominant wrist for 7 consecutive days. The device is equipped with six-axis inertial sensors (accelerometer and gyroscope) and an optical heart-rate sensor. We extracted daily step counts that were aggregated using the manufacturer’s algorithm via the Huawei Health application; however, raw accelerometry sampling frequencies are not publicly disclosed. Although the proprietary algorithm is not publicly available, validation studies have demonstrated acceptable step-count accuracy of Huawei wearables against research-grade accelerometers in free-living adults (Mei et al., 2024). A valid day was defined as ≥20 h of wear; participants with ≥4 valid days, including ≥1 weekend day, were retained for analysis.
2.2.2 Primary outcome
Subjective wellbeing was measured using the Chinese WHO-5 Well-Being Index, which shows solid psychometric properties in Chinese university students and the general population (Fung et al., 2022; Du et al., 2023; Kliem et al., 2025). Each item is scored on a scale of 0–5; total scores were transformed to 0–100, with higher scores indicating better wellbeing. We adopted a minimal clinically important difference (MCID) of 10 points on the WHO-5 as a benchmark for interpreting the practical significance of observed associations.
2.2.3 Covariates
We adjusted for a set of covariates that may plausibly influence subjective wellbeing (SWB). Age and sex were included as standard demographic factors. Sleep quality was assessed by the Pittsburgh Sleep Quality Index (PSQI) (De Moraes et al., 2024; Guo et al., 2016) and perceived stress by the 4-item Perceived Stress Scale (PSS-4) (She et al., 2021), both of which are established predictors of mental health. Monthly living expenses were included as a proxy indicator of socioeconomic status (SES). Because the distribution of expenses was highly right-skewed, we applied log-transformation to improve normality and model fit. We adjusted for age, sex, sleep quality, perceived stress, and SES because these are established correlates of SWB and likely confounders of the steps–SWB link (Blanchflower and Bryson, 2024; Wang et al., 2023; Jeong et al., 2024; Su and He, 2023).
Data auditing procedures included checks for timestamp continuity, abnormal spikes, and extended zero-count segments. Abnormal days were verified manually and corrected using pre-specified rules.
2.3 Statistical analysis
Analyses were conducted in R version 4.5.1. All models were adjusted for age, sex, sleep quality (PSQI), perceived stress (PSS-4), and monthly living expenses.
The primary dose–response model was specified as a restricted cubic spline (RCS) with four knots placed at the 5th, 35th, 65th, and 95th percentiles of mean daily steps. Overall non-linearity was assessed by a joint Wald/F-test of the spline terms (H₀: all non-linear terms = 0). For sensitivity analyses, we additionally fit quadratic polynomial models (testing β₂ = 0) and piecewise regression models with data-driven breakpoints.
Turning points were identified from the fitted RCS curve. To quantify uncertainty, we computed 95% confidence intervals (CIs) using both the delta method and 1,000 pairs of bootstrap replicates with bias-corrected and accelerated (BCa) intervals. We also evaluated whether the predicted differences in WHO-5 scores reached the MCID of 10 points, a benchmark commonly adopted for the WHO-5.
To assess robustness, we performed sensitivity analyses, including (i) winsorizing or truncating extreme step counts, (ii) alternative covariate specifications, and (iii) subgroup analyses.
To address unmeasured confounding, we calculated E-values for key step-count contrasts derived from the RCS model, quantifying the minimum strength of association an unmeasured confounder would need with both exposure and outcome to fully explain away the observed association.
To evaluate statistical adequacy, we further conducted a post-hoc power analysis for the overall non-linearity test in the primary RCS model. Power was estimated at α = 0.05 using the non-central-F distribution parameterized by the partial R2 of the non-linear spline terms.
3 Results
3.1 Sample characteristics by step-count quartiles
Among the 820 participants included, 336 (41.0%) contributed 7 valid days, 262 (32.0%) contributed 6 days, 146 (17.8%) contributed 5 days, and 76 (9.3%) contributed 4 days. Overall, 598 of the 820 participants (72.9%) provided ≥6 valid days.
A total of 820 participants (mean age 21.5 ± 2.1 years, 51.8% women) were included in the analysis. The average sleep quality score (PSQI) was 6.3 ± 2.6, and the perceived stress score (PSS-4) was 6.9 ± 3.2. The median monthly living expense was CNY¥2,242 [IQR: 1,714–2,957]. Device compliance was high, with participants contributing a median of 7 valid days [IQR: 5–9] and an average wear time of 21.6 ± 0.36 h/day.
By design, mean daily steps increased across quartiles: 5,513 ± 1,474 in Q1, 8,422 ± 586 in Q2, 10,519 ± 592 in Q3, and 13,209 ± 1,428 in Q4. Baseline characteristics such as sex, age, sleep, stress, and living expenses were well balanced across step-count quartiles (all |SMD| < 0.10). Detailed characteristics are provided in Supplementary Table 1.
3.2 Main dose–response
The RCS model demonstrated a statistically significant overall non-linearity in the association between mean daily steps and WHO-5 scores (p for non-linearity < 0.05; Supplementary Table 2).
In the RCS model (Figure 1), WHO-5 scores increased with step count, showing a steep increase up to approximately ~8,650 steps/day and a gradual leveling thereafter. The curve reached a plateau at approximately ~19,300 steps/day (bootstrap-BCa 95% CI: 7,997–17,896; delta method 95% CI: 9,394–14,462), without the evidence of a clinically meaningful decline at higher levels.
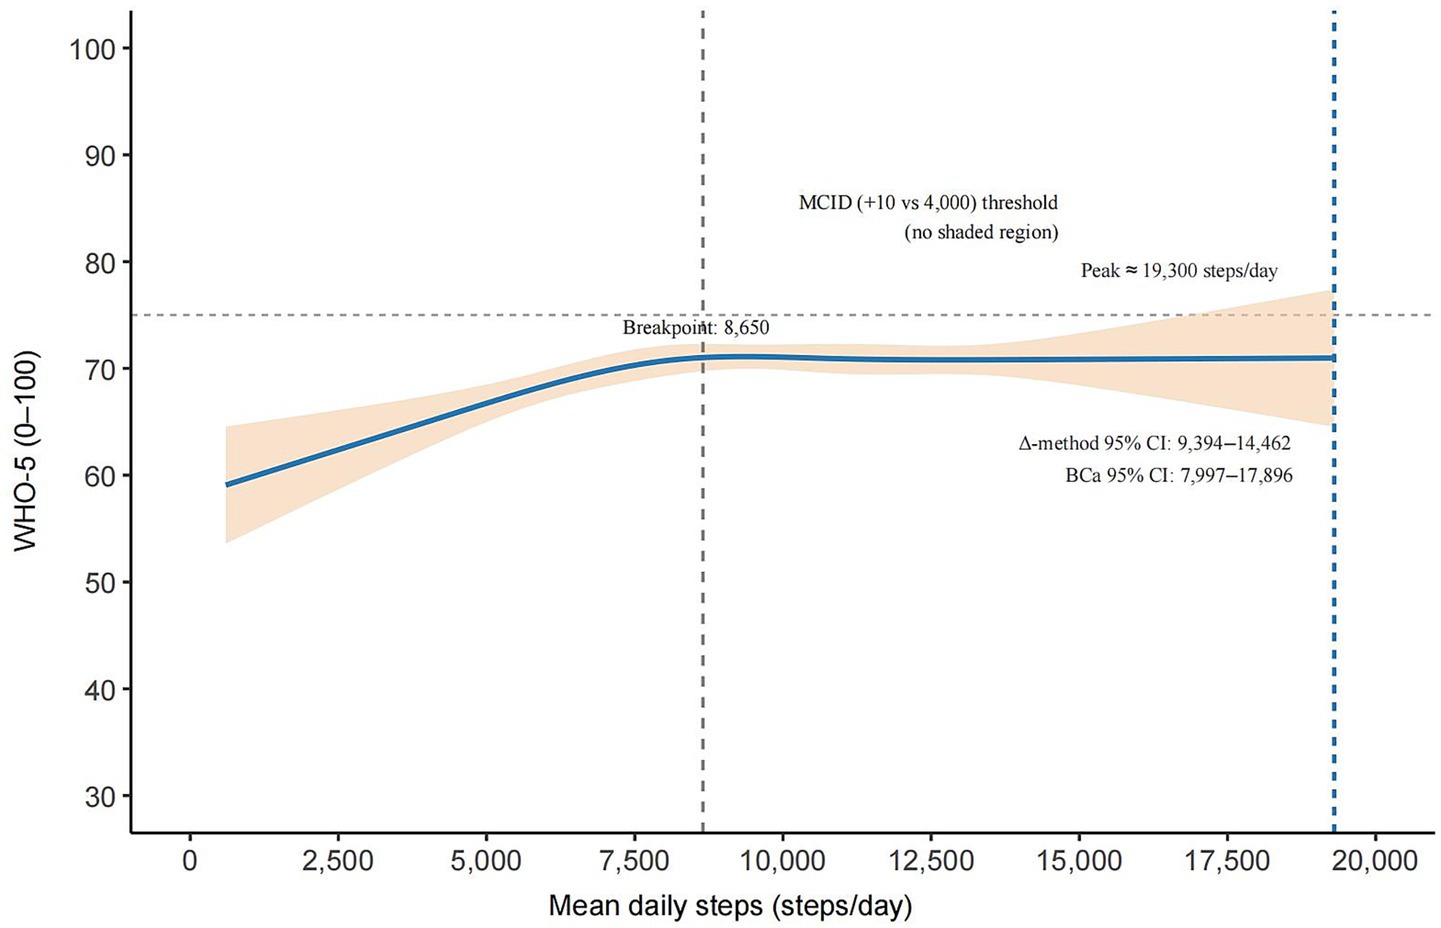
Figure 1. Adjusted non-linear dose–response between mean daily steps and WHO-5 in university students (RCS). The solid blue curve shows the adjusted association with a 95% robust CI (shaded). The vertical dashed line marks the maximum of the fitted curve (peak ≈ 19,300 steps/day; BCa 95% CI 7,997–17,896; Δ-method 95% CI 9,394–14,462). The dotted gray line indicates the segmented regression breakpoint (~8,650 steps/day). Relative to 4,000 steps/day, no step-count range achieved the minimal clinically important difference (MCID = +10 points); hence, the MCID threshold is shown as a horizontal reference line (no shaded region).
Although the dose–response was statistically significant, the maximum contrast in predicted WHO-5 scores relative to 4,000 steps/day did not exceed the prespecified minimal clinically important difference (MCID) of 10 points, indicating that the magnitude of the change may be of limited clinical relevance.
Model comparison results (Supplementary Table 3) further supported the RCS specification, which provided a better fit than linear or quadratic models and closely aligned with segmented regression estimates, reinforcing the robustness of the non-linear association.
3.3 Sensitivity and robustness analyses
Robustness checks consistently supported the primary findings. As shown in Supplementary Table 4, quantification of unmeasured confounding using E-values indicated that an unmeasured confounder would need to be associated with both step count and WHO-5 with a risk ratio of at least 1.44 (point estimate) to fully explain away the observed association and at least 1.20 to move the lower bound of the 95% CI to the null. Such magnitudes are unlikely in this context, given the covariates already controlled, suggesting that residual confounding alone is unlikely to account for the observed non-linearity.
The clinical meaningfulness of the dose–response is shown in Supplementary Figure 1, which illustrates the quadratic specification. This model produced an inverted-U curve with a peak at approximately 11,964 steps/day (95% CI: 9,338–14,590), closely aligning with the RCS results.
Additional sensitivity analyses (Supplementary Tables 1–5) confirmed that the results were consistent under alternative model forms, covariate specifications, and trimming or winsorizing strategies. Model fit comparisons (Supplementary Table 6) indicated that the RCS specification provided a slightly better fit than linear or quadratic alternatives, reinforcing its use as the primary model. Finally, post-hoc power analyses (Supplementary Table 7) demonstrated that the study retained adequate sensitivity to detect the non-linear effect (power = 0.786 at α = 0.05), supporting the reliability of the inference.
4 Discussion
In a relatively homogeneous student sample, we minimized structural confounding from occupation and commuting, enabling a clearer test of the non-linear link between daily steps and SWB. In the RCS model (Figure 1), WHO-5 scores increased steeply with step count up to a data-driven breakpoint of approximately ~8,650 steps/day (from segmented regression), after which further increases produced only minimal gains. The curve reached a statistical plateau with a peak at approximately ~19,300 steps/day (bootstrap-BCa 95% CI: 7,997–17,896; delta method 95% CI: 9,394–14,462); beyond approximately ~8,650 steps/day, the slope was near zero, and the confidence bands largely overlapped, indicating no clinically meaningful improvement at higher levels. The overall non-linearity was significant (p < 0.05; Supplementary Table 2), and the segmented model corroborated the same rise-then-plateau pattern. Notably, the maximum predicted contrast relative to 4,000 steps/day did not exceed the prespecified MCID of 10 points.
The pattern aligns with evidence that moderate PA tends to optimize mental health outcomes, whereas ever-higher volumes yield diminishing returns. Large-scale datasets and step-count studies similarly indicate that moving from low activity toward approximately ~5,000–7,000 steps/day is associated with better mental health-related outcomes (Chekroud et al., 2018; Shimura et al., 2022; Bizzozero-Peroni et al., 2024), consistent with our observed plateau pattern and the notion of diminishing returns.
Plausible mechanisms support this non-linear pattern: moderate PA may enhance SWB via stress-buffering and emotion regulation, social engagement, and improved sleep, whereas higher loads—especially late-evening or high-intensity bouts—can exacerbate mood disturbance, HPA-axis strain, injury burden, and sleep disruption. These pathways are coherent with our covariate adjustments (PSQI, PSS-4) and help explain the observed plateau beyond approximately ~8,650 steps/day, where further increases conferred no additional benefit (Stutz et al., 2019; Meeusen et al., 2013; Halson, 2014).
Methodologically, the strengths of this study include objective step measurement, continuous modeling with restricted cubic splines as the primary specification, validation via quadratic and segmented fits, inference with HC3 SEs, and multiple robustness checks (trimming, winsorization, and alternative scales for expenses). Across specifications, the plateau pattern and estimated breakpoint/peak range remained stable (Supplementary Tables 2, 3), suggesting that the results are not artifacts of outliers or scaling choices (Schuster et al., 2022; Muggeo, 2003; Burnham and Anderson, 2004).
Two cautions are warranted. First, peak CIs are relatively wide, reflecting sparse data at very high step counts and greater right-tail uncertainty. Second, the post-peak pattern should not be read as “high steps are harmful”; a more precise interpretation is diminishing returns beyond the optimal zone (Chekroud et al., 2018). As an observational study, residual confounding (e.g., personality traits, prior mental health history, and social support) cannot be ruled out, and generalizability beyond university student’s warrants care.
Practically, the findings support range-based campus guidance: emphasize feasible, moderate targets (e.g., progressing from low steps toward ~5,000–7,000 steps/day already yields benefits) while recognizing individual variability around the plateau onset, beyond which additional steps confer diminishing returns (Chekroud et al., 2018; Shimura et al., 2022; Bizzozero-Peroni et al., 2024). Analytically, we recommend modeling steps as continuous exposure (e.g., RCS, segmented regression, or fractional polynomials) within an information-criterion framework rather than coarse categorization to better capture the underlying curve (Schuster et al., 2022; Muggeo, 2003; Burnham and Anderson, 2004).
4.1 Limitations and next steps
As an observational analysis, causality cannot be inferred, and residual confounding may remain; right-tail precision is limited where very high step counts are sparse, particularly in the plateau range. Future studies should replicate across campuses and regions using prospective or quasi-experimental designs, incorporate objective sleep metrics and physiological stress markers, and test mediation by sleep and perceived stress to clarify mechanisms. In addition, the accelerometer sampling frequency and proprietary algorithms of the Huawei Band are not publicly disclosed. This lack of transparency may reduce reproducibility and limit comparability across devices and studies, despite our multiple robustness checks.
5 Conclusion
In a large sample of Chinese university students, daily steps and SWB followed a non-linear pattern characterized by an initial rise and subsequent plateau: after covariate adjustment, SWB increased with higher steps up to a breakpoint approximately ~8,650 steps/day and reached a statistical peak of approximately ~19,300 steps/day (bootstrap-BCa 95% CI: 7,997–17,896; delta method 95% CI: 9,394–14,462), beyond which gains leveled off with modest diminishing returns rather than harm. The curve—and its plateau range—was robust across alternative specifications (RCS, segmented regression) and preprocessing choices, supporting a continuous dose–response interpretation.
Data availability statement
The original contributions presented in the study are included in the article/Supplementary material, further inquiries can be directed to the corresponding author/s.
Ethics statement
The studies involving humans were approved by the Institutional Review Board of Zhengzhou University of Industrial Technology (protocol code 202504036). The studies were conducted in accordance with the local legislation and institutional requirements. The participants provided their written informed consent to participate in this study.
Author contributions
HZ: Data curation, Formal analysis, Investigation, Methodology, Project administration, Software, Validation, Visualization, Writing – original draft, Writing – review & editing. SW: Conceptualization, Data curation, Formal analysis, Investigation, Methodology, Project administration, Supervision, Writing – review & editing. YH: Conceptualization, Data curation, Investigation, Methodology, Software, Validation, Visualization, Writing – original draft. LX: Data curation, Formal analysis, Investigation, Methodology, Project administration, Software, Validation, Visualization, Writing – original draft. YW: Conceptualization, Data curation, Formal analysis, Funding acquisition, Methodology, Project administration, Resources, Supervision, Validation, Visualization, Writing – original draft, Writing – review & editing.
Funding
The author(s) declare that financial support was received for the research and/or publication of this article. This study was supported by the Science and Technology Research Project of Henan Province (grant no. 252102310248), the Henan Province University Key Scientific Research Project (grant no. 26A320072), and the Supply and Demand Docking Project of the Ministry of Education (grant no. 2024101239370).
Conflict of interest
The authors declare that the research was conducted in the absence of any commercial or financial relationships that could be construed as a potential conflict of interest.
Generative AI statement
The authors declare that no Gen AI was used in the creation of this manuscript.
Any alternative text (alt text) provided alongside figures in this article has been generated by Frontiers with the support of artificial intelligence and reasonable efforts have been made to ensure accuracy, including review by the authors wherever possible. If you identify any issues, please contact us.
Publisher’s note
All claims expressed in this article are solely those of the authors and do not necessarily represent those of their affiliated organizations, or those of the publisher, the editors and the reviewers. Any product that may be evaluated in this article, or claim that may be made by its manufacturer, is not guaranteed or endorsed by the publisher.
Supplementary material
The Supplementary material for this article can be found online at: https://www.frontiersin.org/articles/10.3389/fnbeh.2025.1693386/full#supplementary-material
References
Abd-Alrazaq, A., Alajlani, M., Ahmad, R., AlSaad, R., Aziz, S., Ahmed, A., et al. (2024). The performance of wearable Ai in detecting stress among students: systematic review and Meta-analysis. J. Med. Internet Res. 26:e52622. doi: 10.2196/52622
Bernstein, E. E., and Mcnally, R. J. (2017). Acute aerobic exercise helps overcome emotion regulation deficits. Cogn Emot 31, 834–843. doi: 10.1080/02699931.2016.1168284
Bernstein, E. E., and Mcnally, R. J. (2018). Exercise as a buffer against difficulties with emotion regulation: a pathway to emotional wellbeing. Behav. Res. Ther. 109, 29–36. doi: 10.1016/j.brat.2018.07.010
Bizzozero-Peroni, B., Díaz-Goñi, V., Jiménez-López, E., Rodríguez-Gutiérrez, E., Sequí-Domínguez, I., Núñez De Arenas-Arroyo, S., et al. (2024). Daily step count and depression in adults: a systematic review and Meta-analysis. JAMA Netw. Open 7, –e2451208. doi: 10.1001/jamanetworkopen.2024.51208
Blanchflower, D., and Bryson, A. (2024). The gender well-being gap. Soc. Indic. Res. 173, 1–45. doi: 10.1007/s11205-024-03334-7
Buecker, S., Simacek, T., Ingwersen, B., Terwiel, S., and Simonsmeier, B. A. (2021). Physical activity and subjective well-being in healthy individuals: a meta-analytic review. Health Psychol. Rev. 15, 574–592. doi: 10.1080/17437199.2020.1760728
Burnham, K. P., and Anderson, D. R. (2004). Multimodel inference: understanding AIC and BIC in model selection. Sociol. Methods Res. 33, 261–304. doi: 10.1177/0049124104268644
Chekroud, S. R., Gueorguieva, R., Zheutlin, A. B., Paulus, M., Krumholz, H. M., Krystal, J. H., et al. (2018). Association between physical exercise and mental health in 1·2 million individuals in the Usa between 2011 and 2015: a cross-sectional study. Lancet Psychiatry 5, 739–746. doi: 10.1016/S2215-0366(18)30227-X
De Moraes, A. C. F., Conceição Da Silva, L. C., Lima, B. S., Marin, K. A., Hunt, E. T., and Nascimento-Ferreira, M. V. (2024). Reliability and validity of the online Pittsburgh sleep quality index in college students from low-income regions. Front Digit Health 6:1394901. doi: 10.3389/fdgth.2024.1394901
Ding, D., Nguyen, B., Nau, T., Luo, M., Del Pozo Cruz, B., Dempsey, P. C., et al. (2025). Daily steps and health outcomes in adults: a systematic review and dose-response meta-analysis. Lancet Public Health 10, e668–e681. doi: 10.1016/S2468-2667(25)00164-1
Du, J., Jiang, Y., Lloyd, C., Sartorius, N., Ren, J., Zhao, W., et al. (2023). Validation of Chinese version of the 5-item who well-being index in type 2 diabetes mellitus patients. BMC Psychiatry 23:890. doi: 10.1186/s12888-023-05381-9
Fung, S. F., Kong, C. Y. W., Liu, Y. M., Huang, Q., Xiong, Z., Jiang, Z., et al. (2022). Validity and psychometric evaluation of the Chinese version of the 5-item who well-being index. Front. Public Health 10:872436. doi: 10.3389/fpubh.2022.872436
Guo, S., Sun, W., Liu, C., and Wu, S. (2016). Structural validity of the Pittsburgh sleep quality index in Chinese undergraduate students. Front. Psychol. 7:1126. doi: 10.3389/fpsyg.2016.01126
Halson, S. L. (2014). Sleep in elite athletes and nutritional interventions to enhance sleep. Sports Med. 44, S13–S23. doi: 10.1007/s40279-014-0147-0
Haruna, U., Mohammed, A.-R., and Braimah, M. (2025). Understanding the burden of depression, anxiety and stress among first-year undergraduate students. BMC Psychiatry 25:632. doi: 10.1186/s12888-025-07069-8
Inoue, K., Tsugawa, Y., Mayeda, E. R., and Ritz, B. (2023). Association of Daily Step Patterns with Mortality in us adults. JAMA Netw. Open 6, –e235174. doi: 10.1001/jamanetworkopen.2023.5174
Jeong, G. C., Kim, K., and Kim, B. (2024). Differences in perceived stress, subjective well-being, and psychosocial variables by game use type. Behav Sci (Basel) 14:1178. doi: 10.3390/bs14121178
Kliem, S., Lohmann, A., Fischer, S., Baier, D., Clemens, V., Sachser, C., et al. (2025). Psychometric evaluation and updated community norms of the Who-5 well-being index, based on a representative German sample. Front. Psychol. 16:1592614. doi: 10.3389/fpsyg.2025.1592614
Li, C., Ning, G., and Xia, Y. (2023). Does exercise participation promote happiness?: mediations and heterogeneities. Front. Public Health 11:1033157. doi: 10.3389/fpubh.2023.1033157
Meeusen, R., Duclos, M., Foster, C., Fry, A., Gleeson, M., Nieman, D., et al. (2013). Prevention, diagnosis, and treatment of the overtraining syndrome: joint consensus statement of the European College of Sport Science and the American College of Sports Medicine. Med. Sci. Sports Exerc. 45, 186–205. doi: 10.1249/MSS.0b013e318279a10a
Mei, L., He, Z., and Hu, L. (2024). Accuracy of the Huawei Gt2 smartwatch for measuring physical activity and sleep among adults during daily life: instrument validation study. Jmir Form Res 8:e59521. doi: 10.2196/59521
Muggeo, V. M. (2003). Estimating regression models with unknown break-points. Stat. Med. 22, 3055–3071. doi: 10.1002/sim.1545
Patria, B. (2022). Modeling the effects of physical activity, education, health, and subjective wealth on happiness based on Indonesian national survey data. BMC Public Health 22:959. doi: 10.1186/s12889-022-13371-x
Pérez-Jorge, D., Boutaba-Alehyan, M., González-Contreras, A. I., and Pérez-Pérez, I. (2025). Examining the effects of academic stress on student well-being in higher education. Humanit. Soc. Sci. Commun. 12:449. doi: 10.1057/s41599-025-04698-y
Pope, Z. C., Barr-Anderson, D. J., Lewis, B. A., Pereira, M. A., and Gao, Z. (2019). Use of wearable technology and social media to improve physical activity and dietary behaviors among college students: a 12-week randomized pilot study. Int. J. Environ. Res. Public Health 16:579. doi: 10.3390/ijerph16193579
Schuster, N. A., Rijnhart, J. J. M., Twisk, J. W. R., and Heymans, M. W. (2022). Modeling non-linear relationships in epidemiological data: the application and interpretation of spline models. Front Epidemiol 2:975380. doi: 10.3389/fepid.2022.975380
She, Z., Li, D., Zhang, W., Zhou, N., Xi, J., and Ju, K. (2021). Three versions of the perceived stress scale: psychometric evaluation in a nationally representative sample of Chinese adults during the Covid-19 pandemic. Int. J. Environ. Res. Public Health 18:312. doi: 10.3390/ijerph18168312
Shimura, A., Masuya, J., Yokoi, K., Morishita, C., Kikkawa, M., Nakajima, K., et al. (2022). Too much is too little: estimating the optimal physical activity level for a healthy mental state. Front. Psychol. 13:1044988. doi: 10.3389/fpsyg.2022.1044988
Stutz, J., Eiholzer, R., and Spengler, C. M. (2019). Effects of evening exercise on sleep in healthy participants: a systematic review and Meta-analysis. Sports Med. 49, 269–287. doi: 10.1007/s40279-018-1015-0
Su, P., and He, M. (2023). Relationship between sleep quality and subjective well-being: resilience as a mediator and belief in a just world as a moderator. Front. Psych. 14:1297256. doi: 10.3389/fpsyt.2023.1297256
Wang, S., Huang, Y., Si, X., Zhang, H., Zhai, M., Fan, H., et al. (2025). The impact of tai chi on emotional regulation efficacy and subjective wellbeing in the elderly and the mediating mechanism. Front. Psychol. 16:1550174. doi: 10.3389/fpsyg.2025.1550174
Wang, B., Zhao, H., Shen, H., and Jiang, Y. (2023). Socioeconomic status and subjective well-being: the mediating role of class identity and social activities. PLoS One 18:e0291325. doi: 10.1371/journal.pone.0291325
Weinstein, A. A., Van Aert, R. C. M., Donovan, K., Muskens, L., and Kop, W. J. (2024). Affective responses to acute exercise: a meta-analysis of the potential beneficial effects of a single bout of exercise on general mood, anxiety, and depressive symptoms. Psychosom. Med. 86, 486–497. doi: 10.1097/PSY.0000000000001321
Keywords: subjective wellbeing, daily step count, dose–response, non-linear association, university students, sleep quality, perceived stress
Citation: Zhang H, Wang S, Huang Y, Xiu L and Wang Y (2025) Inverted-U association between daily steps and WHO-5 in university students: non-linear modeling and robustness checks. Front. Behav. Neurosci. 19:1693386. doi: 10.3389/fnbeh.2025.1693386
Edited by:
Roberta Monterazzo Cysneiros, Independent Researcher, São Paulo, BrazilCopyright © 2025 Zhang, Wang, Huang, Xiu and Wang. This is an open-access article distributed under the terms of the Creative Commons Attribution License (CC BY). The use, distribution or reproduction in other forums is permitted, provided the original author(s) and the copyright owner(s) are credited and that the original publication in this journal is cited, in accordance with accepted academic practice. No use, distribution or reproduction is permitted which does not comply with these terms.
*Correspondence: Yan Wang, aGFpemhpeGlueWFueWFuQDEyNi5jb20=