 Lucas Wise1
 Sabrina Marecos2†
 Katie Randolph2†Mohamed Hassan2
 Eric Nshimyumukiza2
 Jacob Strouse2Farshid Salimijazi2
 Buz Barstow2*
- 1Department of Food Sciences, Cornell University, Ithaca, NY, United States
- 2Department of Biological and Environmental Engineering, Cornell University, Ithaca, NY, United States
Global consumption of protein is projected to double by the middle of the 21st century. However, protein production is one of the most energy intensive and environmentally damaging parts of the food supply system today. Electromicrobial production technologies that combine renewable electricity and CO2-fixing microbial metabolism could dramatically increase the energy efficiency of commodity chemical production. Here we present a molecular-scale model that sets an upper limit on the performance of any organism performing electromicrobial protein production. We show that engineered microbes that fix CO2 and N2 using reducing equivalents produced by H2-oxidation or extracellular electron uptake could produce amino acids with energy inputs as low as 64 MJ kg−1, approximately one order of magnitude higher than any previous estimate of the efficiency of electromicrobial protein production. This work provides a roadmap for development of engineered microbes that could significantly expand access to proteins produced with a low environmental footprint.
Introduction
Current Methods of Protein Production Are Environmentally Damaging
Current food consumption and farming practices produce a large amount of environmental strain. In particular, the production of livestock for protein leads to significant waste accumulation and energy expenditure (McClements, 2019). The agricultural and food production sectors are responsible for ≈30% of greenhouse gas emissions, while livestock farming alone accounts for 18% of emissions (González et al., 2011). Furthermore, the agricultural industry is responsible for 70% of total freshwater consumption (Heinke et al., 2020). 42% of freshwater consumption is attributed to livestock production alone (Heinke et al., 2020). But, increased consumption of protein is one of the best ways to improve human, particularly infant, health and productivity in many parts of the world today (Ghosh et al., 2012).
The energy and water consumption of livestock farming will only increase as global appetites increase (Porritt and McCarthy, 2017). First, population will grow to ≈11 billion by 2050 (Prosekov and Ivanova, 2018). Second, the consumption of food, particularly protein, by each individual will also grow thanks to an expected average annual economic growth rate of 3% from 2014 to 2050 (Tilman et al., 2011; Hawksworth and Chan, 2015). Supplying this increased demand while maintaining the current agricultural areal footprint is expected to require a 75% increase in agricultural productivity (Prosekov and Ivanova, 2018).
Should agricultural production efficiencies remain stagnant, satisfying the food demands of the world’s growing and increasingly wealthy population with protein will require massive deforestation (Audsley et al., 2010; Tuomisto and Teixeira de Mattos, 2011). Deforestation could eradicate thousands of species and produce large quantities of greenhouse gases, leading to temperature increases exceeding the 2°C warming threshold established by the Paris Climate Agreement, even when ignoring emissions from all other human activity (Voegele and Nelson, 2019).
Incremental improvements in current food production technologies may not meet future demand and sustainability goals. Current approaches to increasing protein production include advanced livestock breeding, and substitution of livestock protein for insect- and plant-based substitutes. However, all of these approaches depend upon increases in crop yields. But, 78% of the world’s land has natural limitations for agricultural development (Prosekov and Ivanova, 2018), and significant doubts remain about the possibility of increasing crop yields by mid-century (Tilman et al., 2011; Slade et al., 2014; Poore and Nemecek, 2018). Furthermore, increasing water scarcity due to climate change could even depress crop yields in the decades ahead (Slade et al., 2014).
Autotrophic Metabolism Could Increase the Efficiency of Protein Production
Autotrophic microbial production of protein is a promising alternative strategy to conventional food production (Ritala et al., 2017; Sillman et al., 2019; Mishra et al., 2020; Leger et al., 2021). In this class of schemes, externally supplied reducing equivalents are used to power microbial N2 and CO2-fixing metabolism and synthesis of protein molecules (Gleizer et al., 2020; Hu et al., 2020).
In most systems studied to date, reducing equivalents are supplied by H2− or methane-oxidation. CO2-fixation is performed by Calvin-Benson-Bassham cycle, the reverse Krebs cycle or the Wood-Ljungdahl pathway.
Autotrophically produced protein has at least two important advantages over traditional protein production methods. Secondly, autotrophic protein production does not depend on the availability of arable land and can be run in a closed system. This greatly reduces water and land consumption and inhibits nitrogen runoff to surrounding environments (Sillman et al., 2019; Nyyssölä et al., 2021). Finally, autotrophic microorganisms can use atmospheric N2 as a substrate, eliminating the need for thermochemical N2-fixation (Bothe et al., 2010).
The cost of autotrophic protein production is dropping rapidly. The cost of production of a single protein has reduced from $1 × 10⁶ kg−1 in 2000 to ≈ $100 kg−1 in 2019 (Tubb and Seba, 2021). It is projected that the cost of production of a single protein could drop to below $10 kg−1 by 2025, thereby achieving price parity with animal-based protein products (Tubb and Seba, 2021).
Theoretical analysis suggests that autotrophic protein production could far exceed the efficiency of plant-based protein. Recent analyses of the performance of electromicrobial production of biofuels (Claassens et al., 2019; Salimijazi et al., 2019; Salimijazi et al., 2020), where electrically-supplied reducing equivalents are used to power CO2 fixation or formic acid assimilation and biofuel, show that these types of schemes could dramatically exceed the efficiency of photosynthetic biofuel production. These results imply that if N2 fixation were added to these systems, proteins could also be produced at efficiencies exceeding that of photosynthesis. Recent results by Leger et al. (2021) suggest photovoltaic-driven EMP of protein could exceed efficiency of real-world photosynthetic production of protein by at least 2 orders of magnitude.
However, up until now, very few attempts have been made at calculating the upper limit efficiency of EMP amino acid or protein production. This paper presents a model and analyzes the theoretical maximum energetic efficiency for a system of autotrophic microorganisms, fixing CO2 and N2 using electrons delivered by either extracellular electron uptake (EEU) (Rowe et al., 2021) or by H2-oxidation (Liu et al., 2016). These calculations do not predict the performance of any naturally-occurring organism, but do predict an upper limit efficiency for any natural or synthetic organism using these reactions.
Theory, Results and Discussion
Theory
We extended our theoretical framework for calculating the efficiency of electromicrobial production (EMP) of biofuels to calculate the efficiency of amino acid production from electrons, CO2 and N2 (Salimijazi et al., 2020). A full set of model parameters and associated values used in this article are shown in Table 1, and a full set of symbols for this article are shown in Supplementary Table S1.
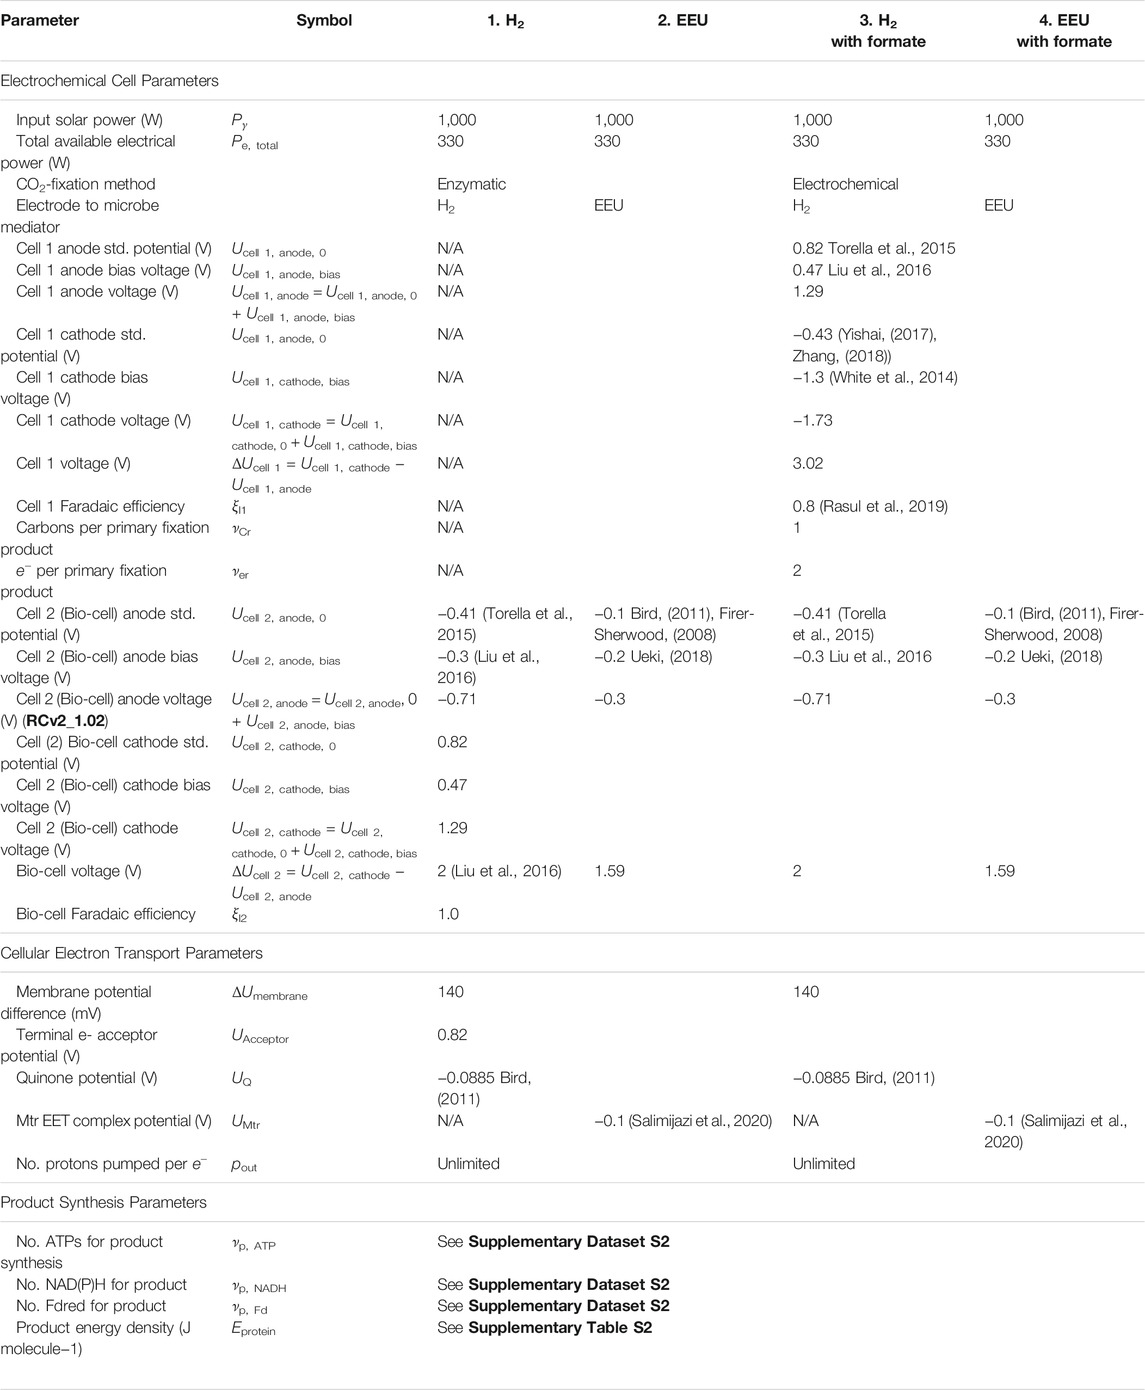
TABLE 1. Electromicrobial protein production model parameters. Model parameters used in this article are based upon model parameters used in a previous analysis of the electromicrobial production of the biofuel butanol (Salimijazi et al., 2020). A sensitivity analysis was performed for all key parameters in this work (Salimijazi et al., 2020). A complete list of symbols used in this work (including symbols for outputs, and intermediate variables) is included in Supplementary Table S1.
We consider a bio-electrochemical system used to deliver electrons to microbial metabolism (Figures 1A,B). Electrical power is used to generate amino acid (or protein) molecules with an energy per molecule Eprotein at a rate Ṅprotein. Even though this article strictly considers amino acid synthesis, this can be considered equivalent to protein production from an energetic standpoint as no energy is expended in forming the peptide bond needed to polymerize amino acids. We choose to use the subscript protein rather than AA to avoid confusion with the Avogadro constant, NA. Energy per molecule and molecular weight for each amino acid are shown in Supplementary Table S2. Full derivations of the equations presented here can be found in the supplement to our original electromicrobial production efficiency theory article (Salimijazi et al., 2020), with some changes of symbols used to indicate that we are producing proteins rather than amino acids. If a change of symbol is used, it is indicated in Supplementary Table S1. In our original article (Salimijazi et al., 2020) we focused purely on electrical (or solar) energy to chemical energy (fuel, or on this case protein) conversion efficiency, but in this article we expand our theory to calculate the energy (electrical or solar) costs of producing a gram of product (CEP and CSP, respectively).
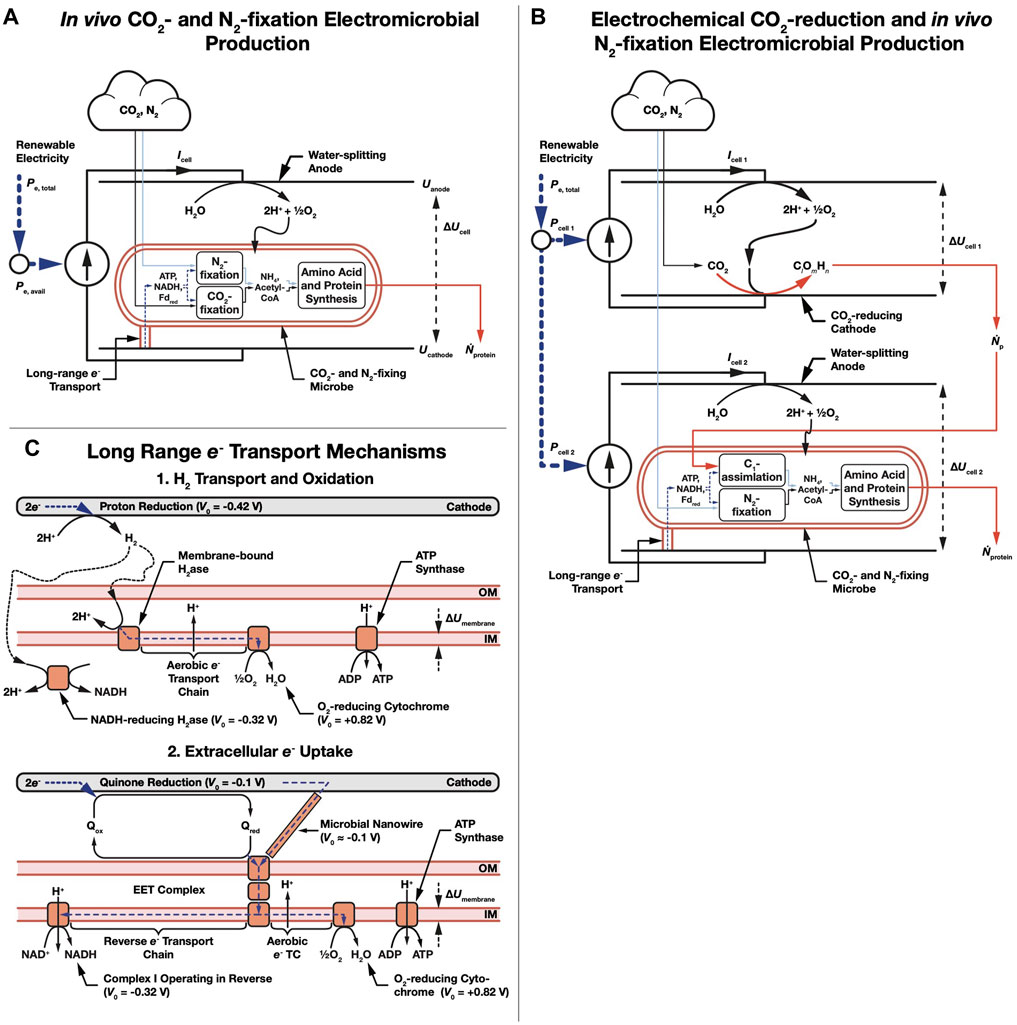
FIGURE 1. Schematic of amino acid electromicrobial production systems. (A) Single bio-electrochemical cell system where electricity is used to power in vivo CO2- and N2-fixation. (B) Dual electrochemical cell system where CO2 is reduced in the first cell, and then assimilated in the second cell, and combined with enzymatically fixed N2. (C) Long range e- transfer mechanisms considered in this article. In the first, H2 is electrochemically reduced on a cathode, transferred to the microbe by diffusion or stirring, and is enzymatically oxidized. In the second mechanism, extracellular electron uptake (EEU), e- are transferred along a microbial nanowire (part of a conductive biofilm), or by a reduced medium potential redox shuttle like a quinone or flavin, and are received at the cell surface by the extracellular electron transfer (EET) complex. From the thermodynamic perspective considered in this article, these mechanisms are equivalent. Electrons are then transported to the inner membrane where reverse electron transport is used to regenerate NAD(P)H, reduced Ferredoxin (not shown), and ATP (Rowe et al., 2018; Rowe et al., 2021). Note that we use the American and British classical current convention where current flows from positive to negative.
The energy conversion efficiency of the system from electricity to amino acids (or protein) is calculated from the ratio of the amount of chemical energy stored per second (Ṅprotein Eprotein), relative to the power input to the system, Pe,total (Salimijazi et al., 2020) (basically power out to power in),
The total mass of protein produced per second by the system is,
where Mprotein is the molecular weight of the protein molecule.
The energy cost to produce a unit mass of protein,
Thus, if both the chemical energy per protein molecule and the molecular weight are known (they are for proteins), energy conversion efficiency and energy cost can be easily interconverted,
thus,
For a single bio-electrochemical cell system where CO2- and N2- fixation are performed in vivo (Figure 1A), the upper limit electrical to chemical conversion efficiency of the system is set by the energy density of an amino acid molecule relative to the amount of charge needed to synthesize it from CO2 and N2 (the fundamental charge, e, multiplied by the number of electrons needed for synthesis, νep) and the potential difference across the bio-electrochemical cell, ΔUcell,
Thus, the amount of electricity needed to produce a unit-mass of the protein is,
A full derivation of Eqs 1, 6 in this article can be found in Section 1 (Eqs 1−9) in the supplement of Salimijazi et al. (2020).
We also consider systems CO2 reduction is performed electrochemically, and the resulting reduction product (typically a C1 compound like formic acid) (White et al., 2014; White et al., 2015; Appel et al., 2013) is further reduced enzymatically (Figure 1B). While a C1 compound like formic acid is lightly reduced (e.g., 2 e− per carbon for formic acid), carbohydrates, biofuels, a protein molecules are more heavily reduced (4–6 e− per carbon). Thus, while formic acid can supply all of the carbon and some of the electrons needed to make a protein, it cannot supply all of the electrons, and these need to be supplied by EEU or H2-oxidation. In these cases, νep is substituted for the number of additional electrons needed to convert the C1 product into the final protein product, νe,add (Salimijazi et al., 2020),
where νr is the number of primary reduction products (i.e., formic acid molecules) needed to synthesize a molecule of the final product, νer is the number of electrons needed to reduce CO2 to a primary reduction product (i.e., 2 in the case of formic acid), νCr is the number of carbon atoms per primary fixation product (i.e., 1 in the case of formic acid), ξI2 is the Faradaic efficiency of the bio-electrochemical cell, ξI1 is the Faradaic efficiency of the primary abiotic cell 1, ξC is the carbon transfer efficiency from cell 1 to cell 2. A full derivation of Eq. 8 can be found in Section 10 (Equations 101–118) of the supplement of Salimijazi et al. (2020).
Thus, using Eq. 4, the amount of electricity needed to produce a unit-mass of the protein when using electrochemical CO2-reduction is,
We calculate the electron requirements, νep or νe,add, for amino acid (or protein) synthesis from the number of NAD(P)H (νp,NADH) reduced Ferredoxin (Fdred; νp,Fd) and ATP (νp,ATP) molecules needed for the synthesis of the molecule, along with a model of the mechanism used for electron delivery to the microbe (Salimijazi et al., 2020).
The key part of our electromicrobial production efficiency theory (Salimijazi et al., 2020) answers the question: how efficiently can energy carried by H2 or by EEU be transferred into the intracellular reductants needed for metabolism (ATP, NAD(P)H, and Ferredoxin) by use of the inner membrane proton gradient. In the case of both H2-oxidation (autotrophic growth of Ralstonia eutropha, the organism used in the Bionic Leaf (Liu et al., 2016), typically uses an atmospheric ratio of 8:1:1 H2:O2:CO2 (Brigham et al., 2013)) and EEU (Rowe et al., 2018; Salimijazi et al., 2020; Rowe et al., 2021) mediated electromicrobial production, a micro-aerobic atmosphere needs to be maintained in the cathode chamber. The O2 concentration in the cathode chamber needs to be just high enough to provide a terminal electron acceptor capable of generating the most proton motive force per electron input into the system, yet low enough to not be reduced by the cathode to H2O and short-circuit the electrochemical system. It is notable that both the anode and cathode in the Bionic Leaf exist in the same reaction chamber suggesting that a small amount of O2 is constantly present. Despite this, the energy efficiency (and by extension Faradaic efficiency) is remarkably high (Liu et al., 2016) (RCv2_1.01).
For systems that rely upon H2-oxidation for electron delivery like the Bionic Leaf (Torella et al., 2015; Liu et al., 2016; Salimijazi et al., 2020) (Figure 1C, part 1), the number of electrons needed to synthesize one amino acid molecule is,
where ΔGATP/ADP is the free energy required for regeneration of ATP, ΔUmembrane is the potential difference across the cell’s inner membrane due to the proton gradient, UH2 is the standard potential of proton reduction to H2, Uacceptor is the standard potential of terminal electron acceptor reduction (typically O2 + 2e− to H2O), the ceil function rounds up the nearest integer, and the floor function rounds down to the nearest integer. A full derivation of Eq. (10) can be found in Section 2 (Equations 10 to 20) of the supplement for Salimijazi et al. (2020).
The first and second terms in Eq. 10 describe the number of electrons needed to regenerate the NAD(P)H and Ferredoxin needed for amino acid synthesis. As the redox potential of H2 is above those of both NADH and Ferredoxin and both molecules require two electrons to be regenerated, two electrons can be transferred directly from H2-oxidation. Thus, the number of electrons needed for NAD(P)H regeneration is just double the number of NAD(P)H and Ferredoxin needed for synthesis of the amino acid.
The final term in Eq. 10 calculates the number of electrons needed to regenerate the ATP needed for amino acid synthesis. ATP regeneration involves energy transfer from the incoming electrons to ATP, and charge transfer to O2. The numerator in the final term of Eq. 10 calculates the number of protons that need to be pumped through the ATP synthase in order to regenerate 1 ATP: the energy needed to regenerate 1 ATP divided by the energy recovered by pumping one proton from the periplasmic side of the inner membrane to the cytoplasmic side. As only integral numbers of protons can be pumped, the ceil function rounds up the result. The denominator in the final term of Eq. 10 calculates how many protons can be pumped from the cytoplasmic side of the membrane to the by sending 1 electron downhill from H2 to the acceptor (O2/H2O). Again, as only integral numbers of protons can be pumped, the floor function rounds down.
The appearance of ΔUmembrane in the numerator and denominator of Eq. 10 is required because the ceil and floor functions are numerical (not analytical) and require their arguments to be numerically evaluated before the result can be used in a larger calculation. This is initially counter-intuitive, but captures the core of the unavoidable energy losses imposed by using proton pumping to transduce energy. To illustrate this, consider this example: the result of 7/2 divided by 5/2 is just 7/5 or 1.4 (the twos in the denominators of both terms cancel). However, the result of ceil (7/2) divided by floor (5/2) is different: ceil (7/2) is ceil (3.5) or 4, while floor (5/2) is floor (2.5) or 2. Thus ceil (7/2) divided by floor (5/2) is 2.0, 43% higher than the result of 7/5.
The inner membrane potential difference, ΔUmembrane, is the largest source of uncertainty in this calculation. Therefore, we present a range of efficiency estimates in Figures 2, 3 and throughout the text for ΔUmembrane = 80 mV (BioNumber ID (BNID) 10408284 (Milo et al., 2010)) to 270 mV (BNID 107135), with a central value of 140 mV (BNIDs 109774, 103386, and 109775).
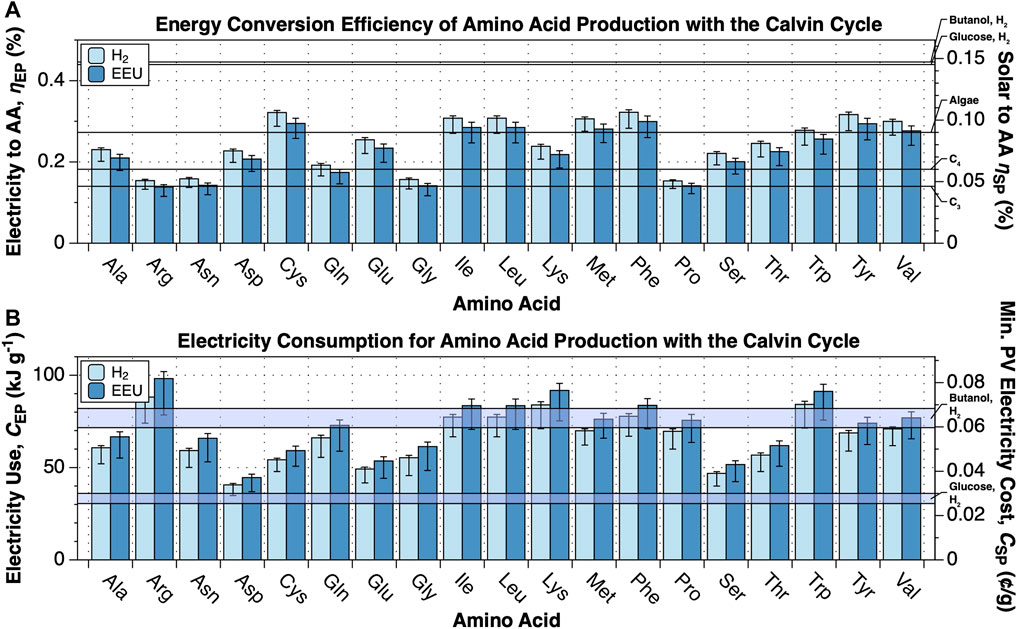
FIGURE 2. Energy conversion efficiency and energy cost of amino acid production. The upper limit energy conversion efficiency and minimum energy cost of amino acid production from CO2, N2 and electricity by electromicrobial production systems using the Calvin cycle for CO2-fixation and either H2-oxidation or extracellular electron uptake (EEU) were calculated for 19 dietary amino acids (all except histidine) with the electrofoods package (Barstow, 2021). NADH, Fdred, and ATP requirements for synthesis of each amino acid are tabulated in Supplementary Dataset S2. This plot can be reproduced using the fig-cbb_n2_to_amino_acids.py program in the electrofoods package (Barstow, 2021). (A) Upper limit electrical and solar energy conversion efficiency for amino acids. The left axis shows the electricity to amino acid energy conversion efficiency, while the right axis shows the solar to amino acid conversion efficiency, assuming the system is supplied by a perfectly efficient single-junction Si solar photovoltaic (solar to electrical efficiency of 32.9% (Nelson, 2003)). As a first point of comparison, the upper limit solar to biomass energy conversion efficiencies of C3, C4 (Zhu et al., 2008; Zhu et al., 2010), and algal photosynthesis (Wijffels and Barbosa, 2010) are marked on the right axis. As a second point of comparison, we have also marked the projected upper limit solar to butanol (Salimijazi et al., 2020) and glucose (calculated here) conversion efficiencies by an electromicrobial production system using H2-oxidation and the Calvin cycle. (B) Minimum electrical and solar energy costs for the production of a gram of amino acids. The left axis shows the minimum electricity cost, while the right axis shows the minimum cost of that solar electricity, assuming that the United States Department of Energy’s cost target of 3 ¢ per kWh by 2030 can be achieved (United States Department of Energy, 2016).
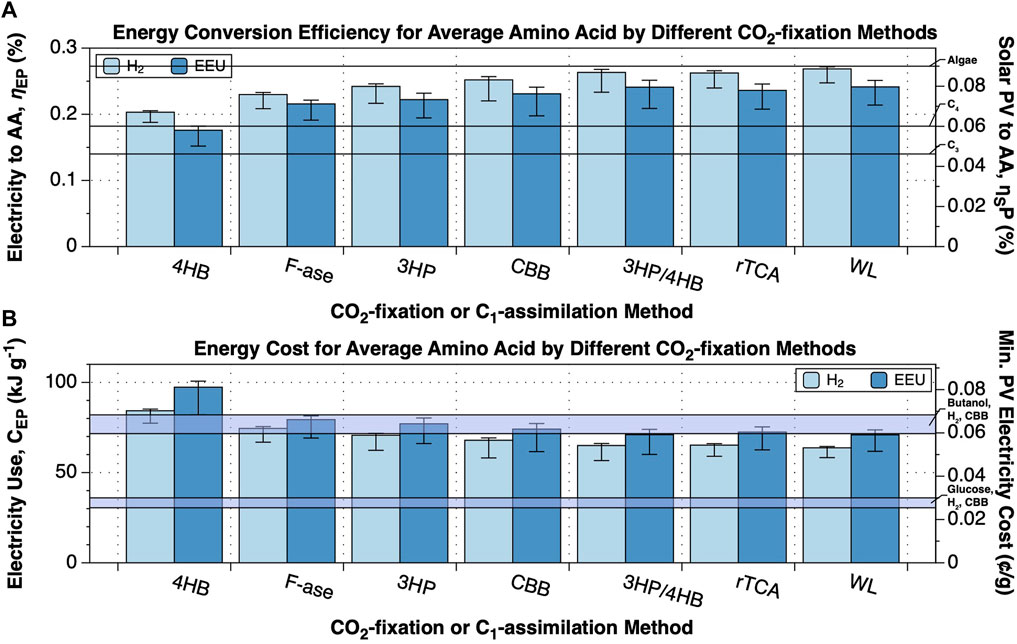
FIGURE 3. Changing CO2-fixation method can improve the performance of amino acid synthesis. The upper limit energy conversion efficiency and minimum energy cost of production of an average amino acid from CO2 or HCOO-, N2 and electricity by electromicrobial production systems using either H2-oxidation or extracellular electron uptake (EEU) and one of the 6 naturally-occurring CO2-fixation pathways or the synthetic Formolase formate assimilation pathway were calculated with the electrofoods package (Barstow, 2021). NADH, Fdred, and ATP requirements for synthesis of an average amino acid are tabulated in Supplementary Dataset S2. This plot can be reproduced using the fig-cbb_n2_to_amino_acids.py program in the electrofoods package (Barstow, 2021). 3HP, 3-hydroxypropionate cycle; 3HP-4HB, 3-hydroxypropionate/4-hydroxybutyate cycle; 4HB, 4-hydroxybutyate cycle; CBB, Calvin-Bensson-Bassham cycle; Form, Formolase pathway; rTCA, reductive TCA cycle; WL, Wood-Ljungdahl pathway. (A) Upper limit electrical and solar energy conversion efficiency for an average amino acid. The left axis shows the electricity to amino acid energy conversion efficiency, while the right axis shows the solar to amino acid conversion efficiency, assuming the system is supplied by a perfectly efficient single-junction Si solar photovoltaic (solar to electrical efficiency of 32.9% (Nelson, 2003)). (B) Minimum electrical and solar energy costs for the production of a gram of an average amino acid. The left axis shows the minimum electricity cost, while the right axis shows the minimum cost of that solar electricity, assuming that the United States Department of Energy’s cost target of 3 ¢ per kWh by 2030 can be achieved (United States Department of Energy, 2016).
For systems that rely upon EEU for electron delivery like Shewanella oneidensis (Salimijazi et al., 2020; Rowe et al., 2021) (Figure 1C, part 2),
where UQ is the redox potential of the inner membrane electron carrier, thought to be ubiquinone (Rowe et al., 2018), UNADH is the standard potential of NAD(P)H, and UFd is the standard potential of Ferredoxin. A full derivation of Eq. (11) can be found in Section 7 (Equations 77–91) of the supplement for Salimijazi et al. (2020).
Understanding the division of electron flow between proton motive force generation and electron carrier reduction within the EMP organism will allow us to estimate how low the O2 concentration can be driven.
The overall anode and cathode reactions for H2 evolution,
Thus for every two H2 molecules that are generated, one O2 molecule is also generated.
Likewise, for an EEU-mediated system,
How much of this O2 is actually needed by the microbe in order to use the H2 to generate protein molecules? The redox reaction carried out by complex IV, the terminal oxidase in the aerobic electron transport chain reduces O2 to water and transports (in net) 4 protons to the periplasmic (p) side of the inner membrane from the cytoplasm (cyt),
Thus, one O2 molecule is consumed for every 4 electrons sent downhill in energy. Therefore, (from Eq. 10), the number of O2 molecules needed for H2-mediated EMP is just 1/4 of the number of electrons used to generate the proton motive force needed regenerate ATP,
Likewise, for EEU-mediated EMP, the number of O2 molecules needed is 1/4 of the number electrons used to generate the proton motive force needed to regenerate ATP, NAD(P)H and Ferredoxin (but not directly reduce NAD (PH) or Ferredoxin) (from Eq. 11),
The results of Eqs 13–17 are computed by the cbb_glycine_O2.py code in the electrofoods package (RCv2_1.01).
The NAD(P)H, ATP and Fdred requirements for amino acid synthesis were calculated by balancing networks of reactions for the autotrophic synthesis of the molecule from N2 and CO2 or N2 and formate (COOH−). We enumerated all reaction steps for the production of 19 of the 20 dietary amino acids from acetyl-CoA and NH4 using data from the KEGG database in Supplementary Dataset S3 (Kanehisa and Goto, 2000; Kanehisa, 2019; Kanehisa et al., 2020). Synthesis of histidine was excluded from these calculations because of technical challenges with stoichiometric balancing due to its inseparable connection with purine synthesis. As a comparison point, and to validate our approach, we also consider the synthesis of glucose.
Amino acid synthesis reactions were complemented with reactions for CO2-fixation, C1-assimilation, and N2 fixation (Supplementary Table S3). For this article we considered 6 scenarios in which CO2 was fixed by the well-known Calvin cycle (Berg et al., 2002), the Reductive Tricarboxylic Acid cycle (Alissandratos and Easton, 2015; Claassens et al., 2016), Wood-Ljungdahl (WL) Pathway (Berg et al., 2002); the 3-hydroxypropionate/4-hydroxybutyrate (3HP-4HB) Pathway (Berg et al., 2007; Claassens et al., 2016); 3-hydroxypropionate (3HP) Cycle (Zarzycki et al., 2009); and the Dicarboxylate/4-hydroxybutyrate (4HB) Cycle (Huber et al., 2008). In addition, we also considered the artificial Formolase formate assimilation pathway (Siegel et al., 2015). Finally, in all scenarios, N2 was fixed into metabolism by the iron-molybdenum (FeMo) nitrogenase (Kyoto Encyclopaedia of Genes and Genomes (KEGG) reaction R05185 (Bothe et al., 2010; Hu et al., 2020; Nyyssölä et al., 2021).
The overall stoichiometry of autotrophic amino acid synthesis was calculated by a custom flux balance code. Amino acid synthesis reactions (Supplementary Dataset S1) were combined automatically with the CO2-fixation, C1-assimilation, and N2 fixation reactions (Supplementary Table S3) by a custom code (Barstow, 2021) into a set of stoichiometric matrices, Sp, for each reaction network.
Each automatically generated stoichiometric matrix was balanced with a custom flux balance program (Barstow, 2021) to find the overall number of NAD(P)H, Fdred, and ATP needed for synthesis of each amino acid using each CO2-fixation or C1-assimilation pathway.
We consider a species number rate of change vector, ṅ, that encodes the rate of change of number of the reactant molecules over a single cycle of the reaction network; a stoichiometric matrix Sp that encodes the number of reactants made or consumed in every reaction in the network; and a flux vector v that encodes the number of times each reaction is used in the network. Reactant molecules are denoted as inputs (e.g., CO2, N2, COOH−, ATP, NAD(P)H), outputs (e.g., H2O), intermediates, or the target molecule (e.g., the amino acid to be synthesized). For the purposes of this thermodynamic analysis, we consider NADH and NADPH to be equivalent as they have near identical redox potentials.
The reactant number vector elements for the inputs were calculated by numerically solving the flux balance equation,
under the constraint that number of each intermediate does not change over a reaction cycle, and that number of target molecules increases by 1,
The balanced overall stoichiometry for synthesis of each amino acid is shown in Supplementary Dataset S2.
The number of electrons needed to synthesize an average amino acid was found by calculating the average number of NAD(P)H, Fdred, and ATP needed for synthesizing 19 of the 20 amino acids.
Results and Discussion
Electromicrobial Production of Amino Acids and Protein
The electrical and solar energy to protein conversion efficiency (ηEP and ηSP) and the electrical energy consumption per unit mass (CEP) and cost of solar electricity per unit mass (CSP) for the production of 19 amino acids was calculated for electron uptake by H2 transport and oxidation and EEU, and CO2 fixation by the Calvin cycle (Figure 2).
Amino acid synthesis has a lower conversion efficiency than purely carbon-containing products due to the high Fdred and ATP requirements of N2-fixation (Supplementary Dataset S1). Despite this, the conversion efficiency either matches, and in most cases exceeds the theoretical maximum conversion efficiency of sunlight to carbohydrate biomass by C3 photosynthesis (Figure 2A). However, Arg, Asn, Gly, and Pro synthesis by H2 and EEU, and Gln synthesis by EEU have lower conversion efficiencies than C4 carbohydrate photosynthesis (Zhu et al., 2008; Zhu et al., 2010). Synthesis of Cys, Ile, Leu, Met, Phe, Tyr and Val exceed the theoretical efficiency of algal photosynthesis (Wijffels and Barbosa, 2010). The average CO2, N2, and electricity conversion efficiency for an average amino acid using the Calvin cycle is
The electrical energy costs (CEP) for individual amino acids using H2-oxidation an the Calvin cycle range from
As noted before, the energy conversion efficiency of systems using EEU is consistently a few percentage points lower than for systems using H2 oxidation (Salimijazi et al., 2020) (Figure 2A). In EEU based systems there is a higher electron requirement, and hence cell current, needed for regeneration of NAD(P)H, Fdred and ATP. Practically, this is almost offset by a lower minimum cell voltage, resulting in a slightly lower conversion efficiency (Salimijazi et al., 2020). Averaged across all amino acids, the efficiency of synthesis for systems using EEU and the Calvin cycle is
Can we increase the efficiency of electromicrobial production of amino acids? As we have examined before (Salimijazi et al., 2020), we can improve efficiency by swapping the Calvin cycle for the an alternative CO2 fixation cycle (Figure 3). As an aside, the only alternative N2-fixation pathway uses the iron-vanadium nitrogenase, that requires 40 ATP and 12 Fdred for each N2 fixed (KEGG reaction R12084), compared with 16 ATP and 8 Fdred for the more common iron-molybdenum-cobalt nitrogenase (KEGG reaction R05185).
Not unexpecetedly, the order of efficiency of amino acid synthesis efficiency is approximately the same as the order of efficiency of butanol synthesis. As before (Salimijazi et al., 2020), the 4HB cycle, which performed least well for butanol synthesis (Salimijazi et al., 2020), also performed least well for amino acid synthesis. Likewise, the Wood-Ljungdahl pathway performed the best (Figure 3A).
With increasing efficiency comes decreasing electricity cost (Figure 3B). The average cost of producing a gram of amino acid with H2-4HB is
Oxygen Requirements of Electromicrobial Protein Production Are Low
Using Eqs 13–17 and the cbb_glycine_O2.py code in the electrofoods package, we find that under nominal conditions (ΔUmembrane = 140 mV), for an H2-mediated system using the Calvin cycle, 21.5 e− are needed to synthesize 1 molecule of glycine (supplied by 10.75 H2 molecules, or put better, 43 molecules of H2 are used to generate 4 glycine molecules). Generating 10.75 molecules of H2 by water-splitting co-generates 5.375 molecules of O2. However, only 1.875 molecules of O2 are actually needed to generate the ATP needed for glycine synthesis. Thus, almost 2/3rds of the O2 generated by water-splitting can be purged from the system to minimize cathode side-reactions.
Likewise, for an EEU-mediated system using the Calvin cycle, 30 e− are needed to generate glycine, releasing 7.5 O2 molecules. However, only 4 O2 molecules are actually consumed in generating proton motive force. Thus, almost half of the O2 generated by water-splitting can be purged from system to minimize cathode side-reactions (RCv2_1.01).
Electromicrobial Protein Is an Energy-Efficient Alternative to Current Protein Production Technologies
How do the upper-limit efficiencies predicted for EMP protein production compare with real world production efficiencies and energy costs? Most rigorous estimates of the total cradle-to-farm gate energy costs needed to produce a gram of beef, chicken, pork, eggs, and dairy (Williams et al., 2006); soybeans (Pimentel, 2009); insects (Van Huis et al., 2013) and cultured meat (Tuomisto and Teixeira de Mattos, 2011) consider only primary energy inputs. Estimates of primary energy input start at 44 kJ g−1 for soybeans (Pimentel, 2009) and go up to 273 kJ g−1 for beef (Williams et al., 2006) (Supplementary Table S4).
However, traditional estimates of energy input into protein production are not suitable for an apples-to-apples comparison to the numbers calculated in this article. These estimates consider the energy content of feed stocks such as grain and milk; and infrastructural costs such as transportation to the farm gate and tilling land. In the case of soy bean production, the estimates do not include the energy delivered by sunlight to the system to initially fix CO2, N2 and synthesize amino acids. Likewise, for livestock and dairy production, they do not include the energy content of the sunlight needed to produce the feed, only its final energy content.
Traditional energy input estimates of protein production are not wrong. Quite rightly, sunlight has been thought of as free of cost and global warming concerns. Furthermore, traditional analyses rightly concern themselves with necessary fossil energy inputs. However, as global agricultural production expands, the land for agriculture becomes an increasingly precious commodity. As a result, efficiency of use of sunlight becomes increasingly important.
Likewise, our analysis explicitly ignores infrastructural costs. While we would like to think that bioreactor production of protein could avoid many of these costs, simply thinking this does not make it so. We cannot say so with any certainty if the infrastructure energy costs, such as stirring, heating, gas exchange, are less than the energy inputs associated with agriculture or livestock farming needed to produce a gram of protein.
Estimates of photosynthetic cost of producing protein are the closest comparison point to our work. The closest comparison point to this work is a recent comparison of year round production of protein rich crops, and their protein content with an empirical model of electromicrobial production methods by Leger et al. (2021). The analysis by Leger et al. allows for calculation of the solar energy costs of photosynthetic production (Supplementary Table S5). Energy costs range from 47 MJ g−1 (ηSP = 0.035%) for soybeans grown in the United States to 408 MJ g−1 (ηSP = 0.004%) for maize grown in India (Supplementary Table S5).
In contrast, Leger et al. (2021) estimate an averaged sunlight to protein production efficiency of between 0.29% (minimum food production efficiency) and 0.87% (maximum feed production efficiency) using a solar PV driven Methanol-RUMP pathway. These results presented here suggest that these efficiencies, at least instantaneously could be pushed almost an order of magnitude higher.
Conclusion
In this work, we examined a fundamental, molecular-scale model of electromicrobial production of amino acids. It is important to re-state here that this calculation does not predict the performance of any naturally-occurring organism. It simply considers a set of redox transformations and enzymatic reactions, and predicts an upper limit efficiency for any natural or synthetic organism using these reactions.
Electromicrobial protein production could address many issues surrounding modern protein production including greenhouse gas emissions (Tuomisto and Teixeira de Mattos, 2011; Garnett, 2014; Smetana et al., 2015), nitrogen run-off, and land use (Carpenter, 2005; Audsley et al., 2010; Tuomisto and Teixeira de Mattos, 2011; Guo et al., 2019; Mishra et al., 2020). Recent results by Leger et al. (2021) suggest that the solar to protein conversion efficiency of agriculture could be improved by an order or magnitude by combining PV with electromicrobial production technologies.
We examined electromicrobial protein production systems that assimilate N2 using a FeMo nitrogenase reaction; assimilate carbon using one of the six known natural CO2-fixation pathways (3HP/4HB, rTCA, WL, 4HB, CBB, 3HP) pathways or assimilate formic acid with the artificial formolase pathway; and uptake electrons and energy through H2-oxidation or extracellular electron uptake. The costs of N2-fixation mean that electromicrobial protein production is likely never to be as efficient as carbohydrate electromicrobial production. But, our results suggest that they could approach it.
The least efficient system (EEU coupled with the 4HB cycle; EEU-4HB) required
What’s the best way to achieve the potential of electromicrobial protein production? All of the systems considered in this study rely upon the presence of at least a small amount (≥a few hundred ppm) O2 to generate the maximum amount of reducing equivalents from incoming electrons (Torella et al., 2015; Rowe et al., 2018; Rowe et al., 2021).
Natural options exist for carbon assimilation in high efficiency engineered EMP systems. For carbon assimilation, the Calvin cycle, 3HP cycle, and Formolase pathway can all be operated in the presence of O2. In fact, the H2-oxidizing microbe Ralstonia eutropha (the chassis organism for the Bionic Leaf which uses the Calvin cycle) fixes CO2 in the presence of at least 1% O2, while the Fe-oxidizing microbe Sideroxydans lithotrophicus ES-1 uses EEU to power CO2 fixation in a micro-aerobic environment.
However, N2-fixation poses a uniquely formidable challenge for high efficiency electromicrobial production. Over the past decade, several groups have incorporated genes for N2-fixation into E. coli and demonstrated functional N2-fixation (Temme et al., 2012; Wang et al., 2013; Li et al., 2016; Yang et al., 2018; Li and Chen, 2020; Ryu et al., 2020). But, despite tantalizing possibilities (MacKellar et al., 2016), all known nitrogenase enzymes are sensitive to O2. This creates a fundamental incompatibility between EEU and N2-fixation that needs to be solved.
Creation of an O2-tolerant nitrogenase may be a tall order for evolution. Unlike other enzymes useful in sustainable energy applications like the hydrogenase (Barstow et al., 2011), there are plenty of evolutionary pressures to drive the creation of an O2-tolerant nitrogenase. Despite plenty of demand and opportunities for an O2-tolerant nitrogenase to emerge, nature has not presented one.
To date, nature has solved the problem of operating the nitrogenase in an O2-rich environment by sequestering it. For example, root nodules in leguminous plants provide an O2-shielded environment for symbiotic N2-fixing microbes. Likewise filamentous N2-fixing cyanobacteria are able to operate the nitrogenase enzyme inside O2-impermeable differentiated cells called heterocysts while simultaneously operating oxygenic photosynthesis to generate reducing equivalents in adjacent cells (Bothe et al., 2010). A similar approach, or recent advances in compartmentalization in synthetic biology (Chen and Silver, 2012; Chen et al., 2013; Polka and Silver, 2016; Butterfield et al., 2017; Flamholz et al., 2020), give a menu of options for building a synthetic O2-resistant compartment for the nitrogenase. Achieving this goal is likely to represent a major challenge in synthetic biology.
Development of an O2-resistant compartment will also enable the implementation of highly efficient CO2-fixation pathways like the 3HP/4HB cycle, rTCA cycle and Wood-Ljungdahl pathway in synthetic organisms that simultaneously use O2 as a metabolic terminal electron acceptor.
Failure to operate enzymatic N2-fixation does not spell the end of the road for electromicrobial protein production however. Much as there has been significant development of electrochemical CO2 reduction to C1 compounds, recent developments in electrochemical N2 reduction to ammonia could be a promising complement to biological production of complex amino acids (Guo et al., 2019).
Data Availability Statement
The original contributions presented in the study are included in the article/Supplementary Material, further inquiries can be directed to the corresponding author.
All code used in calculations in this article is available at https://github.com/barstowlab/electrofoods and is archived on Zenodo at https://doi.org/doi:10.5281/zenodo.5847529.
Author Contributions
Conceptualization, LW and BB; Methodology, BB; Investigation, LW, SM, KR, JS, MH, EN, and BB; Writing - Original Draft, LW, SM, KR, and BB; Writing - Review and Editing, LW and BB; Resources, BB; Supervision, BB.
Funding
This work was supported by Cornell University startup funds (to BB), a Burroughs-Wellcome Career Award at the Scientific Interface (to BB), and United States Department of Energy Biological and Environmental Research award DE-SC0020179. KR was supported by a McNair graduate fellowship.
Conflict of Interest
The authors declare that the research was conducted in the absence of any commercial or financial relationships that could be construed as a potential conflict of interest.
Publisher’s Note
All claims expressed in this article are solely those of the authors and do not necessarily represent those of their affiliated organizations, or those of the publisher, the editors and the reviewers. Any product that may be evaluated in this article, or claim that may be made by its manufacturer, is not guaranteed or endorsed by the publisher.
Acknowledgments
We thank S. Alcaine in the Food Science Department at Cornell University for guidance. This work was supported by Cornell University startup funds, a Career Award at the Scientific Interface from the Burroughs Welcome Fund, and by United States Department of Energy Biological and Environmental Research grant DE-SC0020179 to BB.
Supplementary Material
The Supplementary Material for this article can be found online at: https://www.frontiersin.org/articles/10.3389/fbioe.2022.820384/full#supplementary-material
References
Alissandratos, A., and Easton, C. J. (2015). Biocatalysis for the Application of CO2 as a Chemical Feedstock. Beilstein J. Org. Chem. 11, 2370–2387. doi:10.3762/bjoc.11.259
Appel, A. M., Bercaw, J. E., Bocarsly, A. B., Dobbek, H., DuBois, D. L., Dupuis, M., et al. (2013). Frontiers, Opportunities, and Challenges in Biochemical and Chemical Catalysis of CO2 Fixation. Chem. Rev. 113, 6621–6658. doi:10.1021/cr300463y
Audsley, E., Angus, A., Graves, A. R., Morris, J., Murphy-Bokern, D., Pearn, K. R., et al. (2010). Food, Land and Greenhouse Gases. The Effect of Changes in UK Food Consumption on Land Requirements and Greenhouse Gas Emissions. London, United Kingdom: The Committee on Climate Change.
Barstow, B., Agapakis, C. M., Boyle, P. M., Grandl, G., Silver, P. A., and Wintermute, E. H. (2011). A Synthetic System Links FeFe-Hydrogenases to Essential E. coli Sulfur Metabolism. J. Biol. Eng. 5, 7. doi:10.1186/1754-1611-5-7
Berg, I. A., Kockelkorn, D., Buckel, W., and Fuchs, G. (2007). A 3-Hydroxypropionate/4-Hydroxybutyrate Autotrophic Carbon Dioxide Assimilation Pathway in Archaea. Science 318, 1782–1786. doi:10.1126/science.1149976
Berg, J. M., Tymoczko, J. L., and Stryer, L. (2002). Biochemistry. 5th edn. New York, NY, USA: W. H. Freeman.
Bird, L. J., Bonnefoy, V., and Newman, D. K. (2011). Bioenergetic Challenges of Microbial Iron Metabolisms Trends Microbiol. 19, 330–340. doi:10.1016/j.tim.2011.05.001
Bothe, H., Schmitz, O., Yates, M. G., and Newton, W. E. (2010). Nitrogen Fixation and Hydrogen Metabolism in Cyanobacteria. Microbiol. Mol. Biol. Rev. 74, 529–551. doi:10.1128/mmbr.00033-10
Brigham, C. J., Gai, C. S., Lu, J., Speth, D. R., Worden, R. M., and Sinskey, A. J. (2013). “Engineering Ralstonia Eutropha for Production of Isobutanol from CO2, H2, and O2,” in Advanced Biofuels and Bioproducts. Editor J. W. Lee (Berlin/Heidelberg, Germany: Springer), Vol. 1, 1065–1090. doi:10.1007/978-1-4614-3348-4_39
Butterfield, G. L., Lajoie, M. J., Gustafson, H. H., Sellers, D. L., Nattermann, U., Ellis, D., et al. (2017). Evolution of a Designed Protein Assembly Encapsulating its Own RNA Genome. Nature 552, 415–420. doi:10.1038/nature25157
Carpenter, S. R. (2005). Eutrophication of Aquatic Ecosystems: Bistability and Soil Phosphorus. Proc. Natl. Acad. Sci. 102, 10002–10005. doi:10.1073/pnas.0503959102
Chen, A. H., Robinson-Mosher, A., Savage, D. F., Silver, P. A., and Polka, J. K. (2013). The Bacterial Carbon-Fixing Organelle Is Formed by Shell Envelopment of Preassembled Cargo. PLoS ONE 8, e76127. doi:10.1371/journal.pone.0076127
Chen, A. H., and Silver, P. A. (2012). Designing Biological Compartmentalization. Trends Cel Biol. 22, 662–670. doi:10.1016/j.tcb.2012.07.002
Claassens, N. J., Cotton, C. A. R., Kopljar, D., and Bar-Even, A. (2019). Making Quantitative Sense of Electromicrobial Production. Nat. Catal. 2, 437–447. doi:10.1038/s41929-019-0272-0
Claassens, N. J., Sousa, D. Z., dos Santos, V. A. P. M., de Vos, W. M., and van der Oost, J. (2016). Harnessing the Power of Microbial Autotrophy. Nat. Rev. Microbiol. 14, 692–706. doi:10.1038/nrmicro.2016.130
Firer-Sherwood, M., Pulcu, G. S., and Elliott, S. J. (2008). Electrochemical Interrogations of the Mtr Cytochromes from Shewanella: Opening a Potential Window J Biol Inorg Chem. 13, 849–854. doi:10.1007/s00775-008-0398-z
Flamholz, A. I., Dugan, E., Blikstad, C., Gleizer, S., Ben-Nissan, R., Amram, S., et al. (2020). Functional Reconstitution of a Bacterial CO2 Concentrating Mechanism in Escherichia coli. E. coli. Elife 9, e59882. doi:10.7554/elife.59882
Garnett, T. (2014). Three Perspectives on Sustainable Food Security: Efficiency, Demand Restraint, Food System Transformation. What Role for Life Cycle Assessment? J. Clean. Prod. 73, 10–18. doi:10.1016/j.jclepro.2013.07.045
Ghosh, S., Suri, D., and Uauy, R. (2012). Assessment of Protein Adequacy in Developing Countries: Quality Matters. Br. J. Nutr. 108, S77–S87. doi:10.1017/s0007114512002577
Gleizer, S., Bar-On, Y. M., Ben-Nissan, R., and Milo, R. (2020). Engineering Microbes to Produce Fuel, Commodities, and Food from CO2. Cel Rep. Phys. Sci. 1, 100223. doi:10.1016/j.xcrp.2020.100223
González, A. D., Frostell, B., and Carlsson-Kanyama, A. (2011). Protein Efficiency Per Unit Energy and Per Unit Greenhouse Gas Emissions: Potential Contribution of Diet Choices to Climate Change Mitigation. Food Policy 36, 562–570. doi:10.1016/j.foodpol.2011.07.003
Guo, W., Zhang, K., Liang, Z., Zou, R., and Xu, Q. (2019). Electrochemical Nitrogen Fixation and Utilization: Theories, Advanced Catalyst Materials and System Design. Chem. Soc. Rev. 48, 5658–5716. doi:10.1039/c9cs00159j
Hawksworth, J., and Chan, D. (2015). The World in 2050: Will the Shift in Global Economic Power Continue? London, United Kingdom: PricewaterhouseCoopers.
Heinke, J., Lannerstad, M., Gerten, D., Havlík, P., Herrero, M., Notenbaert, A. M. O., et al. (2020). Water Use in Global Livestock Production-Opportunities and Constraints for Increasing Water Productivity. Water Resour. Res. 56, 026995. doi:10.1029/2019wr026995
Hu, X., Kerckhof, F.-M., Ghesquière, J., Bernaerts, K., Boeckx, P., Clauwaert, P., et al. (2020). Microbial Protein Out of Thin Air: Fixation of Nitrogen Gas by an Autotrophic Hydrogen-Oxidizing Bacterial Enrichment. Environ. Sci. Technol. 54, 3609–3617. doi:10.1021/acs.est.9b06755
Huber, H., Gallenberger, M., Jahn, U., Eylert, E., Berg, I. A., Kockelkorn, D., et al. (2008). A Dicarboxylate/4-Hydroxybutyrate Autotrophic Carbon Assimilation Cycle in the Hyperthermophilic Archaeum Ignicoccus Hospitalis. Proc. Natl. Acad. Sci. 105, 7851–7856. doi:10.1073/pnas.0801043105
Kanehisa, M., Furumichi, M., Sato, Y., Ishiguro-Watanabe, M., and Tanabe, M. (2020). KEGG: Integrating Viruses and Cellular Organisms. Nucleic Acids Res. 49, D545–D551. doi:10.1093/nar/gkaa970
Kanehisa, M., and Goto, S. (2000). KEGG: Kyoto Encyclopedia of Genes and Genomes. Nucleic Acids Res. 28, 27–30. doi:10.1093/nar/28.1.27
Kanehisa, M. (2019). Toward Understanding the Origin and Evolution of Cellular Organisms. Protein Sci. 28, 1947–1951. doi:10.1002/pro.3715
Leger, D., Matassa, S., Noor, E., Shepon, A., Milo, R., and Bar-Even, A. (2021). Photovoltaic-driven Microbial Protein Production Can Use Land and Sunlight More Efficiently Than Conventional Crops. Proc. Natl. Acad. Sci. USA 118, e2015025118. doi:10.1073/pnas.2015025118
Li, Q., and Chen, S. (2020). Transfer of Nitrogen Fixation (Nif) Genes to Non‐diazotrophic Hosts. ChemBioChem 21, 1717–1722. doi:10.1002/cbic.201900784
Li, X.-X., Liu, Q., Liu, X.-M., Shi, H.-W., and Chen, S.-F. (2016). Using Synthetic Biology to Increase Nitrogenase Activity. Microb. Cel Fact 15, 43. doi:10.1186/s12934-016-0442-6
Liu, C., Colón, B. C., Ziesack, M., Silver, P. A., and Nocera, D. G. (2016). Water Splitting-Biosynthetic System with CO 2 Reduction Efficiencies Exceeding Photosynthesis. Science 352, 1210–1213. doi:10.1126/science.aaf5039
MacKellar, D., Lieber, L., Norman, J. S., Bolger, A., Tobin, C., Murray, J. W., et al. (2016). Streptomyces Thermoautotrophicus Does Not Fix Nitrogen. Sci. Rep. 6, 20086. doi:10.1038/srep20086
McClements, D. J. (2019). Future Foods, How Modern Science Is Transforming the Way We Eat. Berlin/Heidelberg, Germany: Springer.
Milo, R., Jorgensen, P., Moran, U., Weber, G., and Springer, M. (2010). BioNumbers-the Database of Key Numbers in Molecular and Cell Biology. Nucleic Acids Res. 38, D750–D753. doi:10.1093/nar/gkp889
Mishra, A., Ntihuga, J. N., Molitor, B., and Angenent, L. T. (2020). Power-to-Protein: Carbon Fixation with Renewable Electric Power to Feed the World. Joule 4, 1142–1147. doi:10.1016/j.joule.2020.04.008
Nyyssölä, A., Ojala, L. S., Wuokko, M., Peddinti, G., Tamminen, A., Tsitko, I., et al. (2021). Production of Endotoxin-free Microbial Biomass for Food Applications by Gas Fermentation of Gram-Positive H2-Oxidizing Bacteria. ACS Food Sci. Technol. 1, 470–479. doi:10.1021/acsfoodscitech.0c00129
Pimentel, D. (2009). Energy Inputs in Food Crop Production in Developing and Developed Nations. Energies 2, 1–24. doi:10.3390/en20100001
Polka, J. K., and Silver, P. A. (2016). A Tunable Protein Piston that Breaks Membranes to Release Encapsulated Cargo. ACS Synth. Biol. 5, 303–311. doi:10.1021/acssynbio.5b00237
Poore, J., and Nemecek, T. (2018). Reducing Food's Environmental Impacts through Producers and Consumers. Science 360, 987–992. doi:10.1126/science.aaq0216
Porritt, J., and McCarthy, M. (2017). The Global Protein Challenge. Stockholm, Sweden: Stockholm Resilience Centre.
Prosekov, A. Y., and Ivanova, S. A. (2018). Food Security: The challenge of the Present. Geoforum 91, 73–77. doi:10.1016/j.geoforum.2018.02.030
Rasul, S., Pugnant, A., Xiang, H., Fontmorin, J.-M., and Yu, E. H. (2019). Low Cost and Efficient alloy Electrocatalysts for CO2 Reduction to Formate. J. CO2 Utilization 32, 1–10. doi:10.1016/j.jcou.2019.03.016
Ritala, A., Häkkinen, S. T., Toivari, M., and Wiebe, M. G. (2017). Single Cell Protein-State-Of-The-Art, Industrial Landscape and Patents 2001-2016. Front. Microbiol. 8, 2009. doi:10.3389/fmicb.2017.02009
Rowe, A. R., Rajeev, P., Jain, A., Pirbadian, S., Okamoto, A., Gralnick, J. A., et al. (2018). Tracking Electron Uptake from a Cathode into Shewanella Cells: Implications for Energy Acquisition from Solid-Substrate Electron Donors. mBio 9, 1–19. doi:10.1128/mBio.02203-17
Rowe, A. R., Salimijazi, F., Trutschel, L., Sackett, J., Adesina, O., Anzai, I., et al. (2021). Identification of a Pathway for Electron Uptake in Shewanella Oneidensis. Commun. Biol. 4, 957. doi:10.1038/s42003-021-02454-x
Ryu, M.-H., Zhang, J., Toth, T., Khokhani, D., Geddes, B. A., Mus, F., et al. (2020). Control of Nitrogen Fixation in Bacteria that Associate with Cereals. Nat. Microbiol. 5, 314–330. doi:10.1038/s41564-019-0631-2
Salimijazi, F., Kim, J., Schmitz, A. M., Grenville, R., Bocarsly, A., and Barstow, B. (2020). Constraints on the Efficiency of Engineered Electromicrobial Production. Joule 4, 2101–2130. doi:10.1016/j.joule.2020.08.010
Salimijazi, F., Parra, E., and Barstow, B. (2019). Electrical Energy Storage with Engineered Biological Systems. J. Biol. Eng. 13, 1–21. doi:10.1186/s13036-019-0162-7
Siegel, J. B., Smith, A. L., Poust, S., Wargacki, A. J., Bar-Even, A., Louw, C., et al. (2015). Computational Protein Design Enables a Novel One-Carbon Assimilation Pathway. Proc. Natl. Acad. Sci. USA 112, 3704–3709. doi:10.1073/pnas.1500545112
Sillman, J., Nygren, L., Kahiluoto, H., Ruuskanen, V., Tamminen, A., Bajamundi, C., et al. (2019). Bacterial Protein for Food and Feed Generated via Renewable Energy and Direct Air Capture of CO2: Can it Reduce Land and Water Use? Glob. Food Security 22, 25–32. doi:10.1016/j.gfs.2019.09.007
Slade, R., Bauen, A., and Gross, R. (2014). Global Bioenergy Resources. Nat. Clim Change 4, 99–105. doi:10.1038/nclimate2097
Smetana, S., Mathys, A., Knoch, A., and Heinz, V. (2015). Meat Alternatives: Life Cycle Assessment of Most Known Meat Substitutes. Int. J. Life Cycle Assess. 20, 1254–1267. doi:10.1007/s11367-015-0931-6
Temme, K., Zhao, D., and Voigt, C. A. (2012). Refactoring the Nitrogen Fixation Gene Cluster from Klebsiella Oxytoca. Proc. Natl. Acad. Sci. 109, 7085–7090. doi:10.1073/pnas.1120788109
Tilman, D., Balzer, C., Hill, J., and Befort, B. L. (2011). Global Food Demand and the Sustainable Intensification of Agriculture. Proc. Natl. Acad. Sci. 108, 20260–20264. doi:10.1073/pnas.1116437108
Torella, J. P., Gagliardi, C. J., Chen, J. S., Bediako, D. K., and Col, B. (2015). Correction for Torella et al., Efficient solar-to-fuels production from a hybrid microbial-water-splitting catalyst system. Proc. Natl. Acad. Sci. USA 112, E1507. doi:10.1073/pnas.1503606112
Tubb, C., and Seba, T. (2021). Rethinking Food and Agriculture 2020-2030: The Second Domestication of Plants and Animals, the Disruption of the Cow, and the Collapse of Industrial Livestock Farming. Ind. Biotechnol. 17, 57–72. doi:10.1089/ind.2021.29240.ctu
Tuomisto, H. L., and Teixeira de Mattos, M. J. (2011). Environmental Impacts of Cultured Meat Production. Environ. Sci. Technol. 45, 6117–6123. doi:10.1021/es200130u
Ueki, T., Nevin, K. P., Woodard, T. V., Aklujkar, M. A., Holmes, D. E., and Lovley, D. R. (2018). Construction of a Geobacter Strain With Exceptional Growth on Cathodes. Front Microbiol. 9, 1512. doi:10.3389/fmicb.2018.01512
United States Department of Energy (2016). The SunShot Initiative 2030. Washington, D.C., U.S.: US Department of Energy.
Van Huis, A., Van Itterbeeck, J., Klunder, H., Mertens, E., Halloran, A., Muir, G., et al. (2013). Edible Insects: Future Prospects for Food and Feed Security. Rome, Italy: Food and Agricultural Organization.
Voegele, J., and Nelson, J. (2019). 4 Priorities in the Race to Build a Sustainable Global Food System.
Wang, L., Zhang, L., Liu, Z., Zhao, D., Liu, X., Zhang, B., et al. (2013). A Minimal Nitrogen Fixation Gene Cluster from Paenibacillus Sp. WLY78 Enables Expression of Active Nitrogenase in Escherichia coli. Plos Genet. 9, e1003865. doi:10.1371/journal.pgen.1003865
White, J. L., Baruch, M. F., Pander, J. E., Hu, Y., Fortmeyer, I. C., Park, J. E., et al. (2015). Light-Driven Heterogeneous Reduction of Carbon Dioxide: Photocatalysts and Photoelectrodes. Chem. Rev. 115, 12888–12935. doi:10.1021/acs.chemrev.5b00370
White, J. L., Herb, J. T., Kaczur, J. J., Majsztrik, P. W., and Bocarsly, A. B. (2014). Photons to Formate: Efficient Electrochemical Solar Energy Conversion via Reduction of Carbon Dioxide. J. CO2 Utilization 7, 1–5. doi:10.1016/j.jcou.2014.05.002
Wijffels, R. H., and Barbosa, M. J. (2010). An Outlook on Microalgal Biofuels. Science 329, 796–799. doi:10.1126/science.1189003
Williams, A. G., Audsley, E., and Sandars, D. L. (2006). “Determining the Environmental Burdens and Resource Use in the Production of Agricultural and Horticultural Commodities,” in Defra Project Report IS0205 (Cranfield, England: Cranfield University and Defra).
Yang, Z., Han, Y., Ma, Y., Chen, Q., Zhan, Y., Lu, W., et al. (2018). Global Investigation of an Engineered Nitrogen-Fixing Escherichia coli Strain Reveals Regulatory Coupling between Host and Heterologous Nitrogen-Fixation Genes. Sci. Rep. 8, 10928. doi:10.1038/s41598-018-29204-0
Yishai, O., Goldbach, L., Tenenboim, H., Lindner, S. N., and Bar-Even, A. (2017). Engineered Assimilation of Exogenous and Endogenous Formate in Escherichia Coli ACS Synth Biol. 6, 1722–1731. doi:10.1021/acssynbio.7b00086
Zarzycki, J., Brecht, V., Müller, M., and Fuchs, G. (2009). Identifying the Missing Steps of the Autotrophic 3-hydroxypropionate CO2 fixation Cycle inChloroflexus Aurantiacus. Proc. Natl. Acad. Sci. USA 106, 21317–21322. doi:10.1073/pnas.0908356106
Zhu, X.-G., Long, S. P., and Ort, D. R. (2010). Improving Photosynthetic Efficiency for Greater Yield. Annu. Rev. Plant Biol. 61, 235–261. doi:10.1146/annurev-arplant-042809-112206
Zhang, W., Hu, Y., Ma, L., Zhu, G., Wang, Y., Xue, X., et al. (2018). Progress and Perspective of Electrocatalytic CO2 Reduction for Renewable Carbonaceous Fuels and Chemicals Adv Sci. 5, 1700275. doi:10.1002/advs.201700275
Keywords: electromicrobial production, electron uptake, hydrogen oxidation, nitrogen fixation, carbon fixation
Citation: Wise L, Marecos S, Randolph K, Hassan M, Nshimyumukiza E, Strouse J, Salimijazi F and Barstow B (2022) Thermodynamic Constraints on Electromicrobial Protein Production. Front. Bioeng. Biotechnol. 10:820384. doi: 10.3389/fbioe.2022.820384
Received: 23 November 2021; Accepted: 14 January 2022;
Published: 21 February 2022.
Edited by:
Bin Lai, Helmholtz Association of German Research Centres (HZ), GermanyReviewed by:
Benjamin Korth, Helmholtz Association of German Research Centres (HZ), GermanyFrauke Kracke, Stanford University, United States
Copyright © 2022 Wise, Marecos, Randolph, Hassan, Nshimyumukiza, Strouse, Salimijazi and Barstow. This is an open-access article distributed under the terms of the Creative Commons Attribution License (CC BY). The use, distribution or reproduction in other forums is permitted, provided the original author(s) and the copyright owner(s) are credited and that the original publication in this journal is cited, in accordance with accepted academic practice. No use, distribution or reproduction is permitted which does not comply with these terms.
*Correspondence: Buz Barstow, Ym1iMzVAY29ybmVsbC5lZHU=
†These authors have contributed equally to this work