 Krzysztof Truchel1
 Krzysztof Wojtas1*
 Radosław Rzepliński2Mikołaj Sługocki2Iwona Łopianiak1
 Beata Butruk-Raszeja1
 Krystian Jędrzejczak1,3Wojciech Orciuch1
 Paweł Gierycz1Paweł Krajewski4Bogdan Ciszek2,5
 Łukasz Makowski1*
- 1Faculty of Chemical and Process Engineering, Warsaw University of Technology, Warsaw, Poland
- 2Department of Descriptive and Clinical Anatomy, Medical University of Warsaw, Warsaw, Poland
- 3Leeds Institute of Cardiovascular and Metabolic Medicine, University of Leeds, Leeds, United Kingdom
- 4Department of Forensic Medicine, Medical University of Warsaw, Warsaw, Poland
- 5Department of Pediatric Neurosurgery Chair of Neurosurgery, Medical University of Warsaw, Warsaw, Poland
This study presents the strength parameters of the major intracranial arteries: basilar artery (BA), anterior cerebral arteries (ACA), both left (LACA) and right (RACA), and middle cerebral arteries (MCA), both left (LMCA) and right (RMCA) and the anterior communicating artery (ACoA) obtained by performing single rupture tensile tests on fresh human biological specimens. The measured parameters included maximum Young’s modulus,
1 Introduction
Cerebrovascular diseases represent the primary cause of mortality from cardiovascular diseases, accounting for approximately 30% of all cardiovascular deaths in 2019. This represents a significant increase from the approximately 20% mortality rate observed in 1990 (Tsao et al., 2022; Tejada-Meza et al., 2025).
Existing therapeutic methods do not always provide satisfactory results, and still, common diseases (including hemorrhagic and ischemic stroke) are associated with an unfavorable prognosis. Improved diagnostic methodologies, including angiography, computed tomography, and magnetic resonance imaging, can visualize vascular pathologies at the asymptomatic stage. Therefore, neurology is dynamically developing and looking for solutions to the problems posed by clinicians.
Endovascular procedures within the cerebral and coronary circulation, including thrombectomy in ischemic stroke (Goyal et al., 2016), embolization of arteriovenous malformations (Fleetwood and Steinberg, 2002), stenting of atherosclerotic stenosis (Holmes et al., 2010), and embolization of intracranial aneurysms with coils and stents (Phan et al., 2016), are becoming increasingly commonplace. Despite the efficacy of these procedures, they are not without risk of complications, including restenosis (Bauters and Isner, 1997), stent migration (Diller et al., 2003), and arterial rupture or dissection (Shah et al., 2016). Carrying out interventions requires introducing a set of appropriate catheters, guidewires, balloons, etc., into the intracranial vascular system, which inevitably leads to local mechanical stresses. Critical rupture pressure in major human cerebral arteries has been studied (Ciszek et al., 2013), but the literature lacks data on the tensile strength.
During those interventions, there is a risk of mechanical properties deterioration or even arterial rupture, which can cause significant clinical consequences. Arteries do not obey Hooke’s law due to their highly nonlinear, anisotropic, and viscoelastic mechanical properties observed even for physiological pressures (Maher et al., 2012). The energy resulting from the applied force on a perfectly elastic body is converted into stress, which brings the body back to its original shape when the force is subtracted. For bodies such as arteries, the above mechanical properties cause some of the stored energy in the body to dissipate over time, which means that the body will not return to its original shapes after the force is subtracted (Fung, 1981; Maher et al., 2012). Therefore, arteries lack a single reference state to which they revert following stress subtraction. Instead, the equilibrium state is contingent upon many factors, including the strain history (Fung, 1981). In the context of stent insertion, partial stress relaxation over time will be observed, which is beneficial (Mullins, 1948; Fereidoonnezhad et al., 2016).
Arteries may experience supraphysiological loading during injury or the surgical procedures described above. Therefore, a softening effect is observed, which deteriorates the mechanical properties of the tissue. This effect largely depends on the previous maximum deformation (Fung, 1981; Holzapfel et al., 2002; Maher et al., 2012). When an artery is repeatedly stretched and relaxed, its response to load becomes more predictable, and maximum stresses can be reduced compared to material not subjected to such cycles. This phenomenon is called preconditioning (Fung, 1981; Horný et al., 2010).
The application of stenting following balloon angioplasty is undertaken to prevent the artery wall’s collapse and/or restenosis. However, it should be noted that the risk of arterial rupture is a much more significant consequence of intra-arterial procedures than the changes in mechanical properties themselves. Although circumferential stresses are generated mainly during these procedures, studies show that the ultimate strength of the artery in the circumferential direction is higher than in the axial one (up to two times) (Monson et al., 2008). Moreover, axial stresses can be generated during intravascular procedures such as inserting or withdrawing a catheter or guidewire and during stent delivery, when devices interact with the vessel wall and transmit longitudinal forces. Injury in this mechanism may lead to the pericardial tamponade in case of coronary artery intervention or brain hemorrhage in case of cerebral arteries (Deshpande et al., 2024; Li et al., 2025). Axial tension may also lead to dissection of catheterized vessel (Cloft et al., 2000; Abdelsalam et al., 2024).
In addition to mechanical stress caused by medical procedures such as endovascular interventions, intracranial arteries are also exposed to supraphysiological stress during traumatic brain injury (TBI), particularly in cases involving rapid deceleration, rotational forces, or direct impact (Smith et al., 2003). TBI causes approximately 1.5 million cases annually in the United States, resulting in 50,000 deaths, 230,000 hospitalizations, and long-term disability in 80,000–90,000 individuals (Thurman et al., 1999). These mechanical injuries can lead to diffuse vascular damage, stretching and even rupture of the brain arteries, contributing to intracranial hemorrhage (Ommaya et al., 2002; Smith et al., 2003). During neurosurgical interventions following TBI, vascular reconstruction may involve segmental resection of damaged vessels, followed by direct end-to-end anastomosis or the use of grafts (Wahlgren et al., 2025). Such procedures cause additional axial and circumferential loads, altering the native mechanical environment and requiring an in-depth understanding of the strength parameters of the arteries to prevent postoperative complications such as leakage, pseudoaneurysm, or restenosis.
An essential aspect of arterial strength analysis is the application of the results to engineering research. Currently, many tissue engineering studies are looking for the best materials or printing methods for arterial phantoms or scaffolds (Tetsuka and Shin, 2020; Wang et al., 2020; Tan et al., 2021). These are usually tested, e.g., for biocompatibility with human cells. However, although the results of their stress tests are reported in the literature, due to a lack of data, they are compared only to animal arteries (Illi et al., 2023; Huang et al., 2018; Wang et al., 2020; Lee et al., 2023), or no such comparison is made (Lu et al., 2014; Tang et al., 2015; Łopianiak et al., 2023; 2024; Choudhury et al., 2024). Similarly, such data will be invaluable in selecting the right flexible material for 3D printing using laser measurements (Antonowicz et al., 2023; Jędrzejczak et al., 2023a; 2024a), more accurate reconstruction or validation of arterial mechanics simulations (Holzapfel et al., 2002; 2025), and extending computational fluid dynamics simulations to simulations with dynamic wall deformation (Jędrzejczak et al., 2024b; 2023c; 2023b; Wojtas et al., 2021; Kozłowski et al., 2021; 2022).
This study aimed to examine the mechanical strength parameters of major intracranial arteries: the basilar artery (BA), left and right anterior cerebral artery (LACA, RACA), left and right middle cerebral artery (LMCA, RMCA), and the anterior communicating artery (ACoA). As rupture is most likely to occur during the first ballooning attempt, the arteries were subjected to a single stress increase from an unstressed state to material rupture.
2 Materials and methods
The study involved obtaining samples of intracranial arteries and then subjecting them to a quasi-static tensile test. The study protocol was approved by the Ethics Committee of the Medical University of Warsaw (number 194/2024). In the present study, 48 arteries were obtained from 21 cadavers, and 4 of the donors were women. The age of donors ranged from 18 to 81 years (median 54,
2.1 Biological material sampling
The study was based on a collection of anatomical specimens from the Department of Descriptive and Clinical Anatomy, Medical University of Warsaw, Poland. The unfixed specimens of the brain were obtained within 5 days of death from the cadavers stored at a temperature of 4 °C–8 °C and prepared with the use of an OPMI Pico microsurgical microscope (Carl Zeiss, Germany), as described previously (Rzepliński et al., 2021). The arteries of the circle of Willis (including BA, MCA, ACA and ACoA) were excised and stored at 4 °C–8 °C in 0.9% saline solution for not longer than 24 h before the experiment. In every case, central nervous system-related causes of death and significant intracranial pathologies were excluded (head trauma, neurodegeneration, cerebral infarction, etc.). Clinical characteristics of the donors were collected.
2.2 Quasi-static tensile test
In the quasi-static tensile test conducted on an artery, the specimen is assumed to be a non-porous tube with a constant wall thickness. The artery is fixed between a pair of jaws, subjecting the specimen to tension at a steady speed (5 mm/min). The speed used is consistent with those proposed elsewhere (Fung, 1981), allows the process to be performed in a similar time to stenting (there are no specific procedures for these intravascular procedures; the authors rely on their clinical knowledge), and allows the predominantly elastic behavior of the artery to be mapped. The force used for this,
During the provided tensile test, the engineering strain–relative elongation (in the sense of Eulerian),
By determining the elongation,
where
However, Monson proposed a more precise solution, where he divides the tensile test range into 3 areas: exponential, liner and quadratic (Monson, 2001). The first is given by equation:
where
Combining this approach with the equation given by Fung, it can be deduced that based on the linear area, it is possible to determine the maximum Young’s modulus,
Although the concept of Young’s modulus itself is developed for linearly elastic materials, for pseudoplastic materials it is still useful in describing the slope of the stress-strain curve at a given level of strain and it is used in the literature (Fung, 1981).
The results of the tensile test provide the basis for constructing a graph of engineering stress as a function of engineering strain,
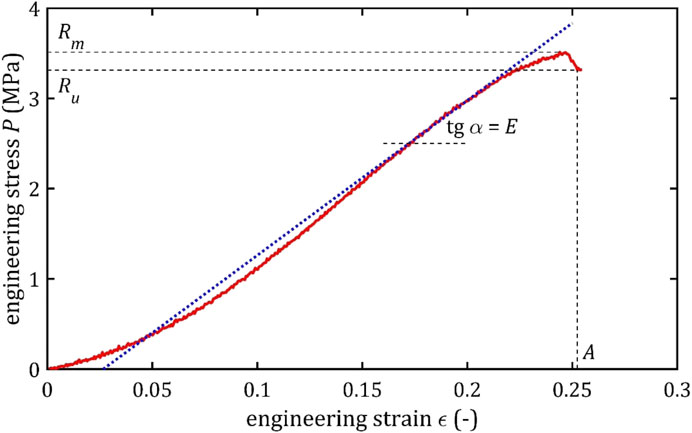
Figure 1. Example of the trend of the quasi-static tensile test of the cerebral artery with marked strength parameters and marked the tangent to the graph and the angle, on the basis of which the maximum Young’s modulus is determined.
2.3 Strength measurements
To determine the cross-sectional area of the artery, a Dantec Dynamics FlowSense 4 M MkII double-frame camera with a resolution of 2048 × 2048 pixels with a Nikon Nikkor AF Micro 60 mm f/2.8D camera lens (supplemented with several spacer rings) was used. A representative slice was taken from each specimen (Figure 2), from which the wall thickness (calculated as the average of a minimum of two circumferential locations) and outer circumference were determined.

Figure 2. Example images of arterial cross sections.
The cut and measured specimens with a length of approximately 25–30 mm were subjected to the stretching test in a longitudinal direction. The measurements were performed at room temperature. Samples were stored in saline solution and removed from the saline just before testing to maintain moisture. The central section of each sample, free of branching and wall defects, was placed between pneumatic jaws (distance between jaws = 15 mm). A single-tension test was conducted for each sample using an Instron 3345 device with 50 kN static load cell and associated software Bluehill (v.2), until the specimen reached its failure point.
For this study, we applied the tubular specimen analysis method available in the Bluehill software. The initial (reference) configuration for each sample was defined in the software before testing by inputting the following measured parameters: wall thickness, outer diameter, gauge length (15 mm, i.e., the distance between the grips).
Samples were positioned in the grips such that the central, uniform portion of the vessel—free of visible defects or irregularities—was included within the gauge length. Because arteries in the human body are constantly subjected to certain stresses that the dissected sample did not experience, the artery was positioned in the jaws to approximate its natural tension. Due to the lack of data on specific stresses, this positioning was based on the medical experience of team members who had previously dissected these specimens. The samples remained in this position for about 10 s for preconditioning, and then the force and displacement sensors were zeroed to ensure accurate acquisition of mechanical data.
Throughout the entire testing process, the specimens were kept hydrated. They were stored in physiological saline solution until the moment of testing, and due to the short duration of each test (typically 1–2, maximum 3 min until failure), the hydration state was maintained during the entire measurement. During testing, samples were recorded to detect where the break occurs. The results of those tests in which the specimen slid out, broke at the jaw, or the exact location of the break could not be located, were rejected.
The tensile process described above is shown in Figure 3.
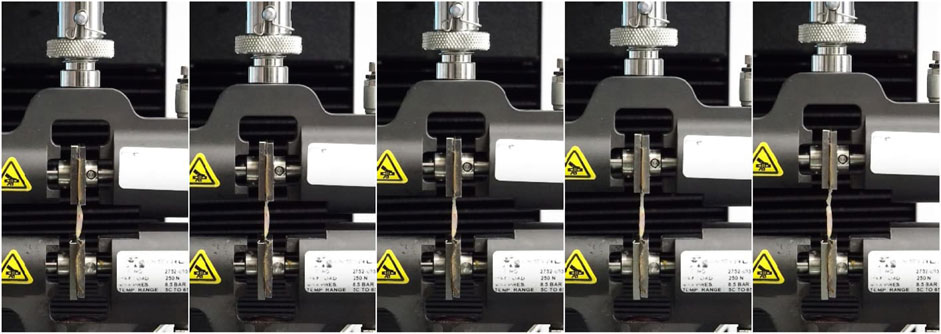
Figure 3. The run of the single tensile test by the Instron 3345 device from the initial moment (first photo) in 20 s increments points to the final rupture moment (last photo).
2.4 Statistics analysis
Due to the potential for inconsistencies in sample preparation and tensile testing, some results exhibited a notable difference compared to others. For groups of individual arteries, the coarse errors were identified as the results falling outside the extreme area in the Box-Whisker chart, that is, the area
The question arises whether the results obtained for each type of artery are significantly different and should be considered for each artery separately. For this reason, an analysis of variance (ANOVA) was performed to test the null hypothesis (St and Wold, 1989):
where the expected values for each group of arteries - the group averages of each strength parameter,
The impact of the artery type on the parameter under investigation is amplified when there is more significant variability and thus intergroup variance (mean square for artery effect,
where the variance estimator,
In comparison, the residual variance estimator, defined as
The probability level corresponding to the Fisher test statistic,
In this case, it is also possible to identify which groups of arteries exhibit statistically significant differences. Thus, it could be conducted to evaluate the significance of the contrasts between each pair, following a null hypothesis analysis:
where
There are several test statistics to compare different groups of results with varying degrees of power and to test the significance of any contrasts. One of these is Fisher’s Least Significant Difference (LSD) test (Williams and Abdi., 2010), which has one of the highest levels of power, making it very likely to identify the required differences correctly (Seaman et al., 1991). The formula gives the test statistic:
The contrast standard error takes the value:
This statistic has the t-Student distribution with
The condition for rejecting the above hypothesis is that the inequality is satisfied:
where
A multivariate regression analysis can be conducted to investigate the potential impact of factors such as age, sex, and geometric parameters of arteries on the obtained strength parameters.
A function is introduced in multiple regression and generalized linear models, where
A generalized linear model is employed to analyze data from
where
and
In searching for an optimal regression model, it is necessary to determine which of the identified regression coefficients is significant, significantly different from zero. This can be achieved by comparing the value of the coefficient with the imprecision of its determination, which is measured by the standard deviation:
where
The statistic is derived from the t-Student’s distribution. As the value of the test statistic increases and the corresponding probability level decreases, the regression coefficient under analysis becomes more significant. When the
All the statistical calculations described above were performed using the Statgraphics 19 software from Statgraphics Technologies, Inc.
3 Results and discussion
All stress-strain curves for all studied arteries are presented in Figures 4–9. Figures 10–13 illustrate the strength parameters for all analyzed cerebral artery types, and Table 1 presents their mean values with standard deviation. The detailed characteristics of all arteries are available in the Supplementary Table S1.
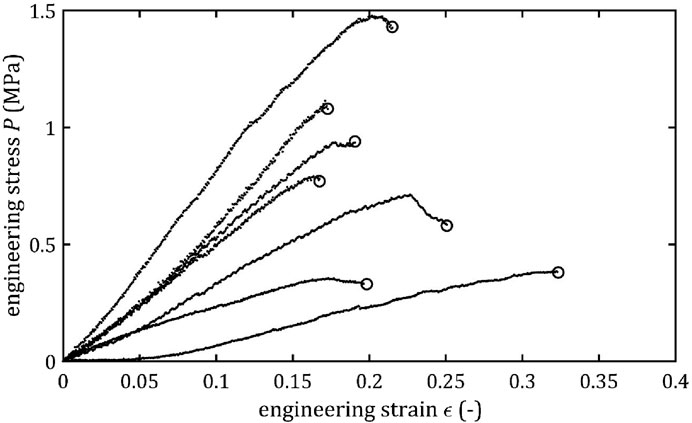
Figure 4. Stress-strain curves from quasi-static tensile tests for BA.
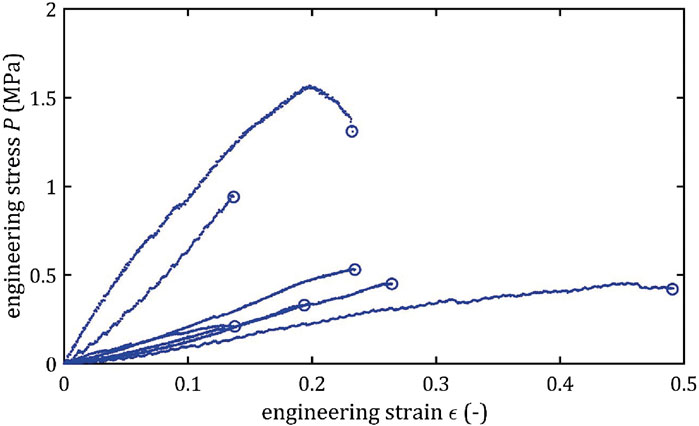
Figure 5. Stress-strain curves from quasi-static tensile tests for LMCA.

Figure 6. Stress-strain curves from quasi-static tensile tests for RMCA.
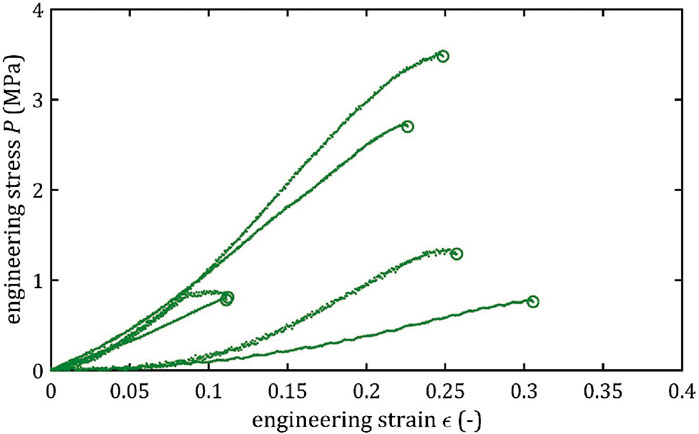
Figure 7. Stress-strain curves from quasi-static tensile tests for LACA.
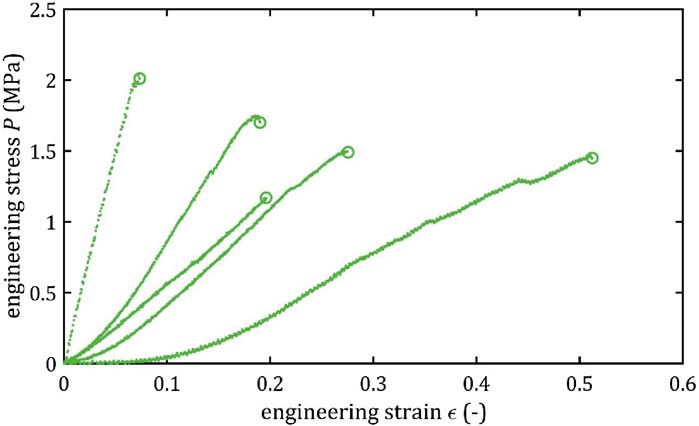
Figure 8. Stress-strain curves from quasi-static tensile tests for RACA.
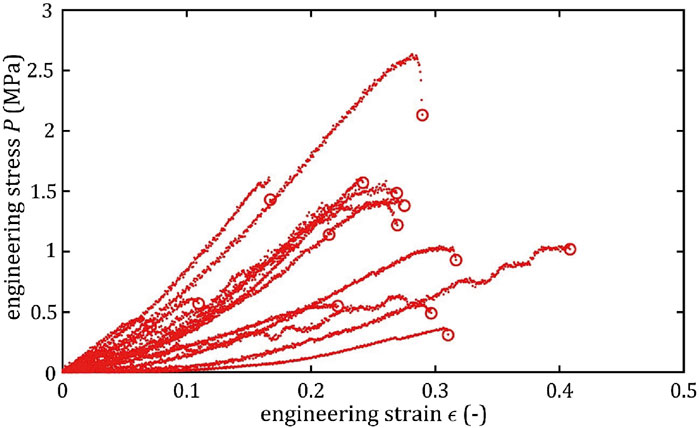
Figure 9. Stress-strain curves from quasi-static tensile tests for ACoA.
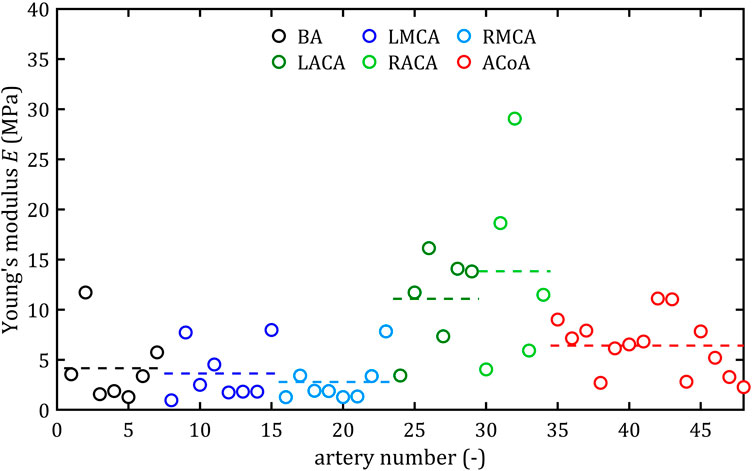
Figure 10. Maximum Young’s modulus, E, values for different cerebral arteries (dots represent the results of each sample, the dashed lines present the average value of a specific type of artery).
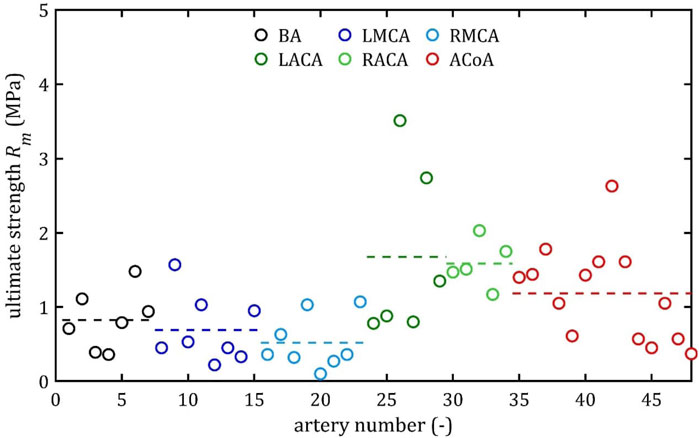
Figure 11. Ultimate strength, Rm, values for different cerebral arteries (dots represent the results of each sample, the dashed lines present the average value of a specific type of artery).
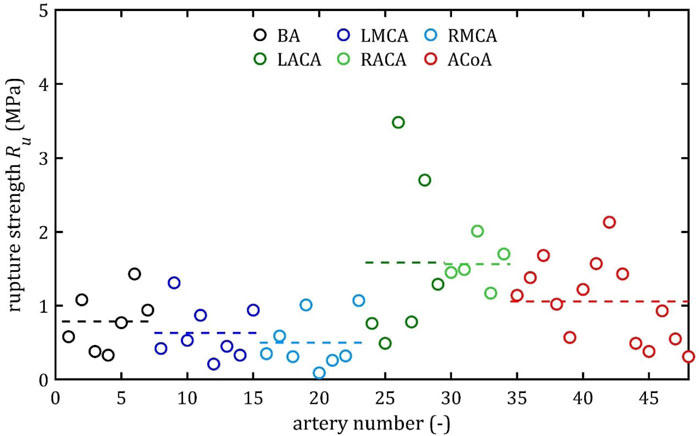
Figure 12. Rupture stress, Ru, values for different cerebral arteries (dots represent the results of each sample, the dashed lines present the average value of a specific type of artery).

Figure 13. Rupture strain, A, values for different cerebral arteries (dots represent the results of each sample, the dashed lines present the average value of a specific type of artery).
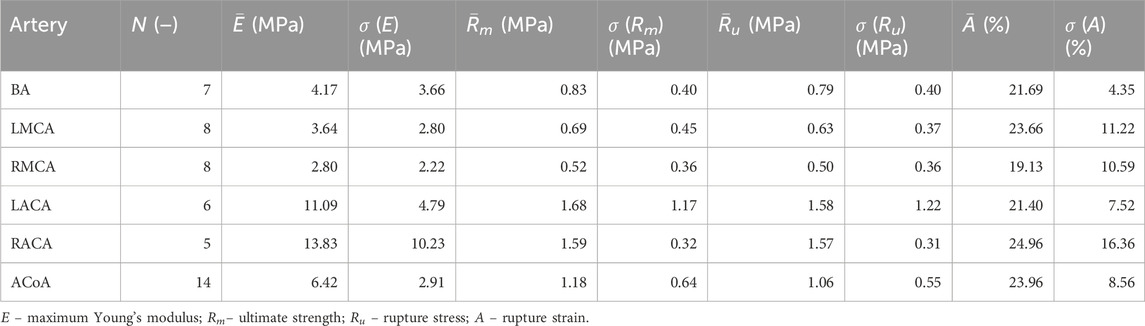
Table 1. Mean values and standard deviation, P, of tensile test results for different types of cerebral arteries.
3.1 Strength parameters
Mean value of maximum Young’s modulus,
As the results show, each artery leads to different average values. Monson provided measured values of cerebral arteries, without dividing them into specific arteries. For quasi-static tensile test for small arteries on the surface of the temporal lobe, mechanical parameters are
However, it can be seen that the MCA strength parameters differ from the results of other intracranial artery, suggesting that the differences between the types are significant, with the MCA itself leading to lower values (as in this study). In the literature, there are studies based on human intracranial arteries that lead to much lower values of
It is also noteworthy that the relative positions of the average strength, both ultimate,
Both the mean and the individual results demonstrate that the difference between ultimate,
As can be observed in the Figures 10–13, the results obtained for the different artery types in relation to the maximum Young’s modulus,
3.2 Multiple comparisons
The results of the multiple comparisons between the different arterial groups are presented in Figure 14 (specific data available in Supplementary Tables S2–S3). The graphs show the strength parameters’ mean values and the 95% LSD intervals. On this basis, the Roman letters indicate homogeneous groups for which there are no significant differences in result.
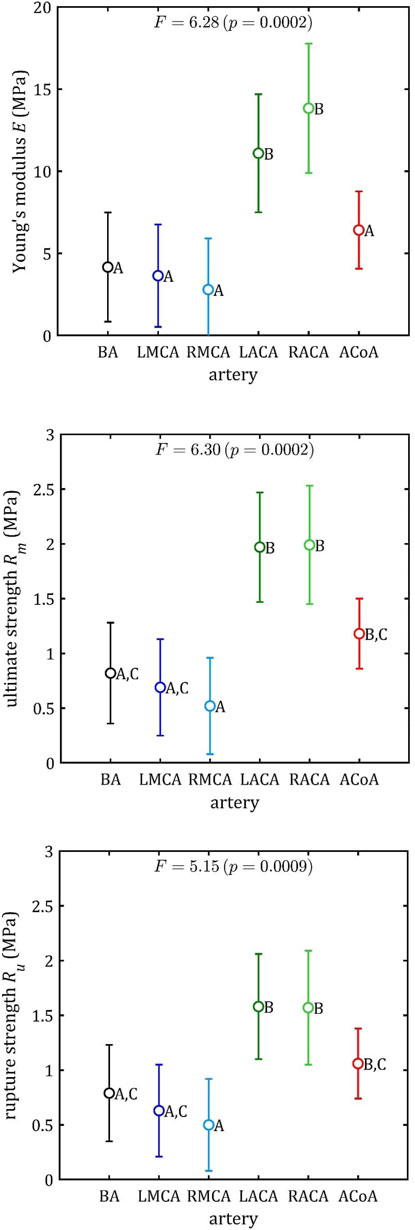
Figure 14. Results of multiple comparisons (means, 95% percent LSD intervals and homogeneous group: A–C) for strength parameters.
The ACA demonstrates notable differences in each of these three parameters (maximum Young’s modulus,
This conclusion is less evident in the case of rupture strain,
3.3 Linear regression
Based on this division (BA + MCA, ACA, and ACoA groups), multiple linear regression could be performed (Figures 15–17). These statistical calculations include testing the influence of several variables on all the strength parameters analyzed. Analysis revealed that strength parameters were related only to arterial wall thickness,
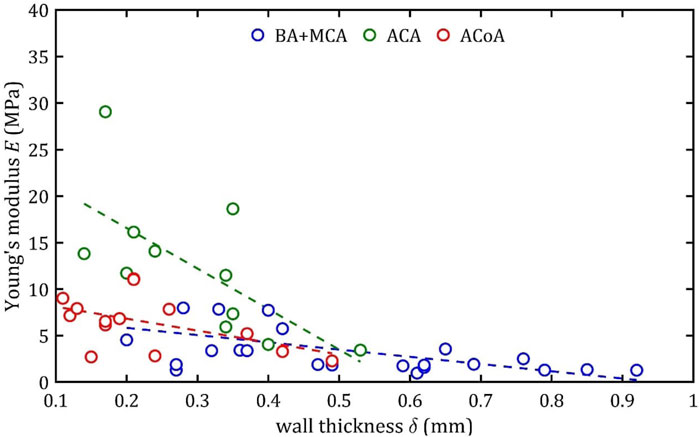
Figure 15. Trends of changes in Young’s module,
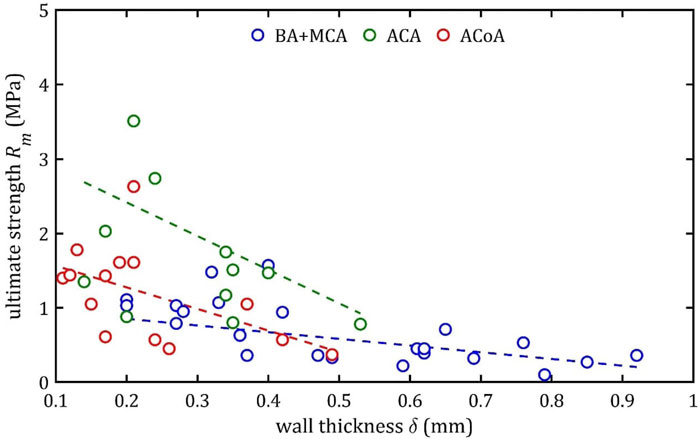
Figure 16. Trends of changes in ultimate strength,
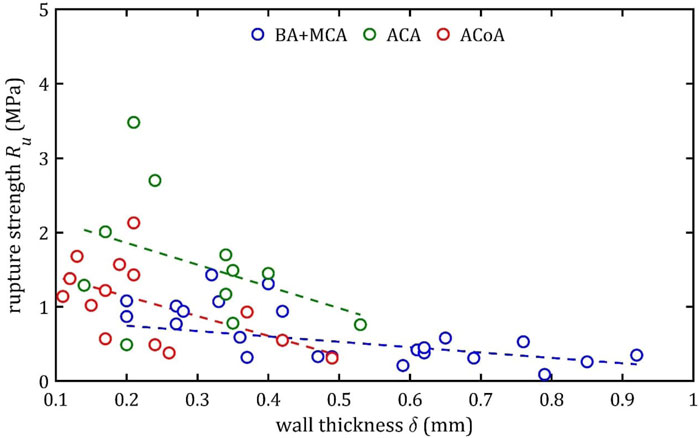
Figure 17. Trends of changes in rupture strength,
According to classical principles of continuum mechanics, the stress acting on the wall of a vessel subjected to internal pressure is inversely proportional to the thickness of the wall (Fung, 1994). This means that a vessel with a thicker wall will experience less stress per unit area for the same pressure value, which translates into greater resistance to mechanical failure and delamination. Hence, increasing the thickness of the arterial wall is a natural adaptive mechanism that allows the vessels to cope with higher pressures and mechanical loads, and changes in wall thickness are a key component of vascular remodeling that affect both the strength and elasticity of arteries (Humphrey, 2002).
A paper on the mechanics of the aorta also noted a similar dependence of stiffness on the thickness of the wall (Chen et al., 2024). In consideration of the aforementioned works and others in the field (Fung, 1981; Humphrey, 2002), it is evident that the thickness of the wall is contingent upon factors such as age, individual characteristics, medical history, and health status. Consequently, these parameters also indirectly affect mechanical properties, although their influence is difficult to determine unequivocally.
It is worth considering the lack of statistical influence of other analyzed aspects on mechanical properties. The present linear regression tests examined parameters clinicians can easily measure before or during surgical procedures. The analysis showed that gender had no significant effect on the parameters studied. However, trends analogous to those observed for wall thickness,
It should be noted that the observed relationship between wall thickness,
It is also worth recalling ACoA differs from the ACA, MCA, and BA in several aspects, including embryological origin, high anatomical variability, and increased susceptibility to aneurysm formation (Krystkiewicz et al., 2021; Bonasia et al., 2022). ACoA often presents hypoplasia, aplasia, duplication, and fenestrations (Krzyzewski et al., 2014) and it remains the most frequent site of intracranial aneurysms, accounting for up to 23%–40% of cases (Pahwa et al., 2022). The current study encountered diverse arterial structures, ranging from simple to complex configurations, including those with multiple branches and bifurcations. Moreover, the analysis revealed no significant impact of the structure on the outcomes, and ACoA measurements led to the lowest standard deviation values among all arteries.
An increase in diameter results in a decrease in maximum Young’s modulus,
This phenomenon may be due to different arterial wall layers’ proportions, with relatively thicker tunica media in bigger arteries, making them less stiff. In the case of the ACA, the different composition is a consequence of embryological development (Lasjaunias et al., 2006).
It is noteworthy that rupture at 7% elongation was found for different types of arteries and for different wall thicknesses (mainly for small ones below 0.4 mm but even for large thicknesses around 0.8 mm) (Figure 18). This indicates that the presented limit should be independent of wall thickness. Moreover, it should be borne in mind that in a pathological condition (e.g., infiltration by a tumor or inflammation) the strength parameters may be altered and practice shows that arteries are more fragile. The proposed limit may then be inappropriate. Moreover, there are several small branches of BA, ACA and MCA called the perforating arteries that at branch points may alter the mechanical properties of arterial wall (Rzepliński et al., 2022; 2023b; Kwiatkowska et al., 2023). The small arteries are hardly visible in standard clinical imaging techniques (Rzepliński et al., 2023a), therefore performing neurointerventions require special caution. Taking all of the above aspects into account. It is proposed that the 7% limit should be a benchmark for clinicians in the case of intracranial arteries, indicating that longitudinal stretching beyond this limit is associated with an increasing likelihood of irreversible consequences or even rupture. Of course, this is not a safe limit at which there is no risk of deterioration of mechanical properties or permanent damage to the artery. Nevertheless, the value itself can stand as some indication to clinicians that even with such small longitudinal deformations there is a risk of treatment failure.
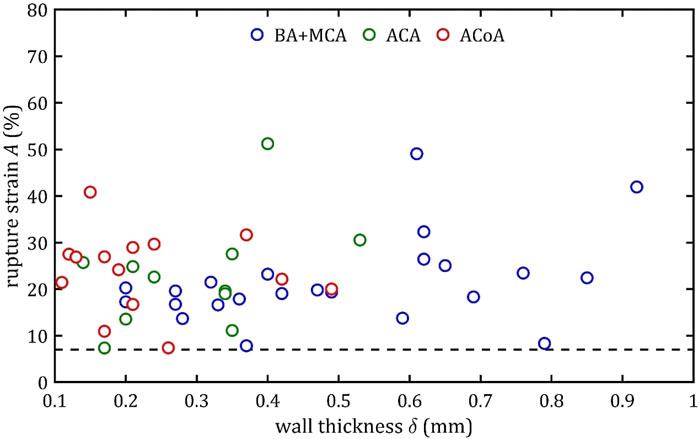
Figure 18. Trends of changes in rupture strain,
Applying this limit in practice means that stretching should be avoided during intracranial procedures when arteries are manipulated and thus stretched (e.g., mechanical thrombectomy) or bypassed. For the analyzed arteries, whose length is in the order of a few millimeters, the possible maximum stretching is only a few millimeters (Rhoton, 2000).
Most arterial procedures are performed using endovascular surgery, which employs tensile force in a circumferential direction. The structure and layout of the fibers result in different mechanical parameters in the axial and circumferential directions, with the higher circumferential strength (Fung, 1981). It is important to acknowledge that axial stresses are generated within the artery even in circumferential tension. Consequently, when examining the deformation of endovascular procedures, it is also essential to consider the maximum safe limit of axial elongation.
3.4 Limitations
The study has several limitations. The specimens were obtained from 21 brains, but conducting anatomical specimens-based studies is always limited by specimens’ availability. It is important to consider that when basing experimental results on biological material, the exact history of diseases, health conditions or genetic predispositions is not entirely known. This may affect the scatter or value of the parameter results obtained and the conclusions of the statistics performed.
It is also worth noting the time for testing the arteries after the occurrence of death. It was a maximum of 5 days, which was a direct result of medical procedures and the possibility of testing biological materials. However, a sizable portion of the samples were 1–2 days old. The study did not note any significant differences between the results for arteries with different collection times. An important fact is that intracerebral arteries consist mainly of elastin and collagen (the first type), which do not degrade fast enough to affect the results of the tests performed (Fung, 1981; Li et al., 2020). This is also in line with observations that indicate the possibility of mechanical testing of biological materials up to 7 days after in accordance without any change in strength parameters (Tuttle et al., 2014).
The technical limitation of the study was the accuracy of measuring the vessel diameter and thickness based on microscopic images. The cut tissue fragments used for measurements tended to shrink and curl, which required precise positioning on the calibration plate and a sufficiently fast measurement to avoid the effect of tissue drying, which could affect the measurement results. In the case of longer tissue fragments, it was necessary to assume a constant diameter and wall thickness for the entire analyzed sample.
Uniaxial tensile tests provide valuable information on the mechanical behavior of arterial tissue, whether for applications to intra-arterial procedures, 3D printing or deformation modeling. However, it should be noted that they do not provide a complete picture of tensile behavior and do not fully capture the complex anisotropic nature of blood vessels, which are fiber-reinforced composite materials. Arteries are composed of collagen and elastin fibers organized into helical and lamellar structures, leading to different mechanical responses depending on the direction of loading (Holzapfel et al., 2025). While uniaxial testing can approximate tensile strength in one direction, it does not account for the multidirectional load-bearing behavior observed in vivo. Biaxial testing can better capture physiological loading conditions and the interaction between axial and peripheral stresses (Weisbecker et al., 2012), but due to the small internal diameters of intracerebral arteries, such testing is not feasible on existing apparatus.
Furthermore, it is nearly impossible to replicate the pressures and forces that the artery experiences in vivo. The mechanical work of each artery is subject to variation due to the complex nature of the patient’s history, interpersonal differences, or variability in flow conditions. Furthermore, the medical field is missing clearly defined procedures or recommendations concerning the speed, timing, or forces employed during various procedures. This deficiency further complicates the formulation of clear recommendations or best practices for clinicians.
4 Conclusion
The study aimed to investigate the strength parameters of the major intracranial arteries (basilar artery, left and right anterior cerebral artery, left and right middle cerebral artery, anterior communicating artery) based on conducting a tensile test of anatomical specimens of human arteries. The main results of the study are the obtained values of the measured parameters: maximum Young’s modulus,
Studies indicate that the least stiff arteries are the ACA, followed by the ACoA which are significantly different from the BA and MCA. They are also able to withstand higher stresses. Studies also indicate that wall thickness, which is an easily measurable parameter for clinicians with vessel wall magnetic resonance imaging, is directly related to strength parameters. The thinner the wall, the greater the elasticity and possible stresses.
Obtained data can be used in the design of new neurointerventional devices (stents, catheters, guidewires, etc.), be an essential indicator in tissue engineering for the creation of phantoms or arterial supports and provide information necessary for advanced simulation studies on cerebral blood flow and arterial wall-stent interactions.
For clinicians performing intracranial procedures, rupture strain, which illustrates how much an artery can be stretched during an intervention without risking rupture, seems most intuitive. The results suggest that stretching the artery to 7% is very unlikely to lead to rupture (which does not imply the absence of other permanent constrictions), and this limit is the same for all intracranial arteries studied and does not depend on the wall thickness and other parameters analyzed.
Data availability statement
The datasets presented in this study can be found in online repositories. The names of the repository/repositories and accession number(s) can be found in the article/Supplementary Material.
Ethics statement
The studies involving humans were approved by Ethics Committee of the Medical University of Warsaw (number 194/2024). The studies were conducted in accordance with the local legislation and institutional requirements. Written informed consent for participation was not required from the participants or the participant's legal guardians/next of kin because Samples were taken from deceased persons.
Author contributions
KT: Formal analysis, Funding acquisition, Investigation, Software, Writing – original draft, Methodology, Validation, Visualization. KW: Conceptualization, Investigation, Methodology, Software, Supervision, Writing – review and editing, Validation, Visualization. RR: Data curation, Formal analysis, Writing – original draft. MS: Data curation, Formal analysis, Investigation, Writing – review and editing. IŁ: Investigation, Validation, Writing – review and editing. BB-R: Investigation, Validation, Writing – review and editing. KJ: Formal analysis, Investigation, Software, Writing – review and editing. WO: Data curation, Investigation, Writing – review and editing. PG: Conceptualization, Funding acquisition, Project administration, Supervision, Writing – review and editing. PK: Formal analysis, Resources, Writing – review and editings. BC: Data curation, Conceptualization, Formal analysis, Investigation, Methodology, Resources, Validation, Writing – review and editing. ŁM: Conceptualization, Methodology, Supervision, Project administration, Writing – review and editing.
Funding
The author(s) declare that financial support was received for the research and/or publication of this article. This study was funded by the YOUNG PW II project granted by the Warsaw University of Technology under the program Excellence Initiative: Research University.
Acknowledgments
The study protocol was approved by the Ethics Committee of the Medical University of Warsaw (number 194/2024).
Conflict of interest
The authors declare that the research was conducted in the absence of any commercial or financial relationships that could be construed as a potential conflict of interest.
Generative AI statement
The author(s) declare that no Generative AI was used in the creation of this manuscript.
Any alternative text (alt text) provided alongside figures in this article has been generated by Frontiers with the support of artificial intelligence and reasonable efforts have been made to ensure accuracy, including review by the authors wherever possible. If you identify any issues, please contact us.
Publisher’s note
All claims expressed in this article are solely those of the authors and do not necessarily represent those of their affiliated organizations, or those of the publisher, the editors and the reviewers. Any product that may be evaluated in this article, or claim that may be made by its manufacturer, is not guaranteed or endorsed by the publisher.
Supplementary material
The Supplementary Material for this article can be found online at: https://www.frontiersin.org/articles/10.3389/fbioe.2025.1554674/full#supplementary-material
References
Abdelsalam, A., Fountain, H. B., Ramsay, I. A., Luther, E. M., Sowlat, M. M., Silva, M. A., et al. (2024). First multicenter study evaluating the utility of the BENCHMARKTM BMXTM 81 large-bore access catheter in neurovascular interventions. Interv. Neuroradiol. doi:10.1177/15910199241262848
Antonowicz, A., Wojtas, K., Makowski, Ł., Orciuch, W., and Kozłowski, M. (2023). Particle image velocimetry of 3D-Printed anatomical blood vascular models affected by atherosclerosis. Materials 16, 1055. doi:10.3390/ma16031055
Bauters, C., and Isner, J. (1997). The biology of restenosis. Prog. Cardiovasc. Dis. 40, 107–116. doi:10.1016/S0033-0620(97)80003-5
Bonasia, S., Smajda, S., Ciccio, G., Bojanowski, M. W., and Robert, T. (2022). Embryology of the anterior communicating artery complex: implications on possible adult variants. Surg. Radiol. Anat. 44, 737–748. doi:10.1007/s00276-022-02928-5
Chen, H., Zhao, M., Li, Y., Wang, Q., Xing, Y., Bian, C., et al. (2024). A study on the ultimate mechanical properties of middle-aged and elderly human aorta based on uniaxial tensile test. Front. Bioeng. Biotechnol. 12, 1357056. doi:10.3389/fbioe.2024.1357056
Choudhury, S., Joshi, A., Baghel, V. S., Ananthasuresh, G. K., Asthana, S., Homer-Vanniasinkam, S., et al. (2024). Design-encoded dual shape-morphing and shape-memory in 4D printed polymer parts toward cellularized vascular grafts. J. Mater. Chem. B 12, 5678–5689. doi:10.1039/D4TB00437J
Ciszek, B., Cieślicki, K., Krajewski, P., and Piechnik, S. K. (2013). Critical pressure for arterial wall rupture in major human cerebral arteries. Stroke 44, 3226–3228. doi:10.1161/STROKEAHA.113.002370
Cloft, H. J., Jensen, M. E., Kallmes, D. F., and Dion, J. E. (2000). Arterial dissections complicating cerebral angiography and cerebrovascular interventions. AJNR Am. J. Neuroradiol. 21, 541–545.
Cogswell, P. M., Lants, S. K., Davis, L. T., and Donahue, M. J. (2019). Vessel wall and lumen characteristics with age in healthy participants using 3T intracranial vessel wall magnetic resonance imaging. Magn. Reson. Imaging 50, 1452–1460. doi:10.1002/jmri.26750
Coulson, R. J., Chesler, N. C., Vitullo, L., and Cipolla, M. J. (2002). Effects of ischemia and myogenic activity on active and passive mechanical properties of rat cerebral arteries. Am. J. Physiology-Heart Circulatory Physiology 283, H2268–H2275. doi:10.1152/ajpheart.00542.2002
Deshpande, S., Sawatari, H., Rangan, K., Buchade, A., Ahmed, R., Ramphul, K., et al. (2024). Pericardial tamponade in coronary interventions: morbidity and mortality. Cathet Cardio Interv. 104, 707–713. doi:10.1002/ccd.31213
Diller, R., Senninger, N., Kautz, G., and Tübergen, D. (2003). Stent migration necessitating surgical intervention. Surg. Endosc. 17, 1803–1807. doi:10.1007/s00464-002-9163-5
Fereidoonnezhad, B., Naghdabadi, R., and Holzapfel, G. A. (2016). Stress softening and permanent deformation in human aortas: Continuum and computational modeling with application to arterial clamping. J. Mech. Behav. Biomed. Mater. 61, 600–616. doi:10.1016/j.jmbbm.2016.03.026
Fleetwood, I. G., and Steinberg, G. K. (2002). Arteriovenous malformations. Lancet 359, 863–873. doi:10.1016/S0140-6736(02)07946-1
Fung, Y. C. (1981). Biomechanics: mechanical properties of living tissues. New York: Springer-Verlag.
Fung, Y. (1994). A first course in continuum mechanics: for physical and biological scientists and engineers, 3. Englewood Cliffs, NJ.: Prentice Hall.
Goyal, M., Menon, B. K., Van Zwam, W. H., Dippel, D. W. J., Mitchell, P. J., Demchuk, A. M., et al. (2016). Endovascular thrombectomy after large-vessel ischaemic stroke: a meta-analysis of individual patient data from five randomised trials. Lancet 387, 1723–1731. doi:10.1016/S0140-6736(16)00163-X
Holmes, D. R., Kereiakes, D. J., Garg, S., Serruys, P. W., Dehmer, G. J., Ellis, S. G., et al. (2010). Stent thrombosis. J. Am. Coll. Cardiol. 56, 1357–1365. doi:10.1016/j.jacc.2010.07.016
Holzapfel, G. A., Gasser, T. C., and Stadler, M. (2002). A structural model for the viscoelastic behavior of arterial walls: continuum formulation and finite element analysis. Eur. J. Mech. - A/Solids 21, 441–463. doi:10.1016/S0997-7538(01)01206-2
Holzapfel, G. A., Humphrey, J. D., and Ogden, R. W. (2025). Biomechanics of soft biological tissues and organs, mechanobiology, homeostasis and modelling. J. R. Soc. Interface. 22, 20240361. doi:10.1098/rsif.2024.0361
Horný, L., Gultova, E., Chlup, H., Radek, S., Kronek, J., Vesely, J., et al. (2010). Mullins effect in human aorta described with limiting extensibility evolution. IFMBE Proc. 29, 768–771. doi:10.1007/978-3-642-13039-7_194
Huang, R., Gao, X., Wang, J., Chen, H., Tong, C., Tan, Y., et al. (2018). Triple-layer vascular grafts fabricated by combined E-Jet 3D printing and electrospinning. Ann. Biomed. Eng. 46, 1254–1266. doi:10.1007/s10439-018-2065-z
Humphrey, J. D. (2002). Cardiovascular solid mechanics: cells, tissues, and organs. New York, NY: Springer New York. doi:10.1007/978-0-387-21576-1
Illi, J., Ilic, M., Stark, A. W., Amstutz, C., Burger, J., Zysset, P., et al. (2023). Mechanical testing and comparison of porcine tissue, silicones and 3D-printed materials for cardiovascular phantoms. Front. Bioeng. Biotechnol. 11, 1274673. doi:10.3389/fbioe.2023.1274673
Jędrzejczak, K., Antonowicz, A., Makowski, Ł., Orciuch, W., Wojtas, K., and Kozłowski, M. (2023a). Computational fluid dynamics validated by micro particle image velocimetry to estimate the risk of hemolysis in arteries with atherosclerotic lesions. Chem. Eng. Res. Des. 196, 342–353. doi:10.1016/j.cherd.2023.06.041
Jędrzejczak, K., Makowski, Ł., Orciuch, W., Wojtas, K., and Kozłowski, M. (2023b). Hemolysis of red blood cells in blood vessels modeled via computational fluid dynamics. Numer. Methods Biomed. Eng. 39, e3699. doi:10.1002/cnm.3699
Jędrzejczak, K., Orciuch, W., Wojtas, K., Kozłowski, M., Piasecki, P., Narloch, J., et al. (2023c). Prediction of hemodynamic-related hemolysis in carotid stenosis and aiding in treatment planning and risk stratification using computational fluid dynamics. Biomedicines 12, 37. doi:10.3390/biomedicines12010037
Jędrzejczak, K., Antonowicz, A., Butruk-Raszeja, B., Orciuch, W., Wojtas, K., Piasecki, P., et al. (2024a). Three-dimensionally printed elastic cardiovascular phantoms for carotid angioplasty training and personalized healthcare. JCM 13, 5115. doi:10.3390/jcm13175115
Jędrzejczak, K., Orciuch, W., Wojtas, K., Piasecki, P., Narloch, J., Wierzbicki, M., et al. (2024b). Impact of hypertension and physical exercise on hemolysis risk in the left coronary artery: a computational fluid dynamics analysis. JCM 13, 6163. doi:10.3390/jcm13206163
Karimi, A., Rahmati, S. M., Sera, T., Kudo, S., and Navidbakhsh, M. (2017). A combination of experimental and numerical methods to investigate the role of strain rate on the mechanical properties and collagen fiber orientations of the healthy and atherosclerotic human coronary arteries. Bioengineered 8, 154–170. doi:10.1080/21655979.2016.1212134
Kozłowski, M., Wojtas, K., Orciuch, W., Jędrzejek, M., Smolka, G., Wojakowski, W., et al. (2021). Potential applications of computational fluid dynamics for predicting hemolysis in mitral paravalvular leaks. J. Clin. Med. 10, 5752. doi:10.3390/jcm10245752
Kozłowski, M., Wojtas, K., Orciuch, W., Smolka, G., Wojakowski, W., and Makowski, Ł. (2022). Parameters of flow through paravalvular leak channels from computational fluid dynamics simulations—data from real-life cases and comparison with a simplified model. JCM 11, 5355. doi:10.3390/jcm11185355
Krystkiewicz, K., Ciszek, B., Szylberg, Ł., Tosik, M., and Harat, M. (2021). Morphological analysis of cerebral artery fenestrations and their correlation with intracranial aneurysms. World Neurosurg. 156, e85–e92. doi:10.1016/j.wneu.2021.08.137
Krzyzewski, R. M., Tomaszewska, I. M., Lorenc, N., Kochana, M., Goncerz, G., Klimek-Piotrowska, W., et al. (2014). Variations of the anterior communicating artery complex and occurrence of anterior communicating artery aneurysm: A2 segment consideration. Folia Med. Cracov 54, 13–20.
Kwiatkowska, M., Rzepliński, R., and Ciszek, B. (2023). Anatomy of the pontine arteries and perforators of the basilar artery in humans. J. Anat. 243, 997–1006. doi:10.1111/joa.13927
Lakatta, E. G., and Levy, D. (2003). Arterial and cardiac aging: major shareholders in cardiovascular disease enterprises: part I: aging arteries: a “Set Up” for vascular disease. Circulation 107, 139–146. doi:10.1161/01.cir.0000048892.83521.58
Lasjaunias, P., Brugge, K. G., and Berenstein, A. (2006). “Embryological and anatomical introduction,” in Surgical neuroangiography: clinical and interventional aspects in children (Berlin, Heidelberg: Springer Berlin Heidelberg), 1–25. doi:10.1007/978-3-540-68320-9_1
Lee, D. Y., Jang, Y., Kim, E., Li, T., and Kim, S. J. (2023). Tissue-engineered vascular graft based on a bioresorbable tubular knit scaffold with flexibility, durability, and suturability for implantation. J. Mater. Chem. B 11, 1108–1114. doi:10.1039/D2TB01891H
Li, M. J., Wang, J., Xia, B., Li, Z., Liu, J. J., Zhang, Q. J., et al. (2020). Application of sequential changes of dural thickness and biomechanical parameters in postmortem interval estimation. Fa Yi Xue Za Zhi 36, 199–203. doi:10.12116/j.issn.1004-5619.2020.02.010
Li, J., Ye, S., Wang, Y., Liu, C., and Zhao, H. (2025). Removal of an entrapped guidewire by excimer laser coronary angioplasty in patients with chronic total occlusion intervention. BMC Cardiovasc Disord. 25, 24. doi:10.1186/s12872-024-04440-7
Lombarski, L., Kunert, P., Tarka, S., Piechna, A., Kujawski, S., and Marchel, A. (2022). Rupture pressure values of cerebral arteries in the presence of unruptured intracranial aneurysm. Sci. Rep. 12, 10294. doi:10.1038/s41598-022-13341-8
Łopianiak, I., Rzempołuch, W., Civelek, M., Cicha, I., Ciach, T., and Butruk-Raszeja, B. A. (2023). Multilayered blow-spun vascular prostheses with luminal surfaces in nano/micro range: the influence on endothelial cell and platelet adhesion. J. Biol. Eng. 17, 20. doi:10.1186/s13036-023-00337-9
Łopianiak, I., Kawecka, A., Civelek, M., Wojasiński, M., Cicha, I., Ciach, T., et al. (2024). Characterization of blow-spun polyurethane scaffolds–influence of fiber alignment and fiber diameter on pericyte growth. ACS Biomater. Sci. Eng. 10, 4388–4399. doi:10.1021/acsbiomaterials.4c00051
Lu, X., Chan, C. Y., Lee, K. I., Ng, P. F., Fei, B., Xin, J. H., et al. (2014). Super-tough and thermo-healable hydrogel – promising for shape-memory absorbent fiber. J. Mater. Chem. B 2, 7631–7638. doi:10.1039/C4TB01289E
Maher, E., Creane, A., Lally, C., and Kelly, D. J. (2012). An anisotropic inelastic constitutive model to describe stress softening and permanent deformation in arterial tissue. J. Mech. Behav. Biomed. Mater. 12, 9–19. doi:10.1016/j.jmbbm.2012.03.001
Monson, K. L. (2001). Mechanical and failure properties of human cerebral blood vessels. Available online at: https://www.proquest.com/dissertations-theses/mechanical-failure-properties-human-cerebral/docview/304685237/se-2.
Monson, K. L., Goldsmith, W., Barbaro, N. M., and Manley, G. T. (2003). Axial mechanical properties of fresh human cerebral blood vessels. J. Biomechanical Eng. 125, 288–294. doi:10.1115/1.1554412
Monson, K. L., Goldsmith, W., Barbaro, N. M., and Manley, G. T. (2005). Significance of source and size in the mechanical response of human cerebral blood vessels. J. Biomechanics 38, 737–744. doi:10.1016/j.jbiomech.2004.05.004
Monson, K. L., Barbaro, N. M., and Manley, G. T. (2008). Biaxial response of passive human cerebral arteries. Ann. Biomed. Eng. 36, 2028–2041. doi:10.1007/s10439-008-9578-9
Mullins, L. (1948). Effect of stretching on the properties of rubber. Rubber Chem. Technol. 21, 281–300. doi:10.5254/1.3546914
Nye, K. S., Converse, M. I., Dahl, M. J., Albertine, K. H., and Monson, K. L. (2017). Development of mechanical and failure properties in sheep cerebral arteries. Ann. Biomed. Eng. 45, 1101–1110. doi:10.1007/s10439-016-1741-0
Ommaya, A. K., Goldsmith, W., and Thibault, L. (2002). Biomechanics and neuropathology of adult and paediatric head injury. Br. J. Neurosurg. 16, 220–242. doi:10.1080/02688690220148824
Pahwa, B., Goyal, S., and Chaurasia, B. (2022). Understanding anterior communicating artery aneurysms: a bibliometric analysis of top 100 most cited articles. J. Cerebrovasc. Endovasc. Neurosurg. 24, 325–334. doi:10.7461/jcen.2022.E2022.01.001
Phan, K., Huo, Y. R., Jia, F., Phan, S., Rao, P. J., Mobbs, R. J., et al. (2016). Meta-analysis of stent-assisted coiling versus coiling-only for the treatment of intracranial aneurysms. J. Clin. Neurosci. 31, 15–22. doi:10.1016/j.jocn.2016.01.035
Rhoton, A. L. (2000). The cerebellar arteries. Neurosurgery 47, S29–S68. doi:10.1097/00006123-200009001-00010
Rzepliński, R., Tomaszewski, M., Sługocki, M., Karczewski, K., Krajewski, P., Skadorwa, T., et al. (2021). Method of creating 3D models of small caliber cerebral arteries basing on anatomical specimens. J. Biomechanics 125, 110590. doi:10.1016/j.jbiomech.2021.110590
Rzepliński, R., Sługocki, M., Tarka, S., Tomaszewski, M., Kucewicz, M., Karczewski, K., et al. (2022). Mechanism of spontaneous intracerebral hemorrhage formation: an anatomical specimens-based study. Stroke 53, 3474–3480. doi:10.1161/STROKEAHA.122.040143
Rzepliński, R., Sługocki, M., Kwiatkowska, M., Tarka, S., Tomaszewski, M., Kucewicz, M., et al. (2023a). Standard clinical computed tomography fails to precisely visualise presence, course and branching points of deep cerebral perforators. Folia Morphol. 82, 37–41. doi:10.5603/FM.a2021.0133
Rzepliński, R., Sługocki, M., Tomaszewski, M., Kucewicz, M., Krajewski, P., Małachowski, J., et al. (2023b). Basilar tip fenestration giving rise to Percheron’s and mesencephalic arteries. Folia Morphol. VM/OJS/J/95368 83, 451–454. doi:10.5603/FM.a2023.0054
Sánchez-Molina, D., García-Vilana, S., Llumà, J., Galtés, I., Velázquez-Ameijide, J., Rebollo-Soria, M. C., et al. (2021). Mechanical behavior of blood vessels: elastic and viscoelastic contributions. Biology 10, 831. doi:10.3390/biology10090831
Seaman, M., Levin, J., and Serlin, R. (1991). New developments in pairwise multiple comparisons: some powerful and practicable procedures. Psychol. Bull. 110, 577–586. doi:10.1037/0033-2909.110.3.577
Shah, P., Bajaj, S., and Shamoon, F. (2016). Aortic dissection caused by percutaneous coronary intervention: 2 new case reports and detailed analysis of 86 previous cases. Tex. Heart Inst. J. 43, 52–60. doi:10.14503/THIJ-14-4585
Smith, D. H., Meaney, D. F., and Shull, W. H. (2003). Diffuse axonal injury in head trauma. J. Head Trauma Rehabilitation 18, 307–316. doi:10.1097/00001199-200307000-00003
St, L., and Wold, S. (1989). Analysis of variance (ANOVA). Chemom. Intelligent Laboratory Syst. 6, 259–272. doi:10.1016/0169-7439(89)80095-4
Tan, B., Gan, S., Wang, X., Liu, W., and Li, X. (2021). Applications of 3D bioprinting in tissue engineering: advantages, deficiencies, improvements, and future perspectives. J. Mater. Chem. B 9, 5385–5413. doi:10.1039/D1TB00172H
Tang, J., Bao, L., Li, X., Chen, L., and Hong, F. F. (2015). Potential of PVA-doped bacterial nano-cellulose tubular composites for artificial blood vessels. J. Mater. Chem. B 3, 8537–8547. doi:10.1039/C5TB01144B
Tejada-Meza, H., Lambea-Gil, Á., Pardiñas-Barón, B., Sagarra-Mur, D., Viscasillas-Sancho, M., Moreno-Loscertales, C., et al. (2025). Mortality and long-term recurrence of ischaemic stroke in young adults of a northern Spanish region (Aragón). Neurol. Engl. Ed. 40, 333–343. doi:10.1016/j.nrleng.2025.04.002
Tetsuka, H., and Shin, S. R. (2020). Materials and technical innovations in 3D printing in biomedical applications. J. Mater. Chem. B 8, 2930–2950. doi:10.1039/D0TB00034E
Thurman, D. J., Alverson, C., Dunn, K. A., Guerrero, J., and Sniezek, J. E. (1999). Traumatic brain injury in the United States: a public health perspective. J. Head Trauma Rehabilitation 14, 602–615. doi:10.1097/00001199-199912000-00009
Tsao, C. W., Aday, A. W., Almarzooq, Z. I., Alonso, A., Beaton, A. Z., Bittencourt, M. S., et al. (2022). Heart disease and stroke Statistics—2022 update: a report from the American heart association. Circulation 145, e153–e639. doi:10.1161/CIR.0000000000001052
Tuttle, L. J., Alperin, M., and Lieber, R. L. (2014). Post-mortem timing of skeletal muscle biochemical and mechanical degradation. J. Biomechanics 47, 1506–1509. doi:10.1016/j.jbiomech.2014.02.019
Vatner, S. F., Zhang, J., Vyzas, C., Mishra, K., Graham, R. M., and Vatner, D. E. (2021). Vascular stiffness in aging and disease. Front. Physiol. 12, 762437. doi:10.3389/fphys.2021.762437
Wahlgren, C. M., Aylwin, C., Davenport, R. A., Davidovic, L. B., DuBose, J. J., Gaarder, C., et al. (2025). Editor’s choice - european society for vascular surgery (ESVS) 2025 clinical practice guidelines on the management of vascular trauma. Eur. J. Vasc. Endovascular Surg. 69, 179–237. doi:10.1016/j.ejvs.2024.12.018
Wang, D., Xu, Y., Li, Q., and Turng, L.-S. (2020). Artificial small-diameter blood vessels: materials, fabrication, surface modification, mechanical properties, and bioactive functionalities. J. Mater. Chem. B 8, 1801–1822. doi:10.1039/C9TB01849B
Weisbecker, H., Pierce, D. M., Regitnig, P., and Holzapfel, G. A. (2012). Layer-specific damage experiments and modeling of human thoracic and abdominal aortas with non-atherosclerotic intimal thickening. J. Mech. Behav. Biomed. Mater. 12, 93–106. doi:10.1016/j.jmbbm.2012.03.012
Keywords: strength parameters, mechanical properties, maximum Young’s modulus, tensile test, rupture, intracranial arteries, neurovascular diseases, cerebral circulation
Citation: Truchel K, Wojtas K, Rzepliński R, Sługocki M, Łopianiak I, Butruk-Raszeja B, Jędrzejczak K, Orciuch W, Gierycz P, Krajewski P, Ciszek B and Makowski Ł (2025) Statistical analysis of the measured strength parameters of the fresh main intracranial arteries. Front. Bioeng. Biotechnol. 13:1554674. doi: 10.3389/fbioe.2025.1554674
Received: 02 January 2025; Accepted: 31 July 2025;
Published: 18 September 2025.
Edited by:
Yonghui Qiao, Northwestern Polytechnical University, ChinaReviewed by:
Kenneth L. Monson, The University of Utah, United StatesXiaochang Leng, Nanchang University, China
Susheil Uthamaraj, Mayo Clinic, United States
Copyright © 2025 Truchel, Wojtas, Rzepliński, Sługocki, Łopianiak, Butruk-Raszeja, Jędrzejczak, Orciuch, Gierycz, Krajewski, Ciszek and Makowski. This is an open-access article distributed under the terms of the Creative Commons Attribution License (CC BY). The use, distribution or reproduction in other forums is permitted, provided the original author(s) and the copyright owner(s) are credited and that the original publication in this journal is cited, in accordance with accepted academic practice. No use, distribution or reproduction is permitted which does not comply with these terms.
*Correspondence: Krzysztof Wojtas, S3J6eXN6dG9mLldvanRhc0Bwdy5lZHUucGw=; Łukasz Makowski, JiN4MDAxNDE7dWthc3ouTWFrb3dza2lAcHcuZWR1LnBs