 Saleha Kamal1,2
 Mohammed Alshehri3Yahya AlQahtani4
 Abdulmonem Alshahrani4*Nouf Abdullah Almujally5
 Ahmad Jalal2,6*
 Hui Liu1,7,8*
- 1Jiangsu Key Laboratory of Intelligent Medical Image Computing, School of Artificial Intelligence, Nanjing University of Information Science and Technology, Nanjing, China
- 2Faculty of Computer Science and AI, Air University, E-9, Islamabad, Pakistan
- 3Department of Computer Science, Applied College, King Khalid University, Abha, Saudi Arabia
- 4Department of Informatics and Computer Systems, King Khalid University, Abha, Saudi Arabia
- 5Department of Information Systems, College of Computer and Information Sciences, Princess Nourah bint Abdulrahman University, Riyadh, Saudi Arabia
- 6Department of Computer Science and Engineering, College of Informatics, Korea University, Seoul, Republic of Korea
- 7Guodian Nanjing Automation Co., Ltd., Nanjing, China
- 8Cognitive Systems Lab, University of Bremen, Bremen, Germany
Human Motion Intention Recognition (HMIR) plays a vital role in advancing medical rehabilitation and assistive technologies by enabling the early detection of pain-indicative actions such as sneezing, coughing, or back discomfort. However, existing systems struggle with recognizing such subtle movements due to complex postural variations and environmental noise. This paper presents a novel multi-modal framework that integrates RGB and depth data to extract high-resolution spatial-temporal and anatomical features for accurate HMIR. Our method combines kinetic energy, optical flow, angular geometry, and depth-based features (e.g., 2.5D point clouds and random occupancy patterns) to represent full-body dynamics robustly. Stochastic Gradient Descent (SGD) is employed to optimize the feature space, and a deep neuro-fuzzy classifier is proposed to balance interpretability and predictive accuracy. Evaluated on three benchmark datasets—NTU RGB + D 120, PKUMMD, and UWA3DII—our model achieves classification accuracies of 94.50%, 91.23%, and 88.60% respectively, significantly outperforming state-of-the-art methods. This research lays the groundwork for future real-time HMIR systems in smart rehabilitation and medical monitoring applications.
1 Introduction
Human Motion Intention Recognition (HMIR) stands as a revolutionary computing domain that utilizes sophisticated computational models to interpret human movements (Ahmad et al., 2020). The applications of HMIR systems continue to broaden throughout surveillance security and human-computer interaction, but healthcare remains their most critical domain of deployment (Mahwish et al., 2021). HMIR shows remarkable potential to detect subtle medical movements such as sneezing and coughing while recognizing signals from back distress and neck discomfort and other specific regional pain indicators. Successful medical HMIR systems require a multi-modal architecture which combines RGB along with depth data for enhanced detection of hard-to-detect movements (Azmat and Ahmad, 2021).
HMIR stands as a revolutionary computing domain that utilizes sophisticated computational models to interpret human movements. The applications of HMIR systems continue to broaden throughout surveillance security and human-computer interaction but healthcare remains their most critical domain of deployment (M. Muneeb et al., 2023). HMIR shows remarkable potential to detect subtle medical movements such as sneezing and coughing while recognizing signals from back distress and neck discomfort and other specific regional pain indicators. Successful medical HMIR systems require a multi-modal architecture which combines RGB along with depth data for enhanced detection of hard-to-detect movements (Mahwish and Ahmad, 2023).
Applications of a multi-modal HMIR framework include RGB and depth data to achieve complete spatial and temporal details. When RGB data combines with depth data it delivers detailed visual information that is enhanced by depth details which reduce the impact of scene lighting variations and spatial occlusions (Amir et al., 2020a). The integrated system produces enhanced human action recognition capabilities which work especially well in medical settings with complex environments and poor lighting conditions (Ahmad et al., 2019).
The proposed approach leverages three key datasets—NTU RGB + D 120, PKUMMD, and UWA3DII—known for their diversity in activities and environments. These datasets which feature comprehensive patient scenarios validate model training because they expand medical application possibilities. Through the combination of RGB and depth data extraction techniques the HMIR system obtains both detailed spatial information and temporal pattern analysis. Kinetic energy alongside Histograms of Optical Flow (HOF) and angular geometric features together with eight round angles create the RGB features for analyzing movement dynamics and postural modifications. Depth features incorporate 2.5D point clouds together with random occupancy patterns and movement polygon which add to RGB data by providing strong three-dimensional spatial understanding to resist occlusions and environmental changes. The performance optimization process depends on stochastic gradient descent (SGD) for achieving efficient and accurate model convergence (Ogbuabor et al., 2018). A neuro-fuzzy classifier performs classification work by aligning neural network adaptability with fuzzy logic interpretability for identifying medical significant movements with precision. Our proposed research contributions to this field:
• This study introduces a multi-modal approach combining RGB and depth data to extract features like kinetic energy, HOF, angular geometry, and 3D spatial patterns, enabling precise analysis of human activities in medical contexts
• The proposed system incorporates stochastic gradient descent (SGD) for optimization, ensuring rapid convergence and robustness even when handling large-scale datasets, which are essential for real-world applications.
• By employing a neuro-fuzzy classifier, the research addresses the challenges of uncertainty and overlapping characteristics in medical activity recognition. This classifier enhances interpretability and precision, ensuring accurate differentiation of subtle actions.
• A comprehensive benchmark evaluation of the model takes place on NTU RGB + D 120, H3D and PKUMMD datasets to assess its performance for different medical applications. The proposed model exceeds all current benchmark methods by delivering superior outcomes for accuracy, precision, F1 score and recall metrics.
The remainder of this paper is structured as follows: Section 2 provides a comprehensive review of existing literature in the domain of Human Motion Intention Recognition (HMIR), particularly focusing on multimodal approaches and rehabilitation applications. Section 3 details the materials and methodology, including system architecture, preprocessing, segmentation, skeleton generation, and feature extraction techniques. Section 4 presents the feature optimization and classification techniques used, including stochastic gradient descent and the deep neuro-fuzzy classifier. Section 5 describes the performance evaluation setup and elaborates on the benchmark datasets used. Section 6 discusses experimental results, learning curves, and ablation studies, followed by a comparative analysis with state-of-the-art methods. Section 7 outlines the implications, potential applications, and limitations of the proposed system. Finally, Section 8 concludes the paper and suggests directions for future research.
2 Literature review
The study by Chen et al. (2021) developed a hybrid vision-based system that employed RGB and depth sensors to track stroke patient rehabilitation activities. The system processed depth sensor skeleton features together with RGB video spatiotemporal data to produce its inputs. A dual-stream convolutional neural network analyzed multiple input modalities to achieve 91% success in detecting rehabilitation exercises. The system showed drawbacks because outdoor lighting fluctuations deteriorated the quality of RGB sensor information. The study conducted by Lin et al. (2023) investigated depth data interpretation for Human Motion Intention Recognition (HMIR) in assistive technologies. Their research developed a HMIR model with depth sensors that traced joint movements to generate advanced motion pathway data for people who need help walking. The developed model performed better than traditional depth-only approaches achieving a fall detection accuracy with an F1 score of 0.94. The system faced persistent problems detecting occlusions when operating in crowded areas (Riedel et al., 2008).
A multimodal fusion approach was developed by Xefteris et al. (2024) to merge inertial sensors with an RGB camera for 3D human pose analysis in posture correction therapy. The hybrid LSTM-Random Forest fusion network operated on time-series motion data to generate accurate improper movement detection outcomes. The system needed extensive computational capacity which made its real-time deployment impractical. The research team of Jang et al. (2020) developed an assistive system powered by RGB-D sensors to track daily routines of elderly individuals at affordable prices. The ETRI-Activity3D dataset provided researchers with real-world daily elderly life action categories alongside tools to analyze large-scale activity recognition problems. The system monitored body positions with depth information as it aimed to create budget-friendly monitoring solutions that avoided invasive medical procedures. Sensor blocks and individual behavioral variations led to detection challenges for the system when monitoring subtle movements.
A system for human activity detection utilizing encrypted RGB and depth data was developed by Wang et al. (2022). The study demonstrated that real-time functionality could run smoothly when privacy protection protocols were implemented. Data encryption created restrictions that diminished the system’s measurement precision. A detection system for fainting events in elderly populations was created by depth sensors using their ability to analyze skeletal changes (Chalvatzaki et al., 2018). The combination of long short-term memory cells within the network produced accurate human gait stability predictions by analyzing fainting events. Despite these shortcomings the system showed reduced effectiveness for detecting subtle or incomplete transitions that could signal potential syncope events requiring further development.
An RGB-D-based system created by Chen and Fisher (2023) monitored older adult inactivity through detecting prolonged periods of immobility that indicated potential health issues. The lightweight camera monitoring system delivered successful results across multiple environments although issues with irregular lighting conditions and obstructed objects negatively affected its operational stability. (Elforaici et al. (2018) invented a rehabilitation monitoring system that used RGB cameras to measure repetitive motion as well as posture asymmetry. This technique demonstrated average accuracy because it processed only RGB information yet shown flexibility to illumination changes although it failed to capture depth perception.
The researchers developed a real-time fall detection system using depth sensors which found applications in medical settings according to Smith et al. (2021). The model showed high sensitivity that led to quick emergency responses. System performance suffered due to its inability to distinguish abrupt non-critical movements during activities such as sitting from genuine accidental falls. An integrated fainting detection solution was proposed by Huang et al. (2020) through combining depth sensors with thermal sensors. Strong environmental adaptability combined with excellent operational performance enabled the system to detect fainting incidents effectively. Additional system modifications were required to make the system more sensitive yet still maintain total reliability standards (Rodrigues et al., 2022).
3 Materials and methods
3.1 System methodology
The developed framework effectively obtains distinct temporal and spatial features from RGB images and depth data to establish robust activity group classification. The system transforms video frames into images to execute preprocessing activities that remove unnecessary data while obtaining crucial information. The system maintains high data quality while achieving efficient computation through its data processing sequence. The preprocessing phase consists of three key steps: image normalization, noise removal, and Region of Interest (ROI) extraction. Through a combination of image normalization and noise removal processes the data achieves enhanced refinement before ROI extraction produces distinct vital regions by filtering away nonessential background components. Body segmentation techniques enable more effective subject isolation by disassociating human figures from their surrounding environments. The determination of subjects becomes precise when depth data is used accurately throughout this processing stage because it yields detailed boundary definitions for improved subsequent analytical results. The system conducts skeleton extraction and key-point generation procedures which derive vital spatial information from segmented contours.
The system employs a method which reduces extracted features to optimize performance versus precision in identification tasks. The optimized features travel to a classifier for both accurate and efficient activity recognition. Figure 1 shows a complete model design that combines RGB and depth data to boost HMIR performance. This multi-modal approach leverages the complementary strengths of both data types, resulting in a robust system capable of accurately identifying subtle and complex human activities.
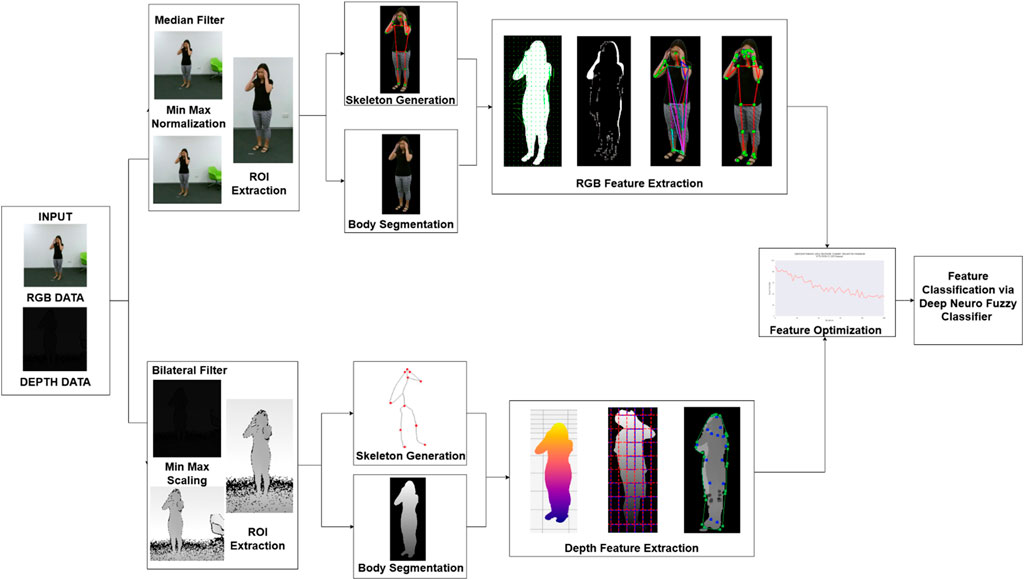
Figure 1. The architecture of the proposed system.
3.2 Image preprocessing
Image preprocessing plays a pivotal role in handling video or image-based data, as it helps eliminate irrelevant information while enhancing image quality for seamless and efficient analysis. This stage involves three primary steps: 1) Normalization, 2) Noise reduction, and 3) ROI identification. For RGB data, video sequences are first converted into individual image frames, with the number of frames per video varying significantly. Given that typical videos contain around 30 frames per second, processing all frames can lead to increased system complexity (Nida et al., 2021). To address this, we reduced the frame count to 20 keyframes by analyzing pixel intensity through histogram distribution and selecting frames with the most significant intensity variations. Mathematically expressed in Equation 1:
where
where
where
Uniform pixel value scales across all images become the focus during image normalization subsequent to denoising. Image normalization stands as an essential step because both model performance and generalization quality benefit from it significantly. Without normalization the learning process becomes controlled by features with large values that lead to inaccurate predictions. Different normalization approaches exist in architecture which support the preservation of distinct features between RGB images and depth images (S. Hafeez et al., 2021). Dimension normalization techniques function differently between RGB images where Min-Max normalization is used and depth images which require Z-Score normalization.
Through Min-Max normalization the pixel values in RGB data acquire values between 0 and 1 while preserving their initial relative strength patterns across the data set. Mathematically, this technique is expressed as follows in Equation 4:
In the above equation,
Z-Score normalization shifts depth pixel values to zero mean through scaling that depends on standard deviation. The method provides advanced depth information processing by managing the variations in scene intensity distribution patterns (Singh et al., 2022). Z-Score normalization is expressed in Equation 5:
In this equation,
The ROI extraction function operates as the final step of preprocessing (Hammad et al., 2022). The selection of regions of interest enables researchers to pinpoint image sections containing human shapes which forms a critical step in the process. The system accuracy and computational simplicity increase when ROI focuses analysis on particular image sections. The proposed design utilizes an automated method to extract target regions from RGB and depth data which maintains accurate and consistent region detection throughout multiple modalities.
Connected component analysis serves as the method for extracting ROI by detecting human silhouettes. The method arranges neighboring pixels with equivalent brightness levels to recognize objects present in the image. After component detection the algorithm calculates dimensions to create bounding boxes around identified regions (Mushhood et al., 2022). Mathematically, connected components can be represented in Equation 6:
Here,
Here,
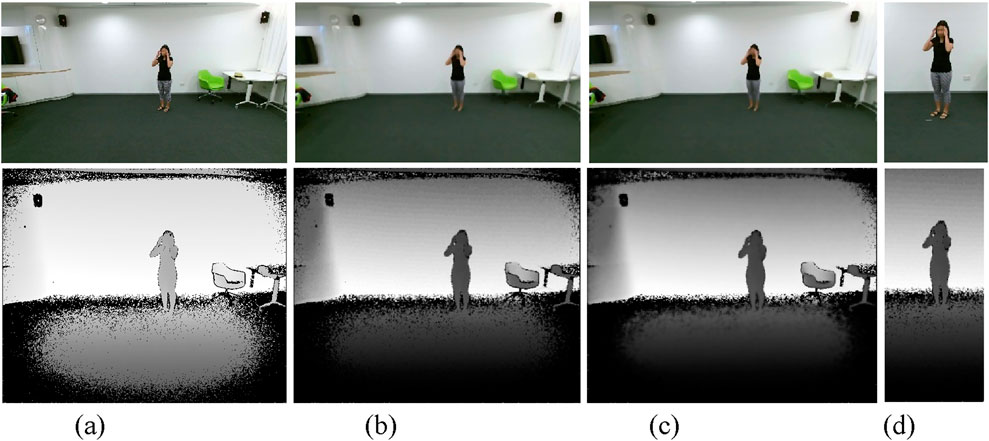
Figure 2. Visuals of Preprocessing pipeline (a) Original Frames (b) Noise Removal (c) Image Normalization (d) ROI Extraction on NTU RGB + D 120 dataset.
3.3 Body segmentation
In computer vision applications body segmentation proves essential for human interaction recognition because it creates effective boundaries between human figures and their environmental contexts (Poulose et al., 2021). Segmentation creates a human-focused section by removing extraneous background features to allow enhanced analytical accuracy and speed. Silhouettes act as fundamental image elements while all surrounding video content functions as background information. Segmentation serves an essential role by extracting meaningful features which lead to improved classification system accuracy. The work uses level set segmentation for RGB data processing while combining RGB and depth-based methods for depth data to produce exact and reliable silhouette extraction across both data types.
For RGB data, body segmentation was achieved using level set segmentation. In this method, the silhouette is represented implicitly using a level set function,
Here,
where
where
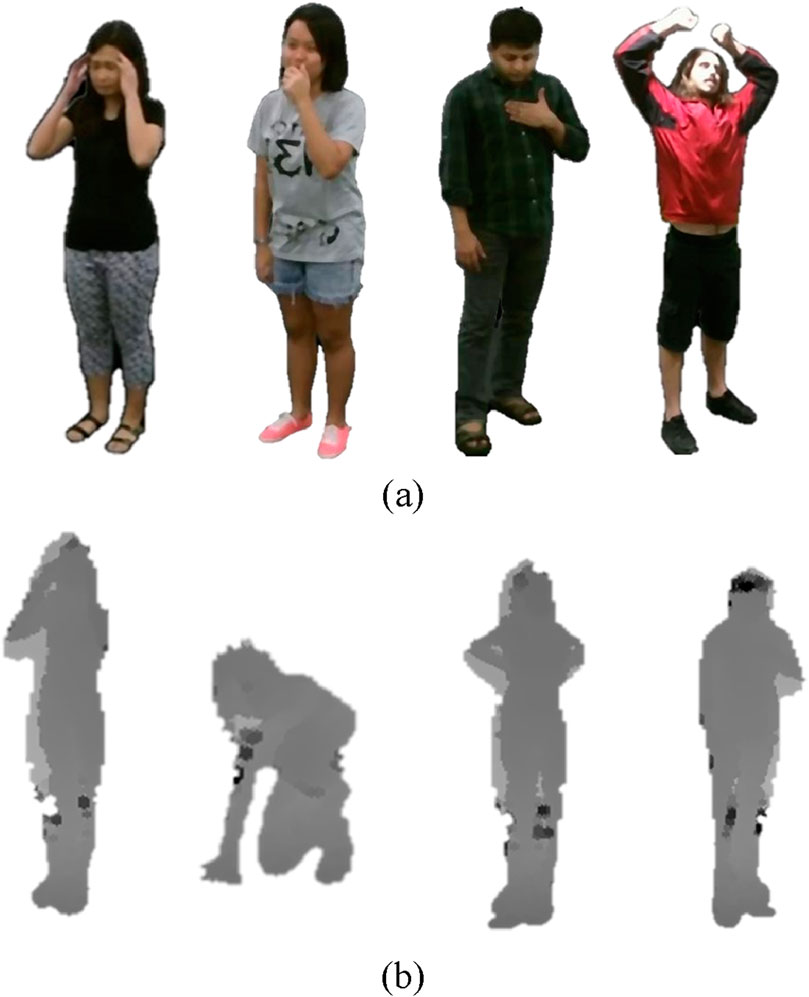
Figure 3. Illustration of Body Segmentation on RGB and Depth frames (a) Cough Falling Down Back Pain Fan self on NTU RGB + D 120 dataset. Illustration of Body Segmentation on Depth frames (b) Cough Falling Down Back Pain Fan self on NTU RGB+D 120 dataset.
Unlike RGB data, Depth data provides rich spatial information, making it effective for capturing the structure and posture of human figures. In this approach, affine transformations serve as the primary technique for segmenting depth silhouettes by aligning them spatially and geometrically within a consistent reference frame. This approach ensures precise segmentation and eliminates discrepancies caused by variations in perspective or acquisition conditions (Iqra and Ahmad, 2024).
Affine transformation is a linear mapping method that preserves geometric properties such as points, straight lines, and planes while enabling translation, scaling, rotation, and shearing. It is mathematically represented in Equation 11:
In this equation,
Segmentation starts when the affine transformation aligns depth data for the target reference frame. The alignment process follows detected high gradient magnitude regions on depth maps which represent human silhouette edges. The gradient magnitude is expressed in Equation 12:
where
This technique ensures that the segmented depth silhouette remains spatially consistent and free from misalignments, thereby providing a clear and accurate representation of the human figure. To achieve this, affine transformation is employed as a robust and mathematically precise approach for segmenting depth data. Figure 3 illustrates depth datasegmentaion effectively.
3.4 Skeleton and key point generation
Skeleton extraction is a crucial step in pose estimation and human movement analysis, allowing for the identification and structured representation of key body landmarks. By extracting skeletal features, it becomes possible to analyze motion patterns, assess posture, and understand body mechanics—essential aspects for applications in sports science, healthcare, and animation. This approach simplifies the complexity of human motion by focusing on connections between major joints, providing a concise yet informative depiction of the human form (Fakhra and Ahmad, 2024).
In this work, MediaPipe Pose was selected due to its proven high accuracy in landmark detection, achieving a normalized landmark error of less than 5% on various real-world datasets. Its two-stage architecture—comprising a lightweight CNN-based pose estimation model and a temporal smoothing mechanism—ensures stability across frames even in the presence of partial occlusion or erratic movements. This makes it particularly suitable for medical activity recognition where subtle pose changes are crucial (Laiba and Ahmad, 2024).
The MediaPipe Pose model served as the framework of choice because it detects joints and generates precise skeletal models. Although the model initially identifies 33 landmarks across the human body, a subset of these points was selected to emphasize major joints, including the head, shoulders, elbows, wrists, hips, knees, and ankles. To enhance the skeletal model, a computed “neck” point was added as the midpoint between the left and right shoulder landmarks. This point was mathematically calculated using in Equation 13:
where
where
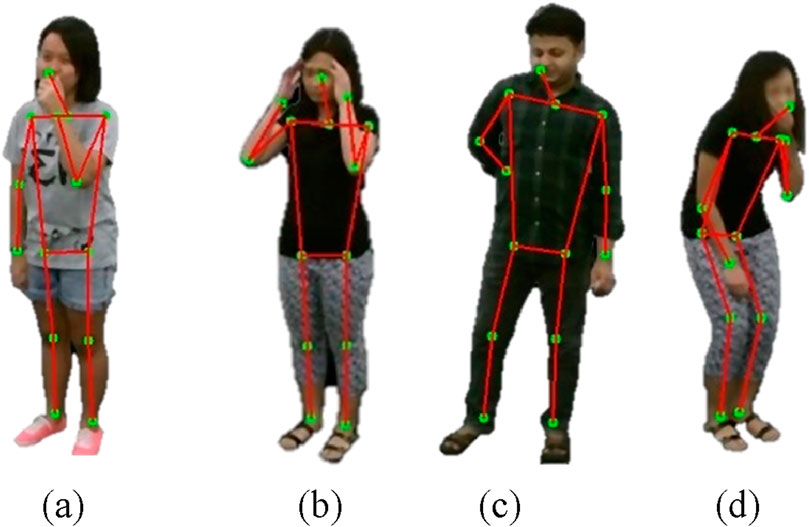
Figure 4. Illustration of Skeleton Generation on RGB frames (a) Cough (b) Headache (c) Backache (d) Vomit on NTU RGB + D 120 dataset.
The method developed by Handrich and Al-Hamadi (2015) provides an effective way to identify human body poses from depth images. The methodology builds a graph representation from 3D point clouds to compute distance measurements using geodesic paths while maintaining body pose independence. The system fits a rigid 3D torso model to the point cloud data to extract surface points before processing. Dijkstra’s algorithm computes geodesic paths to these points using edge weights defined by Euclidean distances between neighboring points (Saleha and Ahmad, 2024). Specifically, the shortest geodesic distance
where
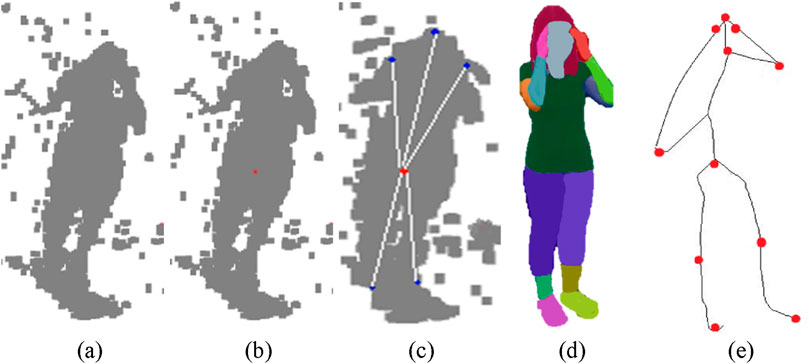
Figure 5. Illustration of Skeleton Generation on RGB frames (a) 3D Point Cloud (b) Torso Detection (c) Geodesic Distance (d) Body Part Segmentation (e) Skeleton Generation on NTU RGB + D 120 dataset.
3.5 Feature extraction
Feature extraction represents an essential building block for human interaction recognition (HMIR) systems that employ RGB and depth data. The system uses an integrated technique to acquire powerful spatial and temporal features. The analysis of motion dynamics and spatial relationships for RGB data relies on Kinetic Energy features, Histogram of Optical Flow (HOF), angular geometric features and eight round angles. Depth data processing uses Random Occupancy Patterns (ROP) in conjunction with 2.5D point clouds and Movement polygons to model global body structures and depth information (Aftab Ahmad et al., 2024). The system achieves enhanced activity recognition accuracy through its combined use of different methods which capture localized body movements while also detecting full-body spatial-temporal patterns.
3.5.1 Kinetic energy features
Human Motion Intention Recognition (HMIR) detects detailed complicated movements through kinetic energy features to recognize medical conditions involving coughing sneezing and falling alongside headache and neck pain. Medical assessments of localized and global body movements need the tracking of both linear and rotational body segment motions. Medical condition detection reaches high accuracy by using kinetic energy features to identify physical motion strength levels and pattern distribution throughout various body motions (Mujtaba and Ahmad, 2024). The total kinetic energy
where
where
where
where
Medical condition recognition benefits strongly from kinetic energy features because these features detect both forceful activities including falls and small bodily movements beyond basic position detection capabilities (Iqra et al., 2025). Changes in kinetic energy levels across multiple frames produce active motion profiles that help spot brief occurrences such as sneezes and coughs. Medical monitoring systems benefit from kinetic energy features because these metrics demonstrate both accuracy under uncertain sensor data and resistance to minor measurement errors. Figure 6 illustrates results of kinetic energy features (Liu et al., 2021).
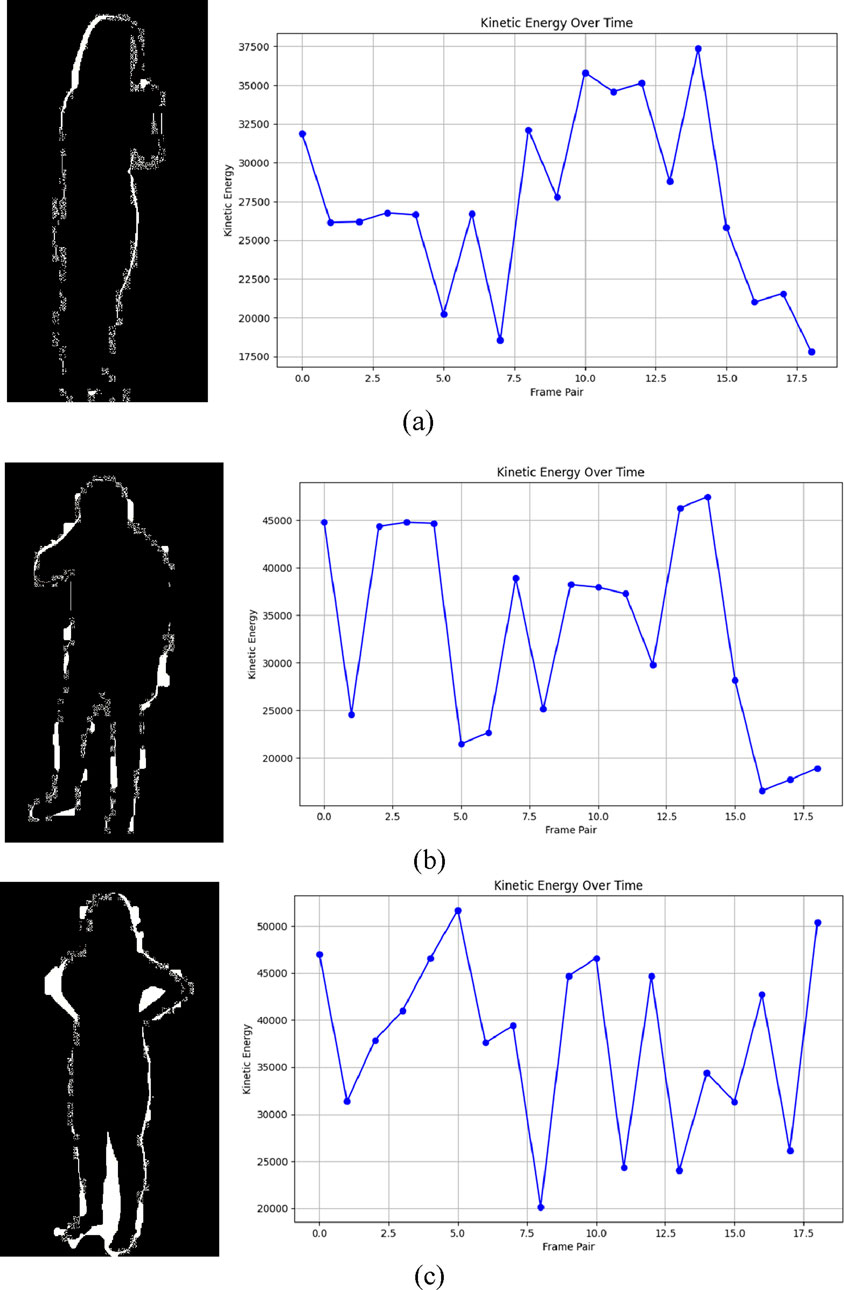
Figure 6. Illustration of Kinetic Energy over time on RGB frames (a) Cough (b) Neckache (c) Backache on NTU RGB + D 120 dataset.
3.5.2 Histogram of optical flow (HOF)
The human interaction recognition system employs HOF features to detect fundamental movements related to medical conditions and minor actions including coughing and sneezing and falls as well as head movements and neck pain. Pixel-level movement tracking operated by HOF creates exact temporal representations of moving patterns preserving detailed motion data (Nazar and Jalal, 2025). The features show particular success in recognizing activities linked to medical conditions because they effectively handle abrupt together with gradual motion changes.
The optical flow at each pixel is represented as a vector
where
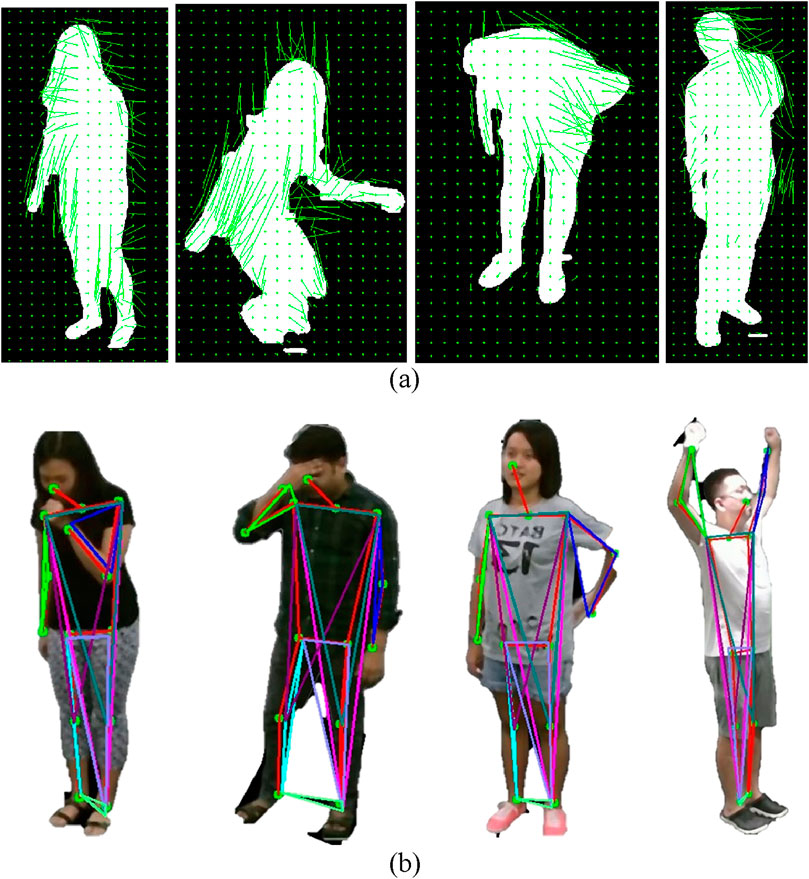
Figure 7. Illustration of HOF and Angular Geometric Features on RGB frames (a) Staggering Falling Down Backache Stretch Oneself on NTU RGB + D 120 dataset. Illustration of Histogram of Optical Flow (HOF) on RGB frames (b) Staggering Falling Down Vomit Backache on NTU RGB+D 120 dataset.
3.5.3 Angular geometric features
The quantification of skeletal point angular relationships serves as an essential factor for HMIR through angular geometric features. The system derives these features from essential body landmarks which enable the capture of human body structure and geometric alignment throughout activities. The analysis of angular relationships between predefined body segment sets through angular geometric features generates a robust motion dynamic and postural representation that helps identify medical conditions through specific physical activities (Rafiq and Jalal, 2025).
Extraction of skeletal points during earlier processing enables researchers to create meaningful triangular geometric structures linking joint relationships. Multiple triangles in this model emerge when researchers choose three relevant body landmarks starting from shoulder-elbow-wrist to hip-knee-ankle. For instance, triangles such as (11,13,15) and (23,25,27) represent upper limb and lower limb configurations, respectively, while (11,29,12) and (23,29,24) capture torso and hip alignments. The arranged triangles measure the entire human body position space to reveal essential details about regional and complete body movements (Laiba and Jalal, 2025).
The calculation of angles at triangle vertices allows researchers to measure body segment connections. Given three points
where
3.5.4 Eight round angles
The eight round angles use a powerful spatial encoding technique which documents directional adjustments according to the 8 Freeman Chain Code principles. The quantification of position and direction relationships through spatial features remains essential for HMIR because these features show how body positions modify human silhouette structure and orientation. This method tracks skeletal posture modifications by analyzing both curvatures and directional shifts across skeletal features which creates a universal spatial motion description (Ashraf et al., 2025).
The system starts by utilizing skeletal points from previous steps that align with important joints together with body landmarks. The points extracted from the human body silhouette function as references for silhouette outline creations which are used as inputs in the 8 Freeman Chain Code algorithm. The algorithm represents the curve by dividing the space around each skeletal point into eight equally spaced angular sectors, the eight principal compass directions: 0°, 45°, 90°, 135°, 180°, 225°, 270°, and 315°. Each curve point receives directional assignments through its relative neighbor position which generates a sequence of directional codes (Mohammed et al., 2025).
For a given boundary point b with n contour points, the curve
where
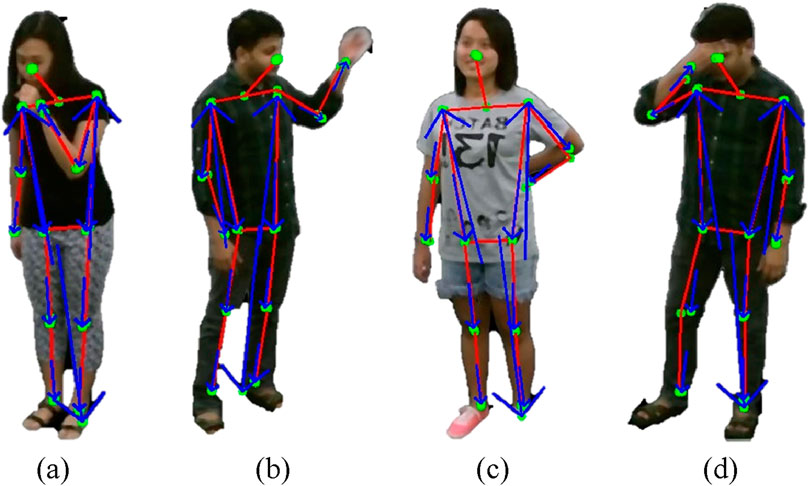
Figure 8. Illustration of Eight Round Angles on RGB frames (a) Cough (b) Fanself (c) Backache (d) Headache on NTU RGB + D 120 dataset.
3.5.5 2.5-D point clouds
2.The 5D point cloud system provides an effective approach to extract depth features which support HMIR applications in medical settings for coughing, sneezing, falling and back and neck pain assessment (Sumbul et al., 2025). The single-perspective view of 2.5D point clouds captures body surface depth while maintaining efficient spatial representation when compared to the complete coverage needed in 3D point clouds. The representation works well with medical HMIR applications because it maintains critical motion details with minimal processing complexity and data redundancy.
The depth map
where
where
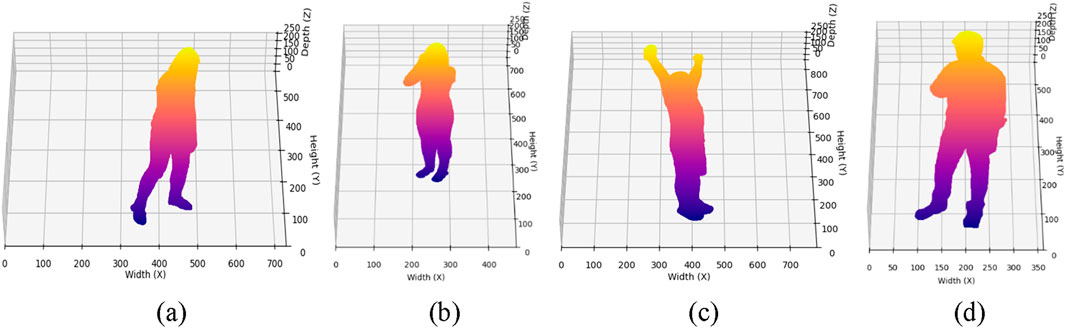
Figure 9. Illustration of 2.5D Point Cloud on Depth frames (a) Staggering (b) Cough (c) Stretch Oneself (d) Chest Pain on NTU RGB + D 120 dataset.
3.5.6 Random occupancy pattern (ROP)
Random Occupancy Pattern (ROP) features effectively describe the spatiotemporal dynamics of HMIR while demonstrating particular performance in medical condition detection including coughing sneezing and falls and posture-induced pain (Wang et al., 2012; Li et al., 2017). The tracking of voxel occupancy patterns across time in a 3D voxel grid delivers robust motion representation and enables accurate activity recognition because ROP features demonstrate resistance to sensor variability and noise.
The voxel grid is defined by partitioning the spatial domain into uniform cells, and the occupancy of each voxel at time
where
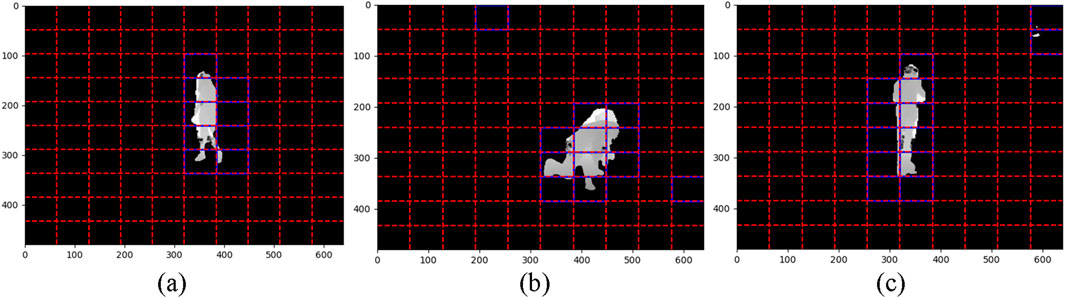
Figure 10. Illustration of ROP Features on Depth frames (a) Staggering (b) falling down (c) Chest Pain on NTU RGB + D 120 dataset.
3.5.7 Movement polygons
Movement polygons serve as an effective skeleton-based feature extraction methodology that extracts information for HMIR analyses from depth sensor data (Tayyab and Jalal, 2025). Movement polygons display skeletal spatial motion dynamics through three-dimensional joint position projection to two-dimensional movement polygons. A set of three-dimensional skeletal joint positions
To reduce the dimensionality of the data, the distance of each polygon boundary point from its centroid is computed as Equation 28:
where
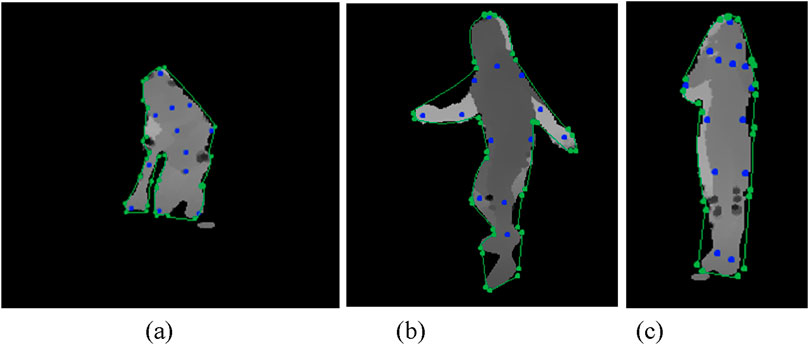
Figure 11. Illustration of 2.5D Point Cloud on Depth frames (a) Falling Down (b) Staggering (c) Headache on NTU RGB + D 120 dataset.
Below is the proposed summary Table 1 that outlines the effects of each feature described in Section 3 of your manuscript. This table provides a concise yet informative overview of the modalities, motion characteristics, and contributions of each feature type to the HMIR task:
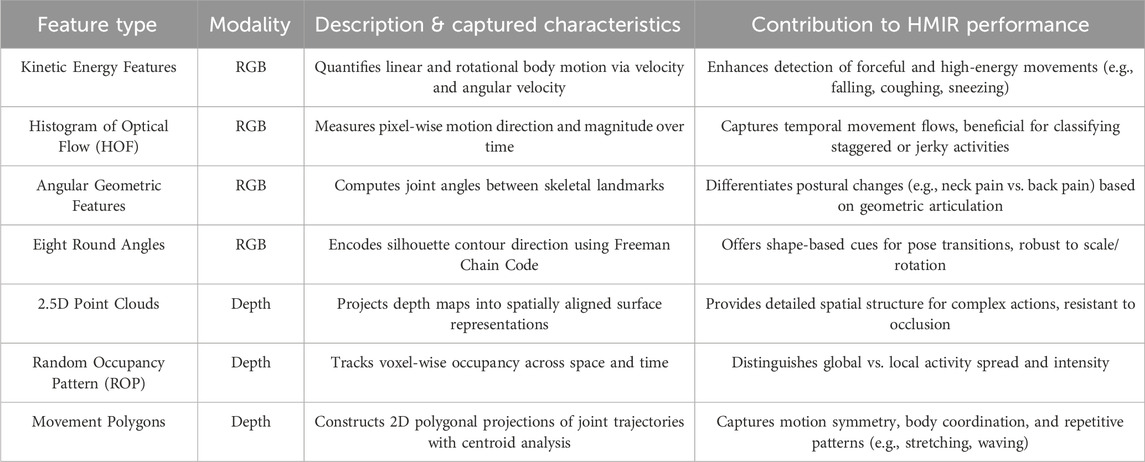
Table 1. Summary of feature effects on human motion intention recognition.
3.6 Feature optimization via stochastic gradient descent
After extracting robust full-body and point-based features, these features are concatenated to form a comprehensive feature vector. However, the resulting feature vector resides in a high-dimensional space, which introduces challenges related to computational efficiency and system performance. To address this, dimensionality reduction through feature optimization techniques is applied, ensuring improved computational efficiency and enhanced system performance (J. Ahmad et al., 2025).
In the proposed architecture, Stochastic Gradient Descent (SGD) is employed as the optimization algorithm. SGD is a highly efficient technique for training machine learning models, particularly suitable for large-scale datasets and complex parameter spaces. Unlike traditional gradient descent methods, which compute parameter updates based on the gradient of the loss function over the entire dataset, SGD updates the model parameters iteratively using individual training examples or small mini batches of data (Laiba and Jalal, 2025; Laiba et al., 2025). This iterative approach is computationally efficient and accelerates convergence, particularly for high-dimensional optimization problems. The parameter update rule for SGD is formalized as Equation 29:
where
The utilization of SGD for feature optimization not only reduces the dimensionality of the feature vector but also facilitates faster convergence to optimal parameter values, even in the presence of large-scale and high-dimensional data (M. Javeed et al., 2024). Furthermore, the stochastic nature of the updates introduces noise into the optimization process, which can help the model escape local minima and converge towards better global minima in non-convex loss landscapes. Figure 12 illustrates SDG results.
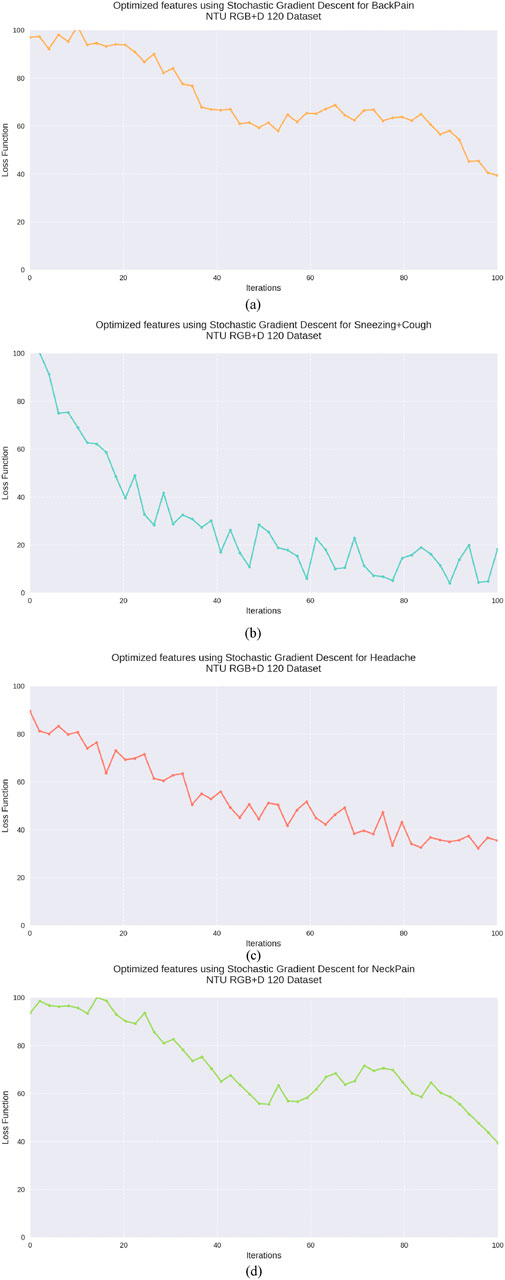
Figure 12. Graphical Representation of Stochastic Gradient Descent (a) Back Pain (b) Sneezing + Cough (c) Headache (d) Neck Pain on NTU RGB + D 120 dataset.
3.7 Feature classification via deep neuro fuzzy classifier
The classification task was performed using the Deep Neuro-Fuzzy Classifier, a hybrid model that integrates the learning capabilities of neural networks with the interpretability of fuzzy logic systems. This approach leverages the strengths of both paradigms to achieve robust performance on complex datasets (Israr and Ahmad, 2024; Wang et al., 2019).
The classifier operates by mapping input features into fuzzy membership values, which are then processed through neural layers for adaptive learning. Let the input feature vector be represented as
where
where in Equation 32
where
where
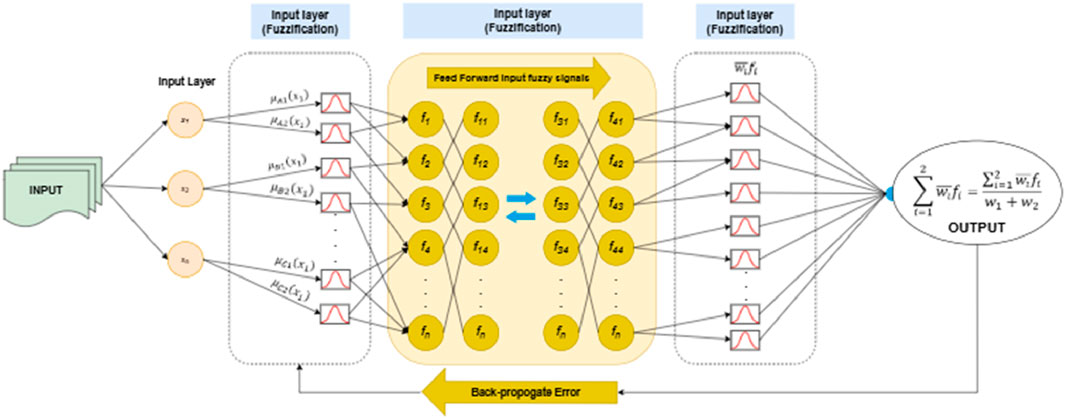
Figure 13. Architecture of Deep neuro Fuzzy Classifier.
3.7.1 Hyperparameter tuning
To optimize system performance, we performed empirical tuning of key hyperparameters in both the feature optimization and classification stages using grid search on the NTU RGB + D 120 validation set. For the Stochastic Gradient Descent (SGD) algorithm, we evaluated learning rates in the range (0.001, 0.01, 0.05, 0.1) and selected 0.01 as optimal for convergence speed and stability. Mini-batch sizes were tested in (16, 32, 64), with 32 providing the best trade-off between gradient stability and training time. The maximum number of epochs was set to 100 with early stopping criteria based on validation loss stagnation for 10 consecutive epochs.
For the Deep Neuro-Fuzzy Classifier, we fine-tuned the number of fuzzy rules in the range (5, 10, 20), fuzzification factor in (1.5, 2.0, 2.5), and Gaussian membership function spread parameter σ ∈ [0.2, 1.0]. Optimal performance was achieved with 10 rules, a fuzzification factor of 2.0, and σ = 0.5. Regularization weight was set to 0.01 to prevent overfitting, and the classifier was trained using the Adam optimizer with an initial learning rate of 0.001. All hyperparameters were selected based on average performance across 5-fold cross-validation to ensure robustness and generalizability.
4 Performance evaluation
The proposed system was rigorously assessed using three benchmark datasets: NTU RGB + D, PKU-MMD, and UWA3DII. The system underwent complete performance evaluation using confusion matrices and precision, recall metrics and F1 scores. Multiple evaluation metrics showed that the system performed exceptionally well to reach its defined goals.
The evaluation took place on a Windows 11 64-bit platform using an Intel Xeon processor and 32 GB memory with an Intel i7 11th Gen CPU that featured 8 cores. The implemented system optimized its computation pipelines for efficient dataset handling and real-time processing needs.
4.1 Dataset description
4.1.1 NTU RGB + D 120 dataset
The NTU RGB + D 120 dataset operates as the leading action recognition benchmark that supports research into both fundamental body actions and health-related body movements. The dataset contains 114,480 video samples showing 120 different action categories performed by 40 individuals. The dataset classifies actions into three main groups: The NTU RGB + D dataset comprises 82 daily activities such as face wiping and coin tossing alongside 12 health-specific actions including sneezing and neck pain incidents and 26 interactive actions that include punching and hugging and kicking. A total of three camera positions were used to record actions at −45°, 0° and +45° horizontal angles to expand viewpoint diversity. Notable for its multi-modal nature, the dataset includes depth information, 3D skeletal joint data, RGB video frames, and infrared sequences, making it especially valuable for medical condition monitoring and patient care research. Illustration of some interactions in Figure 14a.
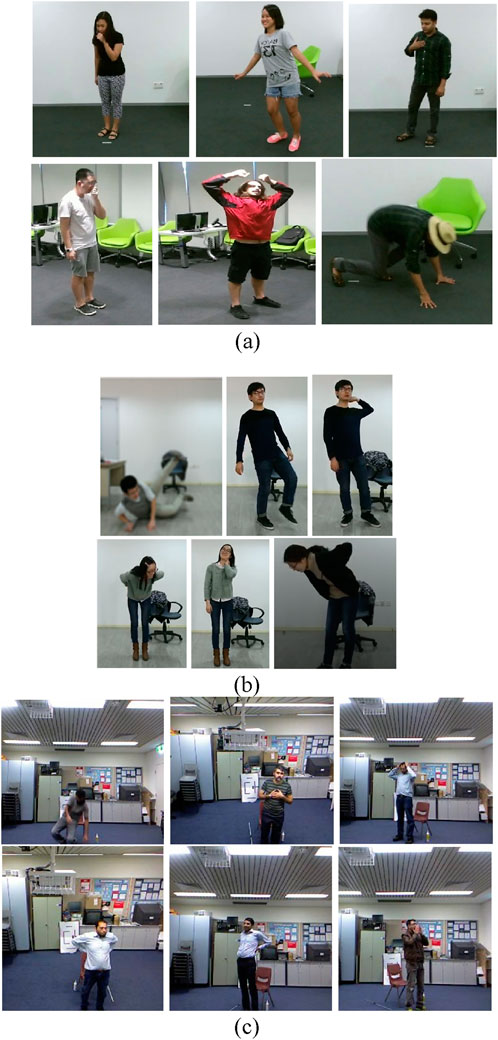
Figure 14. Some examples frames of (a) NTU RGB + D 120 (b) PKUMMD (c) UWA3DII dataset.
4.1.2 PKU-MMD dataset
The PKU-MMD dataset is a large-scale human action analysis dataset with a focus on health-related behavior recognition and multi-modality. Captured by the Kinect v2 sensor, it has two phases of data collection. Phase 1 has 1,076 video sequences from 51 action classes, with 66 subjects captured from three camera views. The dataset contains close to 20,000 action instances, consisting of over 5.4 million frames, with a mean video duration of 3–4 min at 30 FPS. Actions are categorized into 41 daily activities (waving, drinking, etc.) and 10 interactive behaviors (hugging, handshakes, etc.). Of specific interest to rehabilitation and health, the dataset captures both daily activity and important interactions crucial to the study of patient-to-patient and patient-to-caregiver communication. Its structured design enables precise evaluation of motion patterns vital for healthcare applications. Illustration of some interactions in Figure 14b.
4.1.3 UWA3DII dataset
The UWA3DII dataset was developed to enhance HMIR by incorporating diverse motion patterns and multi-view. Thirty movements including walking while holding the chest and sneezing and falling comprise the dataset which includes ten participants. Each action was recorded four times using four different views: The dataset presents views from both the front and left, right and top surfaces. The continuous Kinect sensor data collection has produced a dataset with natural motion variation which serves medical purposes for fall detection and movement disorder assessment. Clinical medical research benefits from this dataset because self-occlusions combined with action similarities create processing complexity. Illustration of some interactions in Figure 14c.
5 Results and analysis
The experimental section is organized into five comprehensive analyses to evaluate the effectiveness and robustness of the proposed multi-modal HMIR framework. Initially, confusion matrix analysis is conducted across the NTU RGB + D 120, PKU-MMD, and UWA3DII datasets to provide a detailed breakdown of classification performance across multiple medical activity classes. This is followed by the computation of key evaluation metrics including precision, recall, and F1-score, offering insights into the model’s balance between sensitivity and specificity. To further assess the training dynamics and generalization capability, a learning curve analysis is presented, illustrating the relationship between training and validation loss over multiple epochs. An ablation study is then performed to quantify the contribution of each core module and feature types such as preprocessing, segmentation, skeletal modeling, and both RGB and depth-based features—by systematically removing each component and evaluating its impact on overall classification accuracy. Finally, the proposed model is benchmarked against several state-of-the-art approaches using standardized datasets, demonstrating its superior performance in terms of classification accuracy, robustness to occlusion, and adaptability to complex human motion patterns. This experimental organization ensures a comprehensive and objective evaluation of the proposed framework’s capabilities in real-world rehabilitation monitoring applications.
5.1 Experiment 1: confusion matrix
The first experiment shows confusion matrix results for both datasets. The confusion matrix shows a simple graphical view of the classifier’s performance as it shows both successful and unsuccessful classification instances per class. Tables 2–4 present the confusion matrix for NTU RGB + D 120, PKU-MMD and UWA3DII Dataset.
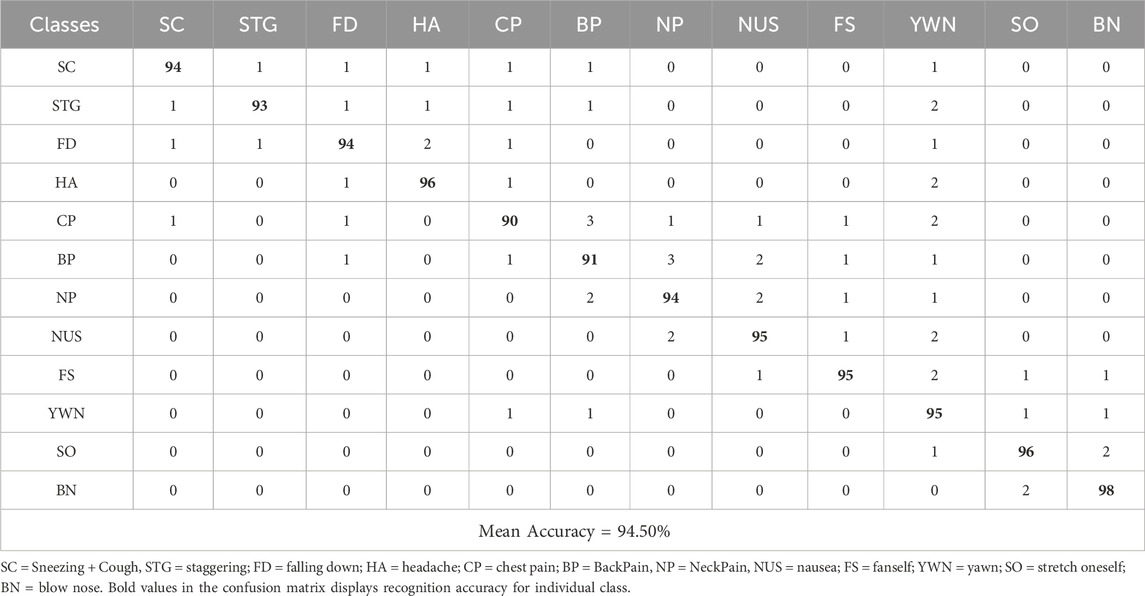
Table 2. Confusion matrix calculated over the NTU RGB + D 120 Dataset.
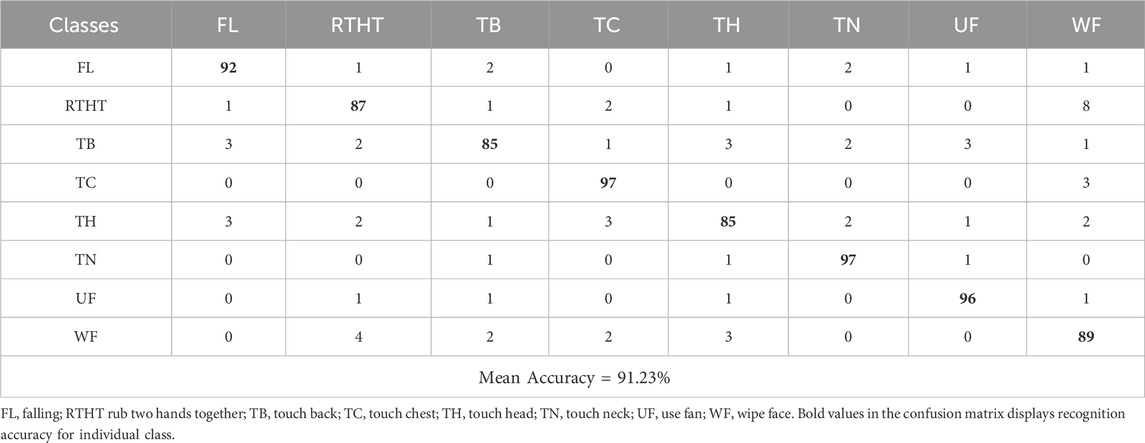
Table 3. Confusion matrix calculated over PKU MMD Dataset.
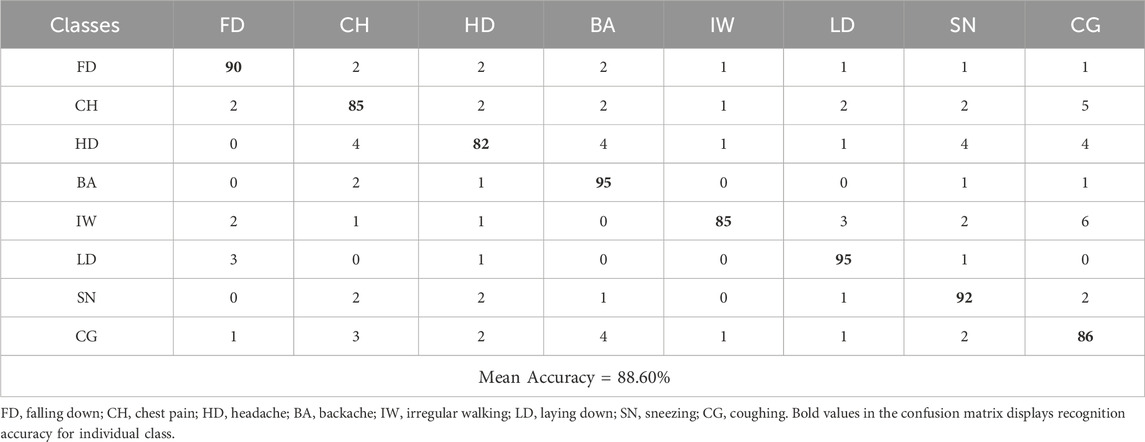
Table 4. Confusion matrix calculated over UWA3DII - Dataset.
5.2 Experiment 2: Precision, recall and F1 score
The F1 score, recall and precision metrics were represented through line graphs in Figure 15 across the NTU RGB + D 120, PKU MMD and UWA3DII datasets. These visualizations provide a performance comparison of the proposed model which demonstrates its effectiveness across multiple datasets alongside various performance benchmarks.
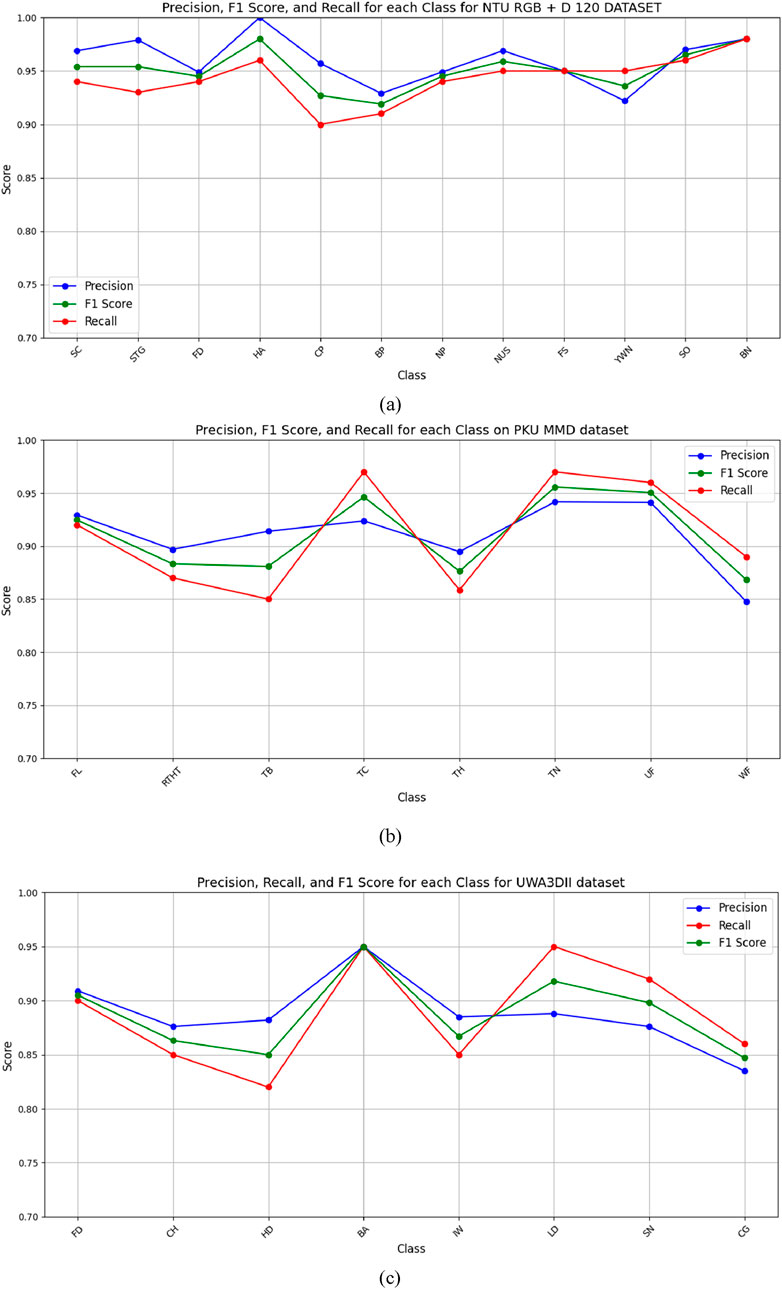
Figure 15. Line graph for Precision, Recall, and F1 score for (a) NTURGB+D120, (b) PKUMMD and (c) UWA3DII Datasets.
5.2.1 Discussion and analysis
Experimental findings demonstrate that the proposed Multi-Modal Vision Sensor Framework successfully identifies human interactions. The framework combines RGB and depth data through state-of-the-art feature extraction methods while using stochastic gradient descent optimization and a deep neuro-fuzzy classifier. The proposed model delivers landmark accuracy results of 94.50% on NTU RGB + D 120% and 91.23% on PKUMMD and 88.60% on UWA3DII.
Upon examining the confusion matrices, we can observe that actions such as falling down, coughing, and sneezing achieve high classification accuracy since they have very unique motion patterns. Nevertheless, there do exist some activities, particularly ones with fine-grained or overlapping movements, such as neck pain and back pain, with mild misclassifications. This occurs due to the similarity in skeletal movement and the challenge of discriminating against fine-grained actions in complex situations.
The precision, recall, and F1 scores further validate the system’s reliability, with consistently high performance across all datasets. The feature extraction techniques, particularly kinetic energy and angular geometric features, significantly contribute to differentiating motion dynamics in human activities. Additionally, the use of depth-based features like 2.5D point clouds and random occupancy patterns enhances robustness against environmental variations such as occlusions and lighting changes.
Despite the promising results, some limitations persist. Occlusion handling and real-time adaptability remain areas for improvement, especially in highly dynamic environments. Future work can explore the integration of self-attention mechanisms, adaptive feature selection, and transformer-based architectures to further refine the classification process.
5.3 Experiment 3: learning curve analysis
To assess the convergence behavior and generalization capacity of the proposed model, we present the learning curve in Figure 16. The graph plots training and validation loss over successive epochs during training on the NTU RGB + D 120 dataset. As observed, the training loss steadily decreases while the validation loss follows a similar trend with minimal divergence. This indicates that the model avoids overfitting and maintains generalization across unseen samples.
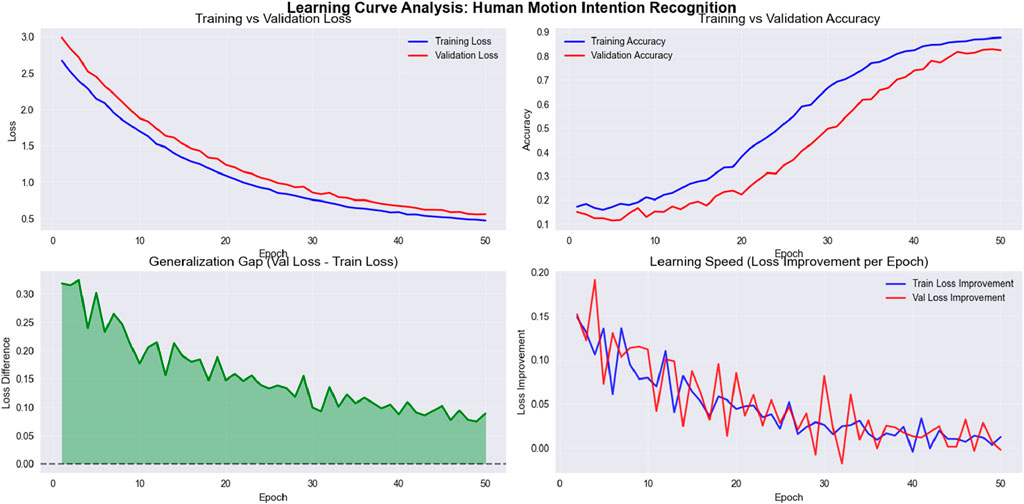
Figure 16. Line graph for Precision, Recall, and F1 score for NTU RGB + D 120, PKU MMD and UWA3DII Datasets.
The learning curve exhibits several noteworthy characteristics. First, both training and validation losses decrease rapidly during the initial epochs (1–15), demonstrating efficient parameter optimization. This is followed by a more gradual reduction phase (epochs 15–35), where the model fine-tunes its parameters. Finally, the curves stabilize in the later epochs (35–50), suggesting convergence to an optimal solution.
The minimal gap between training and validation losses, particularly in the later stages of training, confirms the model’s ability to generalize effectively. This robust generalization is especially significant given the multimodal nature of the NTU RGB + D 120 dataset, which contains complex action patterns across 120 different classes performed by multiple subjects.
The smooth convergence curve also confirms the effectiveness of the feature optimization via stochastic gradient descent (SGD) with momentum. The consistent descent in both curves without significant oscillations demonstrates that our selected learning rate and batch size provide stable optimization dynamics. Furthermore, the fuzzy membership functions effectively capture the inherent variations in skeletal motion patterns, allowing the model to adapt to the multimodal distribution of action classes.
These results support the model’s reliability for large-scale, multimodal data and validate our architectural design choices. The convergence behavior suggests that the model has successfully learned discriminative features from skeletal data while avoiding both underfitting and overfitting issues that commonly plague deep learning approaches to action recognition.
5.4 Experiment 4: ablation study
To evaluate the relative contribution of each module and feature type used in the proposed Human Motion Intention Recognition (HIR) framework, we conducted an extensive ablation study across three benchmark datasets: NTU RGB + D 120, PKUMMD, and UWA3DII. This study involved systematically removing (one at a time) each major component in the feature extraction and processing pipeline and measuring the resulting classification accuracy.
Table 5 summarizes the results. The baseline (“Full Model”) includes all components: Preprocessing (PR), Skeleton and Key Point Generation (SG), Silhouette Segmentation (SS), Kinetic Energy (KE), Histogram of Optical Flow (HOF), Angular Geometric Features (AGF), Eight Round Angles (ERA), 2.5D Point Clouds (PC), Random Occupancy Patterns (ROP), and Movement Polygons (MP). Each subsequent experiment removes one component while keeping the others intact (denoted as “WT”—Without).
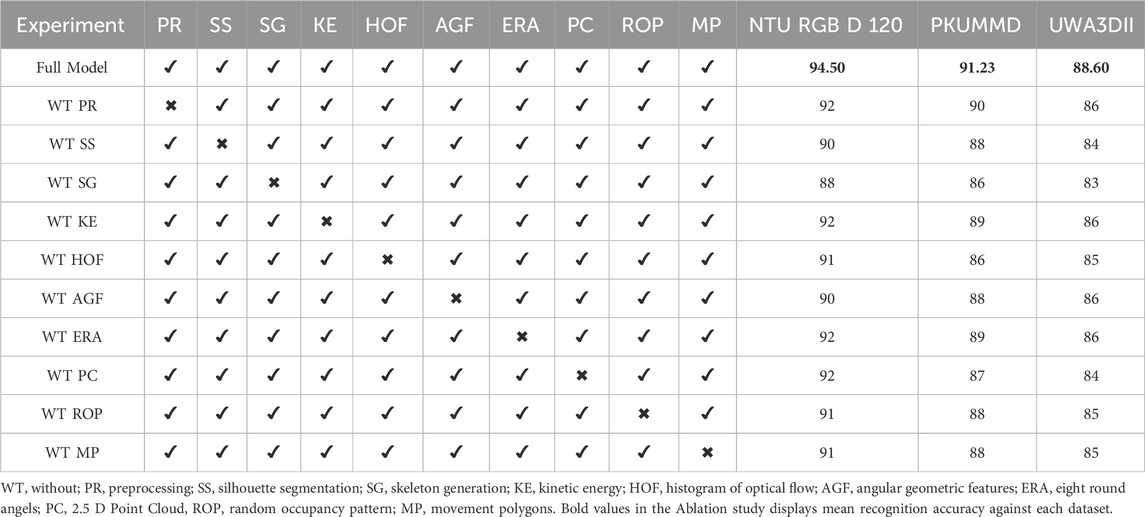
Table 5. Ablation study results (accuracy %).
5.5 Experiment 5: comparisons with state of the art (SOTA)
To validate the superiority of our proposed system, we compare its performance against state-of-the-art (SOTA) models in human interaction recognition. Table 6 presents a comparative analysis of classification accuracy across NTU RGB + D 120, PKUMMD, and UWA3DII datasets.
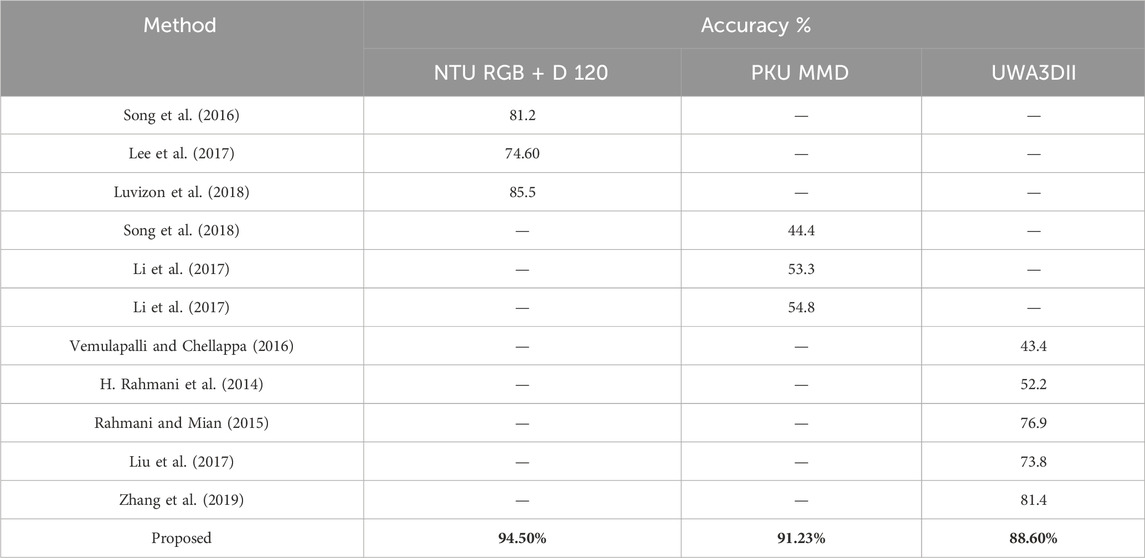
Table 6. Comparisons with state of the art using deep learning models.
The results indicate that our method outperforms existing SOTA models across all datasets, achieving a significant accuracy improvement of 8%–15% compared to leading approaches. The fusion of multi-modal data, advanced feature engineering, and deep neuro-fuzzy classification contributes to this enhanced performance. Unlike recurrent neural networks (RNNs) or purely CNN-based approaches, our system integrates spatio-temporal features with interpretable fuzzy logic, making it well-suited for real-world applications in healthcare and assistive technologies (Song et al., 2018).
Future enhancements may involve fine-tuning fuzzy rule sets, incorporating transformer-based spatio-temporal processing, and optimizing model inference for edge-based applications to further improve performance and scalability.
6 Implication of proposed system
The proposed Multi-Modal Vision Sensor Framework demonstrates widespread utility across healthcare as well as surveillance applications while also serving rehabilitation purposes and assistive technology needs. The system achieves robust and accurate HMIR of complex actions alongside medical activities such as sneezing, coughing, back pain, and fainting through depth data integration with RGB information. Precise detection of minimal movements enables useful applications during patient monitoring and elderly care and rehabilitation treatments that rely on accurate medical activity recognition.
The system advances medical patient monitoring through real-time tracking because it identifies activities which indicate patient distress or discomfort. Its ability to distinguish postural discomfort and abnormal movements and falls makes this system appropriate for smart hospitals and home rehabilitation systems and wearable health monitoring systems. The system achieves better classification accuracy by employing advanced feature extraction methods together with the deep neuro-fuzzy classifier in difficult conditions involving occluded views or reduced visibility. The system provides dependable detection of medical priority activities which proves essential for both intervention effectiveness and prompt medical response.
The system extends its effects throughout security and surveillance operations. The system provides excellent capabilities for automated security solutions and workplace safety applications because it effectively detects emergency actions from standard activities. The integration of spatio-temporal features alongside multi-modal sensor data enhances real-world anomaly detection capabilities which creates improved public safety and incident response systems.
The framework demonstrates strong deployment potential because its high accuracy results emerged from multiple benchmark testing scenarios. The integration of aggressive feature extraction with optimized classification and multi-modal data fusion establishes solid groundwork for building future intelligent monitoring systems. Future work should enhance real-time adaptability and increase dataset diversity and implement transformer-based frameworks which improve recognition in dynamic complex environments.
7 Limitations
While the proposed multi-modal rehabilitation monitoring system demonstrates high accuracy and robustness across multiple datasets, it also presents certain limitations. Firstly, the system’s performance may degrade under severe occlusion or poor-quality depth sensing, which affects silhouette and skeleton extraction accuracy. Secondly, although we evaluated the framework across three diverse datasets, cross-dataset generalization may require further domain adaptation or fine-tuning, especially for unseen medical gestures or patient-specific behaviors. Additionally, the integration of multiple feature streams and the deep neuro-fuzzy classifier introduces computational overhead, which may limit real-time applicability in low-resource or embedded edge devices. Lastly, the system has not yet been tested in live clinical or at-home rehabilitation scenarios, which will be an essential next step for validating practical deployment and usability.
8 Conclusion
A novel and extensive approach to HMIR for medical applications was developed through joint RGB and depth analysis of the NTU RGB + D 120, PKUMMD, and UWA3DII datasets. The system includes advanced feature engineering methodologies which integrate kinetic energy alongside histogram of optical flow (HOF) features and angular geometric features along with eight round angles for RGB data and 2.5D cloud ROP features together with Movement polygons of depth data. A complete analysis of activity recognition emerges through the combination of SGD optimization with deep neuro-fuzzy classifier and the introduced features which enables high accuracy medical activity recognition. Experimental results demonstrate that the proposed framework proves both durable and versatile by producing excellent results across numerous datasets. This framework demonstrates both operational precision and computational effectiveness which makes it an attractive solution for practical medical assistance technologies.
Data availability statement
Publicly available datasets were analyzed in this study. This data can be found here: https://github.com/shahroudy/NTURGB-D; https://www.research.lancs.ac.uk/portal/en/datasets/uwa3dii-dataset-skeleton(33507bb7-e3e4-41c2-8175-4bf58f801c4f).html.
Author contributions
SK: Data curation, Methodology, Writing – original draft. MA: Formal Analysis, Writing – review and editing. YA: Conceptualization, Writing – review and editing. AA: Resources, Writing – review and editing. NA: Project administration, Writing – review and editing. AJ: Supervision, Writing – review and editing. HL: Validation, Writing – review and editing.
Funding
The author(s) declare that financial support was received for the research and/or publication of this article. The APC was funded by the Open Access Initiative of the University of Bremen and the DFG via SuUB Bremen. This research is supported and funded by Princess Nourah bint Abdulrahman University Researchers Supporting Project number (PNURSP2025R410), Princess Nourah bint Abdulrahman University, Riyadh, Saudi Arabia. The authors extend their appreciation to the Deanship of Research and Graduate Studies at King Khalid University for funding this work through Large Group Project under grant number (RGP.2/568/45).
Conflict of interest
Author HL was employed by Guodian Nanjing Automation Co., Ltd.
The remaining authors declare that the research was conducted in the absence of any commercial or financial relationships that could be construed as a potential conflict of interest.
Generative AI statement
The author(s) declare that no Generative AI was used in the creation of this manuscript.
Publisher’s note
All claims expressed in this article are solely those of the authors and do not necessarily represent those of their affiliated organizations, or those of the publisher, the editors and the reviewers. Any product that may be evaluated in this article, or claim that may be made by its manufacturer, is not guaranteed or endorsed by the publisher.
References
Aftab Ahmad, A., Shaheryar, N., and Ahmad, J. (2024). Robust exercise-based telerehabilitation for elderly healthcare survives. ICET, 1–6. doi:10.1109/icet63392.2024.10935118
Ahmad, J., Amir, N., and Bobasu, S. (2019). Human body parts estimation and detection for physical sports movements. ICCCDS, 104–109. doi:10.1109/c-code.2019.8680993
Ahmad, J., Khalid, N., and Kim, K. (2020). Automatic recognition of human interaction via hybrid descriptors and maximum entropy markov model using depth sensors. Entropy 22, 817. doi:10.3390/e22080817
Ahmad, J., Khan, D., Sadiq, T., Alotaibi, M., Refa Alotaibi, S., Aljuaid, H., et al. (2025). IoT-based multisensors fusion for activity recognition via key features and hybrid transfer learning. IEEE Access 13, 14727–14742. doi:10.1109/access.2024.3524431
Ahmed, M., Jabeen, S., and Abdulmalek, M. (2023). Advances in multimodal HAR for healthcare applications. Sensors 23 (4), 2120. doi:10.1109/SMC53654.2022.9945513
Aljuaid, H., Akhter, I., Alsufyani, N., Shorfuzzaman, M., Alarfaj, M., Alnowaiser, K., et al. (2023). Postures anomaly tracking and prediction learning model over crowd data analytics. PeerJ CS 9, e1355. doi:10.7717/peerj-cs.1355
Amir, N., Jalal, A., and Kim, K. (2020a). Accurate physical activity recognition using multidimensional features and markov model for smart health fitness. Symmetry 12, 1766. doi:10.3390/sym12111766
Amir, N., Jalal, A., and Kim, K. (2020b). Human actions tracking and recognition based on body parts detection via artificial neural network. ICACS, 1–6. doi:10.1109/icacs47775.2020.9055951
Ashraf, , Najam, S., Sadiq, T., Algamdi, S., Aljuaid, H., Rahman, H., et al. (2025). A novel telerehabilitation system for physical exercise monitoring in elderly healthcare. IEEE Access 13, 9120–9133. doi:10.1109/access.2025.3526710
Awan, A. A. (2024). Robust exercise-based telerehabilitation for elderly healthcare services. ICET. doi:10.1109/ICET63392.2024.10935118
Azmat, U., and Ahmad, J. (2021). Smartphone inertial sensors for human locomotion activity recognition based on template matching and codebook generation. Rawalpindi, Pakistan ICCT.
Bonato, P., Feipel, V., Corniani, G., Arin-Bal, G., and Leardini, A. (2024). Position paper on how technology for human motion analysis and relevant clinical applications have evolved over the past decades: striking a balance between accuracy and convenience. Gait Posture 104, 83–92. doi:10.1016/j.gaitpost.2024.06.007
Chalvatzaki, G., Kargakos, A., and Tzafestas, C. S. (2018). Human-centered modeling of daily activities for smart homes. arXiv Prepr. arXiv:1812.00252. doi:10.1007/978-3-319-01904-8_6-1
Chen, X., and Fisher, R. B. (2023). Monitoring inactivity in older adults using RGB-D data. arXiv Prepr. arXiv:2311.02249. doi:10.1145/3674848
Chen, X., Shi, Y., Wang, Y., and Cheng, Y. (2021). Deep learning-based image automatic assessment and nursing of upper limb motor function in stroke patients. J. Healthc. Eng. 2021, 1–6. doi:10.1155/2021/9059411
Elforaici, L., Bouzid, M., and Bouzid, A. (2018). A vision-based system for monitoring rehabilitation exercises. arXiv Prepr. arXiv:1810.00308. doi:10.1002/9781118536148.ch10
Fakhra, N., and Ahmad, J. (2024). Wearable sensor-based activity recognition over statistical features selection and MLP approach. ETECTE, 1–7. doi:10.1109/etecte63967.2024.10823986
Fatima, B. (2024). Crowd anomaly detection via multiscale features and zero-shot learning in public surveillance. ICET24.
Goecks, J., Liu, Y., and Juan, D. (2022). HAR in clinical settings: challenges and opportunities. Med. Image Anal. 60, 101592. doi:10.3390/app132413009
Hafeez, S., Jalal, A., and Kamal, S. (2021). Multi-fusion sensors for action recognition based on discriminative motion cues and random forest. ComTech, 91–96. doi:10.1109/comtech52583.2021.9616668
Hammad, R. (2022). Home automation-based health assessment along gesture recognition via inertial sensors. CMC. USA
Handrich, S., and Al-Hamadi, A. (2015). Full-body human pose estimation by combining geodesic distances and 3D-point cloud registration. Adv. Concepts Intell. Vis. Syst. Conf., 287–298. doi:10.1007/978-3-319-25903-1_25
Huang, Y., Wang, C., and Wang, W. (2020). Fusion of depth and thermal sensors for fainting detection. arXiv preprint arXiv:2003.01920.
Iqra, , and Ahmad, J. (2024). Multi-modal sensors fusion for fall detection and action recognition in indoor environment. Rawalpindi, Pakistan ETECTE.
Iqra, , Alhasson, H. F., Alharbi, S. S., Alatiyyah, M., AlHammadi, D. A., Jalal, A., et al. (2025). Advanced biosignal-RGB fusion with adaptive neurofuzzy classification for high-precision action recognition. IEEE Access 13, 57287–57310. doi:10.1109/access.2025.3553196
Iqra, , and Jalal, A. (2025). Indoor smart home action recognition over multi-videos surveillance system. ICACS, 1–7. doi:10.1109/icacs64902.2025.10937890
Israr, , and Ahmad, J. (2024). Abnormal action recognition in crowd scenes via deep data mining and random forest. ICACS. doi:10.1109/ICACS55311.2023.10089674
Jang, J., Kim, J., Kim, C., and Kim, H. J. (2020). ETRI-Activity3D: a large-scale RGB-D dataset for robots to recognize daily activities of the elderly. IEEE/RSJ Int. Conf. Intell. Robots Syst. (IROS), 9343–9348. doi:10.1109/IROS45743.2020.9341160
Javeed, M. (2024). Biosensor-based multimodal deep human locomotion decoding via internet of healthcare things. Macromachines. doi:10.3390/mi14122204
Laiba, Z., and Ahmad, J. (2024). Drone-based human surveillance using YOLOv5 and multi-features. FIT, 1–6. doi:10.1109/fit63703.2024.10838465
Laiba, Z., and Ahmad, J. (2024). Remote sensing based human monitoring and recognition over public surveillance. ETECTE, 1–6. doi:10.1109/etecte63967.2024.10823828
Laiba, Z., Alhasson, H. F., Alnusayri, M., Alatiyyah, M., Abdulaziz Alhammadi, D., Jalal, A., et al. (2025). Remote sensing surveillance using multilevel feature fusion and deep neural network. IEEE Access 13, 38282–38300. doi:10.1109/access.2025.3542435
Laiba, Z., and Jalal, A. (2025). Unmanned aerial vehicle for human surveillance using multi-features and neuro-fuzzy classifier. INMIC. doi:10.1109/INMIC64792.2024.11004353
Lee, I., Kim, D., Kang, S., and Lee, S. (2017). “Ensemble deep learning for skeleton-based action recognition using temporal sliding LSTM networks,” in Proceedings of the IEEE international conference on computer vision. Venice, Italy, 1012–1020.
Li, B., Chen, H., Chen, Y., Dai, Y., and He, M. (2017). “Skeleton boxes: solving skeleton-based action detection with a single deep convolutional neural network,” in Proceedings of the ICMEW, Hong Kong, 10–14 July 2017, 613–616.
Li, C., Huang, Q., Li, X., and Wu, Q. (2021). Human action recognition based on multi-scale feature maps from depth video sequences. Multimed. Tools Appl. 80, 32111–32130. doi:10.1007/s11042-021-11193-4
Li, C., Zhong, Q., Xie, D., and Pu, S. (2017). “Skeleton-based action recognition with convolutional neural networks,” in Proceedings of the ICMEW, Hong Kong, 10–14 July 2017, 597–600.
Lin, J. J., Hsu, C. K., Hsu, W. L., Tsao, T. C., Wang, F. C., and Yen, J. Y. (2023). Machine learning for human motion intention detection. Sensors (Basel), 23, 7203. doi:10.3390/s23167203
Liu, H., Singh, R., and Han, J. (2021). Vision-based pain recognition using deep learning. IEEE Access 9, 12134–12148. doi:10.1109/TNSRE.2019.2939596
Liu, M., Liu, H., and Chen, C. (2017). Enhanced skeleton visualization for view invariant human action recognition. Pattern Recognit. 68, 346–362. doi:10.1016/j.patcog.2017.02.030
Luvizon, D. C., Picard, D., and Tabia, H. (2018). “2D/3D pose estimation and action recognition using multitask deep learning,” in Proceedings of the IEEE/CVF conference on computer vision and pattern recognition. Salt Lake City, UT, USA, 5137–5146.
Mahwish, P., and Ahmad, J. (2023). Artificial neural network for human object interaction system over aerial images. IEEE ICACS, 1–6. doi:10.1109/icacs55311.2023.10089722
Mahwish, P., Ahmad, J., and Kim, K. (2021). Hybrid algorithm for multi people counting and tracking for smart surveillance. IEEE IBCAST, 530–535. doi:10.1109/ibcast51254.2021.9393171
Min, W., Wang, J., Han, T., and Li, Z. (2020). A review on human activity recognition using vision-based methods. Multimedia Tools Appl. 79, 15583–15604. doi:10.1155/2017/3090343
Mohammed, , Zahoor, L., AlQahtani, Y., Alshahrani, A., AlHammadi, D. A., Jalal, A., et al. (2025). Unmanned aerial vehicle based multi-person detection via deep neural network models. Front. Neurorobotics 19, 1582995. doi:10.3389/fnbot.2025.1582995
Muhammad, H., Alshammari, N. S., Alharbi, S. S., Wahid, W., Almujally, N. A., Jalal, A., et al. (2025). Human pose estimation and event recognition via feature extraction and neuro-fuzzy classifier. IEEE Access 13, 37328–37343. doi:10.1109/access.2025.3538691
Muhammad, H., Wasim, W., and Ahmad, J. (2024). Robust human pose estimation and action recognition over multi-level perceptron. ETECTE, 1–6. doi:10.1109/inmic64792.2024.11004378
Muhammad Hamdan, A., and Ahmad, J. (2024). Human-human interaction recognition using mask R-CNN and multi-class SVM. ETECTE, 1–6. doi:10.1109/etecte63967.2024.10823924
Mujtaba, G., and Ahmad, J. (2024). UAV-Based road traffic monitoring via FCN segmentation and deepsort for smart cities. ICIC. Available online at: https://www.researchgate.net/publication/385798438_UAV-based_Road_Traffic_Monitoring_via_FCN_Segmentation_and_Deepsort_for_Smart_Cities
Mujtaba, G., Hanzla, M., and Jalal, A. (2025). Drone surveillance for intelligent multi-vehicles monitoring and classification. ICACS, 1–6. doi:10.1109/icacs64902.2025.10937829
Muneeb, M., Hammad, R., and Jalal, A. (2023). Automate appliances via gestures recognition for elderly living assistance. IEEE Conf. Adv. Comput. Sci. doi:10.1109/ICACS55311.2023.10089778
Mushhood, M. (2022). Body worn sensors for health gaming and e-learning in virtual reality. United States CMC.
Mushhood, M., Saqib, S., Aladfaj, M., Alatiyyah, M. H., Alnowaiser, K., Aljuaid, H., et al. (2023). Body-worn sensors for recognizing physical sports activities in exergaming via deep learning model. IEEE Access 11, 12460–12473. doi:10.1109/access.2023.3239692
Naif, M., Azmat, U., Alazeb, A., Alhasson, H. F., Alabdullah, B., Rahman, H., et al. (2025). IoT powered RNN for improved human activity recognition with enhanced localization and classification. Sci. Rep. 15, 10328. doi:10.1038/s41598-025-94689-5
Nazar, F., and Jalal, A. (2025). Wearable sensors-based activity classification for intelligent healthcare monitoring. ICACS, 1–7. doi:10.1109/icacs64902.2025.10937805
Nida, K., Gochoo, M., Ahmad, J., and Kim, K. (2021). Modeling two-person segmentation and locomotion for stereoscopic action identification: a sustainable video surveillance system. Sustainability 13, 970. doi:10.3390/su13020970
Ogbuabor, G., Riedel, S., and Singh, K. (2018). A comparative study of machine learning approaches for HAR. Expert Syst. Appl. 104, 235–247. Available online at: https://www.researchgate.net/publication/343322958_A_Comparative_Study_of_Machine_Learning_Approaches_for_Human_Activity_Recognition
Poulose, A., Kim, J. H., and Han, D. S. (2021). HIT HAR: human image threshing machine for human activity recognition using deep learning models. Comput. Intell. Neurosci. 2022, 1–21. doi:10.1155/2022/1808990
Rafiq, M., and Jalal, A. (2024). Wearable sensors-based human locomotion and indoor localization with smartphone. 1, 6. doi:10.1109/icet63392.2024.10935024
Rafiq, M., and Jalal, A. (2025). IoT-based smartphone sensors for accurate locomotion and localization recognition. Rawalpindi, Pakistan ICACS.
Rahmani, H., Mahmood, A., Huynh, D. Q., and Mian, A. (2014). “HOPC: histogram of oriented principal components of 3D point clouds for action recognition,” in Proceedings of the European conference on computer vision (ECCV), 2014, 742–757. doi:10.1007/978-3-319-10605-2_48
Rahmani, H., and Mian, A. (2015). “Learning a non-linear knowledge transfer model for cross-view action recognition,” in Proceedings of the IEEE conference on computer vision and pattern recognition (CVPR).
Raza, A. (2023). Multiple pedestrian detection and tracking in night vision surveillance systems. United States CMC.
Riedel, S., Ahmed, M., and Abdulmalek, M. (2008). HAR datasets: a comprehensive review. J. Mach. Learn. Res. 9, 1123–1145. doi:10.1111/exsy.13680
Rodrigues, P., Bobade, P., and Han, Y. (2022). Multimodal sensor fusion for healthcare monitoring. Biomed. Signal Process. Control 71, 102984.
Saleha, K., and Ahmad, J. (2024). A novel human interaction recognition via composite features and max entropy classifier. ICET, 1–6. doi:10.1109/icet63392.2024.10935229
Saleha, K., Alhasson, H. F., Alnusayri, M., Alatiyyah, M., Aljuaid, H., Jalal, A., et al. (2025). Vision sensor for automatic recognition of human activities via hybrid features and multi-class support vector machine. Sensors 25, 200. doi:10.3390/s25010200
Saleha, K., and Jalal, A. (2024). Multi-feature descriptors for human interaction recognition in outdoor environments. ICECT, 1–6. doi:10.1109/icect61618.2024.10581264
Seerat, K., Rafique, A. A., and Jalal, A. (2025). Wearable sensors for exergaming physical exercise monitoring via dynamic features. ComTech, 1–6. doi:10.1109/comtech65062.2025.11034496
Singh, A., Kumar, R., and Sinha, S. (2022). A novel hybrid model for HAR using RGB and depth data. Int. J. Comput. Vis. 130 (3), 765–789. doi:10.3390/s20113305
Smith, J., Brown, L., and Lee, K. (2021). Real-time fall detection using depth sensors in clinical settings. arXiv Prepr. arXiv:2103.01920. doi:10.1109/TASE.2018.2861382
Song, C., Lan, T., Xing, J., Zeng, W., and Liu, J. (2016). “An end-to-end spatio-temporal attention model for human action recognition from skeleton data,” in Proceedings of the thirtieth AAAI conference on artificial intelligence. Phoenix, AZ, USA, 1–8.
Song, S., Lan, C., Xing, J., Zeng, W., and Liu, J. (2018). Spatio-temporal attention-based LSTM networks for 3D action recognition and detection. IEEE Trans. Image Process. 27, 3459–3471. doi:10.1109/TIP.2018.2818328
Sumbul, K., Rafique, A. A., and Jalal, A. (2025). Health gaming based activity recognition using body-worn sensors via artificial neural network. ComTech, 1–6. doi:10.1109/comtech65062.2025.11034569
Tayyab, M., and Ahmad, J. (2024). A novel sports event recognition using pose estimation and multi-fused features. ETECTE, 1–6. doi:10.1109/etecte63967.2024.10823792
Tayyab, M., Alateyah, S. A., Alnusayri, M., Alatiyyah, M., AlHammadi, D. A., Jalal, A., et al. (2025). A hybrid approach for sports activity recognition using key body descriptors and hybrid deep learning classifier. Sensors 25, 441. doi:10.3390/s25020441
Tayyab, M., and Jalal, A. (2024). Advanced gait event recognition and pose estimation model through deep learning. ICIT24, 1–6. doi:10.1109/icit63607.2024.10859703
Tayyab, M., and Jalal, A. (2025). Disabled rehabilitation monitoring and patients healthcare recognition using machine learning. ICACS, 1–7. doi:10.1109/icacs64902.2025.10937871
Vemulapalli, R., and Chellappa, R. (2016). “Rolling rotations for recognizing human actions from 3D skeletal data,” in Proceedings of the IEEE conference on computer vision and pattern recognition (CVPR).
Wang, J., Chen, Y., Hao, S., Peng, X., and Hu, L. (2019). Deep learning for sensor-based activity recognition: a survey. Pattern Recognit. Lett. 119, 3–11. doi:10.1016/j.patrec.2018.02.010
Wang, J., Liu, Z., Chorowski, J., Chen, Z., and Wu, Y. (2012). “Robust 3D action recognition with random occupancy patterns,”Comput. Vis.–ECCV, Berlin, Heidelberg, 872–885. doi:10.3390/s22030764
Wang, W., Zhang, Y., and Wang, L. (2022). Privacy-preserving human activity recognition using encrypted RGB-D data. arXiv Prepr. arXiv:2203.01920. doi:10.3390/s22030764
Xefteris, V. R., Syropoulou, A. C., Pistola, T., Kasnesis, P., Poulios, I., Tsanousa, A., et al. (2024). Multimodal fusion of inertial sensors and single RGB camera data for 3D human pose estimation based on a hybrid LSTM-random forest fusion network. Internet Things 29, 101465. doi:10.1016/j.iot.2024.101465
Zahra, S. (2025). Revolutionizing exergaming: cutting-Edge gesture recognition for immersive fitness experiences. ComTech. Available online at: https://www.researchgate.net/publication/389285197_Revolutionizing_Exergaming_Cutting-Edge_Gesture_Recognition_for_Immersive_Fitness_Experiences
Zhang, P., Lan, C., Xing, J., Zeng, W., Xue, J., and Zheng, N. (2019). View adaptive neural networks for high performance skeleton-based human action recognition. IEEE Trans. Pattern Analysis Mach. Intell. 41 (8), 1963–1978. doi:10.1109/TPAMI.2019.2896631
Keywords: motion intension recognition, human machine interaction, rehabilitation, multimodal sensor integration motion intension recognition, multimodal sensor integration
Citation: Kamal S, Alshehri M, AlQahtani Y, Alshahrani A, Almujally NA, Jalal A and Liu H (2025) A novel multi-modal rehabilitation monitoring over human motion intention recognition. Front. Bioeng. Biotechnol. 13:1568690. doi: 10.3389/fbioe.2025.1568690
Received: 30 January 2025; Accepted: 19 June 2025;
Published: 17 July 2025.
Edited by:
Keyi Wang, Harbin Engineering University, ChinaReviewed by:
Alwin Poulose, Indian Institute of Science Education and Research, IndiaZiyi Yang, Jilin University, China
Copyright © 2025 Kamal, Alshehri, AlQahtani, Alshahrani, Almujally, Jalal and Liu. This is an open-access article distributed under the terms of the Creative Commons Attribution License (CC BY). The use, distribution or reproduction in other forums is permitted, provided the original author(s) and the copyright owner(s) are credited and that the original publication in this journal is cited, in accordance with accepted academic practice. No use, distribution or reproduction is permitted which does not comply with these terms.
*Correspondence: Abdulmonem Alshahrani, YWJkdWxtb25lbUBra3UuZWR1LnNh; Ahmad Jalal, YWhtYWRqYWxhbEBtYWlsLmF1LmVkdS5waw==; Hui Liu, aHVpLmxpdUB1bmktYnJlbWVuLmRl