 Eryn D. Gerber1*
 Chun-Kai Huang
- 1Biodynamics Research Laboratory, University of Kansas, Lawrence, KS, United States
- 2Department of Physical Therapy, Rehabilitation Science, and Athletic Training, University of Kansas Medical Center, Kansas City, KS, United States
- 3Department of Engineering, Messiah University, Mechanicsburg, PA, United States
- 4Department of Mechanical Engineering, University of Kansas, Lawrence, KS, United States
One of the primary contributors to falls in older adults is somatosensory degeneration. A method of center-of-pressure (COP) analysis, rambling-trembling (RM-TR) decomposition, has the potential to significantly improve balance deficit detection. However, its ability to capture sensation-driven changes to postural sway is not well understood. Therefore, the objective of this study is to quantify the effects of progressive simulated somatosensory deficit on COP, RM and TR time series. Fifty-one healthy adults (aged 22.10 ± 1.88 years) completed three 60-s double-limb, quiet standing trials with eyes closed for each randomly-ordered foam thickness condition (no foam, 1/8″, 1/4″, 1/2″, and 1″). Foot-floor kinetic data was collected at 100 Hz using two 6-axis force plates and a 16-bit A/D acquisition system. The data were filtered with a 2nd-order 10 Hz low-pass Butterworth filter and used to calculate COP, RM and TR time series. Range, root-mean-square (RMS), and sample entropy (SampEn) were calculated for each time series. Repeated measures analyses of variance, with α = 0.05, were conducted to compare foam condition for each measure (range, RMS, and SampEn). Results showed range and RMS increased with foam thickness; thicker foams (F3–F4) produced larger increases than thinner foams (F1–F2), with more prominent effects in the AP than ML direction. SampEn decreased as foam thickness increased, but not for all comparisons or measures. TR consistently showed the greatest SampEn values compared with COP and RM. Our findings suggest that RM-TR decomposition can isolate distinct biomechanical contributions to postural sway, each influenced independently by somatosensation. Future work should continue to explore the utility of RM-TR decomposition, particularly in aging populations, to advance our understanding of sensory contributions to postural control and assess its viability as a clinical assessment tool.
1 Introduction
In the United States, 28.7% of adults aged 65 or older experience at least one fall every year, amounting to an estimated 29 million falls (Bergen et al., 2016). Efforts have been made to identify fall risk in older adults, but a significant portion of the population remains unknowingly vulnerable to falls due to the limitations of current clinical assessment techniques. In fact, there remains an estimated 8%–12% risk of fall over the course of the year for individuals with no identifiable risk factors (Chang and Ganz, 2007; Robbins et al., 1989).
As we age, our bodies experience a multitude of changes that ultimately result in a progressive decline in physiological function (Francis et al., 2017; Henry and Baudry, 2019). Among these changes is somatosensory loss. Somatosensation allows us to perceive environmental and proprioceptive cues that inform postural adjustments, maintain balance, and move safely and efficiently (Inglis et al., 1994; Simoneau et al., 1995). As functionality of this system declines, the risk of severe falls, injury, and death increase substantially (Ambrose et al., 2013; Shaffer and Harrison, 2007).
To address the prevalence of falls in older adults and remedy the limitations of existing clinical assessment techniques, many researchers have attempted to quantify balance by measuring movement of the body’s center-of-pressure (COP) (Winter et al., 1990). COP analysis has been used extensively in the study of human balance, including in investigations of aging and disease, but is limited in its clinical implications due to the uncertainty in its link to the underlying physiological mechanisms that dictate it Collins and De Luca (1993). Because of this disconnect, many of these analyses lack the reliability and sensitivity, on a patient-by-patient basis, to capture age-related balance changes, especially those that occur prior to the first fall (Lin et al., 2008; Norris et al., 2005; Visser et al., 2008).
Rambling-trembling (RM-TR) decomposition of the COP has the potential to significantly improve balance deficit detection due to its proposed neurological link to postural control, segmenting the COP into an equilibrium point (RM), and oscillations around this point (TR; Ferronato and Barela, 2011; Mochizuki et al., 2006; Tahayori et al., 2012; Zatsiorsky and Duarte, 1999). RM is thought to represent the body’s equilibrium trajectory, or reference point, constantly moving and resetting, even in quiet stance. TR, on the other hand, is reminiscent of forces determined by intrinsic, pseudo-elastic musculoskeletal properties (Zatsiorsky and Duarte, 1999). Some scientists have gone as far as to attribute RM and TR components of sway to the central and peripheral nervous systems (or supraspinal and spinal), respectively (Bolbecker et al., 2018; Shin and Sosnoff, 2017; Tahayori et al., 2012). Due to these potential neuromotor links, the insights provided by RM-TR decomposition could advance our ability to identify fall risk in older adults and those suffering from somatosensory loss, but additional research is needed.
Previous work has indicated the presence of distinct sway behavior between COP, RM, and TR time series, with substantial differences in sensitivity based on severity of simulated deficit (Gerber et al., 2022). However, additional analyses are needed to further understand these time series and their empirical and clinical value in this application. One such method is nonlinear analysis, in which the system dynamics are assessed in terms of their temporal and frequency structures (Stergiou, 2016). Sample entropy (SampEn) is a commonly used nonlinear measure of human movement, describing the predictability, or regularity, of the system (Richman and Moorman, 2000). Under this framework, increasing SampEn values signify decreasing system predictability and decreasing values imply increasing predictability. This measure has shown success in its ability to distinguish healthy versus pathological conditions, as well as the influence of sensory input, and thus shows promise in fall risk assessment as it relates to sensory integration of balance (Borg and Laxaback, 2010; Ramdani et al., 2009; Roerdink et al., 2006). Therefore, this study builds upon and expands our previous study (Gerber et al., 2022), with a focused analysis of SampEn to identify COP changes driven by somatosensory input.
The objective of this study is to quantify COP, RM and TR time series using measures of range, variability (i.e., root-mean-square, RMS), and predictability (SampEn) across various levels of simulated somatosensory deficit. It is hypothesized that range, variability, and predictability will increase with foam thickness for all time series. The findings are expected to advance understanding of postural control and inform future fall risk assessment strategies.
2 Materials and methods
2.1 Participants
Fifty-two healthy young adults (aged 22.10 ± 1.88 years, 23 females) volunteered to participate in the study. All participants were informed of the study’s risks and benefits, and provided written consent, as approved by the University of Kansas Institutional Review Board. Individuals with a history of neurological disorder, balance impairments, or significant injury to the trunk or lower extremities were excluded from participation. One subject was removed from the study due to significant deviation from outcome measure means (>3σ), resulting in a final sample size of 51.
2.2 Experimental conditions
Participants stood naturally, with arms at the sides, eyes closed, head upright, and a standardized stance width of 17 cm and a 20° angle between feet (McIlroy and Maki, 1997). Five randomly-ordered foam thickness conditions (no foam, 1/8″, 1/4″, 1/2″, and 1″, corresponding to F0, F1, F2, F3, and F4, respectively) were used to simulate increasing severity of somatosensory deficit by decreasing the reliability of cutaneous somatosensory input, as demonstrated in the literature (Patel et al., 2008; Simoneau et al., 1995). Each foam pad was 12 inches in length and width with a density of 2 lbf/ft3 and pressure to compress 25% of 4 psi (McMaster-Carr, Chicago, IL). Experimental foam thicknesses were selected according to commercial availability as to maintain material property continuity and prevent potential slippage during testing. Three 60-s trials were completed for every foam condition, with 5-min seated breaks after every sixth trial.
2.3 Data collection and analysis
Foot-floor kinetic data was collected at 100 Hz using two 6-axis AMTI force plates (Watertown, MA, United States) and a 16-bit A/D acquisition system (Cambridge Electronic Design, Cambridge, England, United Kingdom). All data were filtered with a 2nd order 10 Hz low-pass Butterworth filter and used to calculate COP (Winter et al., 1990) using MATLAB software (Mathworks, Natick, MA).
Force and COP position trajectories were then used to calculate RM and TR time series in the AP and ML directions (Zatsiorsky and Duarte, 1999). To compute RM and TR, we first identified the time points when the horizontal ground reaction force (Fhor) crossed zero, corresponding to instant equilibrium points. The COP positions at these points were then and interpolated using a cubic spline function to form RM trajectory. The TR trajectory was subsequently derived by subtracting the RM trajectory from the original COP signal. This process was conducted in both the anteroposterior (AP) and mediolateral directions (ML).
Three primary measures were calculated: (1) range, (2) root-mean-square (RMS), and (3) sample entropy (SampEn). Based on recommendations from Nichols (2020), SampEn was calculated according to input parameters were set to m = 2 and r = 0.0986. Calculations for each measure were done independently in the AP- and ML-directions and for each level of foam thickness. Table 1 provides a convenient key to acronyms referenced throughout this work.
Table 1. Common acronyms used throughout analysis.
2.4 Statistical analysis
With 95% power and an effect size of 0.25, the minimum sample size for this study was determined to be 45 participants, which was exceeded during recruitment. The repeated measure analysis of variance (ANOVA) was adopted to compare the impact of different foam thickness and on balance. Tukey’s HSD post hoc tests were used to determine statistical significance among foam thicknesses (F0–F4). Statistical significance for each test was set to α = 0.05.
3 Results
Figures 1–3 depict the average range, RMS, and SampEn values for each foam condition in the AP- and ML-directions for COP, RM, and TR time series, respectively. In general, range and RMS increased across foam thickness for all time series, while SampEn decreased.
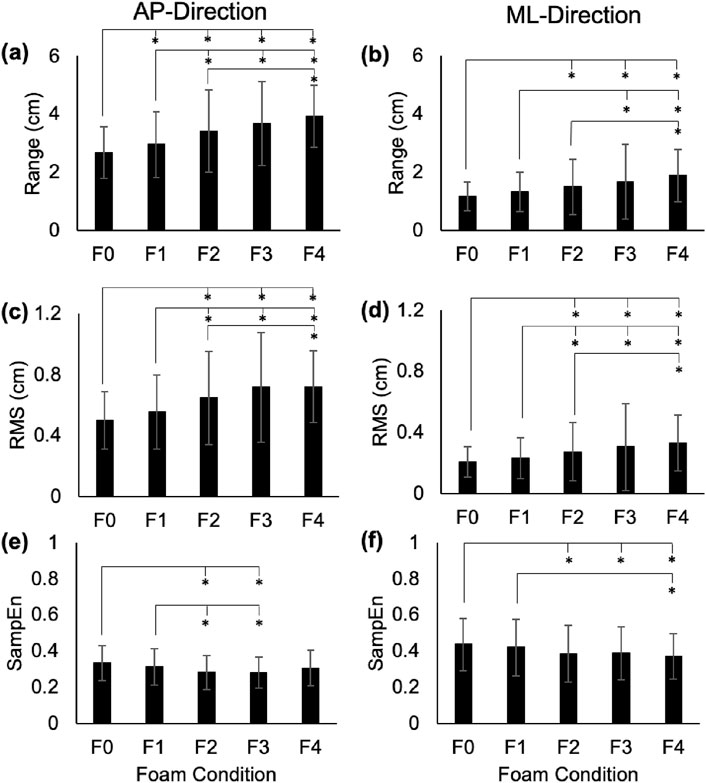
Figure 1. Range (a,b), RMS (c,d), and SampEn (e,f) for the COP time series in the AP and ML directions. Error bars represent standard deviations. Significant differences are shown with an asterisk (*).
3.1 Range
In the AP-direction, the COP and RM time series showed significant increases between average ranges in F0 vs. F1–F4 (p < 0.01; Cohen’s d: 3.81–10.82 for COP, and 3.33–7.89 for RM), F1 vs. F2–F4 (p < 0.01; Cohen’s d: 4.76–8.06 for COP, and 5.01–6.86 for RM), and F2 vs. F4 (COP: p = 0.01, Cohen’s d = 3.4; RM: p = 0.03, Cohen’s d = 3.05; Figures 1a, 2a). In the ML-direction for COP and RM, these differences were found between F0 vs. F2–F4 (p < 0.01; Cohen’s d: 3.66–7.91 for COP, and 4.01–8.65 for RM), F1 vs. F3–F4 (p < 0.01; Cohen’s d: 3.23–8.06 for COP, and 4.05–8.79 for RM), and F2 and F4 (COP: p < 0.01, Cohen’s d = 4.04; RM: p < 0.01, Cohen’s d = 3.76; Figures 1b, 2b). For TR in the AP-direction, significant increases in range were found for F0 vs. F1-F4 (p < 0.01; Cohen’s d: 3.65–6.14), F1 vs. F3 (p = 0.02; Cohen’s d: 3.12) and F4 (p < 0.01; Cohen’s d: 6.57), F2 vs. F4 (p < 0.01; Cohen’s d: 5.45), and F3 vs. F4 (p < 0.01; Cohen’s d: 6.47; Figure 3a). In the ML-direction, TR showed significant differences between F4 and F1–F3 (p < 0.01; Cohens d: 4.46–5.94; Figure 3b).
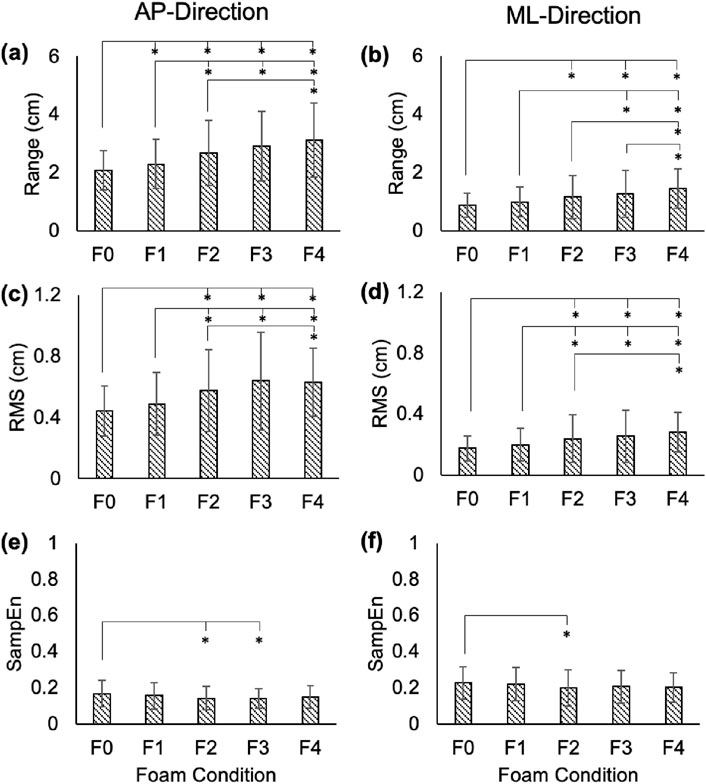
Figure 2. Range (a,b), RMS (c,d), and SampEn (e,f) for the RM time series in the AP and ML directions. Error bars represent standard deviations. Significant differences are shown with an asterisk (*).
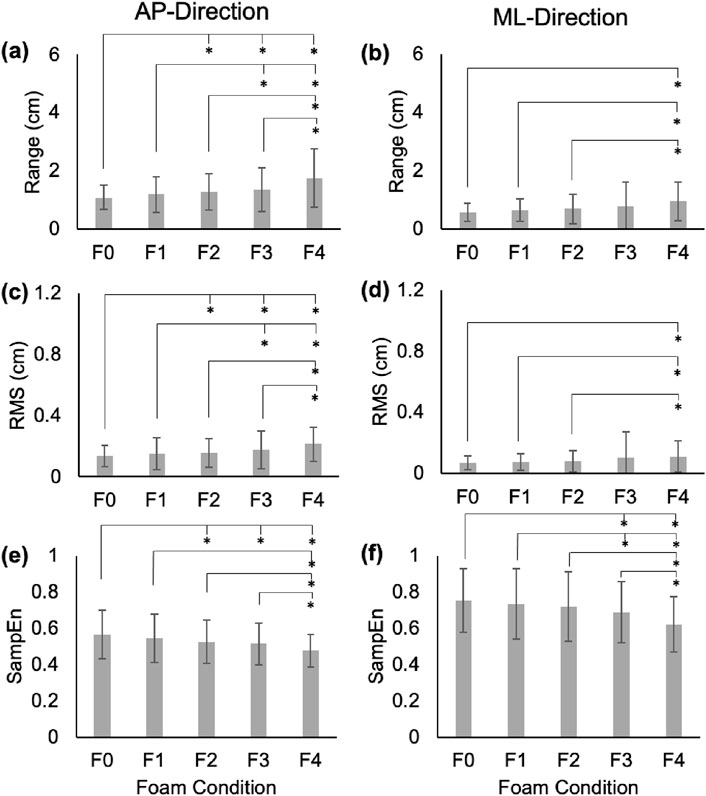
Figure 3. Range (a,b), RMS (c,d), and SampEn (e,f) for the TR time series in the AP and ML directions. Error bars represent standard deviations. Significant differences are shown with an asterisk (*).
3.2 Root-mean-square (RMS)
In the AP-direction, the COP and RM time series showed significant increases in average RMS values between F0 vs. F2–F4 (p < 0.01; Cohen’s d: 5.5–9.73 for COP, and 5.43–8.25 for RM), F1 vs. F2–F4 (p < 0.01; Cohen’s d: 4.31–6.47 for COP, and 4.05–5.57 for RM; Figures 1c, 2c). In the ML-direction for COP and RM, significant increases were found between F0 vs. F2–F4 (p < 0.01; Cohen’s d: 3.32–6.93 for COP, and 4.01–7.91 for RM), F1 vs. F2-F4 (p < 0.01; Cohen’s d: 2.84–7.977 for COP, and 3.1–9.09 for RM; Figures 1c, 2c), and F2 vs. F4 (p = 0.01, Cohen’s d: 3.43 for COP; p = 0.03, Cohen’s d: 2.98 for RM; Figures 1d, 2d). For TR in the AP-direction, significant differences in RMS were found between F0 vs. F2–F4 (p < 0.01; Cohens d: 2.89–8.34), F1 vs. F3–F4 (p < 0.01, Cohen’s d: 3.83–10.84), F4 vs. F2–F3 (p < 0.01, Cohen’s d: 6.39–10.34; Figure 3c). In the ML-direction, TR showed significantly different RMS values between F4 vs. F0–F2 (p < 0.01; Cohen’s d: 4.38–7.91; Figure 3d).
3.3 Sample entropy (SampEn)
In the AP-direction, the COP time series showed significant decreases between average SampEn values in F0 vs. F2-F3 (p < 0.01, Cohen’s d: 5.76–6.41), and F1 vs. F2–F3 (p < 0.01, Cohen’s d: 2.95–3.53; Figure 1e). In the ML-direction for the COP time series, significant decreases were found between F0 vs. F2–F4 (p < 0.01, Cohen’s d: 3.32–4.24) and F1 vs. F4 (p = 0.01, Cohen’s d: 3.48; Figure 1f). For the RM time series in the AP-direction, only F0 vs. F2–3 showed significantly different SampEn (p < 0.01, Cohen’s d: 3.56–4.15; Figure 2e). In the ML-direction, a significant decrease was found between F0 vs. F2 (p < 0.01, Cohen’s d: 2.91; Figure 2f). For TR in the AP-direction, significant differences were found between F0 vs. F2–F4 (p < 0.01, Cohen’s d: 2.93–5.63), and F4 vs. F1–3 (p < 0.02, Cohen’s d: 3.16–4.73; Figure 3e). In the ML-direction, significant differences were found between F0 vs. F3–F4 (p < 0.01, Cohen’s d: 4.28–77.84), F1 vs. F3–F4 (p < 0.01, Cohen’s d: 3.58–6.3), and F4 vs. F2–F3 (p < 0.01, Cohen’s d: 4.16–5.83; Figure 3f).
4 Discussion
The purpose of this study was to quantify the influence of simulated somatosensory deficit on measures of sway range, variability, and predictability. Our hypothesis was supported as the range, variability, and predictability increased with foam thickness for the COP, RM, and TR time series in both the AP and ML directions. Variability (RMS) and range showed similar increases across simulated deficit severity. Predictability was assessed using SampEn: the decrease in SampEn across foam thickness implies less systemic entropy, indicating an increase in overall signal predictability (Richman and Moorman, 2000). These findings are consistent with existing studies where foam has been shown to introduce a degree of postural instability, even in healthy young individuals, due to its viscoelastic mechanical properties and subsequent dampening of touch feedback at the plantar surface (Fujio and Takeuchi, 2021; Meyer et al., 2004; Patel et al., 2008; Perry et al., 2000). This observed effect supports the use of foam as a model for aging, with these foam-induced changes mirroring several common characteristics of sway in older adults (Degani et al., 2017; Manor and Lipsitz, 2013).
However, it is important to note that, despite mimicking many age-linked biomechanical changes to sway, the use of foam remains a rudimentary model for aging. In this study, increasing foam thickness was a simple, quantifiable means to model incrementally worsening somatosensory deficit. The overarching goal was to investigate the influence of progressive sensory loss within an individual subject, an insight nearly impossible to capture without simulated deficit (like that utilized in this study) or a multi-year longitudinal study with extensive inclusion/exclusion criteria. Though they provided many insightful learnings on the influence of somatosensation on balance, the results of this work are inherently limited in their generalizability to the elderly population. Thus, future work should incorporate a true sample of older adults with progressively worsening balance (e.g., non-fallers, history of falls, frequent fallers), using these findings to inform experimental design, analysis methodology, and interpretation.
AP and ML range in the COP, RM, and TR time series increased steadily with increasing foam thickness. In the AP-direction, COP and RM showed similar levels of significance between foam levels, presenting significant differences in as little as 1/8″ of foam thickness (F0 versus F1), but not between F3 and F4, a thickness difference of 1/2″. Conversely, TR AP range showed no significant difference between F0 and F1, but did find F3 and F4 to be different. For COP and RM, AP variability (RMS) was shown to increase across foam thickness, but F3 and F4 showed no significant differences, suggesting a plateau in this effect beyond 1/2″ of foam. Prior to F3 (1/2″ of foam), AP RMS appeared to increase incrementally with foam thickness. This observation is found also within SampEn measures. Neither COP nor RM showed significant differences in AP SampEn between F0 and F4, a comparison that, assuming linearity of simulation effect, was expected to show the highest level of contrast. Instead, COP and RM AP SampEn appear to plateau after F1, even showing a slight increase in mean values between F3 and F4. This trend is found also in RM ML SampEn, but not in COP ML SampEn, which follows a more incremental decrease across foam thickness, as expected.
It is not clear why the effects of increasing foam thickness would dissipate beyond 1/2″, but two possible explanations to this observation include (1) a ceiling effect, in which the amount of system variability is saturated, reaching a relative maximum by F3, and/or (2) given the mechanical properties of foam and high level of surface instability, the body recruits altered control mechanisms that attempt to minimize sway variability.
It is well-documented that, depending on the biomechanical challenge, the body relies on different joint strategies to maintain balance (Shumway-Cook and Woollacott, 2014). For example, Gatev et al. (1999) demonstrated that in quiet standing, the ankle is primarily responsible for postural control in the AP-direction, but reducing stance width shifts this responsibility onto the hip (Gatev et al., 1999). Fasola et al. (2019) noted that, when ankle motion was restricted, subjects heavily relied on flexion and extension of the knee to control the center of mass; in more extreme deviations, the trunk was recruited to oppose motion and correct posture (Fasola et al., 2019). Riemann et al. (2003) demonstrated that the ankle remains the primary contributor to balance on both stable and unstable support surfaces, such as foam, but noted the increase in importance of proximal joints, including the hip and knee (Riemann et al., 2003). Therefore, it is not unfounded to suggest that the observed plateau may be a result of a shift in joint-based postural control strategy at greater foam thicknesses. This would further support the use of foam as an aging model, especially at greater thicknesses, because this shift in joint strategy is also observed in older individuals, who are increasingly reliant on proximal joints (Mackey and Robinovitch, 2006). However, additional experimental methodologies, such as motion capture or electromyography would be required to support this conclusion.
The TR time series SampEn was sensitive to changes in foam thickness, presenting considerably more significant differences between foam conditions than either COP or RM. While many COP and RM measures tended to plateau beyond F3, TR SampEn scaled relatively proportionally with foam thickness, a measure characteristic that is highly desirable for tracking an individual’s balance deficit over time. Additionally, the large overall magnitude of TR SampEn suggests that, although only a small portion of overall sway, the TR time series contributes substantially to system predictability (or lack thereof). Thus, TR SampEn may serve as a powerful measure of balance deficit, especially for those suffering from somatosensory loss. This is echoed in previous work, which found ML TR to be highly sensitive to simulated somatosensory deficit, exceeding a 20% increase in maximum jerk between no foam and 1″ foam conditions, whereas COP experienced similar plateaus at greater foam thicknesses (Gerber et al., 2022). These results are expounded by findings of the present study, further highlighting the unique value that each of these time series may provide in the study of human balance and in clinical fall risk assessment.
Despite these promising findings, this study remains limited by selected outcome variables of sway range, RMS, and SampEn. These measures were carefully chosen, given their prominence in the study of aging, but there remains a wealth of unexplored sway measures and alternative methodologies, such as electromyography, that could contribute additional value to this work. Therefore, future studies should incorporate these learnings while continuing to explore a wide variety of measures to fully quantify the complex dynamic between sensation and postural control.
The study of balance is vital to both furthering our understanding of biomechanical control mechanisms and to improving fall risk assessment techniques. Somatosensory decline poses a significant risk to the aging population, reducing the accessibility of critical environmental and proprioceptive cues. The findings of this study highlight the scientific value of rambling-trembling methodology, examining sway from a mechanistic perspective and providing new, clinically-relevant insights into postural control. Though there is much work to be done to fully comprehend the utility of rambling-trembling, it shows tremendous promise in its ability to identify and track the progression of somatosensory deficit.
Lastly, though it is not a perfect replication of decreased rapidly adapting mechanoreceptive sensation, as highlighted by Patel et al. (2011), standing on foam is widely used in both research and clinical settings as a practical and controlled method to challenge somatosensory input and reduce the reliability of proprioceptive feedback from the plantar surface and ankle joints (e.g., Diener et al., 1984; Shumway-Cook and Horak, 1986). The use of varying foam thicknesses, as we proposed, is intended to create a graded reduction in somatosensory reliability, rather than to fully replicate a specific sensory deficit. This degradation also provides a useful proxy for studying the effects of sensory challenge on postural control.
Data availability statement
The original contributions presented in the study are included in the article/supplementary material, further inquiries can be directed to the corresponding author.
Ethics statement
The studies involving humans were approved by Institutional Review Board, Office of Research, University of Kansas. The studies were conducted in accordance with the local legislation and institutional requirements. The participants provided their written informed consent to participate in this study.
Author contributions
EG: Conceptualization, Data curation, Formal Analysis, Funding acquisition, Investigation, Methodology, Software, Writing – original draft, Writing – review and editing. C-KH: Conceptualization, Resources, Validation, Writing – review and editing. CG: Writing – review and editing. PN: Data curation, Writing – review and editing. CL: Conceptualization, Funding acquisition, Investigation, Methodology, Project administration, Resources, Supervision, Writing – review and editing.
Funding
The author(s) declare that financial support was received for the research and/or publication of this article. The first author is supported by the Madison & Lila Self Graduate Fellowship at the University of Kansas.
Acknowledgments
The authors would like to thank all members of the Biodynamics Research Lab for their contributions to data collection and the KU Department of Mechanical Engineering for providing the space to conduct research.
Conflict of interest
The authors declare that the research was conducted in the absence of any commercial or financial relationships that could be construed as a potential conflict of interest.
Generative AI statement
The author(s) declare that no Generative AI was used in the creation of this manuscript.
Any alternative text (alt text) provided alongside figures in this article has been generated by Frontiers with the support of artificial intelligence and reasonable efforts have been made to ensure accuracy, including review by the authors wherever possible. If you identify any issues, please contact us.
Publisher’s note
All claims expressed in this article are solely those of the authors and do not necessarily represent those of their affiliated organizations, or those of the publisher, the editors and the reviewers. Any product that may be evaluated in this article, or claim that may be made by its manufacturer, is not guaranteed or endorsed by the publisher.
References
Ambrose, A. F., Paul, G., and Hausdorff, J. M. (2013). Risk factors for falls among older adults: a review of the literature. Maturitas 75, 51–61. doi:10.1016/j.maturitas.2013.02.009
Bergen, G., Stevens, M. R., and Burns, E. R. (2016). Falls and fall injuries among adults aged ≥65 Years — United States, 2014. Morb. Mortal. Wkly. Rep. 65, 993–998. doi:10.15585/mmwr.mm6537a2
Bolbecker, A. R., Apthorp, D., Martin, A. S., Tahayori, B., Moravec, L., Gomez, K. L., et al. (2018). Disturbances of postural sway components in cannabis users. Drug Alcohol Depend. 190, 54–61. doi:10.1016/j.drugalcdep.2018.05.012
Borg, F. G., and Laxaback, G. (2010). Entropy of balance - some recent results. J. Neuroeng. Rehabil. 7, 38–11. doi:10.1186/1743-0003-7-38
Chang, J. T., and Ganz, D. A. (2007). Quality indicators for falls and mobility problems in vulnerable elders. J. Am. Geriatr. Soc. 55, 327–334. doi:10.1111/j.1532-5415.2007.01339.x
Collins, J. J., and De Luca, C. J. (1993). Open-loop and closed-loop control of posture: a random-walk analysis of center-of-pressure trajectories. Exp. Brain Res. 95, 308–318. doi:10.1007/BF00229788
Degani, A. M., Leonard, C. T., and Danna-dos-Santos, A. (2017). The effects of early stages of aging on postural sway: a multiple domain balance assessment using a force platform. J. Biomech. 64, 8–15. doi:10.1016/j.jbiomech.2017.08.029
Diener, H. C., Dichgans, J., Guschlbauer, B., and Mau, H. (1984). The significance of proprioception on postural stabilization as assessed by ischemia. Brain Res. 296 (1), 103–109.
Fasola, J., Vouga, T., Baud, R., Bleuler, H., and Bouri, M. (2019). “Balance control strategies during standing in a locked-ankle passive exoskeleton,” in 2019 IEEE 16th International Conference on Rehabilitation Robotics (ICORR), Toronto, ON, Canada, 24-28 June 2019 (IEEE), 593–598. doi:10.1109/ICORR.2019.8779500
Ferronato, P. A. M., and Barela, J. A. (2011). Age-related changes in postural control: rambling and trembling trajectories. Mot. Control 15, 481–493. doi:10.1123/mcj.15.4.481
Francis, P., Lyons, M., Piasecki, M., Mc Phee, J., Hind, K., and Jakeman, P. (2017). Measurement of muscle health in aging. Biogerontology 18, 901–911. doi:10.1007/s10522-017-9697-5
Fujio, K., and Takeuchi, Y. (2021). Discrimination of standing postures between young and elderly people based on center of pressure. Sci. Rep. 11, 195–199. doi:10.1038/s41598-020-80717-z
Gatev, P., Thomas, S., Kepple, T., and Hallett, M. (1999). Feedforward ankle strategy of balance during quiet stance in adults. J. Physiol. 514, 915–928. doi:10.1111/j.1469-7793.1999.915ad.x
Gerber, E. D., Nichols, P., Giraldo, C., Sidener, L., Huang, C.-K., and Luchies, C. (2022). Rambling-trembling center-of-pressure decomposition reveals distinct sway responses to simulated somatosensory deficit. Gait Posture 91, 276–283. doi:10.1016/j.gaitpost.2021.10.017
Henry, M., and Baudry, S. (2019). Age-related changes in leg proprioception: implications for postural control. J. Neurophysiol. 122, 525–538. doi:10.1152/jn.00067.2019
Inglis, J. T., Horak, F. B., Shupert, C. L., and Jones-Rycewicz, C. (1994). The importance of somatosensory information in triggering and scaling automatic postural responses in humans. Exp. Brain Res. 101, 159–164. doi:10.1007/BF00243226
Lin, D., Seol, H., Nussbaum, M. A., and Madigan, M. L. (2008). Reliability of COP-based postural sway measures and age-related differences. Gait Posture 28, 337–342. doi:10.1016/j.gaitpost.2008.01.005
Mackey, D. C., and Robinovitch, S. N. (2006). Mechanisms underlying age-related differences in ability to recover balance with the ankle strategy. Gait Posture 23, 59–68. doi:10.1016/j.gaitpost.2004.11.009
Manor, B., and Lipsitz, L. A. (2013). Physiologic complexity and aging: implications for physical function and rehabilitation. Prog. Neuro-Psychopharmacology Biol. Psychiatry 45, 287–293. doi:10.1016/j.pnpbp.2012.08.020
McIlroy, W. E., and Maki, B. E. (1997). Preferred placement of the feet during quiet stance: development of a standardized foot placement for balance testing. Clin. Biomech. 12, 66–70. doi:10.1016/S0268-0033(96)00040-X
Meyer, P. F., Oddsson, L. I. E., and De Luca, C. J. (2004). The role of plantar cutaneous sensation in unperturbed stance. Exp. Brain Res. 156, 505–512. doi:10.1007/s00221-003-1804-y
Mochizuki, L., Duarte, M., Amadio, A. C., Zatsiorsky, V. M., and Latash, M. L. (2006). Changes in postural sway and its fractions in conditions of postural instability. J. Appl. Biomech. 22, 51–60. doi:10.1123/jab.22.1.51
Nichols, P. (2020). “Quantifying somatosensory deficits using sample entropy and fuzzy sample entropy,”. Dissertations and Theses (ProQuest).
Norris, J. A., Marsh, A. P., Smith, I. J., Kohut, R. I., and Miller, M. E. (2005). Ability of static and statistical mechanics posturographic measures to distinguish between age and fall risk. J. Biomech. 38, 1263–1272. doi:10.1016/j.jbiomech.2004.06.014
Patel, M., Fransson, P. A., Lush, D., and Gomez, S. (2008). The effect of foam surface properties on postural stability assessment while standing. Gait Posture 28, 649–656. doi:10.1016/j.gaitpost.2008.04.018
Patel, M., Fransson, P. A., Johansson, R., and Magnusson, M. (2011). Foam posturography: standing on foam is not equivalent to standing with decreased rapidly adapting mechanoreceptive sensation. Exp. Brain Res. 208 (4), 519–527.
Perry, S. D., McIlroy, W. E., and Maki, B. E. (2000). The role of plantar cutaneous mechanoreceptors in the control of compensatory stepping reactions evoked by unpredictable, multi-directional perturbation. Brain Res. 877, 401–406. doi:10.1016/S0006-8993(00)02712-8
Ramdani, S., Seigle, B., Lagarde, J., Bouchara, F., and Bernard, P. L. (2009). On the use of sample entropy to analyze human postural sway data. Med. Eng. Phys. 31, 1023–1031. doi:10.1016/j.medengphy.2009.06.004
Richman, J. S., and Moorman, J. R. (2000). Physiological time-series analysis using approximate entropy and sample entropy. Am. J. Physiol. Hear. Circ. Physiol. 278, H2039–H2049. doi:10.1152/ajpheart.2000.278.6.h2039
Riemann, B. L., Myers, J. B., and Lephart, S. M. (2003). Comparison of the ankle, knee, hip, and trunk corrective action shown during single-leg stance on firm, foam, and multiaxial surfaces. Arch. Phys. Med. Rehabil. 84, 90–95. doi:10.1053/apmr.2003.50004
Robbins, A. S., Rubenstein, L. Z., Josephson, K. R., Schulman, B. L., Osterweil, D., and Fine, G. (1989). Predictors of falls: results of two population-based studies. Arch. Intern Med. 149, 1628–1633. doi:10.1001/archinte.1989.00390070138022
Roerdink, M., De Haart, M., Daffertshofer, A., Donker, S. F., Geurts, A. C. H., and Beek, P. J. (2006). Dynamical structure of center-of-pressure trajectories in patients recovering from stroke. Exp. Brain Res. 174, 256–269. doi:10.1007/s00221-006-0441-7
Shaffer, S. W., and Harrison, A. L. (2007). Aging of the somatosensory system: a translational perspective. Phys. Ther. 87, 193–207. doi:10.2522/ptj.20060083
Shin, S., and Sosnoff, J. J. (2017). Spinal cord injury and seated postural control: a test of the rambling and trembling hypothesis. Mot. Control 21, 443–456. doi:10.1123/mc.2016-0014
Shumway-Cook, A., and Woollacott, M. (2014). “Motor control: translating research into clinical practice,” in Motor control: translating research into clinical practice (Lippincott Williams & Wilkins).
Shumway-Cook, A., and Horak, F. B. (1986). Assessing the influence of sensory interaction of balance. Suggestion from the field. Phys Ther. 66 (10), 1548–50. doi:10.1093/ptj/66.10.1548
Simoneau, G., Ulbrecht, J., Derr, J., and Cavanagh, P. (1995). Role of somatosensory input in the control of human posture. Gait Posture 3, 115–122. doi:10.1016/0966-6362(95)99061-O
Tahayori, B., Riley, Z. A., Mahmoudian, A., Koceja, D. M., and Hong, S. L. (2012). Rambling and trembling in response to body loading. Mot. Control 16, 144–157. doi:10.1123/mcj.16.2.144
Visser, J. E., Carpenter, M. G., van der Kooij, H., and Bloem, B. R. (2008). The clinical utility of posturography. Clin. Neurophysiol. 119, 2424–2436. doi:10.1016/j.clinph.2008.07.220
Winter, D. A., Patla, A. E., and Frank, J. S. (1990). Assessment of balance control in humans. Prog. Technol. 16, 31–51.
Keywords: center of pressure, postural control, rambling-trembling, falls, nonlinear analysis
Citation: Gerber ED, Huang C-K, Giraldo C, Nichols P and Luchies CW (2025) Predictability of postural sway: unraveling the impact of simulated somatosensory deficits using a rambling-trembling approach. Front. Bioeng. Biotechnol. 13:1572309. doi: 10.3389/fbioe.2025.1572309
Received: 06 February 2025; Accepted: 22 August 2025;
Published: 05 September 2025.
Edited by:
Steven Truijen, University of Antwerp, BelgiumReviewed by:
Agnieszka Tomaszewska, Gdansk University of Technology, PolandCagla Kettner, Karlsruhe Institute of Technology (KIT), Germany
Copyright © 2025 Gerber, Huang, Giraldo, Nichols and Luchies. This is an open-access article distributed under the terms of the Creative Commons Attribution License (CC BY). The use, distribution or reproduction in other forums is permitted, provided the original author(s) and the copyright owner(s) are credited and that the original publication in this journal is cited, in accordance with accepted academic practice. No use, distribution or reproduction is permitted which does not comply with these terms.
*Correspondence: Eryn D. Gerber, ZWdlcmJlckBleHBvbmVudC5jb20=; Chun-Kai Huang, Y2h1YW5nN0BrdW1jLmVkdQ==; Carl W. Luchies, Y2x1Y2hpZXNAa3UuZWR1