 Talia Tene1*
 Fabian Arias Arias2
 Karina I. Paredes-Páliz3Juan Carlos González García4
 Nataly Bonilla García4
 Cristian Vacacela Gomez5*
- 1Department of Chemistry, Universidad Técnica Particular de Loja, Loja, Ecuador
- 2Department of Chemistry and Chemical Technologies, University of Calabria, Arcavacata, Italy
- 3Grupo de Investigación en Salud Pública, Facultad de Ciencias de la Salud, Universidad Nacional de Chimborazo, Riobamba, Ecuador
- 4Facultad de Ciencias, Escuela Superior Politécnica de Chimborazo (ESPOCH), Riobamba, Ecuador
- 5INFN-Laboratori Nazionali di Frascati, Frascati, Italy
This work presents the theoretical design and optimization of a surface plasmon resonance (SPR) biosensor incorporating graphene, silicon nitride, and a thiol-tethered ssDNA layer for malaria detection and stage differentiation. Two configurations (Sys3 and Sys4) were simulated using the transfer matrix method to determine optimal material thicknesses. The final designs were evaluated against three malaria stages—ring, trophozoite, and schizont—based on their refractive index variations. Sys3 achieved sensitivities of 353.14, 291.14, and 263.26°/RIU, while Sys4 reached 315.71, 294.81, and 268.65°/RIU, respectively. These values exceed those reported in comparable SPR platforms. Sys3 showed enhanced optical performance with a higher quality factor and lower detection limit, whereas Sys4 offered improved biomolecular recognition. Although limited to simulation, the proposed configurations demonstrate potential for label-free, stage-specific malaria diagnostics, supporting future development toward point-of-care applications.
1 Introduction
Malaria remains a major public health concern in tropical and subtropical regions, with Plasmodium falciparum causing the most severe clinical manifestations (Kogan, 2020). The disease progresses through intraerythrocytic stages (ring, trophozoite, and schizont), each marked by distinct biochemical and morphological changes in infected red blood cells (RBCs) (Bendib and Bendib, 2018; Agnero et al., 2019). These changes alter the refractive index (RI) of the RBCs (Pravesh et al., 2024), which can be exploited for label-free optical detection. Timely and accurate diagnosis is critical for reducing morbidity, limiting transmission, and guiding effective treatment.
Current malaria diagnostics, including light microscopy (Payne, 1988), rapid diagnostic tests (RDTs) (Mukkala et al., 2018), and nucleic acid amplification methods (Proux et al., 2011), each present limitations. Light microscopy remains the gold standard due to species differentiation and parasitemia quantification (Abbas et al., 2018), but it is time-consuming and operator-dependent. RDTs target specific antigens such as HRP2 and LDH (Chakma et al., 2023), yet their reliability may be compromised by gene deletions and residual antigenemia. Molecular approaches like PCR (Fallon et al., 2003) and LAMP (Morris and Aydin-Schmidt, 2021) offer improved sensitivity and specificity but require skilled personnel and access to specialized equipment, increasing cost and limiting field applicability.
Surface plasmon resonance (SPR) biosensors offer an attractive alternative for malaria detection (Kumar et al., 2024). These sensors utilize surface plasmon waves, which are collective oscillations of conduction electrons at a metal–dielectric interface (Philip and Kumar, 2022; Stefancu et al., 2024), to monitor refractive index changes near the sensor surface. The Kretschmann configuration remains the most widely adopted SPR geometry due to its simplicity and effective excitation of surface plasmons (Shukla et al., 2022). By tracking shifts in the resonance angle, SPR biosensors enable real-time, label-free detection of malaria biomarkers (Wang et al., 2022). They are also amenable to miniaturization for point-of-care (POC) applications (Rasheed et al., 2024).
Traditional SPR sensors often employ noble metals such as gold (Au) or silver (Ag) as the plasmonic layer (Lee and El-Sayed, 2006). Although Au offers superior chemical stability, Ag provides sharper resonance peaks and stronger plasmonic fields (Naik et al., 2013), making it advantageous for improving sensor resolution when chemical degradation is not a primary concern.
To overcome intrinsic losses in metallic layers and enhance biomolecular interaction, recent studies have incorporated two-dimensional (2D) materials, especially graphene, into SPR platforms (Tene et al., 2024a). Graphene’s high surface area, exceptional conductivity, and tunable optical properties support improved field confinement and molecular adsorption (Coello-Fiallos et al., 2017). Moreover, the addition of a dielectric interlayer such as silicon nitride (Si3N4), which has a high refractive index and low optical loss, can increase electromagnetic confinement and structural stability (Tene et al., 2024b).
The functionalization of graphene with single-stranded DNA (ssDNA) enables specific biorecognition of malaria DNA sequences (Ragav et al., 2018). Thiol-tethered ssDNA, in particular, facilitates stable and oriented binding to sensor surfaces and promotes efficient hybridization with target sequences (Wang et al., 2004). Compared to antibody-based strategies, ssDNA-functionalized interfaces demonstrate enhanced stability, reproducibility, and resistance to environmental degradation.
Malaria stage differentiation is also feasible using SPR biosensors due to the distinct RI signatures of RBCs at various infection stages. The ring stage (II) exhibits a moderate RI decrease due to vacuole formation and low metabolic activity (Kozicki et al., 2015). In the trophozoite stage (III), hemoglobin digestion and hemozoin production reduce the RI further (Anderson et al., 2015). The schizont stage (IV), marked by parasite replication and RBC rupture, displays the lowest RI due to extensive structural degradation (Roobsoong et al., 2011). These progressive changes can be detected by monitoring resonance angle shifts in the SPR response.
This study presents the theoretical design and simulation of a graphene-integrated SPR biosensor configured with a multilayer structure comprising silver, silicon nitride, graphene, and thiol-tethered ssDNA. Particularly, we complement and extend our previous work, which uses as the sensing system: BK7/Silver/Silicon Nitride/Black Phosphorus (Tene et al., 2025a). Hence, the sensor response is modeled using the transfer matrix method (TMM), a well-established approach for analyzing electromagnetic behavior in multilayer thin films (Tene et al., 2024c). Key performance parameters, including sensitivity (S), full-width at half maximum (FWHM), quality factor (QF), detection accuracy (DA), figure of merit (FoM), limit of detection (LoD), and comprehensive sensitivity factor (CSF), are evaluated. The sensor’s capability to resolve malaria stages (ring, trophozoite, schizont) is assessed based on RI variation, offering a theoretical basis for future label-free, stage-specific malaria diagnostics.
2 Materials and methods
2.1 Theoretical framework
The reflective intensity of the proposed Nth-layer sensor model is calculated using the TMM (Wu et al., 2010; Tene et al., 2024d; Akib et al., 2024). The analysis of the sensor considers boundary conditions for the tangential component, with initial limit Z = Z1 = 0, and final limit Zn-1, giving the following expression:
In Equation 1, E1, EN-1, V1, and VN-1 represent the tangential components of the electric and magnetic fields for the initial and Nth layer, respectively. Mij indicates the transfer matrix characteristics of the Nth layer model. The transfer matrix can be computed as:
To be specific, the matrix Mk (Equation 2) is the characteristic transfer matrix for the kth layer in a multilayer thin-film structure. It relates the forward and backward traveling electromagnetic field components at the entry and exit of that specific layer, as follows:
Denoting the phase thickness,
And the polarization-dependent wave impedance factor,
in Equations 3–5,
After straightforward computations, the total reflection of the Nth-layer model can be expressed as:
By using Equation 6, the reflectance as a function of the angle of incidence (SPR curve) can be calculated as the main ingredient fo the current research.
2.2 Performance metrics equations
We now move on the main performance metric (Equations 7–13) of the proposed sensors (Tene et al., 2025b). The first parameter is the sensitivity enhancement regarding the “relative” baseline sensors after/before pathogen adsorption, denoted as:
the sensitivity to the refractive index change can be expressed as:
Here,
The detection accuracy (DA) can be expressed as in terms of
The Quality Factor (QF) can be expressed in terms of
The Figure of Merit (FoM) can be expressed as:
Here,
The Limit of Detection (LoD) can be calculated as:
In Equation 12, the value 0.005° represents the angular resolution of typical SPR systems. This value reflects the minimum detectable angle shift in conventional setups and is commonly used in theoretical models as a conservative estimate of instrumental precision.
Finally, the Comprehensive Sensitivity Factor (CSF) ratio can be calculated:
2.3 Biosensor design
Table 1 outlines the five SPR biosensor configurations considered in this study, systematically incorporating functional layers to evaluate their influence on the sensor performance. The baseline system, Sys0 (P/Ag/MBlood), consists of a prism-silver-plasma blood structure, serving as a reference for assessing SPR behavior in a biological medium (Karki et al., 2024). In Sys1 (P/Ag/Stage1), the sensing medium is replaced with normal (I) stage erythrocytes, providing a biologically relevant model for investigating refractive index variations associated with malaria (Bendib and Bendib, 2018; Agnero et al., 2019). The addition of Si3N4 in Sys2 (P/Ag/SN/Stage1) is expected to enhance the plasmonic confinement, while graphene in Sys3 (P/Ag/SN/G/Stage1) is expected to improve the biomolecular interactions. The most advanced system, Sys4 (P/Ag/SN/G/ssDNA/Stage1), integrates a thiol-tethered ssDNA layer, which is expected to selectively bind Plasmodium DNA sequences.
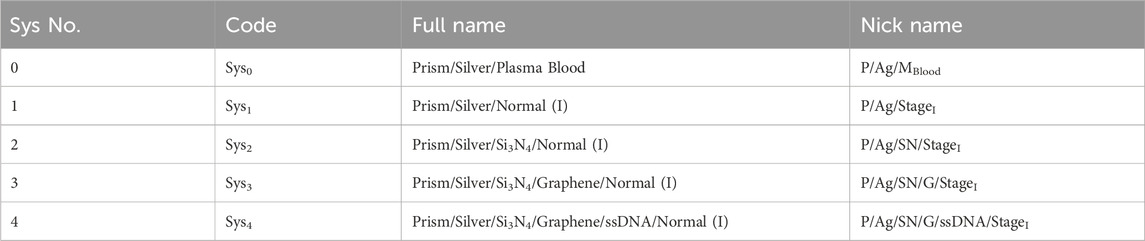
Table 1. Configurations of the SPR biosensors evaluated in this study, using different materials and sensing media. The “Full Name” column describes the structure from bottom to top.
To note, Figure 1 provides a schematic representation of the advanced SPR biosensor configurations, Sys3 and Sys4, highlighting their layered structure and optical setup. In Sys3 (Figure 1a), the system consists of a silver layer deposited on a BK-7 prism, followed by a silicon nitride layer and a graphene monolayer, with the analyte medium positioned at the top. The Kretschmann configuration is employed, where light is incident at an angle θ, exciting surface plasmons at the silver-dielectric interface. The inclusion of Si3N4 and graphene is expected to improve resonance sharpness and enhance molecular interaction sensitivity. In Sys4 (Figure 1b), the configuration is extended by incorporating a thiol-tethered ssDNA functionalisation layer atop the graphene surface. The structural progression from Sys0 to Sys4 follows a logical design approach, ensuring that each modification contributes to enhanced sensor performance.
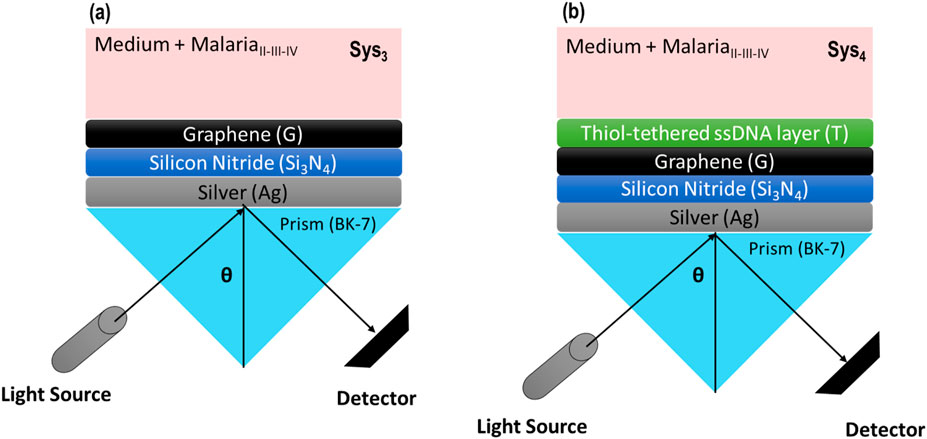
Figure 1. Schematic representation of the proposed SPR biosensor configurations. (a) Configuration with silicon nitride and graphene layers. (b) Configuration with silicon nitride and graphene layers, incorporating a thiol-tethered ssDNA layer for enhanced biorecognition.
2.4 Initial parameters
Table 2 presents the initial refractive index (RI) and thickness values adopted for the SPR biosensor configurations before optimisation. These values have been taken from experimental and theoretical studies reported in the literature at around 633 nm. The materials used in the sensor’s structure include BK-7 glass (prism), silver (Ag), silicon nitride (Si3N4), graphene (G), plasma blood, and normal (I) stage erythrocytes. The BK-7 prism, which serves as the coupling medium, has a refractive index of 1.5151, a standard value for optical applications due to its high transparency in the visible and near-infrared spectrum. The silver layer, acting as the plasmonic medium, exhibits a complex refractive index of 0.056253 + 4.2760i at the operating wavelength, with a thickness of 55.0 nm, ensuring optimal plasmon resonance excitation. The Si3N4 dielectric layer has a refractive index of 2.0394 and a thickness of 5.00 nm, parameters selected based on its optical properties and integration compatibility with plasmonic 2D nanomaterials. The graphene monolayer is characterised by a refractive index of 3.0 + 1.462i, with a thickness of 0.34 nm (Wu et al., 2010), consistent with its atomic-layer nature.
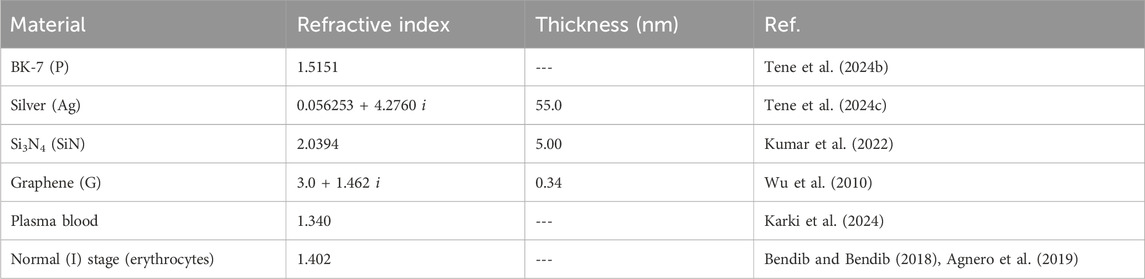
Table 2. Initial parameters adopted in the SPR biosensor configuration before optimization. The refractive index (RI) and thickness values for each material used in the sensor’s construction are shown at 633 nm.
The sensing media, i.e., plasma blood and normal (I) stage erythrocytes, exhibit refractive indices of 1.340 and 1.402, respectively, reflecting their inherent optical differences. These values are essential for evaluating the biosensor’s response across different biological conditions and Malaria stages.
To clarify, this study evaluates the biosensor response based on discrete refractive index values associated with the ring, trophozoite, and schizont stages of Plasmodium falciparum infection, as reported in prior works (Bendib and Bendib, 2018; Agnero et al., 2019). These values do not account for concentration-dependent behavior typically represented by sigmoidal dose–response curves. As such, output versus analyte concentration was not modeled. A full biochemical analysis incorporating binding kinetics and concentration gradients remains outside the scope of this theoretical framework and is proposed for future experimental validation.
3 Results and discussions
3.1 Configurations under analysis
Figure 2 and Supplementary Table S1 present the graphical and numerical evaluation of the different SPR biosensor configurations, illustrating the impact of material modifications on SPR peak position, attenuation, FWHM, and sensitivity enhancement. The reference system (Sys0) provides the baseline response, while the progressive incorporation of Si3N4, graphene, and ssDNA layers modifies the plasmonic behavior. The SPR reflectance curves in Figure 2a demonstrate a systematic shift in the resonance angle as additional layers are introduced. The blue curve (Sys0) exhibits an SPR peak at 68.6°, corresponding to the simplest prism-silver-plasma blood system. Replacing the sensing medium with normal (I) stage erythrocytes in Sys1 (orange curve) shifts the resonance to 78.2°, reflecting the higher refractive index of RBCs. The addition of Si3N4 in Sys2 (green curve) further displaces the peak to 84.2°. The resonance angle continues to increase with graphene integration in Sys3 (red curve) at 85.3°, while ssDNA functionalisation in Sys4 (purple curve) produces the highest shift at 86.2°.
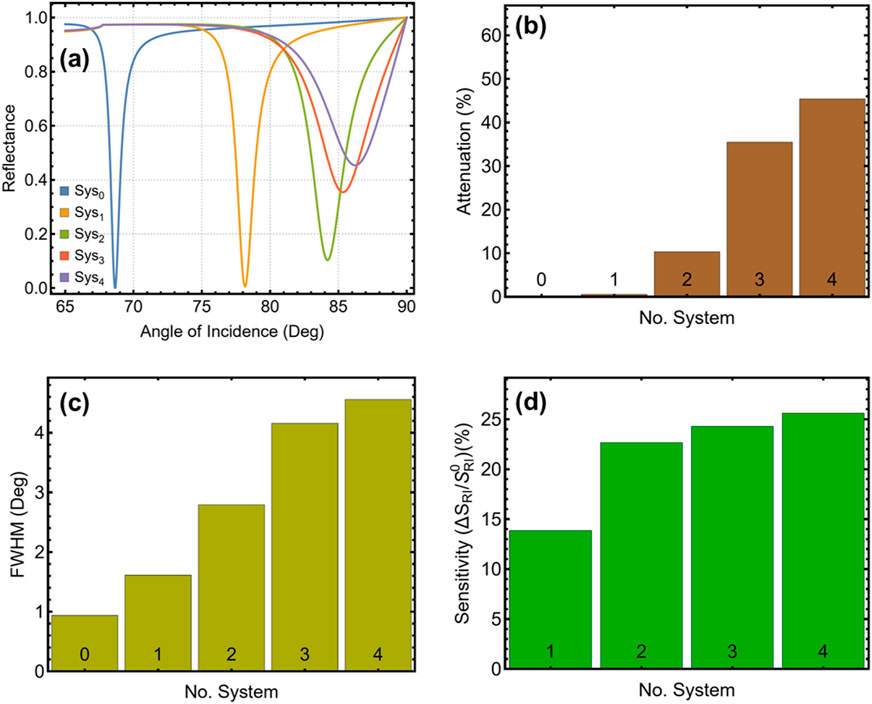
Figure 2. Performance analysis of the SPR biosensor configurations. (a) SPR reflectance curves for different configurations from Sys0 to Sys4. (b) Percentage of attenuation for different configurations. (c) FWHM for different configurations. (d) Sensitivity enhancement (%) for configurations Sys1-Sys4 compared to the reference configuration Sys0.
The attenuation analysis in Figure 2b and Supplementary Table S1 indicates a progressive deepening of the SPR dip, correlating with enhanced plasmonic excitation. The reference system Sys0 exhibits minimal attenuation (0.02%), while Sys1 increases to 0.55%. A notable rise is observed in Sys2 (10.34%), confirming the effect of Si3N4 on resonance strength. The trend continues in Sys3 (35.45%) and Sys4 (45.37%), where graphene and ssDNA layers are expected to contribute to stronger energy transfer and enhanced molecular interaction. The FWHM results in Figure 2c provide insights into resonance sharpness, a critical factor for detection accuracy. Sys0 exhibits the narrowest value at 0.94°, while Sys1 broadens to 1.61°, indicating a slight reduction in resonance sharpness due to the increased refractive index of erythrocytes. The inclusion of Si3N4 in Sys2 results in a wider peak at 2.79°, while Sys3 and Sys4 further increase to 4.16° and 4.57°, respectively, demonstrating the effect of graphene and ssDNA layers on plasmonic curve broadening.
The sensitivity enhancement analysis in Figure 2d confirms the increasing detection capability of the biosensor. Sys1 achieves a 13.85% improvement over Sys0, followed by a significant increase in Sys2 (22.65%), reinforcing the role of Si3N4 in enhancing plasmonic response. Sys3 (24.30%) and Sys4 (25.60%) exhibit the highest sensitivity values, once more evidencing the positive influence of graphene and ssDNA functionalisation. Considering the superior performance observed in Sys3 and Sys4, these two configurations have been selected for further analysis. The enhanced resonance characteristics make them the most promising candidates for malaria biomarker detection, while the comparison between Sys3 and Sys4 allows for evaluating the specific contribution of the ssDNA layer.
With these results in mind, we point out the contribution of each material layer to the sensor’s performance, across five configurations (Sys0 to Sys4), as summarised in Table 1. Sys0 (non-malaria contribution) and Sys1, which rely solely on a silver layer, serve as reference systems. The sequential inclusion of silicon nitride (Sys2), graphene (Sys3), and ssDNA (Sys4) resulted in progressive modification in attenuation, FWHM, and sensitivity enhancement, as illustrated in Figure 2a–d. These results confirm that the enhanced plasmonic behavior and sensing performance observed in Sys3 and Sys4 are not due to the silver layer alone, but rather to the synergistic effects of the added Si3N4 and graphene layers, which improve field confinement and biomolecular interaction. The final ssDNA layer further supports sequence-specific biorecognition, enhancing diagnostic potential.
3.2 Metal thickness optimization
Figure 3 and Supplementary Table S2 present the performance analysis of Sys3 and Sys4 by varying the silver (Ag) thickness from 40 to 65 nm. The results are analysed in relation to the baseline configurations (Agsys3_base and Agsys4_base), represented in black, which correspond to the initial parameters reported in Table 2. The SPR curves in Figures 3a, b demonstrate the resonance shift across different silver thicknesses, while Figures 3c–e provide a quantitative comparison of attenuation, FWHM, and sensitivity enhancement. The reflectance curves indicate a systematic increase in the resonance angle as the silver thickness increases. The SPR peak for Sys3 shifts from 83.39° at 40 nm to 85.34° at 55 nm, beyond which the shift becomes less pronounced, reaching 85.85° at 65 nm (Figure 3a). A similar trend is observed in Sys4, where the resonance angle increases from 84.08° at 40 nm to 86.23° at 55 nm, stabilising at 86.63° at 65 nm. The largest shifts occur between 40 nm and 55 nm, confirming that plasmonic coupling improves significantly up to this range, while additional thickness beyond 55 nm contributes marginally to further shifting.
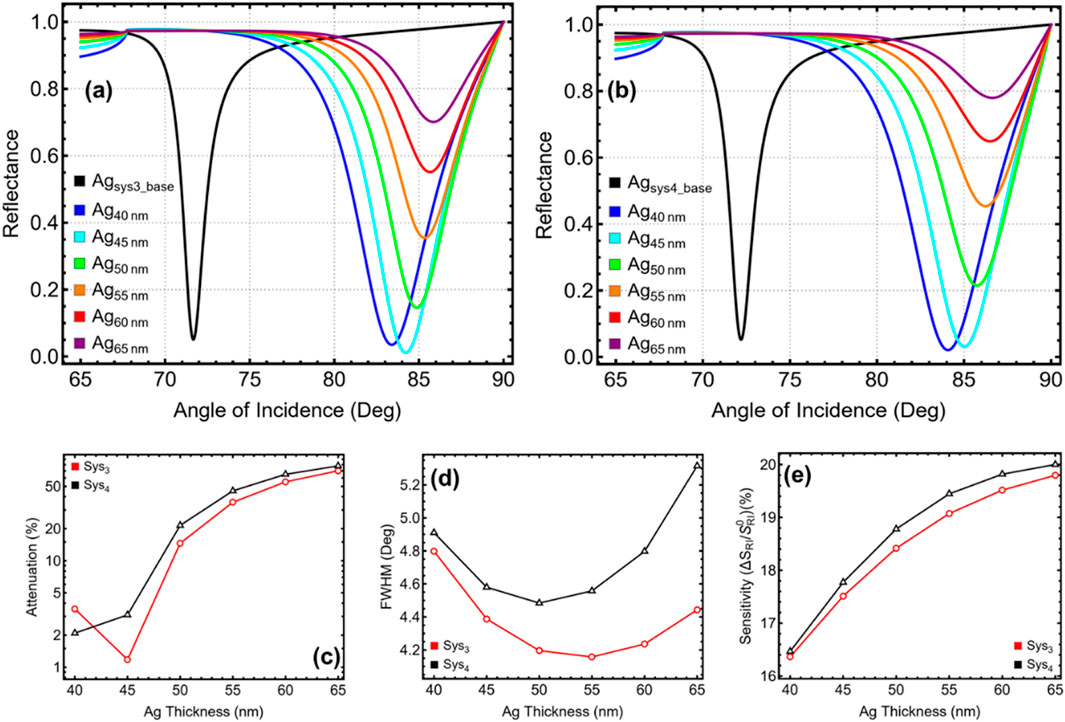
Figure 3. Performance analysis of Sys3 and Sys4 configurations with varying silver (Ag) thicknesses from 40 to 65 nm. (a,b) SPR reflectance curves for Sys3 and Sys4, respectively. (c) Percentage of attenuation for each configuration, y-axis-log scale is considered. (d) FWHM for each configuration. (e) Sensitivity enhancement (%) for Sys3 and Sys4, relative to the baseline systems constructed with initial parameters (Agsys3_base and Agsys4_base).
The attenuation analysis in Figure 3c reveals a notable increase in plasmonic absorption as silver thickness increases. At 40 nm, Sys3 and Sys4 exhibit low attenuation values of 3.53% and 2.09%, respectively, suggesting weaker plasmonic excitation. A substantial rise is observed at 50 nm, where attenuation reaches 14.60% in Sys3 and 21.51% in Sys4. The highest values occur at 65 nm, where Sys3 reaches 70.11% and Sys4 reaches 77.97%, indicating that excessive silver thickness results in stronger plasmonic absorption but also higher energy dissipation, which may negatively impact sensor performance. The FWHM results in Figure 3d indicate that moderate silver thicknesses improve resonance sharpness, with the lowest values recorded between 50 nm and 55 nm. In Sys3, FWHM decreases from 4.80° at 40 nm to 4.16° at 55 nm, before broadening again to 4.44° at 65 nm. A similar behaviour is observed in Sys4, where FWHM reduces from 4.91° at 40 nm to 4.56° at 55 nm, before widening to 5.32° at 65 nm. This pattern suggests that while thicker silver layers enhance resonance strength, excessive values result in broader spectral features, reducing measurement precision.
Sensitivity enhancement follows an increasing trend across all thicknesses, with the highest values observed at 65 nm (Figure 3d). In Sys3, sensitivity increases from 16.36% at 40 nm to 19.80% at 65 nm, while in Sys4, sensitivity improves from 16.47% at 40 nm to 20.0% at 65 nm. Despite this improvement, the broadening of the resonance peak at higher thicknesses compromises detection accuracy, indicating that sensitivity alone cannot determine the optimal configuration.
Considering a balance between a minimum attenuation, reasonable FWHM, and sensitivity enhancement, a silver thickness of 45 nm is selected for Sys3 and 40 nm is chosen for Sys4. In Sys3, 45 nm ensures a well-defined resonance with an FWHM of 4.39°, an attenuation of 1.18%, and a sensitivity enhancement of 17.51%, balancing plasmonic efficiency and detection accuracy. For Sys4, 40 nm is chosen due to its stable response with an FWHM of 4.91°, an attenuation of 2.09%, and a sensitivity enhancement of 16.47%, preventing excessive energy dissipation while maintaining effective resonance behaviour. These selections ensure that Sys3 and Sys4 maintain optimal plasmonic behaviour while preventing unnecessary signal degradation.
3.3 Silicon nitride thickness optimization
The influence of silicon nitride (Si3N4) thickness on the plasmonic behaviour of Sys3 and Sys4 is analysed in Figure 4 and Supplementary Table S3, considering values from 5 to 10 nm while maintaining the previously optimized silver thickness of 45 nm for Sys3 and 40 nm for Sys4. The baseline configurations (Si3N4_sys3_base and Si3N4_sys4_base), represented in black, serve as reference systems for comparison. The reflectance curves in Figure 4a (Sys3) and Figure 4b (Sys4) show a progressive shift in resonance angle with increasing Si3N4 thickness, confirming that additional dielectric material modifies plasmonic confinement. In Sys3, the SPR peak moves from 84.22° at 5 nm to 87.29° at 7 nm, before slightly decreasing at larger thicknesses. Similarly, Sys4 exhibits a resonance shift from 84.08° at 5 nm to a maximum of 87.56° at 7 nm, beyond which the angle stabilises. These results suggest that moderate Si3N4 thickness effectively enhances plasmonic interaction, but further increase beyond 7 nm contributes marginally to resonance tuning. The attenuation trends, illustrated in Figure 4c, indicate a rapid increase in plasmonic absorption with increasing Si3N4 thickness. At 5 nm, Sys3 exhibits a low attenuation of 1.18%, which rises to 49.92% at 7 nm. A similar behaviour is observed in Sys4, where attenuation increases from 2.09% at 5 nm to 22.78% at 7 nm. Beyond this thickness, the attenuation continues rising sharply, reaching 92.82% in Sys3 and 89.72% in Sys4 at 10 nm, confirming that excessive Si3N4 thickness leads to excessive energy dissipation, diminishing the efficiency of the SPR response.
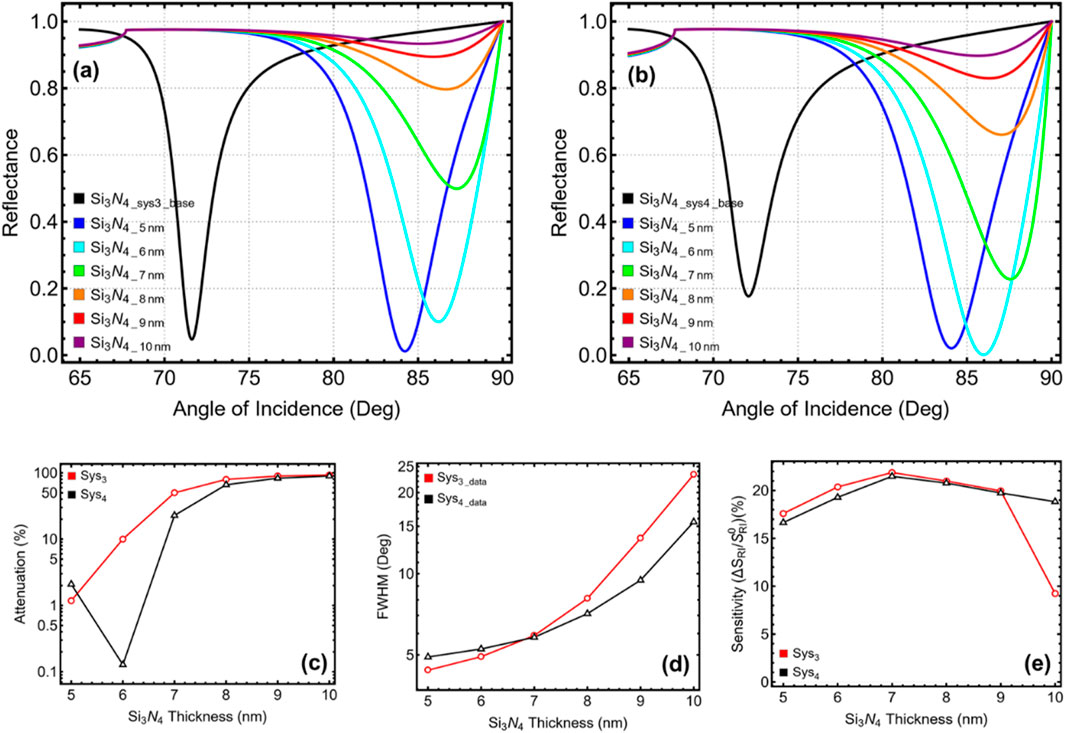
Figure 4. Performance analysis of Sys3 and Sys4 configurations with varying silicon nitride thicknesses from 5 to 10 nm. (a,b) SPR reflectance curves for Sys3 and Sys4, respectively. (c) Percentage of attenuation for each configuration, y-axis-log scale is considered. (d) FWHM for each configuration, y-axis-log scale is considered. (e) Sensitivity enhancement (%) for Sys3 and Sys4, relative to the baseline systems constructed with initial parameters (Si3N4_sys3_base and Si3N4_sys4_base) and optimized silver thickness value.
The FWHM results in Figure 4d reveal that thinner Si3N4 layers provide sharper resonance peaks, with the lowest values recorded at 5 nm for Sys3 (4.39°) and 6 nm for Sys4 (5.26°). Beyond these thicknesses, FWHM progressively increases, reaching 5.90° at 7 nm in Sys3 and 5.81° in Sys4, and continuing to broaden at larger values, reaching 15.56° at 10 nm for Sys4 and 23.33° for Sys3. This degradation in resonance sharpness suggests that increasing Si3N4 thickness beyond optimal values results in excessive plasmon damping, reducing detection precision. The sensitivity enhancement, as shown in Figure 4e, follows a nonlinear trend, peaking at 7 nm before slightly decreasing at larger thicknesses. In Sys3, sensitivity rises from 17.60% at 5 nm to a maximum of 21.89% at 7 nm, before dropping at 10 nm (9.24%). Similarly, in Sys4, sensitivity increases from 16.65% at 5 nm to 21.49% at 7 nm, before decreasing at 10 nm (18.83%). These results confirm that while Si3N4 enhances plasmonic interaction, excessive thickness degrades sensitivity and accuracy.
Considering the balance between SPR peak shift, attenuation, resonance sharpness, and sensitivity, a Si3N4 thickness of 5 nm is selected for Sys3 and 6 nm for Sys4. The 5 nm thickness in Sys3 provides a well-defined resonance with a narrow FWHM of 4.39°, minimal attenuation of 1.18%, and a sensitivity enhancement of 17.60%. In Sys4, 6 nm achieves an optimal trade-off, yielding an FWHM of 5.26°, low attenuation of 0.13%, and a sensitivity improvement of 19.29%, maintaining strong resonance quality while preventing excessive energy dissipation.
3.4 Number of 2D nanolayers optimization
The effect of varying the number of graphene layers from 1 (L1) to 6 (L6) on the sensor behaviour of Sys3 and Sys4 is analysed in Figure 5 and Supplementary Table S4, following the previously optimized silver and Si3N4 thicknesses of 45 nm and 5 nm for Sys3, and 40 nm and 6 nm for Sys4, respectively. The baseline configurations (L0_sys3_base and L0_sys4_base), represented in black, serve as reference systems for comparison. The reflectance curves in Figure 5a (Sys3) and Figure 5b (Sys4) illustrate a progressive shift in resonance angle with increasing graphene layers, confirming its role in modulating plasmonic sensor behaviour. In Sys3, the SPR peak shifts from 84.22° at L1 to 85.81° at L3, beyond which the shift becomes negligible, stabilising at 85.341° at L6. Similarly, Sys4 exhibits a resonance shift from 85.98° at L1 to 86.68° at L2, before slightly reducing at 85.39° at L6. The most significant shifts occur between L1 and L3 in Sys3, and L1 and L2 in Sys4, suggesting that additional graphene layers enhance plasmonic interaction up to a certain threshold, beyond which further increase provides diminishing returns.
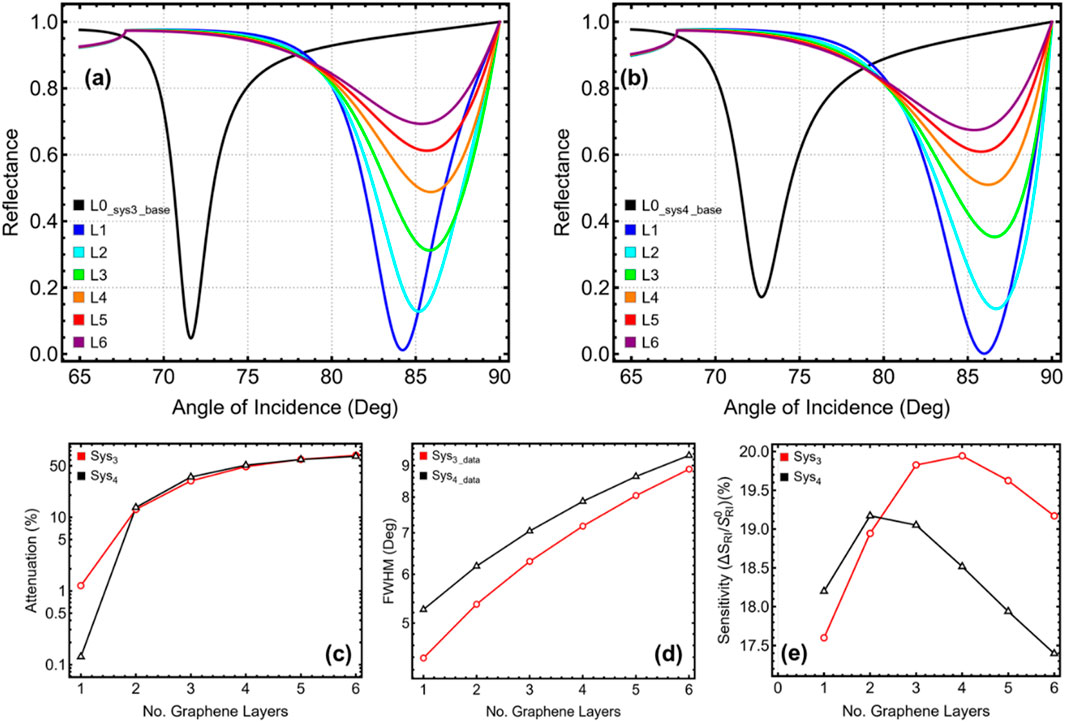
Figure 5. Performance analysis of Sys3 and Sys4 configurations with varying the number of graphene layers from 1 (L1) to 6 (L6). (a,b) SPR reflectance curves for Sys3 and Sys4, respectively. (c) Percentage of attenuation for each configuration, y-axis-log scale is considered. (d) FWHM for each configuration. (e) Sensitivity enhancement (%) for Sys3 and Sys4, relative to the baseline systems constructed with initial parameters (L0_sys3_base and L0_sys4_base) and optimized silver/silicon nitride thickness values.
The attenuation results in Figure 5c reveal a continuous increase in plasmonic absorption with additional graphene layers. At L1, Sys3 exhibits an attenuation of 1.18%, which rises to 12.82% at L2 and 31.22% at L3. A similar trend is observed in Sys4, where attenuation increases from 0.13% at L1 to 13.62% at L2, then reaching 35.25% at L3. Beyond these values, attenuation continues increasing, reaching 69.31% at L6 in Sys3 and 67.42% in Sys4, confirming that excessive graphene layers lead to higher losses, reducing energy efficiency. The FWHM analysis in Figure 5d highlights a progressive broadening of the resonance curve with more graphene layers. In Sys3, FWHM increases from 4.39° at L1 to 6.29° at L3, reaching 8.89° at L6, while in Sys4, it rises from 5.26° at L1 to 6.18° at L2, then continues broadening to 9.345° at L6. This trend indicates that while graphene enhances resonance strength, excessive layers lead to spectral broadening, negatively impacting detection accuracy. The sensitivity enhancement, illustrated in Figure 5e, exhibits a nonlinear trend, peaking at L3 in Sys3 and L2 in Sys4 before decreasing at larger values. In Sys3, sensitivity improves from 17.60% at L1 to 19.83% at L3, before reducing to 19.17% at L6. A similar behaviour is observed in Sys4, where sensitivity increases from 18.20% at L1 to 19.17% at L2, before declining to 17.40% at L6. These results confirm that moderate graphene layers enhance molecular interactions, while excessive layers reduce sensitivity due to increased optical losses.
To achieve an optimal balance between attenuation, spectral sharpness, and sensitivity, 2 graphene layers are selected for both Sys3 and Sys4. Particularly, after 2 layers the attenuation (>30%) and FWHM (>6°) values critically increase. In Sys3, L2 ensures a well-defined resonance with an FWHM of 5.36°, moderate attenuation of 12.82%, and a sensitivity enhancement of 18.95%, ensuring strong plasmonic coupling without excessive spectral broadening. In Sys4, L2 achieves an optimal trade-off, providing an FWHM of 6.18°, controlled attenuation of 13.62%, and a sensitivity improvement of 19.17%, ensuring efficient detection performance. Although increasing graphene layers beyond L3 enhances sensitivity, it also leads to broader resonance peaks and higher losses, reducing detection precision.
3.5 ssDNA thickness optimization
The influence of ssDNA thickness on the plasmonic sensor response of Sys4 is analysed in Figure 6 and Supplementary Table S5, considering values from 3.2 nm to 50 nm, while maintaining the previously optimized silver, Si3N4, and graphene layers at 40 nm, 6 nm, and 2 layers, respectively. Since Sys4 is the only system incorporating the ssDNA layer, the analysis is exclusive to this configuration. The baseline system (ssDNA_sys4_base), represented in black, is used as a reference. The reflectance curves in Figure 6a illustrate a systematic shift in resonance angle as ssDNA thickness increases, confirming its role in modulating plasmonic interaction. The SPR peak moves from 86.68° at 3.2 nm to 87.03° at 10 nm, beyond which a progressive decrease occurs, reaching 85.52° at 50 nm. The most pronounced shifts are observed between 3.2 nm and 10 nm, suggesting that thinner ssDNA layers significantly enhance molecular binding efficiency, while further increase leads to a less effective refractive index contrast, reducing the resonance shift.
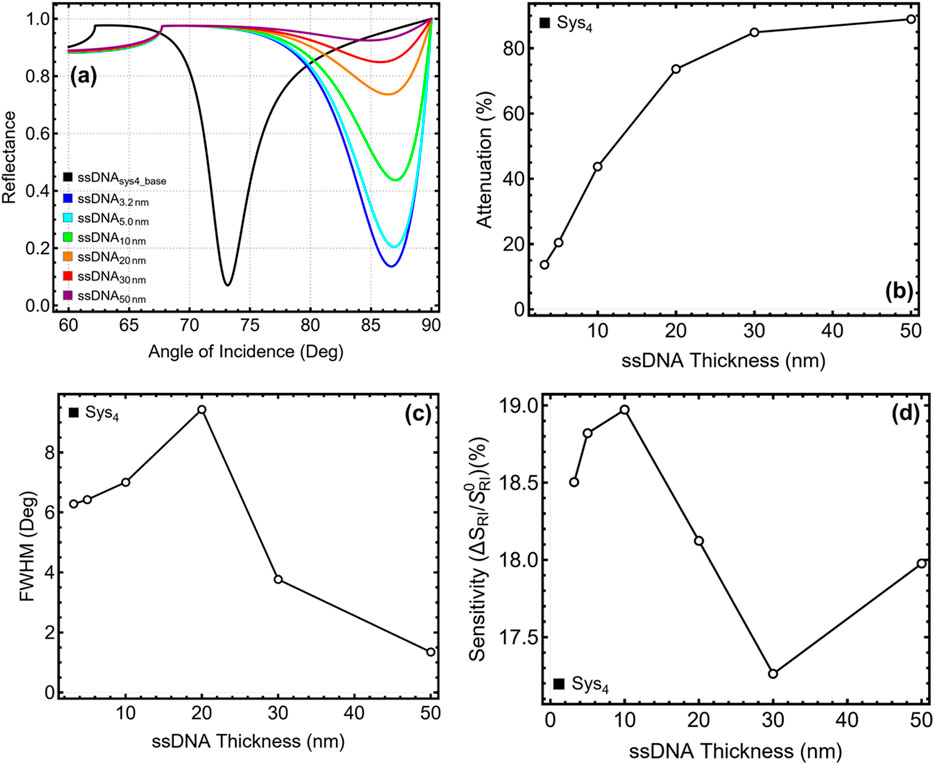
Figure 6. Performance analysis of Sys4 configuration with varying the ssDNA layer thickness from 3.2 nm to 50 nm. (a) SPR reflectance curves. (b) Percentage of attenuation for each configuration. (c) FWHM for each configuration. (d) Sensitivity enhancement (%), relative to the baseline system constructed with initial parameters (ssDNAsys4_base) and optimized silver/silicon nitride/graphene values.
The attenuation results in Figure 6b indicate a strong correlation between ssDNA thickness and plasmonic absorption. At 3.2 nm, Sys4 exhibits an attenuation of 13.62%, which increases to 20.45% at 5 nm and 43.71% at 10 nm. Beyond 10 nm, attenuation continues rising sharply, reaching 88.93% at 50 nm, confirming that excessive ssDNA thickness introduces considerable energy dissipation, reducing overall sensor stability. The FWHM analysis in Figure 6c reveals that moderate ssDNA thickness contributes to sharp resonance peaks, while excessive thickness causes substantial spectral broadening. The lowest values are observed at 30 nm (3.77°) and 50 nm (1.35°), but these configurations exhibit severe attenuation, compromising their practical applicability. At 5 nm, FWHM remains controlled at 6.43°, ensuring a well-defined resonance curve, while higher thickness values increase broadening, reaching 9.44° at 20 nm before narrowing due to excessive losses. These results suggest that moderate ssDNA thickness provides the best trade-off between plasmonic confinement and spectral resolution.
Sensitivity enhancement, presented in Figure 6d, follows a nonlinear trend, peaking at 10 nm before decreasing at larger thicknesses. Sensitivity increases from 18.50% at 3.2 nm to 18.97% at 10 nm, but beyond this point, a gradual decline is observed, with values dropping to 17.98% at 50 nm. This trend confirms that ssDNA effectively enhances molecular binding up to a specific thickness, beyond which additional layers do not contribute significantly to detection sensitivity. To achieve an optimal balance between SPR peak position, attenuation, spectral sharpness, and sensitivity, 5 nm is selected as the optimal ssDNA thickness for Sys4. This choice is justified by its well-defined resonance peak (86.92°), moderate attenuation (20.45%), and a controlled FWHM of 6.43°, ensuring efficient plasmonic interaction without excessive losses.
3.6 Malaria detection
Supplementary Table S6 presents the refractive index and optimized thickness values for the final configurations of Sys3 and Sys4, alongside the refractive index values for different malaria stages. These parameters define the structural and optical characteristics of the optimized systems, which will now be tested against ring (II), trophozoite (III), and schizont (IV) stages of the malaria parasite to evaluate their detection performance.
Notably, the optimized configuration of Sys3 consists of a silver layer with a thickness of 45.0 nm, a silicon nitride layer of 5.0 nm, and a graphene layer corresponding to 0.34 nm multiplied by two layers. The refractive indices for these materials are 1.5151 for BK7 glass, 2.0394 for silicon nitride, and 3.0 + 1.1491i for graphene, while silver exhibits a refractive index of 0.056253 + 4.2760i. The structure of Sys4 is similar to Sys3 but incorporates an additional ssDNA layer for enhanced biomolecular interaction. The silver thickness is 40.0 nm, silicon nitride is 6.0 nm, and graphene remains at 0.34 nm per layer for two layers, while the ssDNA layer has a thickness of 5.0 nm with a refractive index of 1.462. Additionally, Supplementary Table S6 provides the refractive indices of the three malaria stages under investigation. The ring stage exhibits the highest refractive index at 1.395, followed by the trophozoite stage at 1.381, and the schizont stage at 1.371, confirming a progressive reduction in refractive index as the parasite matures. This variation in refractive index obviously is expected to influence the plasmonic response of the biosensor, allowing for differentiation between malaria stages based on resonance shifts.
Figure 7 and Supplementary Table S7 present the performance analysis of the optimized Sys3 and Sys4 configurations when exposed to different malaria stages, ranging from normal (I) erythrocytes to schizont (IV) stage-infected cells. The baseline configurations (Opt_sys3_Normal(I) and Opt_sys4_Normal(I)), represented in black, serve as reference systems. The reflectance curves in Figure 7a (Sys3) and Figure 7b (Sys4) demonstrate a progressive shift in resonance angle as the malaria stage transitions from normal to schizont-infected erythrocytes, consistent with the decreasing refractive index of infected cells. In Sys3, the SPR peak moves from 85.18° for normal erythrocytes to 82.71° for the ring stage, 79.07° for the trophozoite stage, and 77.02° for the schizont stage, indicating a significant resonance shift across infection stages. Similarly, Sys4 exhibits a shift from 86.92° for normal erythrocytes to 84.71° for the ring stage, 80.73° for the trophozoite stage, and 78.59° for the schizont stage, reinforcing the system’s ability to detect malaria progression.
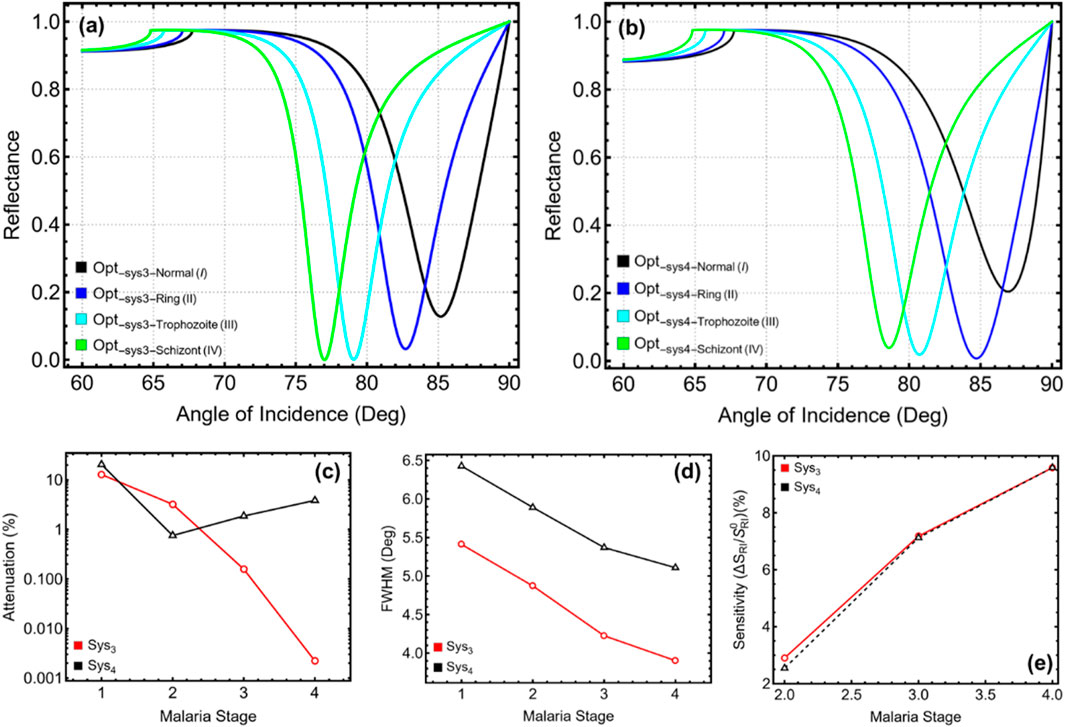
Figure 7. Performance analysis of optimized Sys3 and Sys4 configurations with varying the Malaria stage from Normal (I) to Schizont (IV). (a,b) SPR reflectance curves for optimized Sys3 and Sys4, respectively. (c) Percentage of attenuation for each configuration, y-axis-log scale is considered. (d) FWHM for each configuration. (e) Sensitivity enhancement (%) for Sys3 and Sys4, relative to the optimized systems taking as a sensing medium the Normal (I) stage (Opt_sys3-Normal(I) and Opt_sys4-Normal(I)).
The attenuation results in Figure 7c reveal a decreasing trend as the malaria stage progresses, correlating with the reduced optical confinement associated with lower refractive index values. For Sys3, attenuation drops from 12.82% at the normal stage to 3.21% at the ring stage, 0.16% at the trophozoite stage, and a negligible 0.002% at the schizont stage. In Sys4, attenuation follows a similar pattern, decreasing from 20.45% for normal erythrocytes to 0.75% for the ring stage, 1.86% for the trophozoite stage, and 3.86% for the schizont stage. The spectral width analysis in Figure 7d indicates progressively narrower resonance peaks as malaria progresses, suggesting an improvement in detection resolution for later infection stages. In Sys3, the spectral width decreases from 5.41° for normal erythrocytes to 4.87° at the ring stage, 4.23° at the trophozoite stage, and 3.90° at the schizont stage, implying that infected cells enhance spectral precision due to their distinct refractive index properties. A similar trend is observed in Sys4, where the spectral width reduces from 6.43° at the normal stage to 5.89° at the ring stage, 5.37° at the trophozoite stage, and 5.11° at the schizont stage, ensuring highly defined resonance responses.
The sensitivity enhancement results in Figure 7e confirm a steady increase across malaria stages, highlighting the system’s ability to differentiate infected cells. In Sys3, sensitivity increases from 0.0% at the normal stage to 2.90% at the ring stage, 7.17% at the trophozoite stage, and 9.58% at the schizont stage, indicating progressively higher sensitivity to later-stage infections. Similarly, in Sys4, sensitivity rises from 0.0% for normal erythrocytes to 2.54% for the ring stage, 7.12% for the trophozoite stage, and 9.58% for the schizont stage. These results validate that both Sys3 and Sys4 effectively track malaria progression, demonstrating clear resonance shifts and increasing sensitivity enhancement with advancing infection stages.
To emphasize, the observed shift of the SPR resonance angle toward lower values with malaria (Figure 7a, b) progression is attributed to the decreasing refractive index of infected red blood cells. As the infection advances from ring to schizont stage, hemoglobin consumption and structural degradation reduce the optical density of the sensing medium. This decrease in refractive index lowers the momentum required for plasmon excitation, resulting in a leftward shift of the resonance angle.
3.7 Performance sensing metrics
Figure 8 and Table 3 present the key performance metrics for optimized Sys3 and Sys4 across different malaria stages, assessing their effectiveness in detecting infected erythrocytes based on variations in resonance angle shift, sensitivity to refractive index changes, detection accuracy, and quality factor. The resonance angle shift analysis in Figure 8a demonstrates a progressive increase in shift magnitude as malaria progresses. In Sys3, the resonance angle shift increases from 2.47° at the ring stage to 6.11° at the trophozoite stage and 8.16° at the schizont stage, while Sys4 exhibits shifts of 2.21°, 6.19°, and 8.33° for the same stages, respectively. The larger shifts observed in later stages indicate higher biomolecular adsorption, reinforcing the effectiveness of both systems in malaria detection. Sensitivity trends in Figure 8b indicate a decreasing response with advancing infection stages, corresponding to the declining refractive index of infected erythrocytes. For Sys3, sensitivity decreases from 353.14°/RIU at the ring stage to 291.14°/RIU at the trophozoite stage and 263.26°/RIU at the schizont stage, while Sys4 follows a similar trend, reducing from 315.71°/RIU to 294.81°/RIU and 268.65°/RIU. Although Sys3 exhibits slightly higher sensitivity, both configurations maintain strong plasmonic responses, ensuring reliable malaria detection.
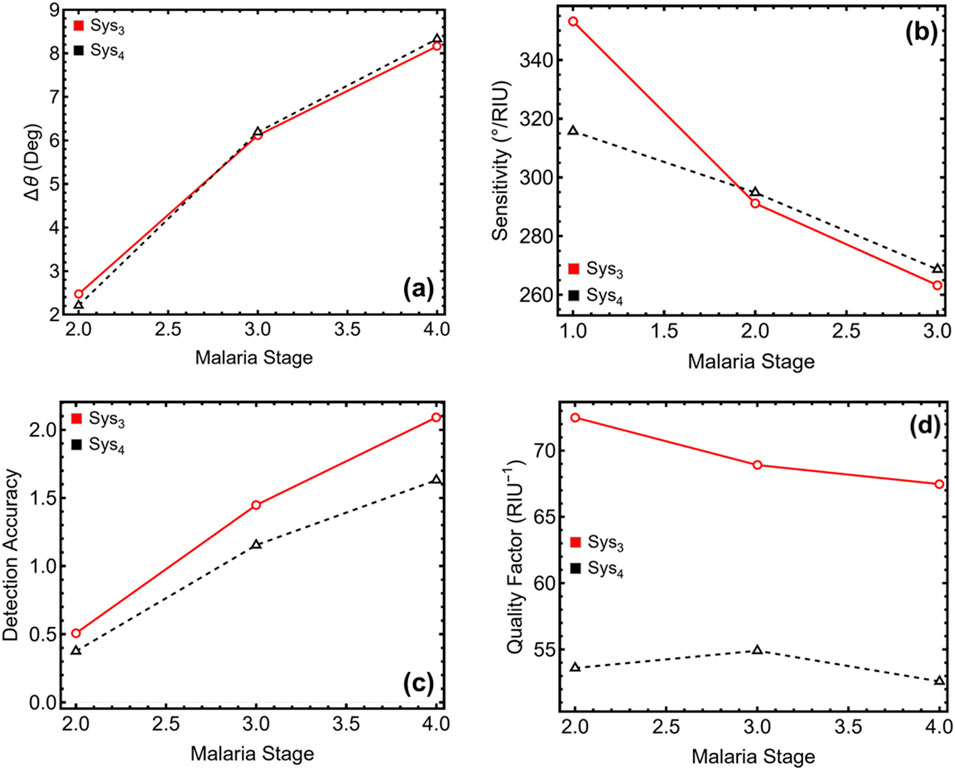
Figure 8. Performance metrics of the SPR biosensor for different malaria stages. (a) Variation in resonance angle shift (Δθ), (b) Sensitivity (°/RIU) to refractive index changes, (c) Detection accuracy, and (d) Quality factor (RIU−1) for each malaria stage.
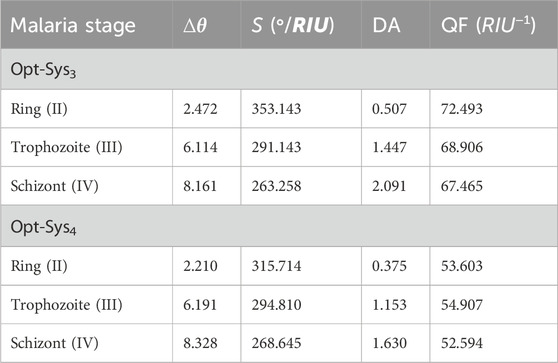
Table 3. Numerical values of the SPR biosensor performance metrics for different malaria stages, corresponding to the results presented in Figure 8. Δθ represents the resonance angle shift, S is the sensitivity, DA is the detection accuracy, and QF is the quality factor.
Detection accuracy results in Figure 8c show a steady increase across malaria stages, highlighting improved detection capabilities for later infection stages. In Sys3, accuracy increases from 0.51 at the ring stage to 1.45 at the trophozoite stage and 2.09 at the schizont stage, while Sys4 follows a similar pattern, rising from 0.38 to 1.15 and 1.63. These results confirm that both configurations effectively distinguish infected cells, with Sys3 exhibiting higher accuracy due to its sharper resonance features. Quality factor analysis in Figure 8d reveals a declining trend with malaria progression, consistent with the increasing spectral broadening and attenuation observed in previous analyses. In Sys3, the quality factor decreases from 72.49 RIU−1 at the ring stage to 68.91 RIU−1 at the trophozoite stage and 67.47 RIU−1 at the schizont stage, while Sys4 follows a similar trend, dropping from 53.60 RIU−1 to 54.91 RIU−1 and 52.59 RIU−1. Despite the reduction, the values remain within an acceptable range for biosensing applications, ensuring high-quality resonance responses. While Sys3 exhibits higher sensitivity and quality factor, Sys4 benefits from improved biorecognition due to the ssDNA layer, making both configurations highly suitable for malaria biomarker detection applications.
The higher QF observed in Sys3 compared to Sys4 is primarily due to its narrower resonance width. While both systems exhibit similar sensitivity values, the inclusion of the ssDNA layer in Sys4 introduces additional optical damping and broadening of the resonance dip. This effect slightly reduces angular precision and results in lower QF values for Sys4, despite its enhanced biorecognition capabilities.
Figure 9 and Table 4 present the further evaluation of key sensor quality parameters for Sys3 and Sys4, including the figure of merit, limit of detection, and comprehensively sensitive factor, across different malaria stages. The results in Figure 9a illustrate a declining figure of merit as malaria progresses, indicating a slight reduction in sensing efficiency due to spectral broadening and variations in plasmonic confinement. In Sys3, the figure of merit decreases from 70.16 RIU−1 at the ring stage to 68.80 RIU−1 at the trophozoite stage and 67.46 RIU−1 at the schizont stage, while Sys4 exhibits lower values, reducing from 53.20 RIU−1 at the ring stage to 53.88 RIU−1 at the trophozoite stage. Despite the decline, Sys3 consistently outperforms Sys4, maintaining higher plasmonic efficiency across all malaria stages. The limit of detection results in Figure 9b reveal an increasing trend with malaria progression, signifying improved detection capability in later infection stages. In Sys3, the limit of detection rises from 1.42 × 10⁻⁵ at the ring stage to 1.72 × 10⁻⁵ at the trophozoite stage and 1.90 × 10⁻⁵ at the schizont stage, while Sys4 follows a similar pattern, increasing from 1.58 × 10⁻⁵ at the ring stage to 1.70 × 10⁻⁵ at the trophozoite stage. These findings confirm that both configurations achieve excellent detection sensitivity, with Sys3 demonstrating a slightly enhanced ability to detect refractive index variations due to its sharper resonance features.
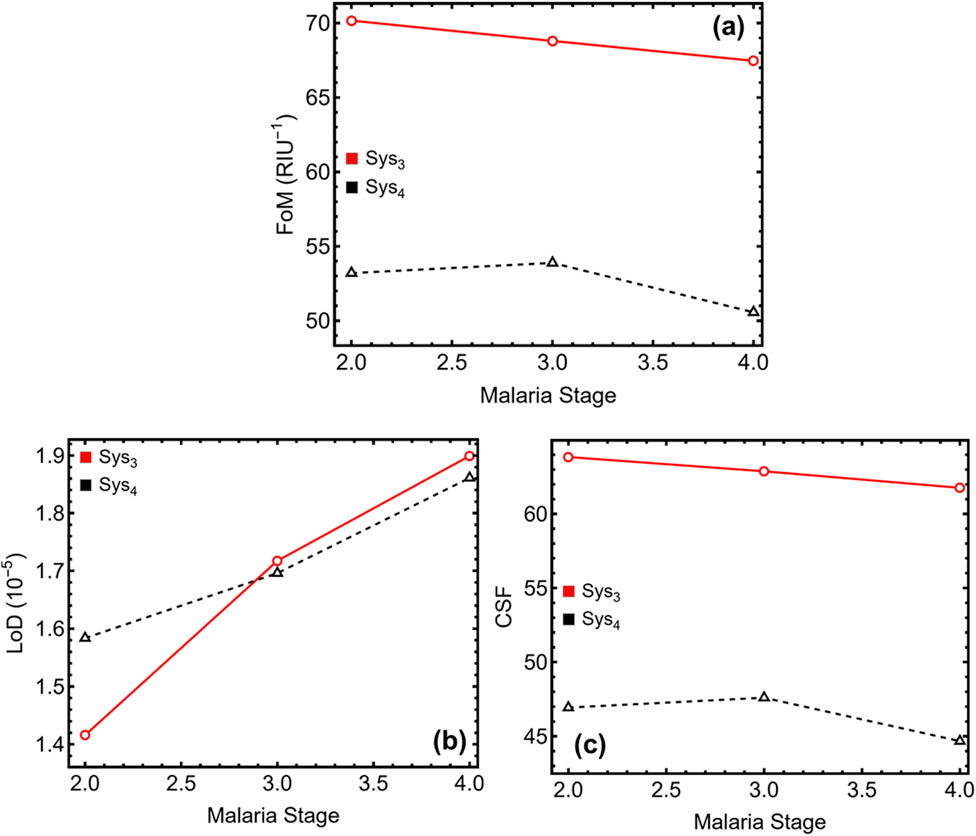
Figure 9. Additional performance metrics of the SPR biosensor for different malaria stages. (a) Figure of merit (FoM), (b) Limit of detection (LoD), and (c) Comprehensive sensitivity factor (CSF).
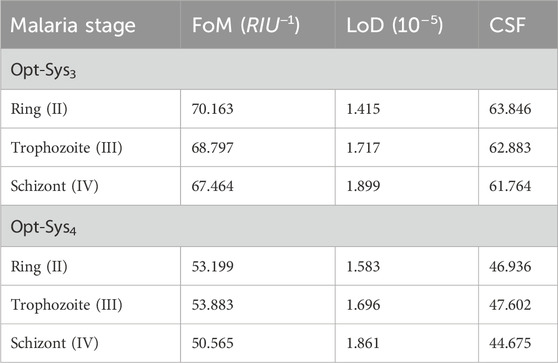
Table 4. Numerical values of the additional SPR biosensor performance metrics for different malaria stages, corresponding to the results presented in Figure 9. FoM represents the figure of merit, LoD is the limit of detection, and CSF is the comprehensive sensitivity factor.
The comprehensively sensitive factor, depicted in Figure 9c, assesses the biosensor’s combined sensitivity, selectivity, and stability, providing an overall performance metric. In Sys3, this factor decreases from 63.85 at the ring stage to 62.88 at the trophozoite stage and 61.76 at the schizont stage, while Sys4 exhibits lower values, reducing from 46.94 to 47.60 across the same stages. Again, these results indicate that Sys3 maintains slightly superior overall efficiency, benefiting from a more defined resonance response and a higher figure of merit. Although Sys4 offers enhanced biorecognition due to the ssDNA functionalisation, Sys3 remains the optimal configuration for precise malaria stage differentiation, ensuring higher detection efficiency, lower detection limits, and improved sensing stability.
3.8 State-of-the-art comparison
Table 5 presents a comparative analysis of the sensitivity performance of Sys3 and Sys4 against previously reported surface plasmon resonance biosensors, demonstrating the superior sensing capabilities of the proposed configurations. Unlike previous works, which primarily report a single sensitivity value without stage differentiation, the current study provides a detailed evaluation across different malaria infection stages, offering a more comprehensive insight into biosensor performance.
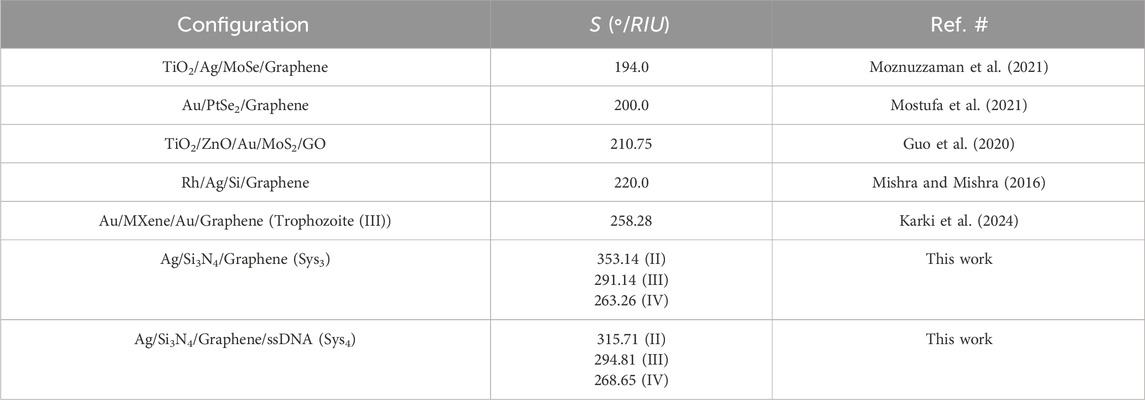
Table 5. Comparison with state-of-the-art SPR biosensors.
The reported values from the literature indicate sensitivity ranging from 194.0°/RIU for TiO2/Ag/MoSe2/Graphene to a maximum of 258.28°/RIU for Au/MXene/Au/Graphene targeting the trophozoite stage. Other configurations, such as TiO2/ZnO/Au/MoS2/GO, Rh/Ag/Si/Graphene, and Au/PtSe2/Graphene, exhibit sensitivity values between 200.0°/RIU and 220.0°/RIU, highlighting the typical range observed in conventional multi-layered plasmonic biosensors. In contrast, the optimized configurations in this work significantly outperform previously reported values, achieving 353.14°/RIU for the ring stage, 291.14°/RIU for the trophozoite stage, and 263.26°/RIU for the schizont stage in Sys3. Similarly, Sys4 achieves 315.71°/RIU for the ring stage, 294.81°/RIU for the trophozoite stage, and 268.65°/RIU for the schizont stage, confirming enhanced sensitivity compared to all previously investigated systems.
A key distinction of this work is the explicit differentiation of malaria infection stages, which has not been reported in most prior studies. The only reference providing stage-specific sensitivity (Au/MXene/Au/Graphene at 258.28°/RIU for the trophozoite stage) falls significantly below the corresponding values achieved by Sys3 (291.14°/RIU) and Sys4 (294.81°/RIU), reinforcing the superior performance of the proposed configurations. These findings confirm that the integration of silver, silicon nitride, graphene, and ssDNA layers in Sys3 and Sys4 results in a substantial enhancement in plasmonic sensitivity, enabling a more accurate and stage-specific detection of malaria infections.
We point out that the ability to differentiate malaria stages based on resonance angle shifts provides a clinically valuable feature beyond mere detection. Early-stage identification (e.g., ring stage) supports timely intervention, which is critical for reducing disease severity and transmission. In contrast, monitoring progression to later stages such as trophozoite and schizont enables assessment of treatment efficacy and disease resolution. Stage-specific detection may also assist in stratifying patient risk, adjusting therapeutic regimens, and evaluating drug resistance by correlating parasitic load with optical response, offering a practical tool for both diagnosis and longitudinal care.
3.9 Potential fabrication
To further emphasize, this study is entirely theoretical and based on the optical modeling of multilayer structures using refractive index values reported in the literature. As such, no specific fabrication method was employed. However, the proposed SPR configuration incorporates two layers of graphene, a structure that is feasible using techniques such as chemical vapor deposition (CVD) (Ning et al., 2025), which is widely used for producing large-area, uniform graphene films. Although practical challenges related to graphene transfer, contamination, and reproducibility are acknowledged, the present simulations assume an idealized, defect-free graphene interface to evaluate the biosensor’s theoretical performance potential.
With this in mind, a schematic of the potential fabrication process for the Sys4 SPR biosensor configuration is presented in Figure 10. The process begins with the deposition of a thin silver film onto the base of the prism. This layer can be deposited using physical vapor deposition techniques such as thermal evaporation (Mohammed et al., 2018) or magnetron sputtering (Hajakbari and Ensandoust, 2016), which offer good film uniformity and adhesion to glass substrates. A dielectric interlayer of silicon nitride is then deposited onto the silver surface. This step can be performed via plasma-enhanced chemical vapor deposition (PECVD) (Wardenberg et al., 2025) or atomic layer deposition (ALD) (Kim et al., 2024), both of which provide high control over thickness at the nanometer scale.
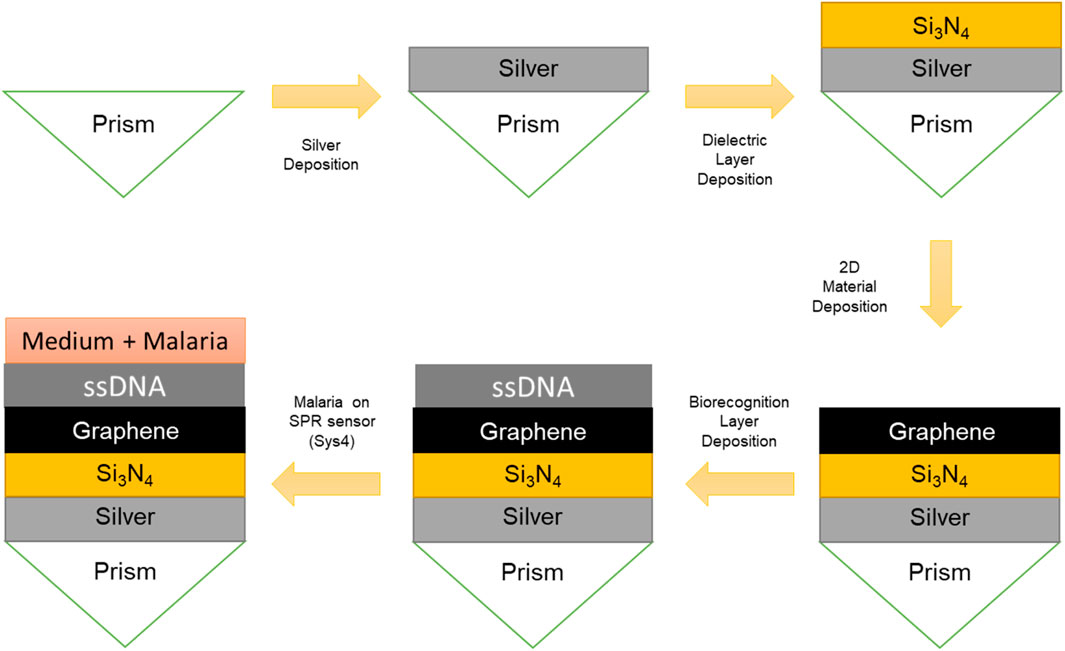
Figure 10. Schematic representation of the potential fabrication process of the proposed Sys4 SPR sensor.
Subsequently, bilayer graphene is transferred onto the Si3N4 surface. This is typically achieved by first synthesizing monolayer graphene on copper substrates via CVD (Liu et al., 2024), followed by a wet transfer process using a polymer support film such as polymethyl methacrylate (PMMA) (Deokar et al., 2015). After transfer, the support is removed, and the graphene is cleaned and left on the dielectric interface. While the modeling in this study assumes an ideal graphene surface, this step may introduce interfacial residues or bubbles that could affect practical sensor performance and would require optimization in future experimental work.
The final step involves the immobilization of a thiol-tethered ssDNA layer onto the graphene surface. Functionalization may be achieved through π–π stacking interactions using pyrene-based linkers (Domingues et al., 2024), or through covalent attachment strategies (Dugas et al., 2004), enabling stable and specific capture of complementary malaria DNA sequences in the sensing medium.
This layered structure forms the active SPR sensing interface. Upon exposure to malaria-infected samples, changes in the refractive index near the surface result in measurable shifts in the resonance angle, enabling stage-specific detection of the infection.
Additionally, while the proposed sensor configurations demonstrate strong performance under equilibrium conditions, this study does not include an analysis of the dynamic response following target molecule introduction. Modeling such time-dependent behavior would require a kinetic framework incorporating association and dissociation rate constants, molecular diffusion coefficients, and fluidic transport conditions. These parameters are system-specific and generally derived from experimental measurements. Given the theoretical scope of this work, only steady-state optical responses were considered. Future experimental studies will be essential to evaluate the sensor’s real-time performance and to validate its applicability in time-critical diagnostic settings.
4 Conclusion
This study presents a theoretical design and optimization of a graphene-integrated SPR biosensor for malaria detection and stage differentiation. By combining silver, silicon nitride, graphene, and thiol-tethered ssDNA in Sys3 and Sys4 configurations, enhanced plasmonic performance was achieved. Sys3 demonstrated the highest sensitivity (353.14°/RIU for the ring stage), sharper resonance dips, and superior quality factor, while Sys4 offered improved biorecognition due to its functional layer. Both systems successfully distinguished among malaria stages based on refractive index changes, offering potential for early diagnosis and treatment monitoring. For clinical translation, challenges such as fabrication reproducibility, interfacial stability, and sample handling must be addressed. Future work should include experimental validation, assessment with real biological samples, and integration with microfluidic systems to support point-of-care deployment in endemic regions.
Data availability statement
The original contributions presented in the study are included in the article/Supplementary Material, further inquiries can be directed to the corresponding authors.
Author contributions
TT: Conceptualization, Data curation, Formal Analysis, Funding acquisition, Investigation, Methodology, Project administration, Resources, Software, Supervision, Validation, Visualization, Writing – original draft, Writing – review and editing. FA: Conceptualization, Data curation, Formal Analysis, Funding acquisition, Investigation, Methodology, Project administration, Resources, Software, Supervision, Validation, Visualization, Writing – original draft, Writing – review and editing. KP-P: Conceptualization, Data curation, Formal Analysis, Funding acquisition, Investigation, Methodology, Project administration, Resources, Software, Supervision, Validation, Visualization, Writing – original draft, Writing – review and editing. JG: Conceptualization, Data curation, Formal Analysis, Funding acquisition, Investigation, Methodology, Project administration, Resources, Software, Supervision, Validation, Visualization, Writing – original draft, Writing – review and editing. NB: Conceptualization, Data curation, Formal Analysis, Funding acquisition, Investigation, Methodology, Project administration, Resources, Software, Supervision, Validation, Visualization, Writing – original draft, Writing – review and editing. CV: Conceptualization, Data curation, Formal Analysis, Funding acquisition, Investigation, Methodology, Project administration, Resources, Software, Supervision, Validation, Visualization, Writing – original draft, Writing – review and editing.
Funding
The author(s) declare that financial support was received for the research and/or publication of this article. This work was funded and supported by Universidad Técnica Particular de Loja under grant No.: POA_VIN-56. This work was partially supported by LNF-INFN: Progetto HPSWFOOD Regione Lazio-CUP I35F20000400005.
Acknowledgments
CV and TT wish to thank Escuela Superior Politécnica de Chimborazo for their hospitality during the completion of this work.
Conflict of interest
The authors declare that the research was conducted in the absence of any commercial or financial relationships that could be construed as a potential conflict of interest.
Generative AI statement
The author(s) declare that Generative AI was used in the creation of this manuscript. The English was improve by ChatGPT 4o and Grammarly.
Publisher’s note
All claims expressed in this article are solely those of the authors and do not necessarily represent those of their affiliated organizations, or those of the publisher, the editors and the reviewers. Any product that may be evaluated in this article, or claim that may be made by its manufacturer, is not guaranteed or endorsed by the publisher.
Supplementary material
The Supplementary Material for this article can be found online at: https://www.frontiersin.org/articles/10.3389/fbioe.2025.1580344/full#supplementary-material
References
Abbas, N., Saba, T., Mohamad, D., Rehman, A., Almazayad, A. S., and Al-Ghamdi, J. S. (2018). Machine aided malaria parasitemia detection in giemsa-stained thin blood smears. Neural comput. Appl. 29, 803–818. doi:10.1007/s00521-016-2474-6
Agnero, M. A., Konan, K., Tokou, Z. G. C. S., Kossonou, Y. T. A., Dion, B. S., Kaduki, K. A., et al. (2019). Malaria-infected red blood cell analysis through optical and biochemical parameters using the transport of intensity equation and the microscope’s optical properties. Sensors 19, 3045. doi:10.3390/s19143045
Akib, T. B. A., Rana, M. M., and Mehedi, I. M. (2024). Multi-layer SPR biosensor for in-situ amplified monitoring of the SARS-CoV-2 omicron (B.1.1.529) variant. Biosens. Bioelectron. X 16, 100434. doi:10.1016/j.biosx.2023.100434
Anderson, D. C., Lapp, S. A., Akinyi, S., Meyer, E. V. S., Barnwell, J. W., Korir-Morrison, C., et al. (2015). Plasmodium vivax trophozoite-stage proteomes. J. Proteomics 115, 157–176. doi:10.1016/j.jprot.2014.12.010
Bendib, S., and Bendib, C. (2018). Photonic crystals for malaria detection. J. Biosens. Bioelectron. 9, 3. doi:10.4172/2155-6210.1000257
Chakma, B., Jain, P., and Goswami, P. (2023). “Protein-based biomarkers for the diagnosis of malaria in point-of-care settings,” in Enzyme-based biosensors: recent advances and applications in healthcare. Editors S. Patra, D. Kundu, and M. Gogoi (Singapore: Springer Nature Singapore), 217–235. doi:10.1007/978-981-15-6982-1_9
Coello-Fiallos, D., Tene, T., Guayllas, J. L., Haro, D., Haro, A., and Vacacela Gomez, C. (2017). DFT comparison of structural and electronic properties of graphene and germanene: monolayer and bilayer systems. Mater. Today Proc. 4, 6835–6841. doi:10.1016/j.matpr.2017.07.011
Deokar, G., Avila, J., Razado-Colambo, I., Codron, J. L., Boyaval, C., Galopin, E., et al. (2015). Towards high quality CVD graphene growth and transfer. Carbon 89, 82–92. doi:10.1016/j.carbon.2015.03.017
Domingues, T., Liao, C. D., Prado, M., Cerqueira, M. F., Petrovykh, D. Y., Alpuim, P., et al. (2024). Tailoring DNA surface interactions on single-Layer graphene: comparative analysis of pyrene, Acridine, and fluorenyl methyl linkers. Langmuir 41 (1), 263–273. doi:10.1021/acs.langmuir.4c03420
Dugas, V., Depret, G., Chevalier, Y., Nesme, X., and Souteyrand, É. (2004). Immobilization of single-stranded DNA fragments to solid surfaces and their repeatable specific hybridization: covalent binding or adsorption? Sensors Actuators B Chem. 101 (1-2), 112–121. doi:10.1016/s0925-4005(04)00118-2
Fallon, S. M., Ricklefs, R. E., Swanson, B. L., and Bermingham, E. (2003). Detecting avian malaria: an improved polymerase chain reaction diagnostic. J. Parasitol. 89, 1044–1047. doi:10.1645/GE-3157
Guo, S., Wu, X., Li, Z., and Tong, K. (2020). High-sensitivity biosensor-based enhanced SPR by ZnO/MoS2 nanowires array layer with graphene oxide nanosheet. Int. J. Opt. 2020, 1–6. doi:10.1155/2020/7342737
Hajakbari, F., and Ensandoust, M. (2016). Study of thermal annealing effect on the properties of silver thin films prepared by DC magnetron sputtering. Acta Phys. Pol. A 129 (4), 680–682. doi:10.12693/aphyspola.129.680
Karki, B., Pal, A., Sarkar, P., Uniyal, A., and Yadav, R. B. (2024). Gold, MXene, and graphene nanofilm-based surface plasmon resonance sensor for malaria detection. J. Opt. 53, 4805–4816. doi:10.1007/s12596-024-01661-z
Kim, J., Yeon, C., Cho, D. H., Jung, J., and Shong, B. (2024). Enhancement of conformality of silicon nitride thin films by ABC-type atomic layer deposition. Adv. Electron. Mater. 10 (3), 2300722. doi:10.1002/aelm.202300722
Kogan, F. (2020). “Remote sensing for malaria: monitoring and predicting malaria from operational satellites,” in Springer remote sensing/photogrammetry (Cham, Switzerland: Springer), 15–41. doi:10.1007/978-3-030-46020-4
Kozicki, M., Czepiel, J., Biesiada, G., Nowak, P., Garlicki, A., and Weselucha-Birczynska, A. (2015). The ring-stage of Plasmodium falciparum observed in RBCs of hospitalized malaria patients. Analyst 140, 8007–8016. doi:10.1039/C5AN01598G
Kumar, A., Kumar, A., and Srivastava, S. K. (2022). Silicon nitride-BP-based surface plasmon resonance highly sensitive biosensor for virus SARS-CoV-2 detection. Plasmonics 17, 1065–1077. doi:10.1007/s11468-021-01589-1
Kumar, P., Kumar, R., Singh, M. K., and Ahmed, B. (2024). Detection of plasma, platelets, hemoglobin in blood sample of dengue malaria based on surface plasmon resonance biosensor using black Phosphorus: a numerical analysis. Plasmonics 19, 1779–1790. doi:10.1007/s11468-023-02113-3
Lee, K.-S., and El-Sayed, M. A. (2006). Gold and silver nanoparticles in sensing and imaging: sensitivity of plasmon response to size, shape, and metal composition. J. Phys. Chem. B 110, 19220–19225. doi:10.1021/jp062536y
Liu, S., He, B., Yang, W., Zhou, X., Xue, X., Liu, M., et al. (2024). In situ growth of high-quality single-crystal twisted bilayer graphene on liquid copper. Adv. Mater. 36 (11), 2312125. doi:10.1002/adma.202312125
Mishra, A. K., and Mishra, S. K. (2016). Gas sensing in Kretschmann configuration utilizing Bi-metallic layer of rhodium-silver in visible region. Sens. Actuators B Chem. 237, 969–973. doi:10.1016/j.snb.2016.07.041
Mohammed, M. A., Abdulridha, W. M., and Abd, A. N. (2018). Thickness effect on some physical properties of the Ag thin films prepared by thermal evaporation technique. J. Glob. Pharma Technol. 10 (3), 613–619.
Morris, U., and Aydin-Schmidt, B. (2021). Performance and application of commercially available loop-mediated isothermal amplification (LAMP) kits in malaria endemic and non-endemic settings. Diagnostics 11, 336. doi:10.3390/diagnostics11020336
Mostufa, S., Paul, A. K., and Chakrabarti, K. (2021). Detection of hemoglobin in blood and urine glucose level samples using a graphene-coated SPR-based biosensor. OSA Contin. 4, 2164–2176. doi:10.1364/OSAC.433633
Moznuzzaman, M., Khan, I., and Islam, M. R. (2021). Nano-layered surface plasmon resonance-based highly sensitive biosensor for virus detection: a theoretical approach to detect SARS-CoV-2. AIP Adv. 11, 065023. doi:10.1063/5.0046574
Mukkala, A. N., Kwan, J., Lau, R., Harris, D., Kain, D., and Boggild, A. K. (2018). An update on malaria rapid diagnostic tests. Curr. Infect. Dis. Rep. 20, 49. doi:10.1007/s11908-018-0655-4
Naik, G. V., Shalaev, V. M., and Boltasseva, A. (2013). Alternative plasmonic materials: beyond gold and silver. Adv. Mater. 25, 3264–3294. doi:10.1002/adma.201205076
Ning, C., Yang, Q., Jin, Y., Gong, X., Zhu, Y., Mao, A., et al. (2025). Confined CVD synthesis and temperature-dependent spectroscopic properties of bilayer graphene ribbon arrays with bifunctional modulation of adhesion metal. Small Methods 9, 2401680. doi:10.1002/smtd.202401680
Payne, D. (1988). Use and limitations of light microscopy for diagnosing malaria at the primary health care level. Bull. World Health Organ. 66, 621–626.
Philip, A., and Kumar, A. R. (2022). The performance enhancement of surface plasmon resonance optical sensors using nanomaterials: a review. Coord. Chem. Rev. 458, 214424. doi:10.1016/j.ccr.2022.214424
Pravesh, R., Kumar, D., Pandey, B. P., Chaudhary, V. S., and Kumar, S. (2024). A highly sensitive photonic crystal fibre biosensor for early malaria detection via RBC variation monitoring. J. Opt. 26, 115301. doi:10.1088/2040-8986/ad7965
Proux, S., Suwanarusk, R., Barends, M., Zwang, J., Price, R. N., Leimanis, M., et al. (2011). Considerations on the use of nucleic acid-based amplification for malaria parasite detection. Malar. J. 10, 323. doi:10.1186/1475-2875-10-323
Ragavan, K. V., Kumar, S., Swaraj, S., and Neethirajan, S. (2018). Advances in biosensors and optical assays for diagnosis and detection of malaria. Biosens. Bioelectron. 105, 188–210. doi:10.1016/j.bios.2018.01.037
Rasheed, S., Kanwal, T., Ahmad, N., Fatima, B., Najam-ul-Haq, M., and Hussain, D. (2024). Advances and challenges in portable optical biosensors for onsite detection and point-of-care diagnostics. Trac. Trends Anal. Chem. 173, 117640. doi:10.1016/j.trac.2024.117640
Roobsoong, W., Roytrakul, S., Sattabongkot, J., Li, J., Udomsangpetch, R., and Cui, L. (2011). Determination of the Plasmodium vivax schizont stage proteome. J. Proteomics 74, 1701–1710. doi:10.1016/j.jprot.2011.03.035
Shukla, N., Chetri, P., Boruah, R., Gogoi, A., and Ahmed, G. A. (2022). “Surface plasmon resonance biosensors based on Kretschmann configuration: basic instrumentation and applications,” in Recent advances in plasmonic probes: theory and practice. Editors R. Biswas, and N. Mazumder (Cham: Springer International Publishing), 191–222. doi:10.1007/978-3-030-99491-4_6
Stefancu, A., Halas, N. J., Nordlander, P., and Cortes, E. (2024). Electronic excitations at the plasmon–molecule interface. Nat. Phys. 20, 1065–1077. doi:10.1038/s41567-024-02537-6
Tene, T., Arias Arias, F., Paredes-Páliz, K. I., Haro-Barroso, C., and Vacacela Gomez, C. (2024b). An optimized graphene-based surface plasmon resonance biosensor for detecting SARS-CoV-2. Appl. Sci. 14, 10724. doi:10.3390/app142210724
Tene, T., Bellucci, S., Arias Arias, F., Carrera Almendariz, L. S., Flores Huilcapi, A. G., and Vacacela Gomez, C. (2024a). Role of graphene in surface plasmon resonance-based biosensors. Sensors 24, 4670. doi:10.3390/s24144670
Tene, T., Cevallos, Y., Vinueza-Naranjo, P. G., Inca, D., and Vacacela Gomez, C. (2025a). Black phosphorous-based surface plasmon resonance biosensor for malaria diagnosis. Sensors 25 (7), 2068. doi:10.3390/s25072068
Tene, T., Coello-Fiallos, D., Borja, M., Sánchez, N., Londo, F., Vacacela Gomez, C., et al. (2025b). Surface plasmon resonance biosensors for SARS-CoV-2 sensing: the role of silicon nitride and graphene. Biosens. Bioelectron. X 23, 100586. doi:10.1016/j.biosx.2025.100586
Tene, T., Guevara, M., Romero, P., Guapi, A., Gahramanli, L., and Vacacela Gomez, C. (2024c). SARS-CoV-2 detection by surface plasmon resonance biosensors based on graphene-multilayer structures. Front. Phys. 12. doi:10.3389/fphy.2024.1503400
Tene, T., Svozilík, J., Colcha, D., Cevallos, Y., Vinueza-Naranjo, P. G., Vacacela Gomez, C., et al. (2024d). The tunable parameters of graphene-based biosensors. Sensors 24, 5049. doi:10.3390/s24155049
Wang, Q., Ren, Z.-H., Zhao, W.-M., Wang, L., Yan, X., Zhu, A.-S., et al. (2022). Research advances on surface plasmon resonance biosensors. Nanoscale 14, 564–591. doi:10.1039/D1NR05400G
Wang, R., Tombelli, S., Minunni, M., Spiriti, M. M., and Mascini, M. (2004). Immobilisation of DNA probes for the development of SPR-based sensing. Biosens. Bioelectron. 20, 967–974. doi:10.1016/j.bios.2004.06.013
Wardenberg, L., Kühling, A., and Schilling, J. (2025). Optical second-and third-order nonlinearities in plasma-enhanced chemical vapor deposition-grown silicon oxides and silicon nitrides. Adv. Photonics Res. 6 (5), 2400142. doi:10.1002/adpr.202400142
Keywords: surface plasmon resonance, kretschmann configuration, transfer matrix method, silicon nitride, graphene, biosensors, malaria
Citation: Tene T, Arias Arias F, Paredes-Páliz KI, González García JC, Bonilla García N and Vacacela Gomez C (2025) Design and simulation of a graphene-integrated SPR biosensor for malaria detection. Front. Bioeng. Biotechnol. 13:1580344. doi: 10.3389/fbioe.2025.1580344
Received: 20 February 2025; Accepted: 09 June 2025;
Published: 23 June 2025.
Edited by:
Nsikak U. Benson, Topfaith University, NigeriaCopyright © 2025 Tene, Arias Arias, Paredes-Páliz, González García, Bonilla García and Vacacela Gomez. This is an open-access article distributed under the terms of the Creative Commons Attribution License (CC BY). The use, distribution or reproduction in other forums is permitted, provided the original author(s) and the copyright owner(s) are credited and that the original publication in this journal is cited, in accordance with accepted academic practice. No use, distribution or reproduction is permitted which does not comply with these terms.
*Correspondence: Talia Tene, dGJ0ZW5lQHV0cGwuZWR1LmVj; Cristian Vacacela Gomez, Y3Jpc3RpYW5pc2FhYy52YWNhY2VsYWdvbWV6QGZpcy51bmljYWwuaXQ=