 Corinna Modiz1,2*
 Natalia M. Castoldi1
 Stefan Scheiner3
 Javier Martínez-Reina4Jose L. Calvo-Gallego4
 Vittorio Sansalone2
 Saulo Martelli1
 Peter Pivonka1
- 1School of Mechanical, Medical and Process Engineering, Queensland University of Technology, Brisbane, QLD, Australia
- 2Univ Paris Est Creteil, Univ Gustave Eiffel, CNRS, UMR 8208, MSME, F-94010, Créteil, France
- 3Institute for Mechanics of Materials and Structures, TU Wien, Vienna, Austria
- 4Departamento de Ingeniería Mecánica y Fabricación, Universidad de Sevilla, Sevilla, Spain
Introduction: Bone diseases significantly impact global health by compromising skeletal integrity and quality of life. In disease states linked to parathyroid hormone (PTH) glandular secretion, disrupted PTH patterns typically promote osteoclast proliferation, leading to increased bone resorption.
Methods: While mathematical modeling has proven valuable in analyzing bone remodeling, current bone cell population models oversimplify PTH secretion by assuming constant levels, limiting their ability to represent disorders characterized by variations in PTH pulse characteristics. To address this, we present a novel semi-coupled approach integrating a two-state PTH receptor model with an established bone cell population model. Instead of conventional Hill-type functions, we implement a cellular activity function derived from the receptor model, incorporating pulsatile PTH patterns, cell dynamics, and intracellular communication pathways.
Results: Our numerical simulations demonstrate the model’s capability to reproduce various catabolic bone diseases, providing realistic changes in bone volume fraction over a 1-year period. Notably, while direct implementation of PTH disease progression in the bone cell population model fails to capture diseases only characterized by altered pulse duration and baseline, such as glucocorticoid-induced osteoporosis, our semi-coupled approach successfully models these conditions.
Discussion: This physiologically more realistic approach to endocrine disease modeling offers potential implications for optimizing therapeutic interventions and understanding disease progression mechanisms.
1 Introduction
As bone diseases continue to impact global health with serious effects on quality of life, mathematical modeling offers insights into the complex cellular and molecular mechanisms, which control bone remodeling. The objective of the current work is to develop a multi-scale computational model of bone remodeling which can predict bone diseases related to dysfunctional parathyroid gland activity.
The parathyroid gland is responsible for the production of parathyroid hormone (PTH), one of the major hormones in vertebrates besides calcitriol and calcitonin for regulation of calcium homeostasis and bone health (Hernández-Castellano et al., 2020). The pulsatile nature of PTH secretion is a fundamental characteristic shared by many hormones, where pulsatility is believed to modulate target organ responsiveness and shows deviations in disease states as well as circadian and seasonal fluctuations (Chiavistelli et al., 2015). The PTH secretion pattern is characterized by tonic (i.e., constant) and pulsatile components. In healthy subjects, the tonic part of PTH secretion constitutes the majority (70%), whereas approximately 30% is secreted in low-amplitude and high-frequency bursts occurring every 10–20 min, superimposed on the tonic secretion (Chiavistelli et al., 2015). While the exact mechanisms underlying pulsatile hormone secretion are complex and not yet fully understood, the biological importance of PTH pulsatility to bone metabolism is supported by experimental evidence showing that intermittent PTH drug administration produces anabolic effects, whereas continuous administration results in catabolic outcomes (Locklin et al., 2003; Capriani et al., 2012). To understand this complex regulatory mechanism, it is necessary to examine PTH effects at the cellular level.
PTH plays a central role in maintaining calcium homeostasis through a feedback loop: parathyroid cells express calcium-sensing receptors that detect changes in serum calcium levels, with low calcium triggering increased PTH pulse amplitude and frequency, while high calcium results in the opposite effect (Chiavistelli et al., 2015). This creates a regulatory cycle where low serum calcium stimulates PTH secretion, which enhances bone remodeling activity and calcium release, leading to increased serum calcium levels. As calcium levels rise, PTH secretion is reduced and the thyroid releases calcitonin, which lowers the blood calcium level (Sun et al., 2020). Beyond the parathyroid-bone axis, calcium homeostasis involves complex interactions between multiple organ systems, including bone, intra- and extracellular fluid compartments, gut (oral intake), kidney, and the parathyroid gland (Peterson and Riggs, 2010; Sun et al., 2020). Dynamic PTH secretion patterns are fundamental to calcium homeostasis regulation and the pathogenesis of bone diseases.
PTH targets the parathyroid hormone/parathyroid hormone-related protein receptor (PTH/PTHrP type 1 receptor), also commonly known as PTH1R (Cheloha et al., 2015). PTH1R is a G-protein-coupled receptor that regulates skeletal development, bone turnover and mineral homeostasis. PTH1R transduces stimuli from PTH and PTH-related protein (PTHrP) into the interior of target cells (i.e., cells of the osteoblastic lineage) to promote several divergent signaling cascades (Cheloha et al., 2015). Changes in the PTH secretion pattern have been associated with various diseases including primary and secondary osteoporosis, and hyperparathyroidism (Bilezikian et al., 2018; Schaefer, 2000; Harms et al., 1994b; a; Bonadonna et al., 2005), ultimately leading to an imbalanced bone remodeling activity and distorted calcium homeostasis. Simulating bone diseases related to PTH glandular secretion and the corresponding bone cellular activities is the first step in exploring efficient drug treatments.
Osteoporosis (OP) is one of the most frequent musculoskeletal diseases affecting people worldwide (Aibar-Almazán et al., 2022; Salari et al., 2021). OP is characterized by low bone mass and altered bone quality, which ultimately leads to bone fractures. This disease is characterized by imbalanced bone remodeling–the fundamental process that regulates bone homeostasis. In bone remodeling, osteoclastic cells resorb the existing bone matrix, while osteoblastic cells replace the bone matrix by initially forming osteoid, which subsequently gets mineralized. In OP the balance between bone resorption and formation is biased towards resorption with diminished bone formation. Depending on the underlying causes, several types can be distinguished including postmenopausal and senile osteoporosis (Aibar-Almazán et al., 2022). Over the last few decades, a large variety of drugs have been developed, which help combat osteoporosis. The rapid increase in bone biology knowledge has led to the development of mechanobiological pharmacokinetic-pharmacodynamic (PK-PD) models of osteoporosis treatments. As reviewed in Pivonka et al. (2024), these in silico models allow predictions beyond bone mineral density (BMD), i.e., bone microdamage and degree of mineralization. Hence, in silico trials may serve as complementary tools to experimental studies, potentially contributing to our understanding of drug dosing and combinational treatments, though extensive validation of bone remodeling models across multiple scales remains essential before any clinical application.
Two primary formulations exist for modeling bone cell population dynamics (Cook et al., 2024). The first approach by Komarova et al. (2003) uses power laws where exponent terms represent the accumulated effects of signaling molecules governing both self- and externally-regulated cellular pathways. This results in a relatively small parameter space but creates inherent limitations in interpretability and extensibility. This approach has been further developed for spatio-temporal dynamics (Ryser et al., 2009; 2010). The accumulation of signaling effects makes it difficult to isolate the contributions of individual biomolecular factors on specific cell types. The second approach by Lemaire et al. (2004) employs mass kinetics formulations with explicit Michaelis-Menten and Hill equations for enzyme and ligand binding kinetics. This enables direct identification of how specific signaling factors affect osteoblast and osteoclast concentrations, providing clear biomolecular targets for drug treatments and disease modeling. The explicit modeling of receptor-ligand interactions results in a larger parameter space, but enables studying hormone signaling patterns in healthy and disease states. Thus, we adopt the mass kinetics framework in the present study due to its explicit incorporation of PTH1R receptors expressed on osteoblastic cells and PTH-PTH1R binding kinetics.
Currently no bone disease progression models with links to PTH glandular secretion patterns exist. Endocrine diseases are typically defined by comparing serum levels of endocrine factors with the “normal (or reference) range”. This reference range is used to discern hyper- and hypofunction of respective glands. Dynamic, time-dependent diseases may evolve within the normal range and are characterized by increased or decreased secretory dynamics (Chiavistelli et al., 2015; Schmitt et al., 2005). PTH glandular secretion governs osteoblastic cellular responses in bone and a disturbed function of the parathyroid gland can lead to development of progressive bone diseases. Consequently, the existing knowledge of healthy and pathological PTH glandular secretion patterns need to be incorporated into bone cell population models to accurately describe disease progression.
Schappacher-Tilp et al. (2019) developed a comprehensive mathematical model, which includes the major adaptive mechanisms governing the production, secretion, and degradation of PTH in patients with chronic kidney disease on hemodialysis. This work aimed to investigate the efficacy of parathyroid drugs. The model focused on simulating hemodialysis patients with secondary hyperparathyroidism, but has the potential to be extended and applied to other diseases such as primary hyperparathyroidism or hypo- and hypercalcemia. The ionized calcium concentration–which regulates the parathyroid gland response via the calcium sensing receptor–was provided as an input parameter for this model. However, (ionized) calcium concentration depends directly on bone turnover. Consequently, consideration of the bone remodeling process is essential.
Most computational models of bone remodeling are formulated as bone cell population models and include the action of PTH on bone cells in a simplistic manner: constant concentrations of PTH in the central- and/or bone fluid compartment in combination with one-state receptor models (Lemaire et al., 2004; Pivonka et al., 2008; Pivonka and Komarova, 2010; Scheiner et al., 2013; Trichilo et al., 2019). These models simulate catabolic action of PTH on osteoclasts by using a constant PTH concentration as input parameter to mimic both healthy state and particular bone diseases. PTH binds to its receptor PTH1R, expressed on osteoblasts (Datta and Abou-Samra, 2009); the receptor-ligand binding reaction is described by a one-state receptor model. The binding of PTH to its receptor is much faster than a cellular response such as differentiation, proliferation and/or production of ligands of osteoblasts, with binding occurring within minutes (Okazaki et al., 2008) compared to cellular processes that take tens of hours to days (Roberts et al., 1982). Hence, a steady-state assumption is used for solving these binding reactions resulting in a Hill-type equation for the activator/repressor functions, consistent with previous mathematical modeling approaches (Lemaire et al., 2004; Pivonka et al., 2008; Scheiner et al., 2013). The activator/repressor functions are based on receptor occupancy as a function of PTH concentration and total number of receptors expressed on osteoblasts (Datta and Abou-Samra, 2009). In the bone cell population models of Lemaire et al. (2004) and Pivonka et al. (2008), Pivonka and Komarova (2010), the PTH activator and repressor functions influence an intracellular communication pathway, which results in increased osteoclast activity and consequently catabolic bone resorption. While this type of approach is practical and simple to apply for creating catabolic bone remodeling states, it fails to address the link between pathological PTH release patterns and the different observed bone diseases.
Potter et al. (2005) proposed the first computational model to analyze PTH1R kinetics, focusing on the response to constant vs pulsatile dosing patterns of PTH. They introduced a measure of sensitization with values between 1 (highly sensitized) and 0 (desensitized). The study investigated clinically prescribed PTH drug dosing patterns and found a sensitization measure of around 0.9. However, they found a value of 0.89 for healthy glandular PTH secretion patterns. This proximity indicates that the proposed measure of sensitization is not meaningful to use as an activator function for osteoblast response as it is not able to distinguish between anabolic and catabolic actions of PTH.
Recently, Pivonka and co-workers applied the two-state receptor model to PTH1R to analyze the effects of PTH glandular and external dosing patterns on bone cell activity (Martonová et al., 2023). The work focused on clinically observed catabolic bone diseases related to perturbations of PTH glandular secretion. Following the approach proposed by Li and Goldbeter (1989), a cellular osteoblast activity function was developed, which can distinguish various aspects of the stimulation signal including peak dose, time of ligand exposure, and exposure period. Using this formulation, the potential of pharmacological manipulation of the diseased glandular secretion to restore healthy bone, cellular responsiveness via clinical approved external PTH injections was investigated. While it was mentioned that the so derived cellular activity function could be linked with a cell population model of bone remodeling, no description on how this could be accomplished was provided.
In this paper we develop a multi-scale bone cell population model based on a two-state receptor model of PTH1R accounting for dynamic PTH secretion patterns. This model is based on our previous work on a (osteoblastic) cellular responsiveness function, which can distinguish different PTH dosing patterns in health and disease (Martonová et al., 2023). We propose a calibration strategy that compares cellular activity values from the two-state receptor model with receptor occupancy values from the one-state model. We solve this problem in a semi-coupled way based on fulfillment of separation of time-scale condition: the two-state receptor model of PTH1R has a characteristic timescale ranging from tens of seconds to tens or hundreds of minutes, while the bone cell population model operates on timescales of hours to tens of days. After model calibration, we validate the model for several glandular disease states and analyze the effect of pulse characteristics on the bone cell response.
2 Methods
The bone cell population model (BCPM) describes the temporal behavior of osteoblasts and osteoclasts in various states including their regulation by receptor-ligand interactions. In this section, we present the bone cell population model proposed by Lemaire et al. (2004), and further developed and refined by Pivonka and co-workers (Pivonka et al., 2008; Pivonka and Komarova, 2010; Scheiner et al., 2013; Trichilo et al., 2019). These models provide a robust foundation for our study as they have demonstrated good qualitative agreement with experimental observations from the literature. The Lemaire model successfully reproduces known behaviors of the bone remodeling system, including tight coupling between osteoblasts and osteoclasts, the catabolic effect of continuously elevated PTH and RANKL, the reverse, anabolic effect of increased OPG, and metabolic bone diseases such as estrogen deficiency and glucocorticoid excess. Subsequent developments by Pivonka and co-workers have incorporated bone volume fraction evolution and identified physiologically sensible parameter combinations, while Scheiner’s extension coupled bone cell dynamics with mechanical feedback, reproducing key features of mechanoregulation including postmenopausal osteoporosis progression and mechanical disuse responses. Trichilo et al. further validated the model framework by applying it to ovariectomized rats and comparing bone volume fraction predictions with experimental data. Given our aim to study the effect of the pulsatile glandular secretion pattern of PTH on the bone cell response, here we emphasize the mechanisms through which PTH is integrated and operates in the model by Lemaire et al. A detailed description of the underlying dynamics can be found in the original publication (Lemaire et al., 2004).
The BCPM framework models bone cell populations as averaged concentrations representing the aggregate behavior of bone multicellular units (BMUs) at various stages of the remodeling cycle. While individual BMUs and the respective cells undergo periodic activation, resorption, and formation phases (Kenkre and Bassett, 2018), the model captures the smeared effect of many simultaneously active remodeling sites (Lemaire et al., 2004). In steady state, this approach yields constant average cell concentrations that reflect homeostatic balance rather than the oscillatory dynamics of individual BMUs.
All parameters used in the model including respective description and reference can be found in Supplementary Table S2. Figure 1 shows a schematic illustration of the semi-coupled bone cell population model with the two-state receptor model including intracellular communication pathways and respective parameters.
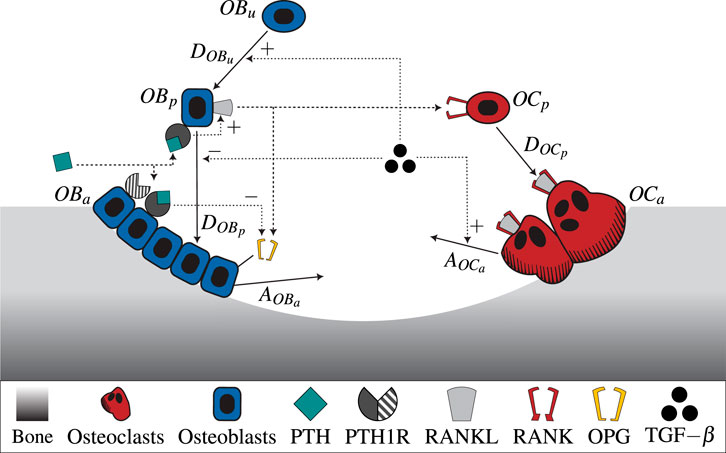
Figure 1. A schematic illustration of the novel bone cell population model including the two-state receptor model for PTH/PTH1R and intracellular communication pathways (TGF-
2.1 Mathematical model for bone cell dynamics
The bone cell population model by Lemaire et al. (2004) consists of a system of three ordinary differential equations. It describes the time-dependent behavior of osteoblastic precursor cells
The differentiation rates of uncommitted osteoblasts, osteoblast precursors and osteoclast precursors are denoted by
The effects induced by
with proportionality constant
The function
whereas the molar concentration of RANK-RANKL complexes and RANK are denoted by
Parathyroid hormone (PTH) influences the RANK-RANKL-OPG pathway catabolically. It binds to its receptor on osteoblasts, increasing RANKL and decreasing OPG concentration. Consequently, more osteoclast precursors are differentiated into active osteoclasts, thus increasing bone resorption. Thus, the ratio of occupied RANK - and consequently
The Michaelis-Menten function
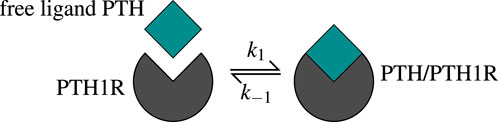
Figure 2. The one-state receptor model describes free ligand PTH binding to its receptor PTH1R on osteoblasts. This binding reaction forms a PTH/PTH1R complex, whereas also the reverse/unbinding reaction is possible. The values of the corresponding kinetic parameters
The receptor-ligand binding reaches equilibrium long before the bone cells react, which leads to the assumption of a steady state. The function
The molar PTH concentration,
depends on the basal synthesis rate
2.2 Two-state receptor model for pulsatile PTH secretion
PTH1R exhibits multiple conformational states that can be generally classified into active (sensitized) and inactive (desensitized) states, each characterized by distinct signaling responses upon ligand binding (Gardella, 2020; Bisello et al., 2002). The receptor can undergo conformational changes between these states independent of ligand binding, either through covalent modification or simple conformational rearrangement (Wang et al., 2009; Li et al., 2024). The response of osteoblasts to PTH-PTH1R binding depends on the respective conformation state of the receptor, with one state characterized by a shorter response and the other by a prolonged signaling response after receptor-ligand binding.
Martonová et al. (2023) presented a model that accounts for this phenomenon of PTH1R, based on a general formulation of a two-state receptor model by Li and Goldbeter (1989), further detailed in Lauffenburger and Linderman (1993). We describe the essential parts of the model below [a detailed description can be found in Martonová et al. (2023)].
Based on the ability of PTH1R to change conformation independent of ligand binding, the model assumes that both receptor conformational states can transform into each other regardless of their binding status (Martonová et al., 2023). The ligand PTH binds to both active (sensitized) and inactive (desensitized) receptors
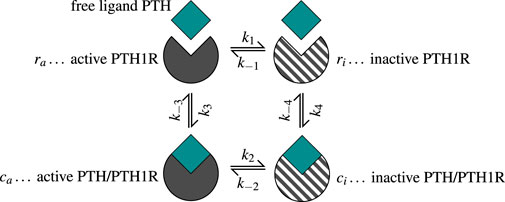
Figure 3. The two-state receptor model describes binding of free ligand PTH to its receptor PTH1R in two states: active/sensitized
The receptor and complex concentrations can be summarized in a concentration vector as
The coefficient matrix
The kinetic constants are given in Supplementary Table S1.
The ligand concentration L (Equation 8) depends on time
for
The dimensionality of system Equation 6 can be reduced to three by normalizing the receptor and complex concentrations relative to total receptor concentration. When expressing the concentrations of active receptors
The model considers time-dependent ligand concentrations, which we define as pulsatile free PTH based on the glandular secretion pattern. The corresponding cellular activity is given by a linear combination of receptors and complexes in both states as
The activity constants
We derive two activity constants based on
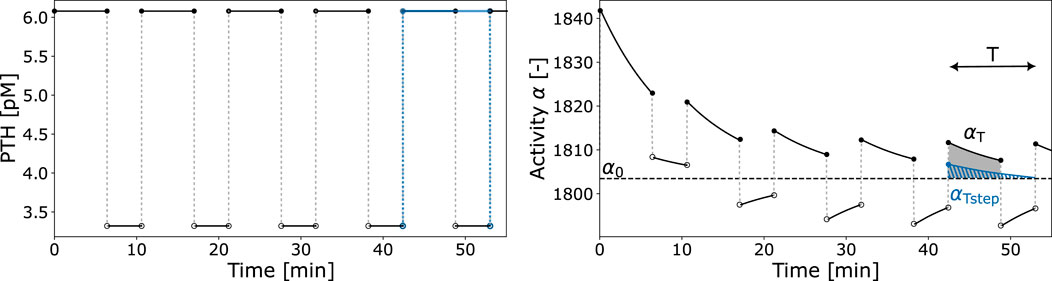
Figure 4. Exemplary PTH pulsatile pattern and resulting activity function
The cellular responsiveness
The first factor of Equation 10 relates the integrated activity
Given that the receptor-ligand binding reaches equilibrium in a very short time (faster than cellular response in the bone cell population model), we propose the use of the activity constant
2.3 Bone cell population model and two-state receptor: semi-coupling
We present a semi-coupled approach to integrate the two-state receptor model (Section 2.2) with the bone cell population model (Section 2.1). With this integration, the new bone cell population model includes information incorporated in the cellular activity: characteristics of pulsatile PTH; cellular adaptation to ongoing stimuli; effects of a two-state receptor. The approach involves replacing the Hill-type function
The first method involves determining scaling parameters
with
whereas Equation 12 refers to the original Hill-type function for healthy state. The corresponding parameter values are given in Supplementary Table S2. The constants

Table 1. Parameters for healthy and disease states for PTH concentration.
The second method is based on a comprehensive optimization approach across all states, determining parameters
Here, index
To establish comparable disease states between the pulsatile two-state receptor model (Section 2.2) and the constant-secretion reference model (Section 2.1), we introduce a scaling parameter for each disease given in Table 1,
This parameter, illustrated in Figure 5, modifies the PTH concentration equation (Equation 5) for disease modeling in the reference model,
whereas
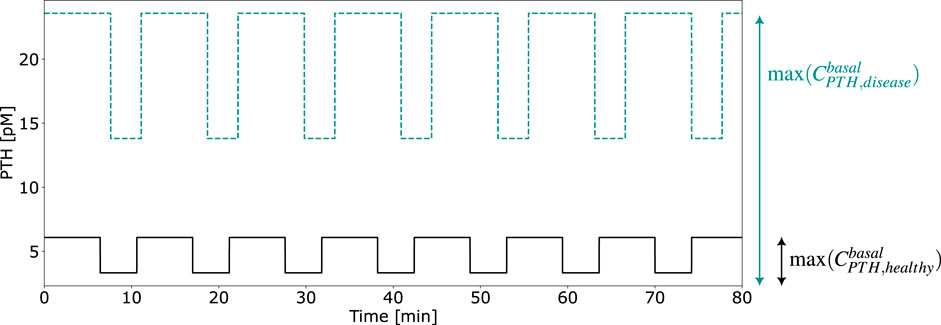
Figure 5. Exemplary computation of the calibration parameter
To further validate and compare the model approaches, we analyze the temporal evolution of bone volume fraction,
where
based on the steady-state concentration of osteoblasts
2.4 Analysis of pulse characteristics
With the new model formulation, we can analyze the effect of different pulse characteristics on bone cell dynamics. The objective is to compare the magnitude of the activity constants of disease states to the healthy state with varying duration of pulse on- and off-phase,
whereas the same results can be obtained if
3 Results
In this section, we describe the results of the calibration strategy given in Section 2.3, followed by the cellular activity and bone cell dynamics of the final, semi-coupled model. Finally, we demonstrate the effect of selected pulse characteristics on bone cell dynamics.
3.1 Calibration of Hill-type function and activity constants
We follow the approach given in Section 2.3 to include pulsatile PTH and PTH1R in two conformation states in the bone cell population model. We solve both Equation 11 and the minimization problem in Equation 13 to consider the different orders of magnitude of the Hill-type function
Both approaches to achieve comparable order of magnitude between
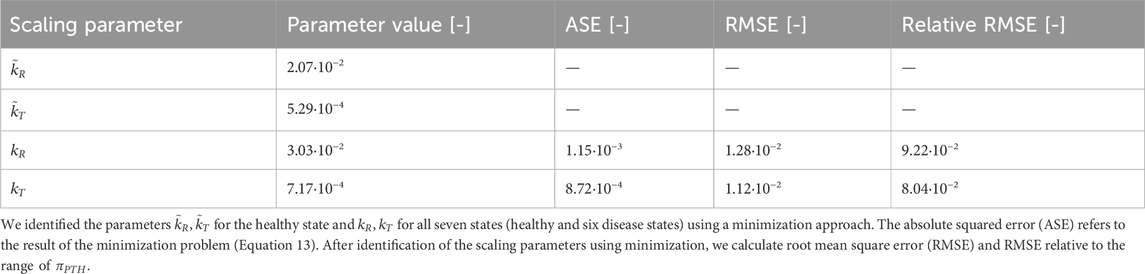
Table 2. Results of scaling of
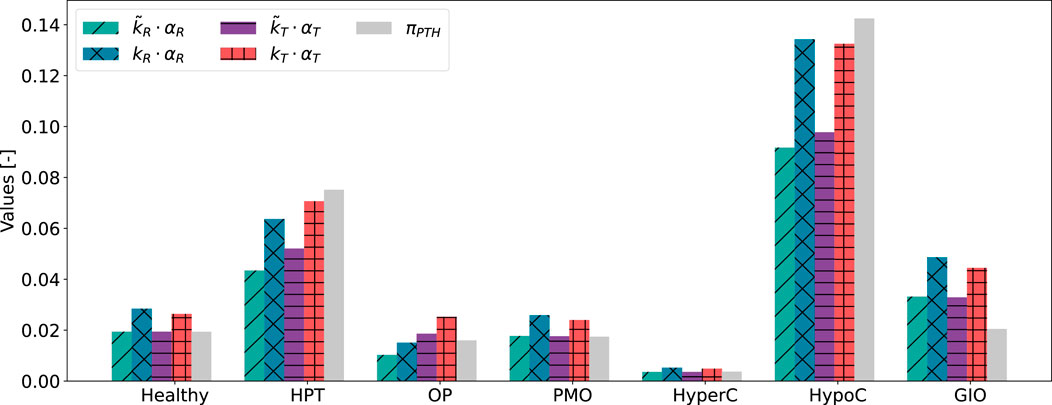
Figure 6. Results of scaling approaches for cellular responsiveness,
Despite relying on a single identified parameter across all states, both activity constants
3.2 Cellular activity and bone cell dynamics
The cellular activity function
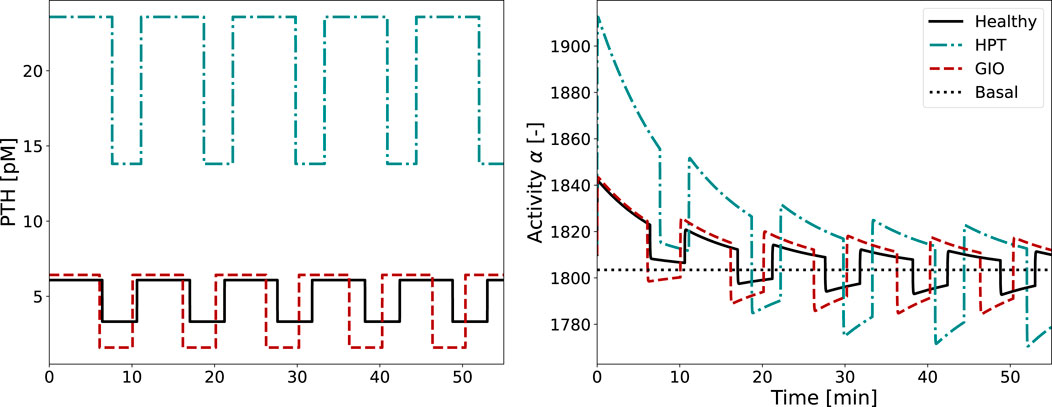
Figure 7. Glandular PTH secretion pattern and corresponding activity function
The activity function
In both healthy and diseased conditions, cellular adaptation to the stimulus occurs during the first two periods, with all subsequent pulses looking identical. As the integrated activity
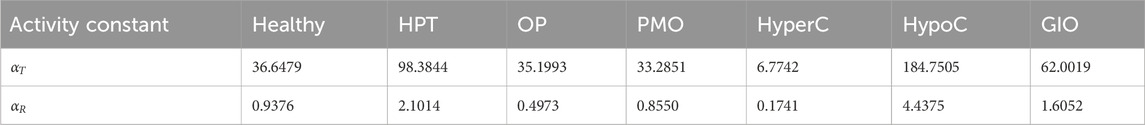
Table 3. Values of integrated activity,
After scaling to achieve same order of magnitude,
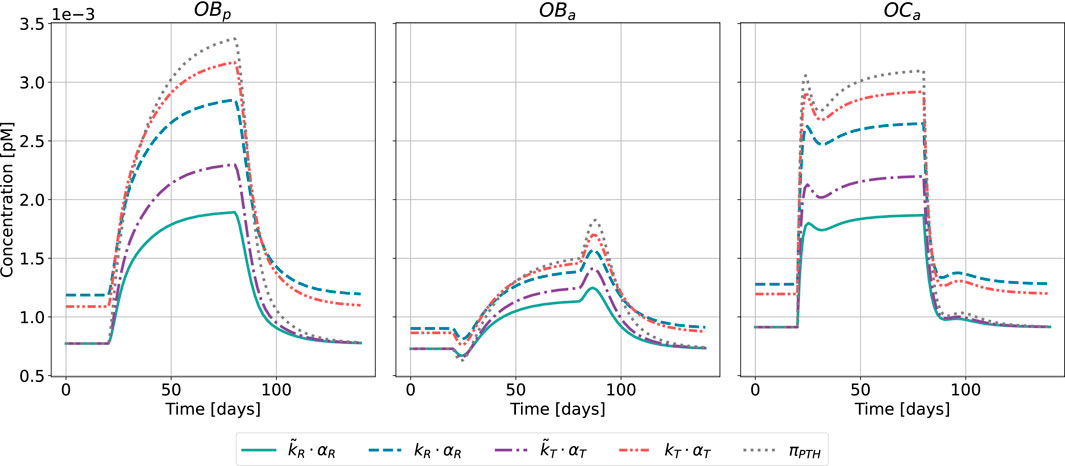
Figure 8. Bone cell dynamics resulting from the novel approach of the bone cell population model by semi-coupling with a two-state receptor model. The concentrations of osteoblast precursors,
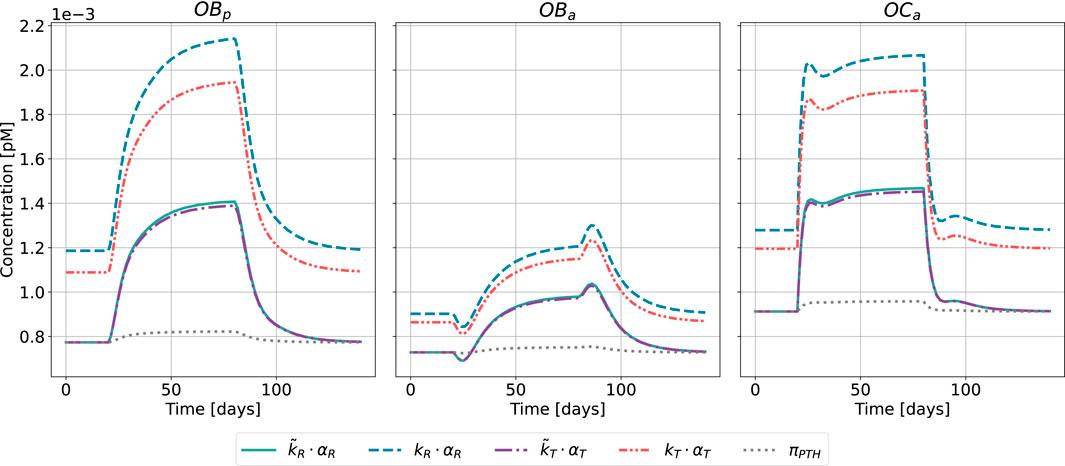
Figure 9. Bone cell dynamics resulting from the novel approach of the bone cell population model by semi-coupling with a two-state receptor model. The concentrations of osteoblast precursors,
The results of the semi-coupled bone cell population model for HPT as disease state are shown in Figure 8. The cellular concentrations for
Regarding the relative distance of
The results of the semi-coupled bone cell population model for GIO as disease state are shown in Figure 9.
The bone cell concentrations show different dynamics for the original model formulation and the novel semi-coupled approach. The original model formulation results in cell concentrations in a range of 1⋅10−4 and reduced dynamics. The onset of the disease state is barely visible in the time interval between 20 and 80 days. In contrast to the formerly used
This is reflected in the change of bone volume fraction during disease state (Figure 10). The initial bone volume fraction is chosen as 0.3 for trabecular bone (Ding et al., 1999); the temporal evolution is described by Equations 16, 17. For the sake of conciseness and due to the comparable outcomes of both approaches, we present only the results of the calibration method accounting for all disease states and the formerly used
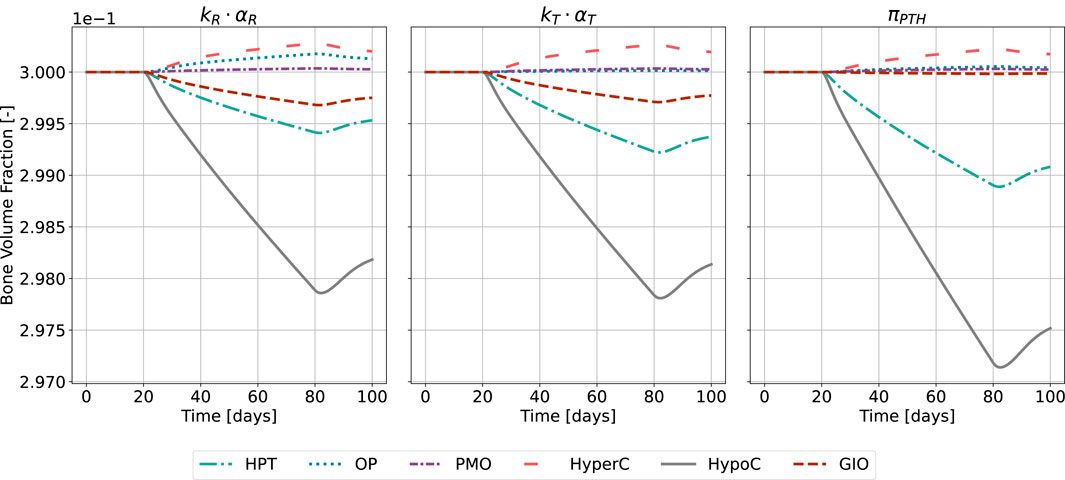
Figure 10. Bone volume fraction resulting from the novel approach of the bone cell population model by semi-coupling with a two-state receptor model. The scaling parameter is identified for all states
The catabolic effect of hyperparathyroidism (HPT) and hypocalcemia (HypoC) are reflected in all model approaches and highest for the original formulation (Figure 10). Osteoporosis (OP), hypercalcemia (HyperC) and postmenopausal osteoporosis (PMO) show minor positive or no deviations from homeostasis across all approaches.
3.3 Pulse characteristics and homeostasis
Following the methodology presented in Section 2.4, we vary on- and off-phase of the pulse whereas all other characteristics remain fixed to physiologically healthy values. On- and off-phase are restricted to sum to the period
Figure 11 shows the resulting values of integrated activity
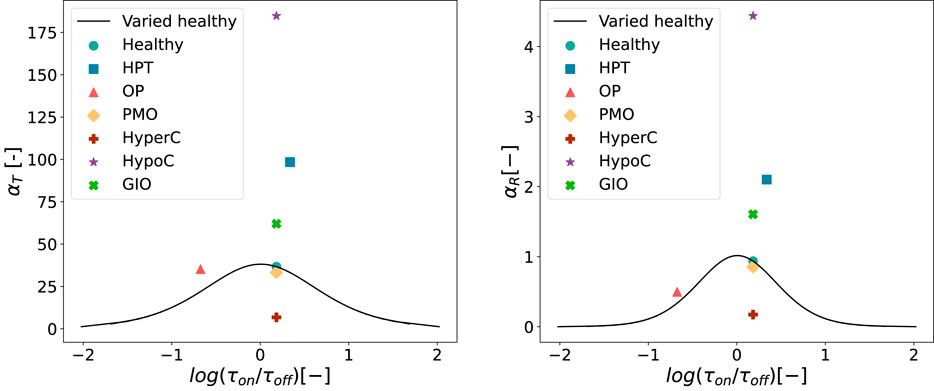
Figure 11. Values of
For both
Figure 12 shows the results of the bone cell population model for healthy state and HPT when replacing
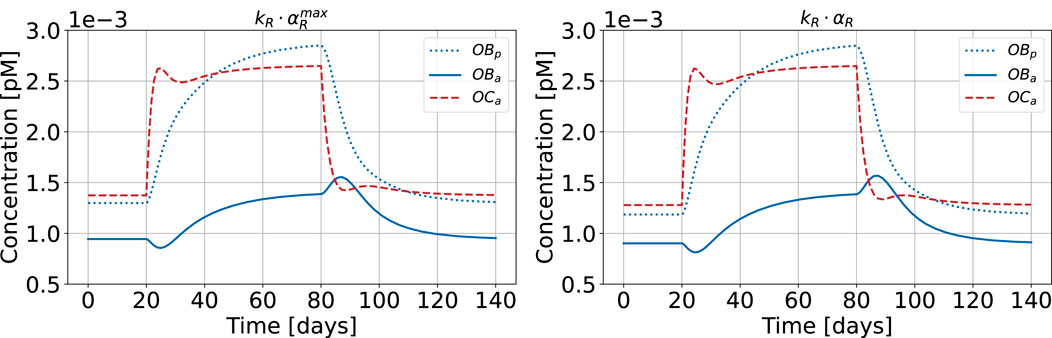
Figure 12. Bone cell population model with maximum cellular responsiveness
4 Discussion
This study presents a novel approach to simulating bone disease progression related to the human parathyroid gland. We analyzed alterations of parathyroid hormone release patterns within the framework of bone cell population models (BCPMs) – a central step toward more physiologically realistic modeling of disease progression and accurate pharmacokinetics-pharmacodynamic (PK-PD) models (Pivonka et al., 2024). While traditional BCPMs treat hormone concentrations as constants, we demonstrated that dynamic hormonal patterns contain valuable information about disease states that is lost when complex temporal dynamics are simplified to averaged reference constants. Indeed, it is not clear how changes in dynamic hormonal release patterns could be implemented in the mechanistic BCPM framework. To address this question, we proposed a semi-coupled approach of a two-state PTH-PTH1R receptor model with the original bone cell population model of Lemaire et al. (2004) incorporating the bone volume fraction balance equation (Pivonka et al., 2008). Despite increased complexity, the cell concentration dynamics remain qualitatively similar to the original model formulation, demonstrating the robustness across different model variants (Figures 8, 9). Extension to more complex BCPMs (Pivonka et al., 2008; Pivonka and Komarova, 2010; Scheiner et al., 2013; Trichilo et al., 2019) is straightforward.
The model successfully reproduces key bone cell responses including increased osteoclast activity during disease states and time-delayed osteoblast response to catabolic osteoclast action. We showed that catabolic responses, traditionally obtained by increasing the PTH activator function
Our analysis of single pulse characteristics (Section 2.4) shows that maximum cell response occurs at equal duration of on- and off-phase. This demonstrates the inherent trade-offs between pulse height and width: very long PTH pulses result in extended but low activity due to receptor desensitization, while short pulses produce intense but brief responses. The highest catabolic response–quantified by maximal integrated activity
We compared our novel approaches with the original BCPM formulation to evaluate the importance of including pulsatile PTH dynamics. We implemented disease states in the original model using a “scaling parameter” that reflects how diseases would be modeled as constant PTH elevations rather than capturing the full pulsatile patterns. The parameter is the ratio of maximum PTH concentration in disease and healthy state (Equation 14), and we multiplied it with the baseline PTH concentration of the BCPM (Equation 15). This approach does not require a complex two-state receptor model and could be used directly linked with existing BCPMs. While the novel approaches yield comparable results overall, the original model’s inability to incorporate pulsatile characteristics becomes evident in the case of glucocorticoid-induced osteoporosis, where the pulsatile pattern is characterized by increased relative amplitude without significant changes in maximum concentration (Figure 7). The original model, which neglects these pulsatile dynamics, fails to capture the catabolic cell responses and subsequent bone loss (Figures 9, 10). This addresses fundamental challenges in mathematical modeling of endocrine systems, where dynamic hormone secretion patterns are often oversimplified as constant values. The importance of capturing hormonal pulsatility is particularly evident in PTH signaling, where pulsatile versus continuous administration produces opposing effects on bone metabolism (Veldhuis, 2008). Our semi-coupled model incorporates both pulsatile characteristics and cellular desensitization through the two-state receptor model, addressing key research gaps identified in endocrine system modeling (Brucker-Davis et al., 2001; Zavala et al., 2019; Zavala, 2022).
The new model qualitatively predicts expected catabolic responses for the majority of PTH-driven bone diseases (hyperparathyroidism, hypocalcemia, glucocorticoid-induced osteoporosis), specifically, both the increased osteoclast activity and the resulting bone volume loss that characterize these conditions. It does not predict the bone loss encountered in osteoporosis and postmenopausal osteoporosis, where the model maintains homeostasis. The reason for this might be that these diseases are not exclusively linked to alterations in PTH release patterns, but also involve more significant pathophysiological changes such as estrogen depletion in PMO which directly regulates RANKL production by osteoblasts and osteocytes and/or TGF-
Validating model predictions against clinical data presents inherent challenges, as bone loss measurements typically compare disease states to controls rather than tracking progression from onset. For bone volume predictions (Figure 10), our model shows conservative estimates across conditions: For glucocorticoid-induced osteoporosis, we predict 0.7% trabecular bone loss in the first 60 days compared to clinical observations of approximately 5% loss (Boling, 2004). In primary hyperparathyroidism, our predicted loss of 0.8% after 60 days could reasonably accumulate to the observed 4%–5% difference between PHPT and control subjects (Christiansen et al., 1992), considering more rapid initial bone loss. The model’s highest catabolic response occurs in hypocalcemia, consistent with experimental data showing substantial bone loss (19% in rat models after 6 months (Jakubas-Przewłocka and Przewłocki, 2005), though our predicted magnitude is lower. These discrepancies likely reflect fundamental differences in disease simulation approaches (pulsatile human PTH patterns versus induced disease states), experimental duration, species transferability, and the instantaneous disease onset in our model versus progressive development in biological systems. While these comparisons suggest the need for parameter optimization based on expected bone loss, the heterogeneity and limited availability of consistent clinical data currently constrains such validation efforts, a challenge that has motivated various cross-methodological data-driven calibration approaches in bone modeling (Araujo et al., 2014; Baratchart et al., 2022).
Similar challenges apply to validating bone cell concentration predictions (Figures 8, 9), as osteoblasts and osteoclasts are rarely tracked over time in clinical settings. Comparison with murine studies helps establish reasonable numerical expectations despite inherent species differences. For hyperparathyroidism induced in mice, Siddiqui et al. (2017) demonstrated a 2.3-fold increase in osteoclast number per bone surface, while our model predictions range from 2.25 to 3.9-fold increases in OCa concentration across different approaches, showing good agreement with experimental data. This alignment is further supported by the 3.3-fold increase in TRAP5b–an enzyme produced by osteoclasts–observed in the same study. Our predicted decrease in bone volume fraction (0.2%–0.37%) is conservative compared to the experimental 9% reduction in the cortex, despite reasonable osteoclast predictions and only moderate underestimation of osteoblast activity (1.7–2.4-fold vs 3.67-fold experimental increase). Notably, no significant trabecular BV/TV loss was observed experimentally, which is consistent with our conservative bone volume estimates. For glucocorticoid-induced osteoporosis, Hofbauer et al. (2009) reported a 1.55-fold increase in osteoclast number per bone surface, closely matching our novel model formulations (1.62–1.67-fold increase of OCa-concentration), while the original approach showed insufficient response (1.06-fold increase). For osteoblast dynamics, our model simulates an initial decrease in active osteoblast concentration, which aligns qualitatively with the reduced serum osteocalcin levels reported for GIO-induced mice (Hofbauer et al., 2009). The initial decrease after disease onset is followed by a compensatory increase in response to elevated osteoclast activity. While this cellular response pattern is phenomenologically correct, we acknowledge that GIO involves complex mechanisms beyond PTH pulsatility alterations that our model does not capture, as our primary objective was demonstrating the importance of pulsatile hormone dynamics rather than comprehensive GIO modeling. Despite this cellular-level agreement, our model again predicted minimal bone volume changes over 80 days compared to substantial experimental bone area loss over 4 weeks (Hofbauer et al., 2009). Hofbauer et al. reported that trabecular BMD remained unchanged in GIO-induced mice, with most pronounced decreases in cortical and subcortical compartments. Likely due to limited sample sizes, BMD effects did not reach statistical significance. The agreement of our cellular predictions (osteoclasts and osteoblasts) with experimental data, coupled with underestimation of corresponding bone loss, suggests that recalibrating bone formation and resorption rate constants with appropriate human data could improve structural predictions. While these rates are currently assumed constant following established BCPM practice (Lemaire et al., 2004; Pivonka et al., 2008; Scheiner et al., 2013), experimental studies have demonstrated variability in individual osteoclast resorptive activity (Kanehisa and Heersche, 1988), and mathematical modeling of injury repair has provided in vivo evidence for time-variable cellular activity rates (Lo et al., 2021). Careful consideration is needed since our model tracks average cellular concentrations and thus inherently represents averaged resorption and formation rates over cell populations. Nevertheless, the order-of-magnitude agreement in cellular responses across both conditions provide confidence in the model’s mechanistic foundation.
We acknowledge several key limitations of our current approach. First, PTH levels are prescribed externally rather than evolving from endogenous physiological feedback mechanisms in both the original and our novel BCPM. PTH is either maintained at constant levels (original model) or follows prescribed pulsatile patterns (novel approach), without incorporating the calcium-PTH feedback loop that naturally regulates PTH secretion in vivo (Chiavistelli et al., 2015). This approach is appropriate for our primary objective of studying how specific hormone patterns affect bone cell dynamics and remodeling activity under controlled conditions. However, an autonomous model–incorporating calcium homeostasis and PTH regulation through calcium-sensing receptors–would facilitate analysis of the underlying causes of dysregulated hormone patterns themselves. An autonomous model would eliminate the current assumption of instantaneous disease state onset and allow gradual disease progression through feedback dysregulation.
Second, we model disease states as immediate transitions from a healthy PTH pattern (Figures 8, 9). This type of approach was original suggested by Lemaire et al. (2004) and subsequently improved by Pivonka et al. (2008) to account for temporal changing disease patterns. Our current approach could be extended towards gradual changing PTH patterns over given time intervals. Additionally, changes in bone volume fraction are constant after steady-states of cell concentration are reached. This implies constant bone loss independent of disease duration, which is not physiological. Mechanostat model incorporation could address this limitation (Scheiner et al., 2013; Martínez-Reina and Pivonka, 2019).
Third, our square-wave pulses for the PTH secretion pattern based on the original formulations (Li and Goldbeter, 1989; Martonová et al., 2023) represent an idealized version of hormone release patterns. A more physiologically realistic approach would model PTH degradation as an exponential decrease after the onset of each pulse, rather than an immediate switch to zero concentration, while maintaining total secreted PTH.
Finally, while we focused on PTH1R signaling in osteoblasts, recent studies have found that PTH1R is also expressed on osteocytes, where PTH directly induces upregulation of RANKL gene production. The resulting increased RANKL/OPG ratio leads to higher osteoclast recruitment and activation. This is consistent with the conservative bone loss predicted by the model. Additionally, PTH binding to PTH1R expressed on osteocytes downregulates sclerostin production, a formation inhibitor, which thus enhances bone formation (Ben-awadh et al., 2014; Marino and Bellido, 2024). These osteocyte-mediated effects represent additional pathways through which PTH influences bone remodeling beyond the osteoblast responses captured in our current model.
These limitations suggest several research directions. The framework could be extended to more sophisticated bone cell population models distinguishing between modeling and remodeling processes (Trichilo et al., 2019). The activity function
Beyond PTH dynamics, our approach offers a template for other biological contexts where both temporal patterns and receptor adaptation require consideration. The methodology applies to mechanical loading patterns during habitual movement or exercise, where cells respond to pulsatile mechanical stimuli and adapt to sustained loads. This framework could also be adapted to other signaling pathways such as RANKL-RANK-OPG binding. This demonstrates the broader applicability in modeling various biological regulatory systems beyond simple Hill functions and constant stimuli. The interaction of bone remodeling, calcium homeostasis, and PTH secretion represents an interesting approach for future model development that could bridge the gap between prescribed hormone patterns and the physiological mechanisms that generate them.
5 Nomenclature
5.1 Resource identification initiative
All simulations were performed using Python Programming Language (RRID:SCR_008394).
Data availability statement
The datasets presented in this study can be found in online repositories (Modiz, 2025). The names of the repository/repositories and accession number(s) can be found below: https://github.com/cmodiz/Bone-Models.git.
Author contributions
CM: Software, Conceptualization, Writing – review and editing, Writing – original draft, Formal Analysis, Visualization, Methodology. NMC: Conceptualization, Project administration, Supervision, Methodology, Writing – review and editing. SS: Conceptualization, Supervision, Writing – review and editing. JM-R: Supervision, Conceptualization, Writing – review and editing. JLC-G: Conceptualization, Supervision, Writing – review and editing. VS: Supervision, Project administration, Conceptualization, Writing – review and editing. SM: Writing – review and editing, Conceptualization, Supervision. PP: Conceptualization, Project administration, Methodology, Writing – review and editing, Writing – original draft, Supervision.
Funding
The author(s) declare that financial support was received for the research and/or publication of this article. We gratefully acknowledge funding received through the Australian Research Council (IC190100020; DP230101404; ARC-FT180100338).
Acknowledgments
We thank the main author of the source publication, Denisa Martonova, for sharing the original resources.
Conflict of interest
The authors declare that the research was conducted in the absence of any commercial or financial relationships that could be construed as a potential conflict of interest.
The author(s) declared that they were an editorial board member of Frontiers, at the time of submission. This had no impact on the peer review process and the final decision.
Generative AI statement
The author(s) declare that no Generative AI was used in the creation of this manuscript.
Any alternative text (alt text) provided alongside figures in this article has been generated by Frontiers with the support of artificial intelligence and reasonable efforts have been made to ensure accuracy, including review by the authors wherever possible. If you identify any issues, please contact us.
Publisher’s note
All claims expressed in this article are solely those of the authors and do not necessarily represent those of their affiliated organizations, or those of the publisher, the editors and the reviewers. Any product that may be evaluated in this article, or claim that may be made by its manufacturer, is not guaranteed or endorsed by the publisher.
Supplementary material
The Supplementary Material for this article can be found online at: https://www.frontiersin.org/articles/10.3389/fbioe.2025.1619276/full#supplementary-material
References
Aibar-Almazán, A., Voltes-Martínez, A., Castellote-Caballero, Y., Afanador-Restrepo, D. F., Carcelén-Fraile, M. d. C., and López-Ruiz, E. (2022). Current status of the diagnosis and management of osteoporosis. Int. J. Mol. Sci. 23, 9465. doi:10.3390/ijms23169465
Araujo, A., Cook, L. M., Lynch, C. C., and Basanta, D. (2014). An integrated computational model of the bone microenvironment in bone-metastatic prostate cancer. Cancer Res. 74, 2391–2401. doi:10.1158/0008-5472.can-13-2652
Baratchart, E., Lo, C. H., Lynch, C. C., and Basanta, D. (2022). Integrated computational and in vivo models reveal key insights into macrophage behavior during bone healing. PLOS Comput. Biol. 18, e1009839. doi:10.1371/journal.pcbi.1009839
Ben-awadh, A. N., Delgado-Calle, J., Tu, X., Kuhlenschmidt, K., Allen, M. R., Plotkin, L. I., et al. (2014). Parathyroid hormone receptor signaling induces bone resorption in the adult skeleton by directly regulating the rankl gene in osteocytes. Endocrinology 155, 2797–2809. doi:10.1210/en.2014-1046
Bilezikian, J. P., Bandeira, L., Khan, A., and Cusano, N. E. (2018). Hyperparathyroidism. Lancet 391, 168–178. doi:10.1016/S0140-6736(17)31430-7
Bisello, A., Chorev, M., Rosenblatt, M., Monticelli, L., Mierke, D. F., and Ferrari, S. L. (2002). Selective ligand-induced stabilization of active and desensitized parathyroid hormone type 1 receptor conformations. J. Biol. Chem. 277, 38524–38530. doi:10.1074/jbc.M202544200
Boling, E. P. (2004). Secondary osteoporosis: underlying disease and the risk for glucocorticoid-induced osteoporosis. Clin. Ther. 26, 1–14. doi:10.1016/s0149-2918(04)90001-x
Bonadonna, S., Burattin, A., Nuzzo, M., Bugari, G., Rosei, E. A., Valle, D., et al. (2005). Chronic glucocorticoid treatment alters spontaneous pulsatile parathyroid hormone secretory dynamics in human subjects. Eur. J. Endocrinol. 152, 199–205. doi:10.1530/eje.1.01841
Brucker-Davis, F., Thayer, K., and Colborn, T. (2001). Significant effects of mild endogenous hormonal changes in humans: considerations for low-dose testing. Environ. Health Perspect. 109, 21–26. doi:10.1289/ehp.01109s121
Capriani, C., Irani, D., and Bilezikian, J. P. (2012). Safety of osteoanabolic therapy: a decade of experience. J. Bone Min. Res. 27, 2419–2428. doi:10.1002/jbmr.1800
Cheloha, R. W., Gellman, S. H., Vilardaga, J.-P., and Gardella, T. J. (2015). PTH receptor-1 signalling—mechanistic insights and therapeutic prospects. Nat. Rev. Endocrinol. 11, 712–724. doi:10.1038/nrendo.2015.139
Chiavistelli, S., Giustina, A., and Mazziotti, G. (2015). Parathyroid hormone pulsatility: physiological and clinical aspects. Bone Res. 3, 14049. doi:10.1038/boneres.2014.49
Christiansen, P., Steiniche, T., Vesterby, A., Mosekilde, L., Hessov, I., and Melsen, F. (1992). Primary hyperparathyroidism: iliac crest trabecular bone volume, structure, remodeling, and balance evaluated by histomorphometric methods. Bone 13, 41–49. doi:10.1016/8756-3282(92)90360-9
Cook, C. V., Lighty, A. M., Smith, B. J., and Ford Versypt, A. N. (2024). A review of mathematical modeling of bone remodeling from a systems biology perspective. Front. Syst. Biol. 4, 1368555. doi:10.3389/fsysb.2024.1368555
Datta, N. S., and Abou-Samra, A. B. (2009). Pth and pthrp signaling in osteoblasts. Cell. Signal. 21, 1245–1254. doi:10.1016/j.cellsig.2009.02.012
Ding, M., Odgaard, A., and Hvid, I. (1999). Accuracy of cancellous bone volume fraction measured by micro-ct scanning. J. Biomech. 32, 323–326. doi:10.1016/S0021-9290(98)00176-6
Gardella, T. J. (2020). The parathyroid hormone receptor type 1 (Humana, Cham), chap. 16. Contemporary endocrinology. 3rd edn. Cham, Switzerland: Springer Nature Switzerland AG, 323–347. doi:10.1007/978-3-319-69287-6_16
Harms, H. M., Neubauer, O., Kayser, C., Wüstermann, P. R., Horn, R., Brosa, U., et al. (1994a). Pulse amplitude and frequency modulation of parathyroid hormone in early postmenopausal women before and on hormone replacement therapy. J. Clin. Endocrinol. Metab. 78, 48–52. doi:10.1210/jcem.78.1.8288712
Harms, H. M., Schlinke, E., Neubauer, O., Kayser, C., Wüstermann, P. R., Horn, R., et al. (1994b). Pulse amplitude and frequency modulation of parathyroid hormone in primary hyperparathyroidism. J. Clin. Endocrinol. Metab. 78, 53–57. doi:10.1210/jcem.78.1.8288713
Hawkins, F., Garla, V., Allo, G., Males, D., Mola, L., and Corpas, E. (2021). “Chapter 5 - senile and postmenopausal osteoporosis: pathophysiology, diagnosis, and treatment,” in Endocrinology of aging. Editor E. Corpas (Amsterdam, Netherlands: Elsevier), 131–169. doi:10.1016/B978-0-12-819667-0.00005-6
Hernández-Castellano, L., Hernandez, L., and Bruckmaier, R. (2020). Review: endocrine pathways to regulate calcium homeostasis around parturition and the prevention of hypocalcemia in periparturient dairy cows. Anim 14, 330–338. doi:10.1017/s1751731119001605
Hofbauer, L. C., Zeitz, U., Schoppet, M., Skalicky, M., Schüler, C., Stolina, M., et al. (2009). Prevention of glucocorticoid-induced bone loss in mice by inhibition of rankl. Arthritis Rheum. 60, 1427–1437. doi:10.1002/art.24445
Jakubas-Przewłocka, J., and Przewłocki, P. (2005). Assessment of changes due to the long-term effect of estrogen and calcium deficiency in the trabecular bone structure in rats. Clin. Exp.l Rheumatol. 23, 385–388.
Kanehisa, J., and Heersche, J. (1988). Osteoclastic bone resorption: in vitro analysis of the rate of resorption and migration of individual osteoclasts. Bone 9, 73–79. doi:10.1016/8756-3282(88)90106-8
Kenkre, J., and Bassett, J. (2018). The bone remodelling cycle. Ann. Clin. Biochem. 55, 308–327. doi:10.1177/0004563218759371
Komarova, S. V., Smith, R. J., Dixon, S., Sims, S. M., and Wahl, L. M. (2003). Mathematical model predicts a critical role for osteoclast autocrine regulation in the control of bone remodeling. Bone 33, 206–215. doi:10.1016/S8756-3282(03)00157-1
Lauffenburger, D. A., and Linderman, J. J. (1993). Receptors: models for binding, trafficking, and signaling. New York, NY: Oxford University PressNew. doi:10.1093/oso/9780195064667.001.0001
Lavaill, M., Trichilo, S., Scheiner, S., Forwood, M. R., Cooper, D. M. L., and Pivonka, P. (2020). Study of the combined effects of pth treatment and mechanical loading in postmenopausal osteoporosis using a new mechanistic pk-pd model. Biomech. Model. Mechan. 19, 1765–1780. doi:10.1007/s10237-020-01307-6
Lemaire, V., Tobin, F. L., Greller, L. D., Cho, C. R., and Suva, L. J. (2004). Modeling the interactions between osteoblast and osteoclast activities in bone remodeling. J. Theor. Biol. 229, 293–309. doi:10.1016/j.jtbi.2004.03.023
Li, Y., and Goldbeter, A. (1989). Frequency specificity in intercellular communication. influence of patterns of periodic signaling on target cell responsiveness. Biophys. J. 55, 125–145. doi:10.1016/S0006-3495(89)82785-7
Li, M., Zhang, X., Li, S., and Guo, J. (2024). Unraveling the interplay of extracellular domain conformational changes and parathyroid hormone type 1 receptor activation in class b1 g protein-coupled receptors: integrating enhanced sampling molecular dynamics simulations and markov state models. ACS Chem. Neurosci. 15, 844–853. doi:10.1021/acschemneuro.3c00747
Lo, C. H., Baratchart, E., Basanta, D., and Lynch, C. C. (2021). Computational modeling reveals a key role for polarized myeloid cells in controlling osteoclast activity during bone injury repair. Sci. Rep. 11, 6055. doi:10.1038/s41598-021-84888-1
Locklin, R. M., Khosla, S., Turner, R. T., and Riggs, B. L. (2003). Mediators of the biphasic responses of bone to intermittent and continuously administered parathyroid hormone. J. Cell. Biochem. 89, 180–190. doi:10.1002/jcb.10490
Lu, L., and Tian, L. (2023). Postmenopausal osteoporosis coexisting with sarcopenia: the role and mechanisms of estrogen. J. Endocrinol. 259, e230116. doi:10.1530/JOE-23-0116
Marino, S., and Bellido, T. (2024). Pth receptor signalling, osteocytes and bone disease induced by diabetes mellitus. Nat. Rev. Endocrinol. 20, 661–672. doi:10.1038/s41574-024-01014-7
Martínez-Reina, J., and Pivonka, P. (2019). Effects of long-term treatment of denosumab on bone mineral density: insights from an in-silico model of bone mineralization. Bone 125, 87–95. doi:10.1016/j.bone.2019.04.022
Martonová, D., Lavaill, M., Forwood, M. R., Robling, A., Cooper, D. M. L., Leyendecker, S., et al. (2023). Effects of pth glandular and external dosing patterns on bone cell activity using a two-state receptor model—implications for bone disease progression and treatment. PLOS One 18, e0283544. doi:10.1371/journal.pone.0283544
[Dataset] Modiz, C. (2025). Bone models. Brisbane, Australia: Queensland University of Technology. doi:10.25912/RDF_1742263438470
Okazaki, M., Ferrandon, S., Vilardaga, J.-P., Bouxsein, M. L., Potts, J. T., and Gardella, T. J. (2008). Prolonged signaling at the parathyroid hormone receptor by peptide ligands targeted to a specific receptor conformation. Proc. Natl. Acad. Sci. U. S. A. 105, 16525–16530. doi:10.1073/pnas.0808750105
Peterson, M. C., and Riggs, M. M. (2010). A physiologically based mathematical model of integrated calcium homeostasis and bone remodeling. Bone 46, 49–63. doi:10.1016/j.bone.2009.08.053
Pivonka, P., and Komarova, S. V. (2010). Mathematical modeling in bone biology: from intracellular signaling to tissue mechanics. Bone 47, 181–189. doi:10.1016/j.bone.2010.04.601
Pivonka, P., Zimak, J., Smith, D. W., Gardiner, B. S., Dunstan, C. R., Sims, N. A., et al. (2008). Model structure and control of bone remodeling: a theoretical study. Bone 43, 249–263. doi:10.1016/j.bone.2008.03.025
Pivonka, P., Calvo-Gallego, J. L., Schmidt, S., and Martínez-Reina, J. (2024). Advances in mechanobiological pharmacokinetic-pharmacodynamic models of osteoporosis treatment – pathways to optimise and exploit existing therapies. Bone 186, 117140. doi:10.1016/j.bone.2024.117140
Potter, L. K., Greller, L. D., Cho, C. R., Nuttall, M. E., Stroup, G. B., Suva, L. J., et al. (2005). Response to continuous and pulsatile pth dosing: a mathematical model for parathyroid hormone receptor kinetics. Bone 37, 159–169. doi:10.1016/j.bone.2005.04.011
Roberts, W. E., Mozsary, P. G., and Klingler, E. (1982). Nuclear size as a cell-kinetic marker for osteoblast differentiation. Am. J. Anat. 165, 373–384. doi:10.1002/aja.1001650403
Ruiz-Lozano, R., Calvo-Gallego, J. L., Pivonka, P., McDonald, M. M., and Martínez-Reina, J. (2024). An in silico approach to elucidate the pathways leading to primary osteoporosis: age-related vs. postmenopausal. Biomech. Model. Mechan. 23, 1393–1409. doi:10.1007/s10237-024-01846-2
Ryser, M. D., Nigam, N., and Komarova, S. V. (2009). Mathematical modeling of spatio-temporal dynamics of a single bone multicellular unit. J. Bone Mineral Res. 24, 860–870. doi:10.1359/jbmr.081229
Ryser, M. D., Komarova, S. V., and Nigam, N. (2010). The cellular dynamics of bone remodeling: a mathematical model. SIAM J. Appl. Math. 70, 1899–1921. doi:10.1137/090746094
Salari, N., Ghasemi, H., Mohammadi, L., Behzadi, M. h., Rabieenia, E., Shohaimi, S., et al. (2021). The global prevalence of osteoporosis in the world: a comprehensive systematic review and meta-analysis. J. Orthop. Surg. Res. 16, 609. doi:10.1186/s13018-021-02772-0
Schaefer, F. (2000). Pulsatile parathyroid hormone secretion in health and disease. Chichester, England: John Wiley and Sons, Ltd., 225–243. doi:10.1002/0470870796.ch13
Schappacher-Tilp, G., Cherif, A., Fuertinger, D. H., Bushinsky, D., and Kotanko, P. (2019). A mathematical model of parathyroid gland biology. Physiol. Rep. 7, e14045. doi:10.14814/phy2.14045
Scheiner, S., Pivonka, P., and Hellmich, C. (2013). Coupling systems biology with multiscale mechanics, for computer simulations of bone remodeling. Comput. Methods Appl. Mech. Eng. 254, 181–196. doi:10.1016/j.cma.2012.10.015
Schmitt, C. P., Hömme, M., and Schaefer, F. (2005). Structural organization and biological relevance of oscillatory parathyroid hormone secretion. Pediatr. Nephrol. 20, 346–351. doi:10.1007/s00467-004-1767-7
Segel, L. A., Goldbeter, A., Devreotes, P. N., and Knox, B. E. (1986). A mechanism for exact sensory adaptation based on receptor modification. J. Theor. Biol. 120, 151–179. doi:10.1016/S0022-5193(86)80171-0
Siddiqui, J. A., Johnson, J., Le Henaff, C., Bitel, C. L., Tamasi, J. A., and Partridge, N. C. (2017). Catabolic effects of human pth (1–34) on bone: requirement of monocyte chemoattractant protein-1 in murine model of hyperparathyroidism. Sci. Rep. 7, 15300. doi:10.1038/s41598-017-15563-7
Sun, M., Wu, X., Yu, Y., Wang, L., Xie, D., Zhang, Z., et al. (2020). Disorders of calcium and phosphorus metabolism and the proteomics/metabolomics-based research. Front. Cell Dev. Biol. 8, 576110. doi:10.3389/fcell.2020.576110
Trichilo, S., Scheiner, S., Forwood, M., Cooper, D. M., and Pivonka, P. (2019). Computational model of the dual action of pth — application to a rat model of osteoporosis. J. Theor. Biol. 473, 67–79. doi:10.1016/j.jtbi.2019.04.020
Veldhuis, J. D. (2008). Pulsatile hormone secretion: mechanisms, significance and evaluation. Dordrecht: Springer Netherlands, 229–248. doi:10.1007/978-1-4020-8352-5_10
Wang, B., Yang, Y., Abou-Samra, A. B., and Friedman, P. A. (2009). Nherf1 regulates parathyroid hormone receptor desensitization: interference with β-arrestin binding. Mol. Pharmacol. 75, 1189–1197. doi:10.1124/mol.108.054486
Zavala, E. (2022). Misaligned hormonal rhythmicity: mechanisms of origin and their clinical significance. J. Neuroendocrinol. 34, e13144. doi:10.1111/jne.13144
Zavala, E., Wedgwood, K. C., Voliotis, M., Tabak, J., Spiga, F., Lightman, S. L., et al. (2019). Mathematical modelling of endocrine systems. Trends Endocrinol. Metab. 30, 244–257. doi:10.1016/j.tem.2019.01.008
Keywords: parathyroid hormone, parathyroid hormone/parathyroid hormone-related protein receptor, bone cell dynamics, disease modeling, pulsatile signal characteristics
Citation: Modiz C, Castoldi NM, Scheiner S, Martínez-Reina J, Calvo-Gallego JL, Sansalone V, Martelli S and Pivonka P (2025) Computational simulations of endocrine bone diseases related to pathological glandular PTH secretion using a multi-scale bone cell population model. Front. Bioeng. Biotechnol. 13:1619276. doi: 10.3389/fbioe.2025.1619276
Received: 28 April 2025; Accepted: 01 September 2025;
Published: 01 October 2025.
Edited by:
Eiji Tanaka, Tokushima University, JapanReviewed by:
Laurent Pujo-Menjouet, Université Claude Bernard Lyon 1, FranceEtienne Baratchart, Lund University, Sweden
Copyright © 2025 Modiz, Castoldi, Scheiner, Martínez-Reina, Calvo-Gallego, Sansalone, Martelli and Pivonka. This is an open-access article distributed under the terms of the Creative Commons Attribution License (CC BY). The use, distribution or reproduction in other forums is permitted, provided the original author(s) and the copyright owner(s) are credited and that the original publication in this journal is cited, in accordance with accepted academic practice. No use, distribution or reproduction is permitted which does not comply with these terms.
*Correspondence: Corinna Modiz, Y29yaW5uYS5tb2RpekBoZHIucXV0LmVkdS5hdQ==