 Marilena Mazzoli
 Emanuele Gasparotti
 Emanuele Vignali
 Dorela Haxhiademi
 Simona Celi
- 1BioCardioLab, Bioengineering Unit, Fondazione Monasterio, Massa, Italy
- 2Department of Information Engineering, University of Pisa, Pisa, Italy
- 3Anesthesia and Intensive Care Unit, Fondazione Monasterio, Massa, Italy
Introduction: The veno-arterial extracorporeal membrane oxygenation (VA ECMO) system is a temporary support procedure to provide oxygenated blood in patients with cardiac or respiratory failure. Despite being widely used in clinical reality, the VA ECMO has some well-known flaws, like the formation of a 'watershed zone' as a consequence of the mixing of native blood from the left ventricle and retrograde oxygenated blood from the ECMO pump. A deeper knowledge of the watershed zone behavior could contribute to better defining the oxygenation balancing for the patient.
Methods: From this concept, this study proposes a numerical approach combined with Statistical Shape Modeling (SSM) to evaluate the effect of aortic morphology variations on the different conditions of VA ECMO support. In particular, a new SSM approach was adopted to define 48 synthetic aortic morphologies starting from patient-specific computed tomography datasets. After assessing the morphological differences, the first 10 modes were selected to generate volumetric meshes for a Computational Fluid Dynamics (CFD) analysis. A total of 20 cases were simulated in the healthy conditions, while four cases were simulated with a 70% reduction of cardiac output and three different levels of ECMO support (0, 4, and 6 L/min).
Results: From the simulated results, it was possible to assess the behavior of the watershed zone as a function of aortic morphological parameters and ECMO level.
Discussion: The results confirmed the significant effect of ECMO level on the position and distribution of the zone.
1 Introduction
Cardiogenic shock (CS) is a pathological condition most commonly caused by myocardial infarction, leading to a significant reduction in cardiac output (CO) due to myocardial cell death (Vrints et al., 2024). As CO decreases, the left ventricle (LV) becomes unable to supply sufficient oxygenated blood to the systemic circulation, resulting in life-threatening consequences if not promptly managed. Several mechanical support systems exist to temporarily maintain circulation and oxygenation in patients with CS (Basir et al., 2023). Among these, veno-arterial extracorporeal membrane oxygenation (VA ECMO) is a widely adopted technique (Banfi et al., 2016). VA ECMO operates by draining venous blood through a first drainage cannula, passing it through an oxygenator with a rotary pump, and returning the oxygenated blood to the arterial circulation via a second return cannula. This process provides systemic oxygenation and supports LV function. Various cannulation strategies exist for the arterial return (Pavlushkov et al., 2017). A commonly adopted approach foresees an iliac artery percutaneous cannulation (Napp et al., 2016). In this configuration, ECMO flow is retrograde relative to native LV flow.
The VA ECMO appears to be a very successful procedure on the basis of its widespread use for the management of CS cases. Nevertheless, some pitfalls and flaws are well known to physicians. The process of VA ECMO management requires a significant level of caution and clinical experience. This aspect is underlined by the fact that, for example, there are no universally standardized protocols for VA ECMO weaning, and every individual center follows its own protocols (Tsiouris et al., 2023). One critical consideration is the increased afterload on the LV due to ECMO flow, which can exacerbate myocardial strain (Singh et al., 2020). Additional complications, including ischemia and thromboembolic events affecting the intestines, kidneys, and brain, are also reported, though their exact mechanisms remain not fully understood (Shen et al., 2022). A phenomenon frequently observed in clinical practice is the formation of a mixing region, known as the watershed zone, between the blood ejected by the LV and the blood delivered by the ECMO pump (Prisco et al., 2022). This watershed zone arises due to the retrograde nature of VA ECMO flow when peripheral cannulation is used. The behavior of this mixing zone is strongly linked to differential hypoxemia, a complication of VA ECMO in which upper and lower body regions receive blood with differing oxygenation levels (Rozencwajg et al., 2023). Furthermore, the complex formation of this region is believed to contribute to some of the above-cited less well-understood complications associated with VA ECMO. Based on this, an enhanced knowledge of the watershed zone behavior would be pivotal for optimizing the balance between the native and newly ECMO-driven oxygenation.
Investigating these aspects of VA ECMO remains challenging due to the intricate hemodynamic interactions involved. Both benchtop experiments (Schenk et al., 2015) and computational models (Cui et al., 2023) have been employed to study ECMO-related hemodynamics. Computational Fluid Dynamics (CFD) simulations have been extensively used in this field (Gramigna et al., 2024). Some studies have investigated the effect of ECMO support on arterial perfusion (Ahmed et al., 2022) and on the afterload increase (Vignali et al., 2023); while others have analyzed local fluid dynamics at the cannulation site (Parker et al., 2024). Additionally, prior numerical investigations have explored the watershed zone’s position and its variability at different ECMO flow rates (Rao et al., 2018). The morphology of the aorta is believed to play a key role in influencing the behavior of the watershed region, as highlighted in some previous publications (Khamooshi et al., 2024; Khodaee et al., 2022). Nevertheless, this statement is still to be proved, as tests on a wider number of cases are still lacking. In general, the state of the art most of the time reports single case studies (Du et al., 2022) or analyses performed on idealized aortic geometries (Malinowski et al., 2023). It is well established that the morphology of the thoracic aorta exhibits considerable anatomical variability, both in the main branch and in the supra-aortic vessels (Xiong et al., 2020), which may play a key role in ECMO-induced hemodynamic changes. In this research context, Statistical Shape Modeling (SSM) is emerging as a powerful tool for conducting population-based studies (Cosentino et al., 2020; Aljassam et al., 2024). SSM enables the extraction of key morphological features that characterize a population through two main steps: non-rigid registration of a template across all geometries of the dataset and dimensionality reduction to capture principal shape variations (Bruse et al., 2016). Moreover, the SSM is a tool that allows the data augmentation procedure, which means that it is possible to generate new realistic geometries (Ostendorf et al., 2024). The aim of this work is to conduct a population-based morphological and fluid dynamic study to investigate the effects of VA ECMO on flow distribution and blood mixing. Specifically, this study seeks to analyze the impact of aortic morphology on the watershed zone’s position and flow characteristics. We leveraged the capability of the SSM to expand our initial dataset with newly synthesized aortic geometries, whose morphology results from a combination of the original shapes. Then, a morphological analysis was performed to identify the most representative geometries within the augmented population. CFD simulations were then conducted on these selected geometries to assess how morphological differences influence hemodynamics. Based on the results of these initial simulations, a subset of geometries with the most significant hemodynamic features was selected for further analysis under ECMO-supported conditions. These additional simulations aimed to determine whether aortic morphology significantly impacts hemodynamics even in the presence of ECMO support. By integrating SSM and CFD, this study provides novel insights into the complex hemodynamics of VA ECMO, contributing to a better understanding of patient-specific factors that influence ECMO outcomes.
2 Materials and methods
The main steps of the procedure followed in this study are outlined in the following section and visually represented in Figure 1. Briefly, starting from an initial dataset of geometries, an augmented dataset of synthetic geometries was generated by developing an SSM. Through morphological inspection, the geometrically most representative geometries were selected for the healthy cases’ CFD simulations. Based on the hemodynamic analysis of these results, the most significant geometries were identified for simulations with ECMO support.
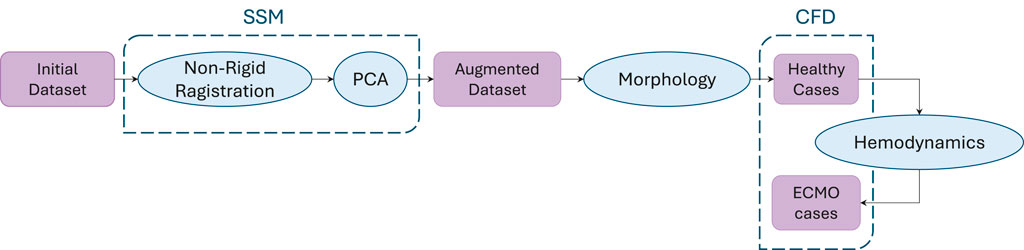
Figure 1. Workflow of the procedure followed in this study. Starting from an initial dataset, synthetic geometries were generated through SSM-based augmentation. A morphological analysis was then used to select geometries for healthy case simulations, and based on the hemodynamic analysis of these cases, a subset was chosen for ECMO-supported simulations.
2.1 Dataset generation
This study considered an initial population consisting of 19 healthy thoracic aortas. The CT scans were performed with a 320-detector scanner (Toshiba Aquilion One, Toshiba, Japan) using an iodinated contrast medium. The images are characterized by an average pixel size of 0.625
2.2 Quantitative analysis
A quantitative analysis was conducted to evaluate the morphological differences between the generated shapes and the template. First of all, the centerlines of the vessels with the associated geometric characteristics were extracted through the VMTK software. This operation creates four poly-lines, each connecting the inlet at the aortic root to one of the four outlets: BCA, LCCA, LSA, and descending aorta. The seven characteristic tracts of the thoracic aorta (total aorta, ascending aorta, arch, descending aorta, BCA, LCCA, LSA), represented in Figure 2A, were computed starting from these poly-lines by applying the branchextractor operator coupled with an in-house script. The branchextractor separates each polyline into different tracts every time the maximum inscribed radius changes, so it was possible to obtain the seven segments working with the Centerline-Id and the Tract-Id. For each of the extracted parts (i) length, (ii) tortuosity: length of a line divided by the distance of its endpoints, (iii) maximum inscribed sphere radius (referred to as “radius” for the sake of brevity), (iv) curvature: inverse of the radius of the local osculating circle, and (v) torsion: the amount by which the osculating plane rotates along the line, were calculated. For points (iii) to (v) mean and standard deviation values were calculated. Finally, the difference of each quantity from the template value was calculated, enabling the selection of 20 geometries for the healthy simulations that accounted for the morphological changes induced by the modes. Moreover, the mean and standard deviation values were calculated for each quantity over all the centerlines to make a comparison with the template, which represents the average geometry of the population under study.
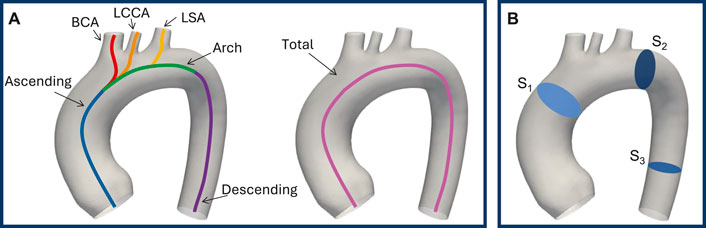
Figure 2. Seven characteristic tracts of the thoracic aorta: ascending aorta, arch, descending aorta, BCA, LCCA, LSA, and total aorta (A). Result planes, in blue, on the template geometry (B).
2.3 CFD simulations
CFD simulations were performed to investigate how different aortic morphologies could impact the oxygenation of supra-aortic branches during extracorporeal membrane oxygenation. Specifically, a set of cases was chosen to simulate healthy conditions based on geometric criteria from the previous quantitative analysis. Following these, a subset of geometries was selected from the healthy cases to simulate ECMO-supported conditions based on differences in terms of mean flows. For all the simulations, the volumetric meshes were generated in ANSA BETA CAE with an automatic in-house script. A polyhedral mesh was adopted, characterized by an average element edge size of 0.5
where
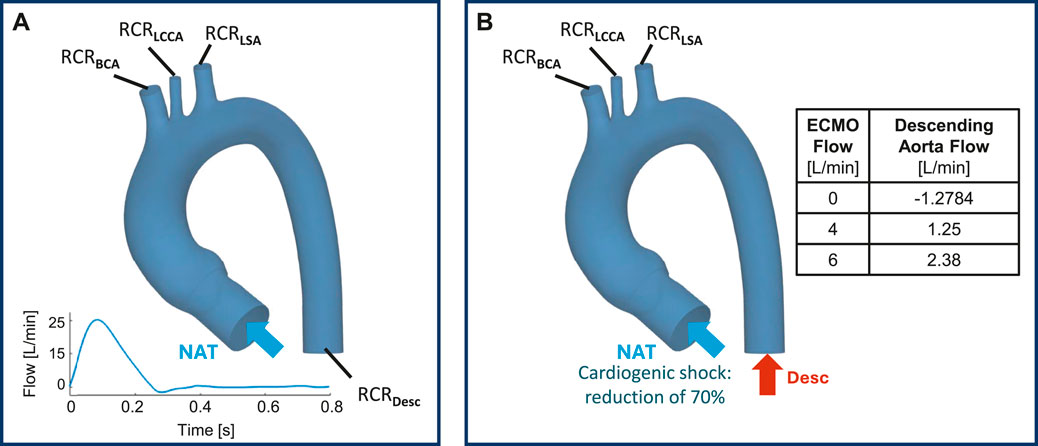
Figure 3. Simulations set up: healthy cases (A); ECMO support (B).
where
2.4 Healthy simulations
For the healthy cases subset simulations, an inlet velocity condition was imposed at the aortic valve level. To investigate the impact of morphology, the same ideal flow rate waveform was used. Velocity values were scaled according to the aortic valve cross-section to impose the same flow (5
2.5 ECMO simulations
For the ECMO subset cases, a Mixture Model was adopted. The Mixture Model solves the momentum, continuity, and energy equations for the phases mixture while introducing the volume fraction for equations of the secondary phases, and algebraic expressions for the relative velocities (Stevens et al., 2017). A two-phase Mixture Model was used to simulate the presence of two fluids, where phase-1 represents the native blood entering from the ascending aorta, while phase-2 is blood from ECMO. Two inlet boundary conditions were set: (i) the pathological cardiac flow from the left ventricle at the aortic valve level and (ii) a constant level of ECMO flow (EF) at the descending aorta (Vignali et al., 2023) (Figure 3B). To simulate the cardiac shock condition, the velocity waveform imposed at the aortic valve level was scaled to obtain a 70
2.6 Evaluation parameters
For each simulated case, results were post-processed in Ansys Fluent, and the following aspects were evaluated: (i) contour plot of total pressure on the aortic wall at systolic peak; (ii) streamlines at systolic peak and contour plot of velocity at the defined planes and (iii) mean flows
For each CFD simulation, various output parameters were calculated.
3 Results
Figure 4 presents the exploited graphical workflow outlining the methodology employed in this study. By developing an SSM, the initial dataset of 20 geometries was expanded to 48 synthetically generated, anatomically plausible geometries. A morphological analysis was then conducted to identify the 20 most representative geometries, which were subsequently used for CFD simulations under physiological conditions. Based on the hemodynamic analysis of these simulations, the four geometries exhibiting the greatest mean flow deviation from the template were selected for further CFD simulations under ECMO conditions.
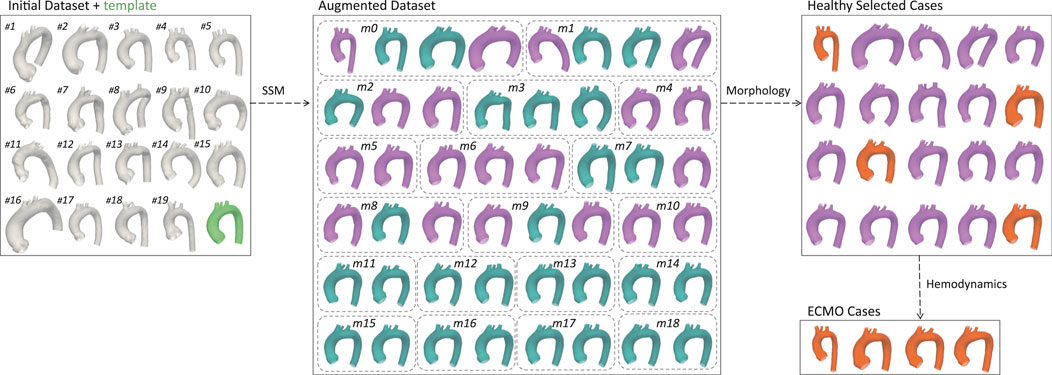
Figure 4. Graphical representation of the workflow. The initial dataset was augmented using SSM, generating an expanded set of geometries. Through morphological selection, a subset was defined for healthy simulations, and based on the hemodynamic results, specific geometries were selected for ECMO simulations. Labels have been added to identify the geometries from the initial dataset, and bounding boxes to group the augmented geometries according to their respective modes. In the augmented dataset the selected aortas for healthy simulations are colored in purple. In the healthy selected cases the aortas chosen for ECMO simulations are colored in orange.
3.1 Dataset generation
A total of 48 geometries (47 novel + template) were generated through the SSM by varying the standard deviation of the PCA modes. A qualitative analysis, conducted through visual inspection of the generated aortic shapes, allows for an understanding of the morphological changes associated with each principal mode. In particular, Figure 5A, shows that the variance explained by each mode decreases as the mode index increases. As a result, the first modes, which explain the largest portion of the variance, are responsible for global shape variations and predominantly influence global features such as vessel length, curvature, and radius. Conversely, higher-order modes tend to produce more subtle deformations, especially in the supra-aortic branches, with progressively less noticeable effects on overall shape. For illustrative purposes, Figure 5B, depicts the morphological changes induced by modes m0, m1, and m15 as SD varies from −2 to +2.
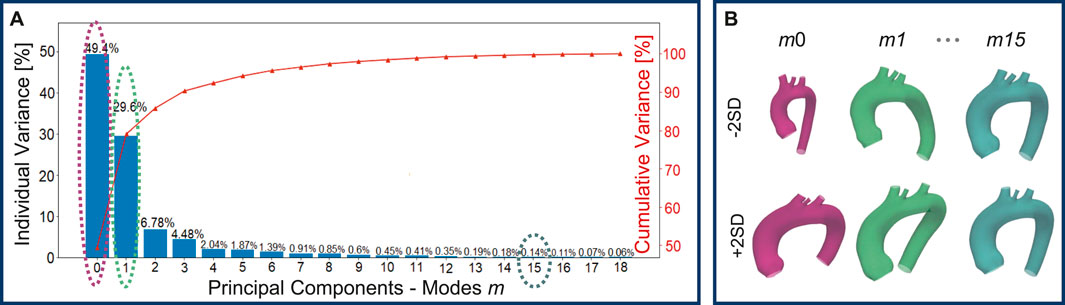
Figure 5. Individual and cumulative variance of the 19 principal components extracted through the PCA: as the modes increase, the percentage variance explained by each mode decreases (A). Newly generated geometries by varying m0, m1, and m15 of
3.2 Quantitative analysis
Subsequently, a quantitative analysis was conducted on the 47 aortas and the template to define the length, tortuosity, radius, curvature, and torsion of the three main sections of the aorta (ascending, descending, and arch tracts, Figure 6) and of the three supra-aortic branches (BCA, LCCA and LSA, Figure 7). The same features were also defined over the entire aorta to facilitate comparison of the various geometries. Modes 0 to three carry the majority of the variance as regards the length of the ascending, descending, and arch tracts. Extreme cases are visible for m0 and m7 for the ascending and descending tracts, respectively (Figure 6A). From mode 10 to 18, the total length variation is stable, around 2–3
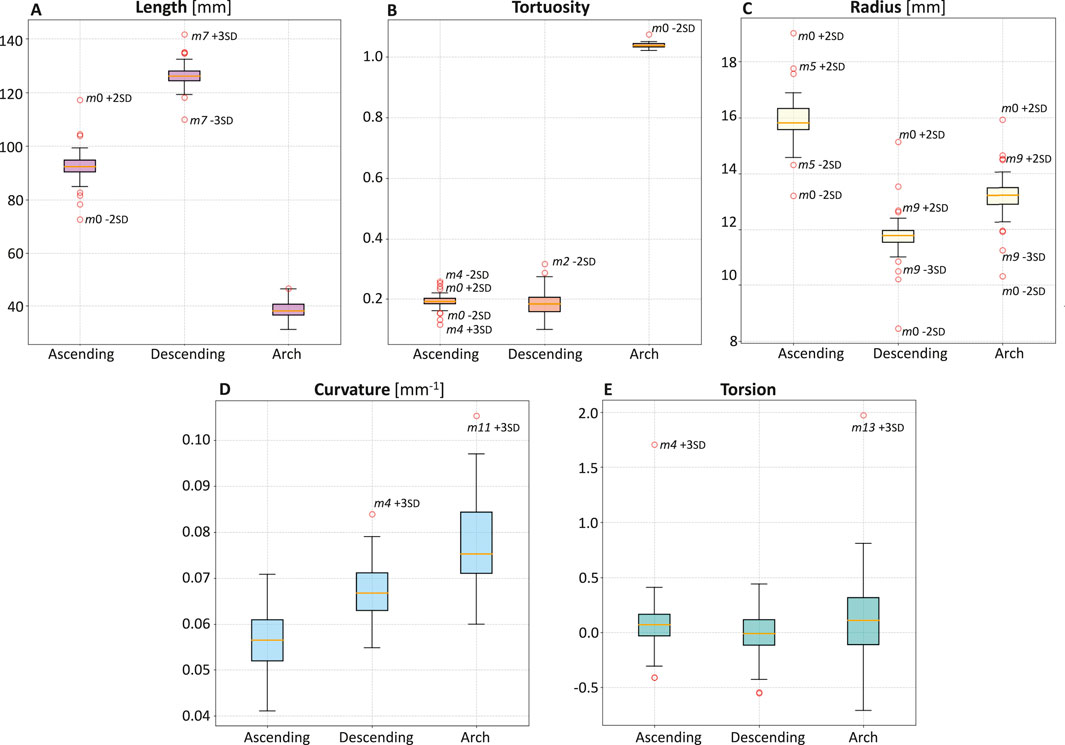
Figure 6. Boxplots of length (A), tortuosity (B), radius (C), curvature (D), and torsion (E) of the three main sections of the aorta: ascending, descending, and arch.
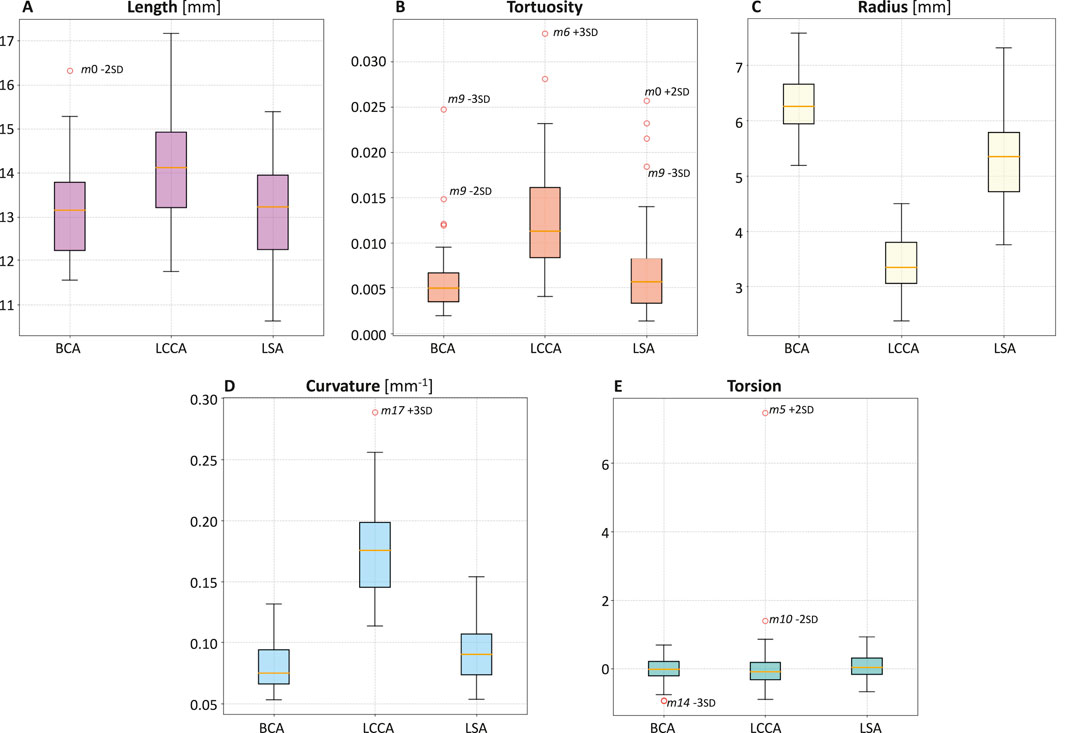
Figure 7. Boxplots of length (A), tortuosity (B), radius (C), curvature (D), and torsion (E) of the three supra-aortic branches: BCA, LCCA, LSA.
Concerning tortuosity, most of the variability is observed in the descending aorta, while, in the ascending aorta, there are extreme cases reported by the variations of m0 and m4 (Figure 6B). From m10 to m18, there is less and stable variation. The tortuosity of the ascending and descending tracts, compared to the template, shows that the descending tract reaches higher variation.
Mode m0 carries most of the radius variance. The ascending tract presents the highest radius values, which decrease in the aortic arch and reach a minimum value in the descending zone (Figure 6C). Apart from m0, radius variations compared to the template for each tract show that the ascending radius has a comparable variation in m5 while the arch and descending radius in m9.
The curvature values are uniformly distributed between the different geometries, with values ranging from 0.04 to 0.10
Torsion values are similar between the different geometries, with some extreme cases such as m4 +3 SD for the ascending tract and m13 + 3 SD for the arch (Figure 6E).
Table 1 reports the values of the morphological parameters. For each parameter, the values corresponding to the ascending aorta, descending aorta, and aortic arch are shown for the template geometry, along with the minimum and maximum values observed in both the initial dataset (composed of real aortic geometries) and the augmented dataset (synthetically generated shapes).
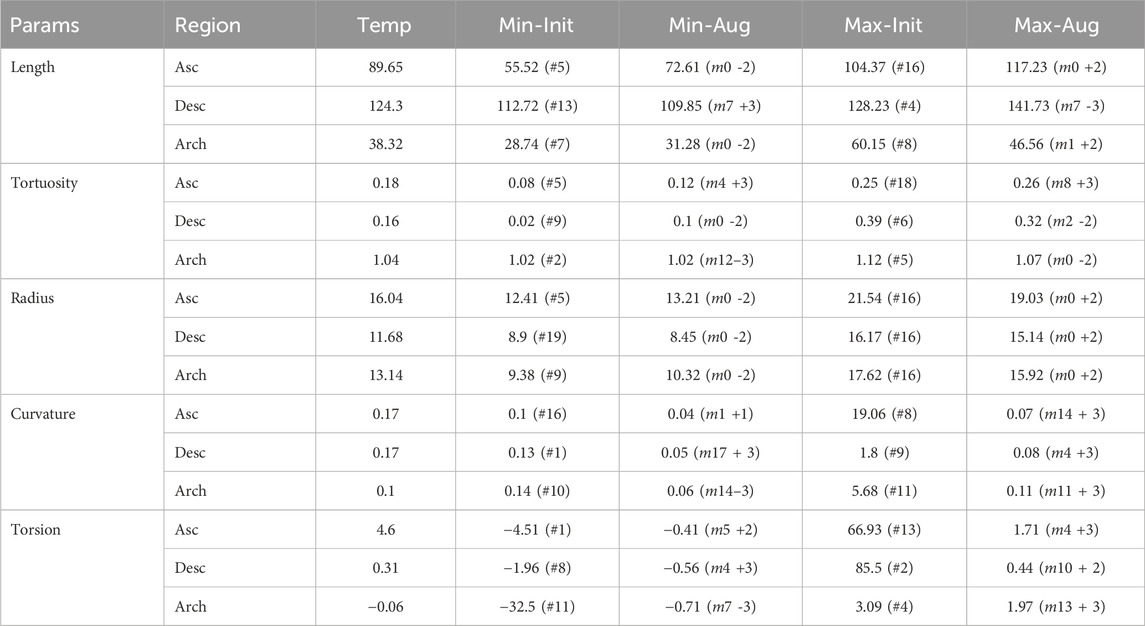
Table 1. Morphological parameter (Length [mm], Tortuosity, Radius [mm], Curvature
Upon analyzing the differences between the supra-aortic branches, it was found that LCCA has the smallest radius (Figure 7C) and twice the curvature compared to BCA and LSA (Figure 7D).
3.3 Healthy simulations
From the 48 aortas created, 20 geometries were selected from the first 10 modes, as these accounted for 98.5
Pressure values across the 20 aortic geometries were compared to assess variations related to morphological changes. Overall, pressures remained consistent among all cases, with values ranging around 120–130
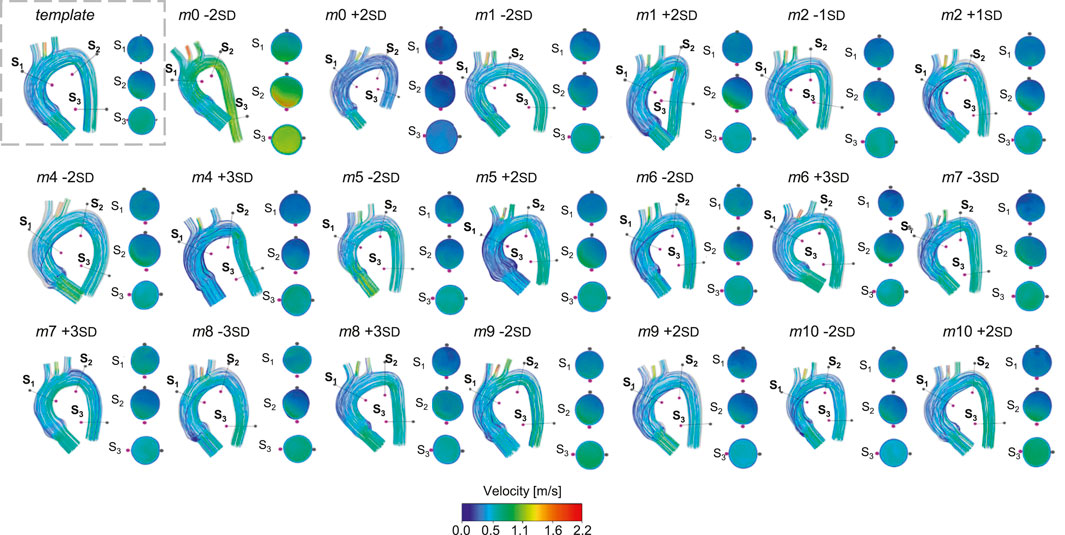
Figure 8. Velocity streamlines for the template and for the 20 geometries selected for the healthy simulations.
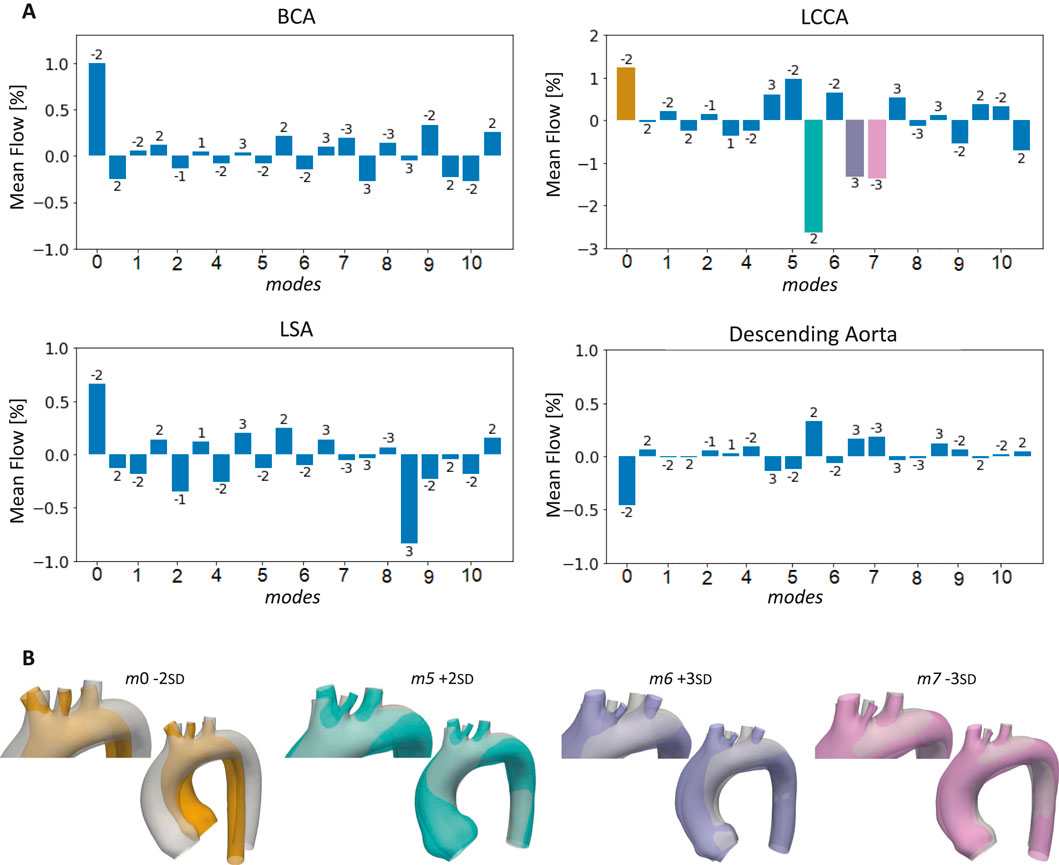
Figure 9. Bar plots of the mean flows at the outlets of the 20 aortas selected for the healthy simulations compared to the template (A), with highlight on the cases with the largest LCCA mean flow variations (B).
3.4 ECMO simulations
The pressures for the four simulated ECMO cases are reported in Figures 10A,B, for systolic peak and diastolic phase, respectively. In the absence of ECMO support, the simulated cardiogenic shock of 70
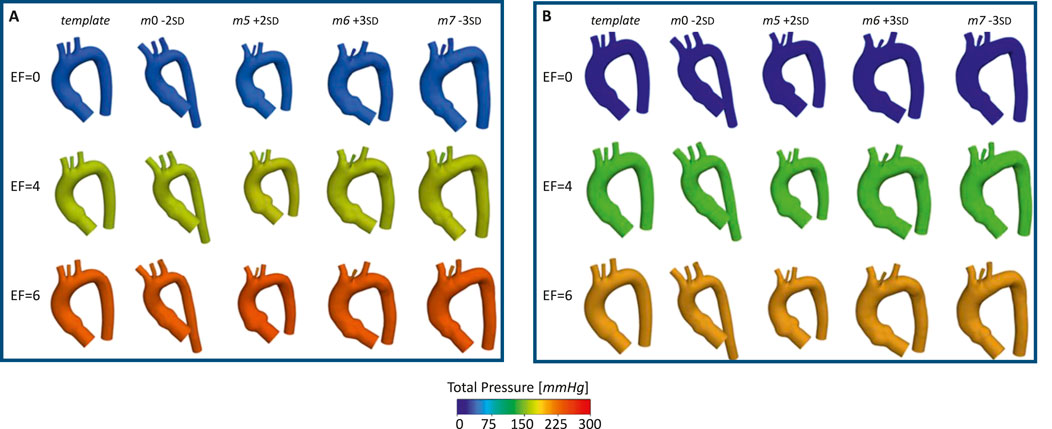
Figure 10. Total pressure for the template and the four aortas selected for the ECMO simulations, at different EF levels [L/min], for: systolic peak (A) and diastolic phase (B).
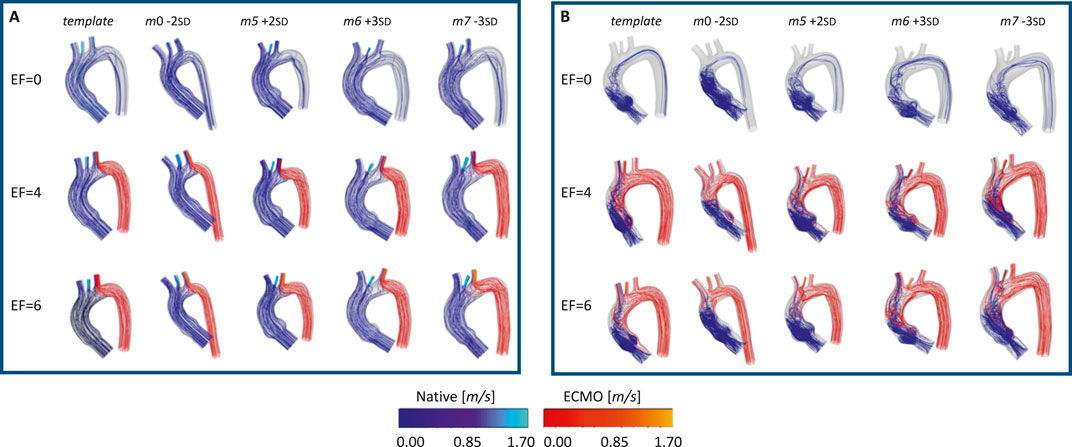
Figure 11. Velocity streamlines for the template and the four geometries selected for the ECMO simulations, at different EF levels [L/min], for: systolic (A) and diastolic phase (B).
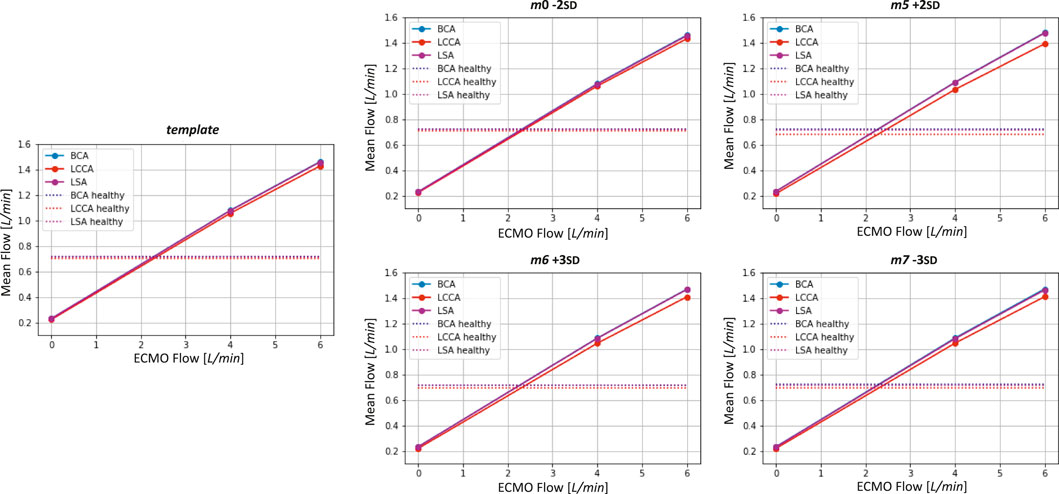
Figure 12. Mean flows as a function ECMO flow for the template and the four geometries selected for the ECMO simulations. Healthy levels of mean flow are also reported.
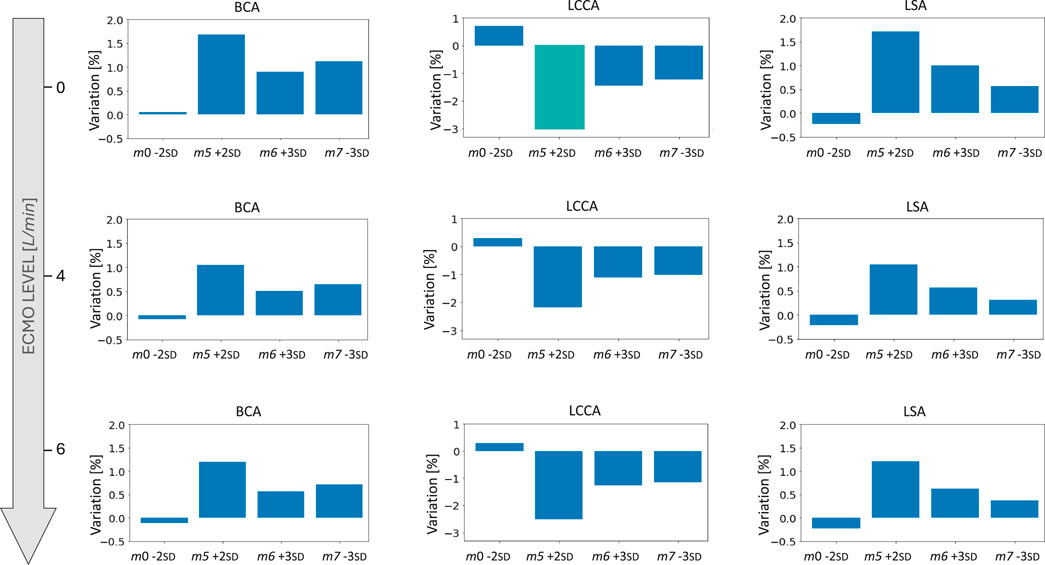
Figure 13. Bar plots of the mean flow percentage variations from the template for the four geometries selected for the ECMO simulations at different levels of ECMO support.
4 Discussion and conclusion
This study employed a novel combination of SSM and CFD to investigate the impact of aortic morphology on hemodynamics during VA ECMO support. The SSM approach successfully generated 48 different aortic morphologies, expanding the dataset beyond the initial patient-specific cases (Augmented Dataset of Figure 4). Figure 5 provides valuable insights into the role of principal component modes in capturing morphological variations. Panel A demonstrates that the variance explained by each mode decreases as the mode index increases. The ability of the first few modes to describe major structural changes suggests their potential in characterizing patient-specific aortic morphology for hemodynamic analysis. Additionally, Figure 5B highlights the morphological variations of three modes across a range of standard deviations. The variations of the first modes (m0 and m1) predominantly affect the global shape, influencing parameters such as aortic arch curvature and vessel diameter. In contrast, latter modes, specifically m15 in the example, introduce localized modifications and subtler changes, primarily affecting the supra-aortic vessels. Such local variations may influence secondary flow structures and localized hemodynamic stress distributions, which have been shown to play a role in vascular remodeling and pathology development (Li et al., 2023; Johnston et al., 2021). A quantitative morphology analysis was adopted to select a subset of cases for healthy and ECMO support simulations. The morphological characterization of the dataset revealed key variations in aortic segment properties such as length, tortuosity, radius, curvature, and torsion. Notably, modes 0 and seven exhibited the most extreme variations in length for the ascending and descending aorta, respectively (Figure 6A). Tortuosity varied significantly in the descending aorta (Figure 6B), which may have important implications for flow disturbances and the formation of secondary flow structures. The radius of the aorta showed the highest variation in the ascending portion (Figure 6C), which could affect local velocity profiles and pressure distributions. The results demonstrated that variations in aortic geometry influence the position and characteristics of the watershed zone, thereby affecting oxygenation distribution. These findings align with previous computational studies (Cheng et al., 2014; Khodaee et al., 2022), which have highlighted the role of anatomical variability in ECMO circulatory support. To evaluate the anatomical plausibility of the generated aortic geometries, we compared their morphological parameters with those of the real anatomies in the original dataset. Table 1 includes the minimum and maximum values observed for each parameter in both the initial and augmented datasets. The results show that the synthetic geometries lie within physiologically reasonable bounds, consistent with those found in real subjects. Slight deviations are observed for curvature and torsion, where the maximum values in the initial dataset are significantly higher than those in the augmented one. This is likely due to the lower variance explained by the higher-order modes used to generate the extreme synthetic shapes, where stronger morphological deviations would require higher SD values than the
Among the supra-aortic branches, the LCCA exhibited the smallest radius and the highest curvature values (Figures 7C,D), suggesting a more pronounced susceptibility to flow disturbances. The total pressure distribution remained relatively consistent across the 20 healthy simulations, with pressures around
The ECMO simulations demonstrated a marked increase in total pressure with higher ECMO flow rates (Figure 10). At 4 L/min, pressures exceeded physiological levels, reaching 160 mmHg, while at 6 L/min, localized peak pressures approached 300 mmHg. These elevations reinforce concerns regarding increased left ventricular afterload, which may compromise cardiac function and necessitate additional unloading strategies (Schrage et al., 2018; Distelmaier et al., 2020; Kishi, 2020; Jiang et al., 2024; Russo et al., 2019). The watershed zone position was highly dependent on ECMO support levels, as depicted in Figure 11. At 4 L/min, mixing predominantly occurred near the LSA, whereas at 6 L/min, the mixing region shifted into the aortic arch, between LCCA and LSA. During diastole, retrograde ECMO flow extended beyond the BCA, influencing the oxygenation distribution in the ascending aorta. Despite morphological variability, the watershed zone location remained relatively stable across different geometries. Mean flow distributions followed a largely linear trend with increasing ECMO support (Figure 12), suggesting a predictable redistribution pattern. Importantly, in all cases, healthy-level mean flow was restored, confirming ECMO’s role in maintaining systemic perfusion. However, cases with significant arch morphological deviations exhibited minor deviations in flow ratios, particularly in LCCA. The percentage variations in mean flow across different ECMO levels remained within
An additional relevant aspect that could be explored in future work is whether the hemodynamic results obtained from the augmented dataset are consistent with those derived from the original patient-specific geometries. Such a comparison could serve as an additional validation of the fluid dynamic fidelity of the SSM-generated shapes. Nevertheless, it is worth noting that the augmented dataset was generated to preserve anatomical likeliness and geometric realism, as supported by the quantitative morphological analysis presented in this study. Additionally, incorporating validation through in-vivo measurements and experimental setups is fundamental to reinforce the credibility of numerical predictions. As recently demonstrated by (Gasparotti et al., 2025), who validated their CFD models using a detailed mock circulatory loop (Vignali et al., 2022; Bardi et al., 2022) combined with phantom-based flow measurements, the inclusion of experimental data provides an additional layer of verification. This dual numerical-experimental approach enhances the robustness of CFD simulations, enabling a more accurate characterization of flow patterns, critical mixing zones, and physiological responses under ECMO support. Future integration of such validation strategies will be essential to strengthen the reliability of computational frameworks and promote their adoption as effective clinical decision-support tools. Overall, this study highlights the critical role of aortic morphology in influencing ECMO hemodynamics. It provides valuable insights into the interplay between aortic morphology and ECMO hemodynamics, reinforcing the need for personalized ECMO strategies to optimize oxygenation and mitigate complications.
Data availability statement
The data that support the findings of this study are available on reasonable request from the corresponding author.
Ethics statement
All procedures performed in studies involving human participants were in accordance with the ethical gold standards of the institutional and regional research committee and with the 1964 Helsinki Declaration and its later amendments or comparable ethical standards. The study was approved by the Committee of the Tuscany Region on 6th of June 2024 (MAGIC, Marcatori di imAGing, fluIdodinamici e moleColari associati o predittivi ad anomalie delle valvole cardiache e della parete aortica, No. 95/2024).
Author contributions
MM: Writing - original draft, Writing - review and editing, Conceptualization. EG: Writing - original draft, Writing - review and editing, Conceptualization, Resources, Supervision. EV: Writing - original draft, Writing - review and editing, Conceptualization, Resources, Supervision. DH: Writing - review and editing, Conceptualization, Resources, Supervision. SC: Writing - review and editing, Conceptualization, Resources, Supervision.
Funding
The author(s) declare that no financial support was received for the research and/or publication of this article.
Conflict of interest
The authors declare that the research was conducted in the absence of any commercial or financial relationships that could be construed as a potential conflict of interest.
Generative AI statement
The author(s) declare that no Generative AI was used in the creation of this manuscript.
Publisher’s note
All claims expressed in this article are solely those of the authors and do not necessarily represent those of their affiliated organizations, or those of the publisher, the editors and the reviewers. Any product that may be evaluated in this article, or claim that may be made by its manufacturer, is not guaranteed or endorsed by the publisher.
References
Ahmed, Y., Lynch, S. R., Haft, J. W., Moll, F. L., van Herwaarden, J. A., Burris, N. S., et al. (2022). Patient-specific computational modeling of different cannulation strategies for extracorporeal membrane oxygenation. ASAIO J. 68, e179–e187. doi:10.1097/mat.0000000000001819
Aljassam, Y., Sophocleous, F., Bruse, J. L., Schot, V., Caputo, M., and Biglino, G. (2024). Machine learning and statistical shape modelling methodologies to assess vascular morphology before and after aortic valve replacement. J. Clin. Med. 13, 4577. doi:10.3390/jcm13154577
Banfi, C., Pozzi, M., Brunner, M.-E., Rigamonti, F., Murith, N., Mugnai, D., et al. (2016). Veno-arterial extracorporeal membrane oxygenation: an overview of different cannulation techniques. J. Thorac. Dis. 8, E875–E885. doi:10.21037/jtd.2016.09.25
Bardi, F., Gasparotti, E., Vignali, E., Avril, S., and Celi, S. (2022). A hybrid mock circulatory loop for fluid dynamic characterization of 3d anatomical phantoms. IEEE Trans. Biomed. Eng. 70, 1651–1661. doi:10.1109/tbme.2022.3224581
Basir, M. B., Lemor, A., Gorgis, S., Patel, K. C., Kolski, B. C., Bharadwaj, A. S., et al. (2023). Early utilization of mechanical circulatory support in acute myocardial infarction complicated by cardiogenic shock: the national cardiogenic shock initiative. J. Am. Heart Assoc. 12, e031401. doi:10.1161/jaha.123.031401
Bruse, J. L., McLeod, K., Biglino, G., Ntsinjana, H. N., Capelli, C., Hsia, T.-Y., et al. (2016). A statistical shape modelling framework to extract 3d shape biomarkers from medical imaging data: assessing arch morphology of repaired coarctation of the aorta. BMC Med. imaging 16, 40–19. doi:10.1186/s12880-016-0142-z
Calò, K., Capellini, K., De Nisco, G., Mazzi, V., Gasparotti, E., Gallo, D., et al. (2023). Impact of wall displacements on the large-scale flow coherence in ascending aorta. J. Biomechanics 154, 111620. doi:10.1016/j.jbiomech.2023.111620
Capellini, K., Gasparotti, E., Cella, U., Costa, E., Fanni, B. M., Groth, C., et al. (2021). A novel formulation for the study of the ascending aortic fluid dynamics with in vivo data. Med. Eng. and Phys. 91, 68–78. doi:10.1016/j.medengphy.2020.09.005
Capellini, K., Vignali, E., Costa, E., Gasparotti, E., Biancolini, M. E., Landini, L., et al. (2018). Computational fluid dynamic study for ataa hemodynamics: an integrated image-based and radial basis functions mesh morphing approach. J. biomechanical Eng. 140, 111007. doi:10.1115/1.4040940
Cheng, R., Hachamovitch, R., Kittleson, M., Patel, J., Arabia, F., Moriguchi, J., et al. (2014). Complications of extracorporeal membrane oxygenation for treatment of cardiogenic shock and cardiac arrest: a meta-analysis of 1,866 adult patients. Ann. Thorac. Surg. 97, 610–616. doi:10.1016/j.athoracsur.2013.09.008
Cosentino, F., Raffa, G. M., Gentile, G., Agnese, V., Bellavia, D., Pilato, M., et al. (2020). Statistical shape analysis of ascending thoracic aortic aneurysm: correlation between shape and biomechanical descriptors. J. personalized Med. 10, 28. doi:10.3390/jpm10020028
Cui, W., Wang, T., Xu, Z., Liu, J., Simakov, S., and Liang, F. (2023). A numerical study of the hemodynamic behavior and gas transport in cardiovascular systems with severe cardiac or cardiopulmonary failure supported by venoarterial extracorporeal membrane oxygenation. Front. Bioeng. Biotechnol. 11, 1177325. doi:10.3389/fbioe.2023.1177325
Distelmaier, K., Wiedemann, D., Lampichler, K., Toth, D., Galli, L., Haberl, T., et al. (2020). Interdependence of va-ecmo output, pulmonary congestion and outcome after cardiac surgery. Eur. J. Intern. Med. 81, 67–70. doi:10.1016/j.ejim.2020.07.014
Du, G., Zhang, J., Liu, J., and Fan, L. (2022). Case report: two cases of watershed phenomenon in mechanical circulatory support devices: computed tomography angiography imaging and literature review. Front. Cardiovasc. Med. 9, 893355. doi:10.3389/fcvm.2022.893355
Gallo, D., Steinman, D. A., Bijari, P. B., and Morbiducci, U. (2012). Helical flow in carotid bifurcation as surrogate marker of exposure to disturbed shear. J. biomechanics 45, 2398–2404. doi:10.1016/j.jbiomech.2012.07.007
Garcia, J., Barker, A. J., Collins, J. D., Carr, J. C., and Markl, M. (2017). Volumetric quantification of absolute local normalized helicity in patients with bicuspid aortic valve and aortic dilatation. Magnetic Reson. Med. 78, 689–701. doi:10.1002/mrm.26387
Gasparotti, E., Vignali, E., Scolaro, M., Haxhiademi, D., and Celi, S. (2025). A computational and experimental study of veno-arterial extracorporeal membrane oxygenation in cardiogenic shock: defining the trade-off between perfusion and afterload. Biomechanics Model. Mechanobiol. 24, 1043–1056. doi:10.1007/s10237-025-01952-9
Gramigna, V., Palumbo, A., and Fragomeni, G. (2024). The influence of different ecmo cannulation site and blood perfusion conditions on the aortic hemodynamics: a computational fluid dynamic model. Fluids 9, 269. doi:10.3390/fluids9110269
Gu, K., Gao, S., Zhang, Z., Ji, B., and Chang, Y. (2022). Hemodynamic effect of pulsatile on blood flow distribution with va ecmo: a numerical study. Bioengineering 9, 487. doi:10.3390/bioengineering9100487
Jiang, J., Jain, P., Adji, A., Stevens, M., Vazquez, G. M., Barua, S., et al. (2024). Afterload pressure and left ventricular contractility synergistically affect left atrial pressure during veno-arterial ecmo. JHLT Open 3, 100044. doi:10.1016/j.jhlto.2023.100044
Johnston, L., Allen, R., Hall Barrientos, P., Mason, A., and Kazakidi, A. (2021). Hemodynamic abnormalities in the aorta of Turner syndrome girls. Front. Cardiovasc. Med. 8, 670841. doi:10.3389/fcvm.2021.670841
Khamooshi, M., Wickramarachchi, A., Byrne, T., Seman, M., Fletcher, D. F., Burrell, A., et al. (2024). Blood flow and emboli transport patterns during venoarterial extracorporeal membrane oxygenation: a computational fluid dynamics study. Comput. Biol. Med. 172, 108263. doi:10.1016/j.compbiomed.2024.108263
Khodaee, F., Nezami, F. R., Zampell, B. A., Galper, E., Edelman, E. R., and Keller, S. P. (2022). Effect of anatomical variation on extracorporeal membrane oxygenation circulatory support: a computational study. Comput. Biol. Med. 141, 105178. doi:10.1016/j.compbiomed.2021.105178
Kishi, T. (2020). Clinical implication of left ventricular preload and afterload reduction during venoarterial extracorporeal membrane oxygenation. Int. J. Cardiol. 320, 124–125. doi:10.1016/j.ijcard.2020.06.013
Li, F., Zhu, Y., Song, H., Zhang, H., Chen, L., and Guo, W. (2023). Analysis of postoperative remodeling characteristics after modular inner branched stent-graft treatment of aortic arch pathologies using computational fluid dynamics. Bioengineering 10, 164. doi:10.3390/bioengineering10020164
Lo Russo, G. V., Alarouri, H. S., Al-Abcha, A., Vogl, B., Mahayni, A., Sularz, A., et al. (2024). Association of bovine arch anatomy with incident stroke after transcatheter aortic valve replacement. J. Am. Heart Assoc. 13, e032963. doi:10.1161/jaha.123.032963
Malinowski, D., Fournier, Y., Horbach, A., Frick, M., Magliani, M., Kalverkamp, S., et al. (2023). Computational fluid dynamics analysis of endoluminal aortic perfusion. Perfusion 38, 1222–1229. doi:10.1177/02676591221099809
Margarint, I.-M., Youssef, T., Robu, M., Rotaru, I., Popescu, A., Untaru, O., et al. (2024). The management of aortic coarctation associated with hypoplastic arches and particular arch anatomies: a literature review. J. Personalized Med. 14, 732. doi:10.3390/jpm14070732
Marrocco-Trischitta, M. M., Alaidroos, M., Romarowski, R. M., Secchi, F., Righini, P., Glauber, M., et al. (2020). Geometric pattern of proximal landing zones for thoracic endovascular aortic repair in the bovine arch variant. Eur. J. Vasc. Endovascular Surg. 59, 808–816. doi:10.1016/j.ejvs.2019.11.019
Morbiducci, U., Ponzini, R., Rizzo, G., Cadioli, M., Esposito, A., Montevecchi, F. M., et al. (2011). Mechanistic insight into the physiological relevance of helical blood flow in the human aorta: an in vivo study. Biomechanics Model. Mechanobiol. 10, 339–355. doi:10.1007/s10237-010-0238-2
Napp, L. C., Kühn, C., Hoeper, M. M., Vogel-Claussen, J., Haverich, A., Schäfer, A., et al. (2016). Cannulation strategies for percutaneous extracorporeal membrane oxygenation in adults. Clin. Res. Cardiol. 105, 283–296. doi:10.1007/s00392-015-0941-1
Nezami, F. R., Khodaee, F., Edelman, E. R., and Keller, S. P. (2021). A computational fluid dynamics study of the extracorporeal membrane oxygenation-failing heart circulation. ASAIO J. 67, 276–283. doi:10.1097/mat.0000000000001221
Ostendorf, K., Bäumler, K., Mastrodicasa, D., Fleischmann, D., Preim, B., and Mistelbauer, G. (2024). Synthetic surface mesh generation of aortic dissections using statistical shape modeling. Comput. and Graph. 124, 104070. doi:10.1016/j.cag.2024.104070
Parker, L. P., Fiusco, F., Rorro, F., Svensson Marcial, A., Brismar, T. B., Broman, L. M., et al. (2024). Venovenous extracorporeal membrane oxygenation drainage cannula performance: from generalized to patient-averaged vessel model. Phys. Fluids 36. doi:10.1063/5.0212546
Pavlushkov, E., Berman, M., and Valchanov, K. (2017). Cannulation techniques for extracorporeal life support. Ann. Transl. Med. 5, 70. doi:10.21037/atm.2016.11.47
Prisco, A. R., Aguado-Sierra, J., Butakoff, C., Vazquez, M., Houzeaux, G., Eguzkitza, B., et al. (2022). Concomitant respiratory failure can impair myocardial oxygenation in patients with acute cardiogenic shock supported by va-ecmo. J. Cardiovasc. Transl. Res. 15, 217–226. doi:10.1007/s12265-021-10110-2
Rao, P., Khalpey, Z., Smith, R., Burkhoff, D., and Kociol, R. D. (2018). Venoarterial extracorporeal membrane oxygenation for cardiogenic shock and cardiac arrest: cardinal considerations for initiation and management. Heart Fail. 11, e004905. doi:10.1161/circheartfailure.118.004905
Rozencwajg, S., Heinsar, S., Wildi, K., Jung, J.-S., Colombo, S. M., Palmieri, C., et al. (2023). Effect of flow change on brain injury during an experimental model of differential hypoxaemia in cardiogenic shock supported by extracorporeal membrane oxygenation. Sci. Rep. 13, 4002. doi:10.1038/s41598-023-30226-6
Russo, J. J., Aleksova, N., Pitcher, I., Couture, E., Parlow, S., Faraz, M., et al. (2019). Left ventricular unloading during extracorporeal membrane oxygenation in patients with cardiogenic shock. J. Am. Coll. Cardiol. 73, 654–662. doi:10.1016/j.jacc.2018.10.085
Scarpolini, M. A., Mazzoli, M., and Celi, S. (2023). Enabling supra-aortic vessels inclusion in statistical shape models of the aorta: a novel non-rigid registration method. Front. Physiology 14, 1211461. doi:10.3389/fphys.2023.1211461
Schenk, A., Fallon, J., Farrell, M., Halter, R., and Yun, J. (2015). “Murine veno-arterial extracorporeal membrane oxygenation (mva-ecmo): a novel tool to study the molecular biology of mechanical circulatory support,” in AMERICAN journal of transplantation (NJ USA: WILEY-BLACKWELL), 15.
Schrage, B., Burkhoff, D., Rübsamen, N., Becher, P. M., Schwarzl, M., Bernhardt, A., et al. (2018). Unloading of the left ventricle during venoarterial extracorporeal membrane oxygenation therapy in cardiogenic shock. JACC Heart Fail. 6, 1035–1043. doi:10.1016/j.jchf.2018.09.009
Shen, J., Tse, J. R., Chan, F., and Fleischmann, D. (2022). Ct angiography of venoarterial extracorporeal membrane oxygenation. Radiographics 42, 23–37. doi:10.1148/rg.210079
Singh, G., Hudson, D., and Shaw, A. (2020). Medical optimization and liberation of adult patients from va-ecmo. Can. J. Cardiol. 36, 280–290. doi:10.1016/j.cjca.2019.10.038
Stevens, M., Callaghan, F., Forrest, P., Bannon, P., and Grieve, S. (2017). Flow mixing during peripheral veno-arterial extra corporeal membrane Oxygenation–A simulation study. J. biomechanics 55, 64–70. doi:10.1016/j.jbiomech.2017.02.009
Syperek, A. (2020). The” Bovine Aortic Arch” in stroke patients: prevalence, embryological development and hemodynamic implications of a common aortic arch branching variation. Ph.D. thesis. Aus dem Institut für Diagnostische Radiologie und Neuroradiologie der Medizinischen Fakultät der Universität Greifswald
Tsiouris, A., Protos, A. N., Saikus, C. E., and Jeyakumar, A. K. C. (2023). Fundamentals of weaning veno-arterial and veno-venous extracorporeal membrane oxygenation. Indian J. Thorac. Cardiovasc. Surg. 39, 123–133. doi:10.1007/s12055-023-01474-y
Vignali, E., Gasparotti, E., Haxhiademi, D., and Celi, S. (2023). Fluid dynamic model for extracorporeal membrane oxygenation support and perfusion in cardiogenic shock. Phys. Fluids 35488. doi:10.1063/5.0174259
Vignali, E., Gasparotti, E., Mariotti, A., Haxhiademi, D., Ait-Ali, L., and Celi, S. (2022). High-versatility left ventricle pump and aortic mock circulatory loop development for patient-specific hemodynamic in vitro analysis. ASAIO J. 68, 1272–1281. doi:10.1097/mat.0000000000001651
Vrints, C., Andreotti, F., Koskinas, K. C., Rossello, X., Adamo, M., Ainslie, J., et al. (2024). 2024 esc guidelines for the management of chronic coronary syndromes: developed by the task force for the management of chronic coronary syndromes of the european society of cardiology (esc) endorsed by the european association for cardio-thoracic surgery (eacts). Eur. heart J., ehae177. doi:10.1093/eurheartj/ehae177
Xiong, Z., Yang, P., Li, D., Qiu, Y., Zheng, T., and Hu, J. (2020). A computational fluid dynamics analysis of a patient with acute non-a-non-b aortic dissection after type i hybrid arch repair. Med. Eng. and Phys. 77, 43–52. doi:10.1016/j.medengphy.2019.10.019
Keywords: VA ECMO, computational fluid dynamics, statistical shape model, aorta, watershed zone
Citation: Mazzoli M, Gasparotti E, Vignali E, Haxhiademi D and Celi S (2025) Impact of aortic morphology on VA-ECMO performance: a combined statistical shape modeling and CFD approach. Front. Bioeng. Biotechnol. 13:1620897. doi: 10.3389/fbioe.2025.1620897
Received: 30 April 2025; Accepted: 16 June 2025;
Published: 03 July 2025.
Edited by:
Cristina Falcinelli, G. d’Annunzio University of Chieti and Pescara, ItalyReviewed by:
Michele Marino, University of Rome Tor Vergata, ItalyMonika Colombo, Aarhus University, Denmark
Copyright © 2025 Mazzoli, Gasparotti, Vignali, Haxhiademi and Celi. This is an open-access article distributed under the terms of the Creative Commons Attribution License (CC BY). The use, distribution or reproduction in other forums is permitted, provided the original author(s) and the copyright owner(s) are credited and that the original publication in this journal is cited, in accordance with accepted academic practice. No use, distribution or reproduction is permitted which does not comply with these terms.
*Correspondence: Simona Celi, cy5jZWxpQGZ0Z20uaXQ=