 Amina M. Dirir1†
 Kaumeel Chokshi1,2†
 Abdelmoneim H. Ali3
 Media Alhanawi1Mohan Rommala4
 Mayssa Hachem1,2*
- 1Department of Chemistry, College of Engineering and Physical Sciences, Khalifa University of Sciences and Technology, Abu Dhabi, United Arab Emirates
- 2Food Security and Technology Center, Khalifa University of Sciences and Technology, Abu Dhabi, United Arab Emirates
- 3Department of Food Science, College of Agriculture and Veterinary Medicine, United Arab Emirates University (UAEU), Al Ain, United Arab Emirates
- 4Analytical Chemistry and Biochemistry Core Laboratories, Khalifa University of Sciences and Technology, Abu Dhabi, United Arab Emirates
Aurantiochytrium limacinum (A. limacinum) is a promising microbial source of polyunsaturated fatty acids (PUFAs), particularly Docosahexaenoic Acid (DHA, C22:6n-3). In this study, we first optimized the culture conditions of A. limacinum ATCC MYA-1381 (strain SR21). Cell growth was monitored via optical density, cell counts, and glucose concentration. Cells were harvested at exponential and stationary phases, and lipids were extracted using a green method. Fatty Acid Methyl Esters (FAMEs) were prepared and analyzed using Gas Chromatography-Flame Ionisation Detection (GC-FID). At the exponential phase, DHA was the most abundant (65.6% of total fatty acids) followed by palmitic acid (C16:0) at 34.4%. At the stationary phase, Docosapentaenoic acid (DPA, C22:5n-3) and DHA were the most abundant at 45.4% and 33.9%, before respectively. Myristic acid (C14:0), myristoleic acid (C14:1n-9), palmitic acid (C16:0) were present at 4.6%, 6.2% and 9.9%, respectively. Compound-specific isotope analysis (CSIA) using Gas Chromatography-Combustion-Isotope Ratio Mass Spectrometry (GC-C-IRMS) revealed that all FAMEs had negative δ13C values, indicating depletion in 13C. At the exponential phase, δ13C (‰) of C16:0 and DHA were −16.8 ± 0.2 and −18.5‰ ± 0.1‰, respectively. At the stationary phase, δ13C (‰) of C14:0, C14:1n-9, C16:0, C22:5n-3 and DHA were −10.6 ± 1.1, −11.3 ± 0.1, −11.1 ± 0.2, −8.3 ± 0.2 and −10.6‰ ± 0.1‰, respectively. Overall, our findings emphasized the importance of A. limacinum as a viable microbial platform for environmentally friendly production of PUFA such as DHA. Also, the study reinforced the utility of CSIA in tracking PUFA metabolic fate, which has latent applications in biomedical research, particularly in neurodegenerative disease frameworks where DHA plays a vital role. Finally, these results may also contribute to understanding isotopic fractionation patterns and metabolic flux variations across different microalgal growth phases.
1 Introduction
Docosahexaenoic acid (DHA, C22:6n-3) is an omega-3 polyunsaturated fatty acid (PUFA) mainly found in human’s brain and eyes exhibiting several beneficial health effects mainly in prevention and potential treatment of neurodegenerative diseases such as Alzheimer’s and Parkinson’s in addition to eyes’ diseases (Hachem and Nacir, 2022; Hachem et al., 2016; Belkouch et al., 2016; Hachem et al., 2020). DHA can be found in several food sources including fish and salmon. Moreover, DHA can be produced from microalgae.
Indeed, algae are a group of photosynthetic organisms found in various aquatic ecosystems, such as rivers, oceans, and ponds. They can tolerate the variation of several environmental parameters, including temperature, salinity, pH values, and light intensity. They can also endure harsh conditions in deserts, reservoirs and grow alone or in symbiosis with other organisms (Khan et al., 2018). Moreover, algae encompass various groups of photosynthetic organisms including microscopic unicellular microalgae and complex macroalgae, also known as seaweed. More recently, algae have received substantial attention due to several features, including remarkable nutritional profiles and potentials in food and pharmaceutical applications (Wu et al., 2023; Kumar et al., 2021; Kent et al., 2015).
Similar to other photosynthetic organisms, algae can synthesize various bioactive compounds known as secondary metabolites (Cardozo et al., 2007; Pereira et al., 2021). Metabolites are produced at the end of the growth phase or due to abiotic/biotic stress induced by the surrounding environmental conditions. These bioactive natural metabolites produced from algae including phycobiliprotein pigments, phenolic compounds, carotenoids and polysaccharides exhibit a wide range of biological properties, such as anticancer, antimicrobial, and antioxidant activities (Shalaby, 2011; Roleira et al., 2015; Avila-Roman et al., 2021; Hou and Cui, 2018). Additionally, microalgae can produce several lipids-based compounds, including fatty acids (FAs) and PUFAs such as DHA (Remize et al., 2021). FAs are considered as one of the major groups of microalgae biomass and generally constitute 5%–60% of cell dry weight (Morales et al., 2021).
Among those microalgae, Thraustochytrids, categorized as Stramenopiles, are heterotrophic marine protists capable of producing vast quantities of PUFA including DHA (Nyunoya et al., 2022). Additionally, Crypthecodinium cohnii is another heterotrophic marine dinoflagellate considered as a rich producer of DHA. DHA’s purification process from C. Cohnii is appealing since it significantly produces DHA, rather than any other PUFAs, utilized in pharmaceutical and nutraceutical applications (Mendes et al., 2009). Moreover, Isochrysis galbana is an example of microalgae producing DHA. Indeed, I. galbana can grow in harsh environmental conditions and possess a high growth rate and productivity. It is considered also as a rich source for other valuable products significant for human health such as vitamins, polysaccharides, sterols and carotenoids (Señoráns et al., 2020). Likewise, Nannochloropsis oculata is one more rich source of DHA and EPA (Nuño et al., 2013). Furthermore, Aurantiochytrium limacinum (A. Limacinum), a thraustochytrid strain, is considered an ideal source of DHA constituting 1.43%–29.6% of total FAs (Sirirak et al., 2020) where the composition of FAs is generally determined as fatty acids methyl esters (FAMEs) using Gas Chromatography coupled with Flame Ionisation Detection (GC-FID) (Ichihara and Fukubayashi, 2010).
While GC-FID approach was extensively applied for FAs profiling in microalgae (Visudtiphole et al., 2021; Dillon et al., 2019; Jarle Horn and Klüver, 2025), the combination of the GC power with the sensitivity of Isotope Ratio Mass Spectrometry (IRMS) was recently introduced to microalgal systems, through analysis of stable isotope ratios (carbon-13, hydrogen-2, etc.) of individual molecules. This approach is known as Compound-Specific Isotope Analysis (CSIA) (Pilecky et al., 2021; Xin et al., 2024). In CSIA, the isotopic composition is expressed as δ13C values, which denote the ratio of 13C–12C in a sample relative to a standard (Mašalaitė et al., 2012). Indeed, δ13C-based metabolic tracing is a prevailing approach used to investigate lipids’ biosynthesis in microalgae through following the stream of 13C-labeled carbon in metabolic pathways (Twining et al., 2020; Remize et al., 2022). Through analysis of δ13C values of diverse lipids, researchers can identify the active metabolic pathways in lipid biosynthesis (Zhang and Liu, 2021) and how fast carbon flows via these pathways (Xin et al., 2024; Meier-Augenstein, 2002; Rhee et al., 1997).
Despite the application of CSIA in microalgal systems, no fundamental research was conducted till day on the application of Gas Chromatography-Combustion-Isotope Ratio Mass Spectrometry (GC-C-IRMS) for CSIA at natural abundance levels mainly in relation to DHA biosynthesis and metabolic flux changes between growth phases in A. limacinum. Hence, the objective of the present study was to first optimize the culture of A. limacinum and investigate the FAs profiling through GC-FID. Then, we developed a novel CSIA approach to estimate δ13C values at natural abundance level in FAs produced using GC-C-IRMS.
2 Materials
2.1 Chemicals
Solvents including hexane, methanol, and chloroform were purchased from Honeywell (USA). Sodium chloride, glucose, yeast extract, and boron trifluoride (methanol solution, 14% in methanol) were obtained from Sigma-Aldrich (USA). Peptone was brought from HiMedia (India), and the antibiotics, including ampicillin, kanamycin monosulfate salt, and streptomycin sulfate, were obtained from Glentham (UK). Isooctane and sulfuric acid were purchased from Supelco (USA), toluene from Fisher Chemical (USA), and potassium carbonate from ACS Reagents (USA). Vitamin E was obtained from Ambeed (USA).
2.2 Instrumentation
An orbital shaker from Kethink (China) was used for cell cultivation, and cell counting was performed using a microscope from Celestron (USA). Optical density measurements were performed using a UV-Visible spectrophotometer from ThermoFischer Scientific (USA). Glucose concentration was quantified using a High-Performance Liquid Chromatography (HPLC) system from Waters Alliance 2,695 (USA). For biomass and lipids collection, a centrifuge from Electrical (China), a 4.5 L Cascade Benchtop freeze-drying system from Labconco (USA), a Reacti-Therm heating and stirring model from ThermoFischer Scientific (USA), a microwave from Black and Decker (USA) and a digital ultrasonic cleaner from Daihan (South Korea) were used. Gas Chromatography with Flame Ionization Detector (GC-FID) from Agilent Technologies 7890B GC System (USA) and Gas Chromatography-Combustion-Isotope Ratio Mass Spectrometry (GC-C-IRMS) from ThermoFischer Scientific (Germany) were used for FAs profiling and CSIA, respectively.
3 Methods
3.1 Culture of Aurantiochytrium limacinum
Aurantiochytrium limacinum (A. limacinum) ATCC MYA-1381 cells, designated as strain SR21 and deposited as Schizochytrium limacinum Honda et Yokochi, were obtained from American Type Culture Collection (ATCC). The cells were grown in ATCC-790 medium containing 5 g glucose, 1 g peptone and 1 g yeast extract in 1 L of filtered seawater collected from the Persian Gulf in Abu Dhabi, UAE. The culture medium was supplied with 100 mg/L of ampicillin, kanamycin and streptomycin. 275 μL of the cryopreserved A. limacinum ATCC MYA-1381 cells were added into 500 mL flasks containing 200 mL of the culture medium. Cultures were incubated at 150 rpm in a shaker maintained at 25°C until the cells reached an exponential and stationary phase. All experiments were carried out in triplicates.
3.2 Growth parameters
2 mL of culture was collected daily for measuring three different parameters: (i) optical density of the cells, (ii) cell count and (iii) glucose concentration in the culture medium.
3.2.1 Optical density of the cells
Cell growth was monitored daily through measurement of the optical density. 1 mL of the culture was collected from each flask and the optical density was measured at 660 nm (OD660) using a UV-Vis spectrophotometer (Chodchoey and Verduyn, 2012).
3.2.2 Cell count
Cell counting was performed using a hemocytometer and a Celestron LCD Digital Microscope. Briefly, 90 µL of the culture was mixed with 10 µL of ethanol. 6 μL of the mixture was loaded onto the hemocytometer and the number of cells were counted manually. The final cell count was calculated using Equation 1.
3.2.3 Glucose dosage in culture medium through high performance liquid chromatography
To monitor glucose consumption and determine the exponential and stationary phases, glucose levels in the culture medium were measured using HPLC. 1mL of the culture medium was filtered using a 0.22 µm filter and the filtrate was used to estimate the residual glucose concentration using an Aminex HPX-87H Column (300 × 7.8 mm, Bio-Rad, USA) as a stationary phase and 5 mM H2SO4 as a mobile phase. The column temperature was maintained at 30°C and the flow rate was set 0.6 mL per minute. On day 0, 1 mL of the culture medium was collected to measure the initial glucose concentration. A calibration curve was prepared using glucose standards in the range of 0.5–6 g/L (R2 = 0.98).
3.3 Cell harvesting
Based on glucose measurements, once glucose became limiting, we identified the exponential and stationary phases and interrupted the cultures to collect the biomass followed by extraction of lipids. Cultures were harvested by centrifugation at 450 g for 10 min at 4°C. The cell pellets were collected, lyophilized, weighed and stored at −20°C for further analysis.
3.4 Lipid extraction
Lyophilized biomass was used for the extraction of lipids using microwave-assisted extraction (MAE), a green extraction technique. For MAE approach, 9% sodium chloride (NaCl) was added to the biomass to get 5% (w/v) solid following standard method (Zghaibi et al., 2019). 500 W of power (low-medium setting) was applied in short pulses (20 s ‘on’ followed by 20 s of immediate ice cooling) over a total of 5 min to prevent thermal degradation of lipids. This pulsed mode of heating was chosen to maintain lipid integrity while ensuring efficient cell wall disruption. Following the extraction, 5 mL of hexane was added to recover the extracted lipids into non-polar organic phase. The mixture was centrifuged at 450 g for 5 min and the organic phase was collected and evaporated under nitrogen stream. The dried samples were stored at −20°C.
3.5 FAME production
To determine the FA composition of lipids extracted from A. limacinum, we produced the methyl esters of fatty acids (FAME) for GC-FID analysis (Iverson and Sheppard, 1965). The saponification followed by methylation is a conventional technique for preparation of FAMEs (Ackman, 1998). FAMEs were produced according to a modified AOAC 969.33 method with toluene/methanol (2:3, v/v) and BF3/methanol (14%) where BF3 is a catalyst for methylation and methanolysis (Ackman, 1998). The mixture was heated at 100°C for 90 min. The reaction was stopped by immersing the tubes in ice and 10% of potassium carbonate (K2CO3) and isooctane were added. Following, the mixture was centrifuged at 450 g, 5 min, 4°C and the organic phase containing FAMEs was recovered. The solvent was evaporated under nitrogen and FAMEs were stored at −20°C until analysis.
3.6 Gas chromatography-flame ionisation detection (GC-FID) analysis
For FAs profiling and quantification, we conducted a GC-FID analysis. The system consists of an Agilent 7890B GC-FID with Rt-2560 GC Capillary Column (100 m × 0.25 mm x 0.20 µm) purchased from Restek. The carrier gas was helium at a constant flow of 2 mL/min. The FID was set at 280°C, with a gas flow of 350, 35, and 30 mL/min of synthetic air, hydrogen, and helium, respectively. The injected sample volume was 1 μL. A series of blank (Hexane, HPLC grade) and 37 FAME standard mix procured from Restek were prepared in GC vials and measured in parallel to the samples to qualitatively identify and quantify each FA in the total FAs extracted per sample. Initially, the column temperature was set at 80°C and held for 10 min. Following, the temperature was increased at the rate of 7 °C/min until it reached 170°C, where it was maintained for 10 min. Another temperature increase was set at 12 °C/min to 205°C, followed by a 20 min hold and 20 °C/min until reaching 220°C, with a hold for 15 min. Lastly, the temperature was increased at 15 °C/min to 230°C and maintained for 20 min.
3.7 Gas chromatography isotope ratio mass spectrometry (GC-IRMS) analysis
3.7.1 13C isotopic analysis of FAMEs
Compound Specific Isotopic Analysis CSIA of prepared FAMEs from A. limacinum was conducted using a Gas Chromatography-Combustion-Isotope Ratio Mass Spectrometry GC-C-IRMS, DELTA™ Q Isotope Ratio Mass Spectrometer from Thermo Fischer Scientific. FAMEs (1 µL) were injected in a spitless operating mode with a TriPlus RSH autosampler (Thermo Scientific, Bremen, Germany) onto a SP®-2560 Capillary GC Column L × I.D. 100 m × 0.25 mm (Supelco) fixed in a Trace 1310 GC (Thermo Fischer Scientific). In order to reach a suitable signal, all samples were prepared at 100 ng of FAMEs per 1 µL of hexane. A standard of 37 Food Industry FAME Mix, procured from Restek was analysed applying the same protocol followed for all samples, allowing to identify individually each FAME.
Complete baseline separation of diverse FA from surrounding peaks was accomplished by the subsequent temperature ramp: initial temperature of 100°C held for 4 min, increasing to 200 °C at 25°C/min and held for 8 min, then to 250°C at 5°C/min and held for 6 min. The total run per sample was 33 min. Separate FAMEs eluting off the column were directed by He carrier gas to a GC IsoLink II interface functioning at 1,000°C with a Ni, CuO and Pt combustion reactor set at 1,000°C (Thermo Fisher Scientific, Bremen, Germany). FAMEs entering the combustion reactor were quantitatively combusted to CO2 and water. Water formed was trapped by a Nafion® dryer (DuPont, Wilmington, DE) and only CO2 was introduced into the Delta V Plus IRMS (Thermo Scientific) via a ConFlo IV Universal Interface (Thermo Scientific) with continuous flow interface. Electron ionization voltage was 77 eV, electron current was 1.5 mA, and 3 F cup collectors for m/z 44, 45, and 46 were used for detection of CO2.
3.7.2 Isotopic normalization
Carbon isotopic data collected by IRMS were normalized and described as per mil (‰; 1‰ = 0.001 = 1 millurey or mUr). Isotope ratios were calibrated against reference CO2 of known isotopic composition introduced directly into the ion source eight times at the beginning and three times at the end of every run following below conditions for continuous flow CO2 (Figure 1). Raw δ13C isotopic values obtained relative to the CO2 working gas from GC-IRMS analysis, were converted to the international carbon isotope reference scale, Vienna Peedee Belemnite (VPDB), by multi-point linear normalization (Coplen et al., 2006). USGS certified FAME reference materials (USGS70, USGS71, and USGS72) were injected every five samples throughout each analytical sequence. Each standard was injected at least three times per sequence, including at the beginning, midpoint, and end of the run. Multi-point linear normalization was applied based on the known δ13C values of the standards, with R2 values exceeding 0.999, ensuring high analytical precision. Linear regression of measured values versus true one (−30.5‰ ± 0.04‰, −10.5‰ ± 0.03‰, and −1.5‰ ± 0.03‰ for USGS70, USGS71, and USGS72, respectively) generated a normalizing equation, which was subsequently applied to report true δ13C values for all data (Figure 2).
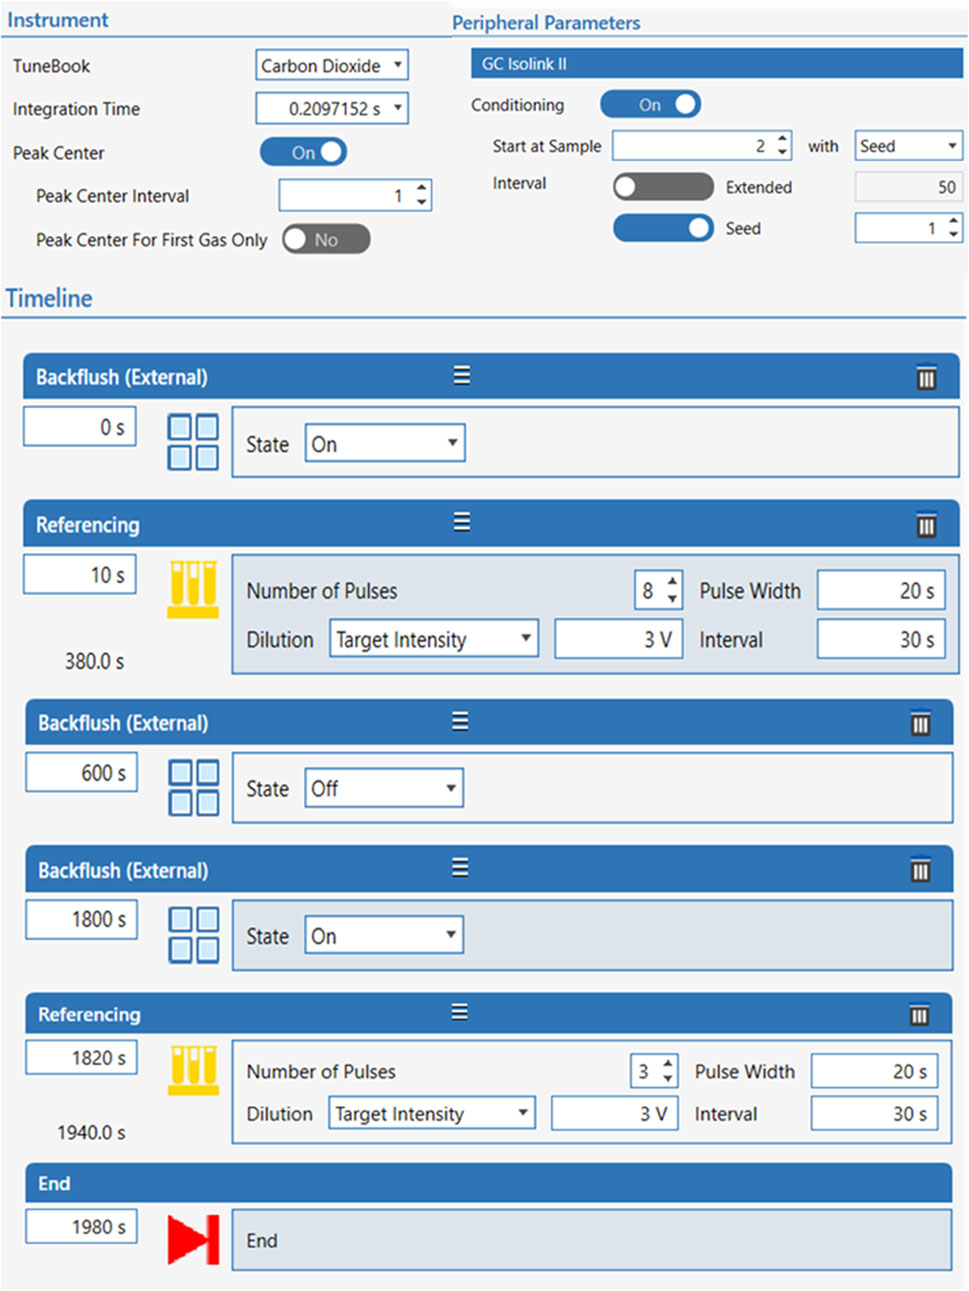
Figure 1. Conditions of CO2 continuous flow for isotope ratios calibration.
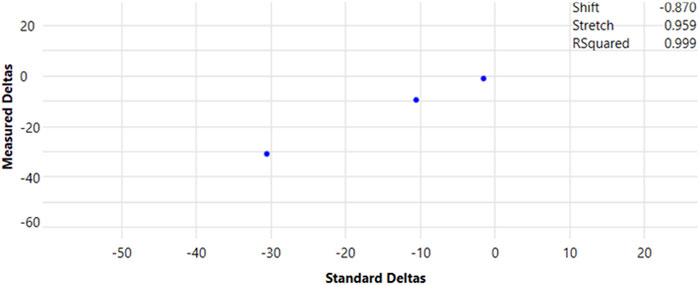
Figure 2. Multipoint normalization curve for the reporting of true δ13C values for GC-IRMS data. FAME (20-carbon) certified reference materials, USGS70, USGS71, and USGS72, were injected periodically during each programmed sequence, totalling at least three injections per run.
4 Results
4.1 Growth parameters
4.1.1 Optical density of cells
Aurantiochytrium limacinum ATCC MYA-1381 cell growth was monitored daily by measuring OD660. As illustrated in Figure 3, cells harvested on day 2, at exponential phase reported an OD660 of 0.3 ± 0.03. At stationary phase, on day 7, OD660 of the cells was 1.1 ± 0.6.
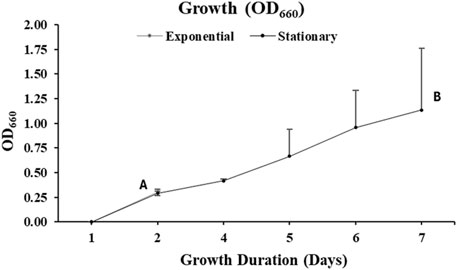
Figure 3. Cellular absorbance measured by UV-Visible Spectrophotometry at wavelength of 660 nm of the culture of Aurantiochytrium limacinum ATCC MYA-1381 in 200 mL of medium under control condition 12C-glucose. (A) Exponential phase culture (B) Stationary phase culture. Values are expressed as means+/-SD (n = 3).
4.1.2 Cells counts
As illustrated in Figure 4, for the cultures harvested at an exponential phase, the cell number was 5.53 × 10⁶ per ml of the culture whereas at stationary phase, the cell number was 5.35 × 10¹⁰ per ml of culture.
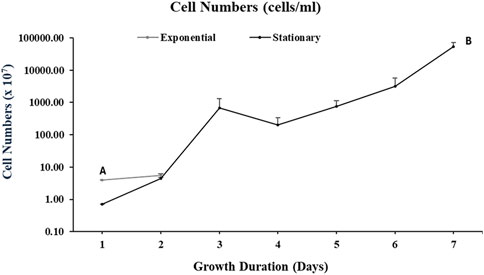
Figure 4. Cell counts of Aurantiochytrium limacinum ATCC MYA-1381 in 200 mL of medium under control condition 12C-glucose. (A) Exponential phase culture (B) Stationary phase culture. Values are expressed as means+/-SD (n = 3)
4.1.3 Glucose dosage in culture medium using high performance liquid chromatography
Figure 5 shows glucose consumed by A. limacinum ATCC MYA-1381 cells on harvesting day (Day 2 for exponential and Day 7 for stationary phase). The cells harvested at the exponential phase consumed 5.5% ± 1.5% of glucose, while those harvested at the stationary phase consumed 51% ± 18% of glucose.
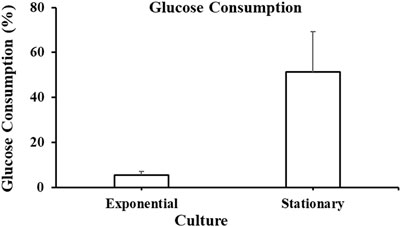
Figure 5. Glucose consumption at exponential and stationary phase cultures of Aurantiochytrium limacinum ATCC MYA-1381 on the day of harvesting. Values are expressed as means+/-SD (n = 3).
4.2 Biomass collection and lipids extraction
Biomass produced from A. limacinum ATCC MYA-1381 cells is represented in Figure 6. At exponential phase, the biomass collected was 72 ± 9 mg whereas at stationary phase, the biomass production was 197 ± 37 mg after 7 days of cultivation. Total lipids at exponential and stationary phases were 11.8 mg and 102 mg, respectively.
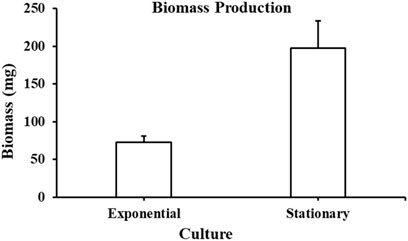
Figure 6. Biomass collected from Aurantiochytrium limacinum ATCC MYA-1381 at exponential and stationary phase cultures. Values are expressed as means+/-SD (n = 3).
4.3 GC-FID analysis
Following total lipid extraction and FAMEs production, we performed a GC-FID analysis and calculated the percentage of individual FAs. For A. limacinum cultures harvested at an exponential phase (Figure 7A), two major FAs were identified. DHA was the most abundant with 65.5% ± 1.1% of total FAs followed by palmitic acid (C16:0) with 34.4% ± 0.1%. At stationary phase (Figure 7B), Docosapentaenoic acid (DPA, C22:5n-3) and DHA were the most abundant FAs with 45% ± 7% and 33.9% ± 0.1%, respectively. Additionally, myristic acid (C14:0), myristoleic acid (C14:1n-9), C16:0 were observed at 4.6% ± 0.8%, 6.2% ± 0.1% and 9.8% ± 0.1%, respectively.
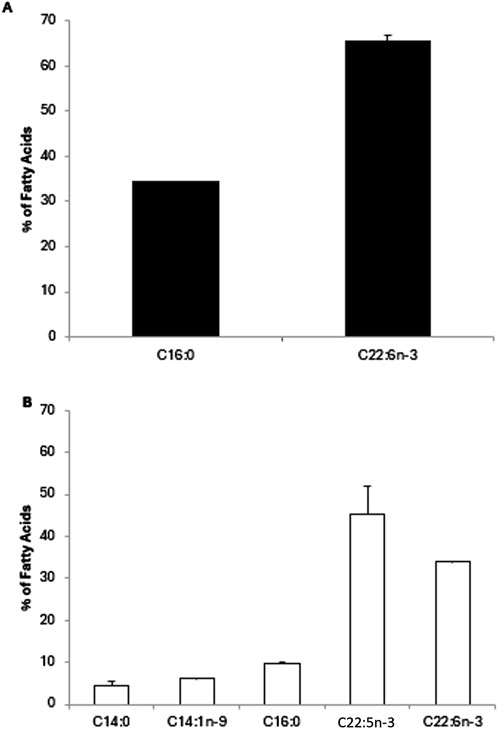
Figure 7. Fatty acid composition of Aurantiochytrium limacinum ATCC MYA-1381 in 200 mL of culture medium under control conditions at exponential (A) and stationary phase (B) using GC-FID analysis. Results are expressed as percentage of FA and expressed as means+/-SD (n = 3).
4.4 GC-IRMS analysis
4.4.1 Isotopic signatures of reference materials USGS70, USGS71 and USGS72
IRMS is a powerful technique to quantify variations in the isotopic composition of several elements including carbon. An approach that has proven successful is to measure the 13C-enrichment level. Differences in 13C-enrichment level are expressed using the delta notation shown below in Equation 2:
where R is the ratio of the number of atoms of the minor isotope to that of the major isotope (Brand and Coplen, 2012).
To compare isotope enrichment levels, a standard reference material (RM) is used. For all RM (USGS70, USGS71, USGS72), in addition to the chromatogram showing the intensity (V) versus retention time (min), we plotted the isotopic swing S shape versus time (min) (Figure 8). Since all RM had the same composition which is icosanoic acid methyl esters (C20H39O2CH3), we identified their retention time of 19.5 min. Furthermore, we noticed excellent profiles of isotopic swing as well as good resolution for CO2 measurements.
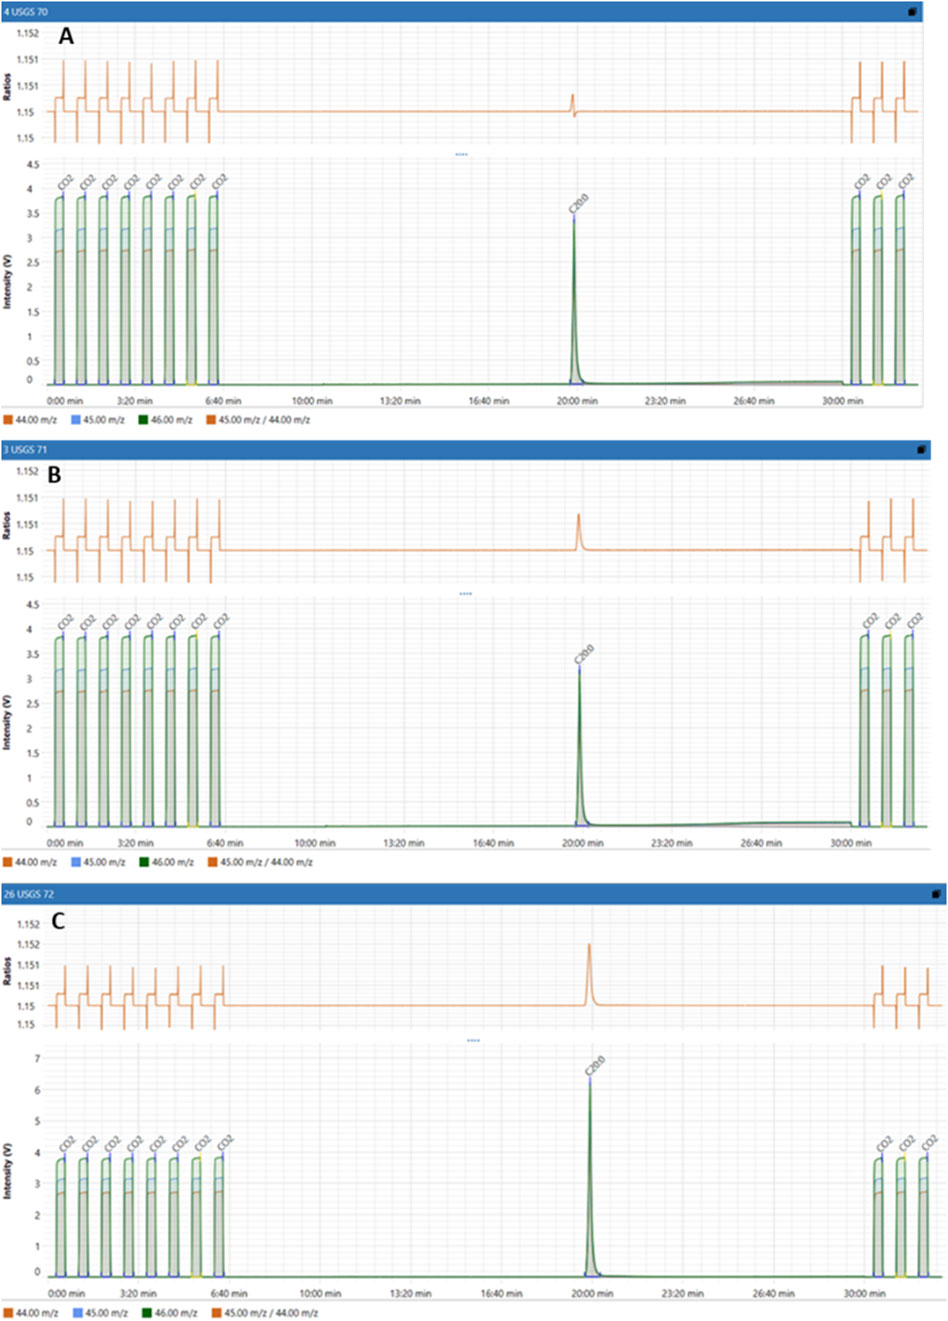
Figure 8. Isotopic signatures of Reference Materials: (A) USGS70, (B) USGS71 and (C) USGS72.
4.4.2 Isotopic signatures of FAME produced from Aurantiochytrium limacinum at exponential and stationary phase
As previously explained, CSIA of FAMEs produced from microalgae was conducted using GC-C-IRMS where we measured the isotopic C13 signature of each FA, expressed as δ13C (‰). At exponential phase, C16:0 and DHA were identified in comparison to standards with retention time of 15.3 and 28.4 min, respectively (Figure 9A). At stationary phase, in addition to C16:0 and DHA, three FAs were eluted at 14.1, 14.5 and 27 min which were identified as C14:0, C14:1n-9 and C22:5n-3, respectively (Figure 9B). δ13C signature of each FAME was quantified and results show that all FAMEs produced at different growth stages had negative δ13C values (Figure 10). This means that FAMEs were depleted in 13C, which is normal since the cells were cultivated in the presence of 12C-glucose and not 13C-glucose. As shown in Figure 10, δ13C (‰) of C16:0 and DHA at exponential phase were −16.8 ± 0.2 and −18.5‰ ± 0.1‰, respectively, At stationary phase, δ13C (‰) of C14:0, C14:1n-9, C16:0, C22:5n-3 and DHA were −10.6 ± 1.1, −11.3 ± 0.1, −11.1 ± 0.2, −8.3 ± 0.2 and −10.6‰ ± 0.1‰. respectively.
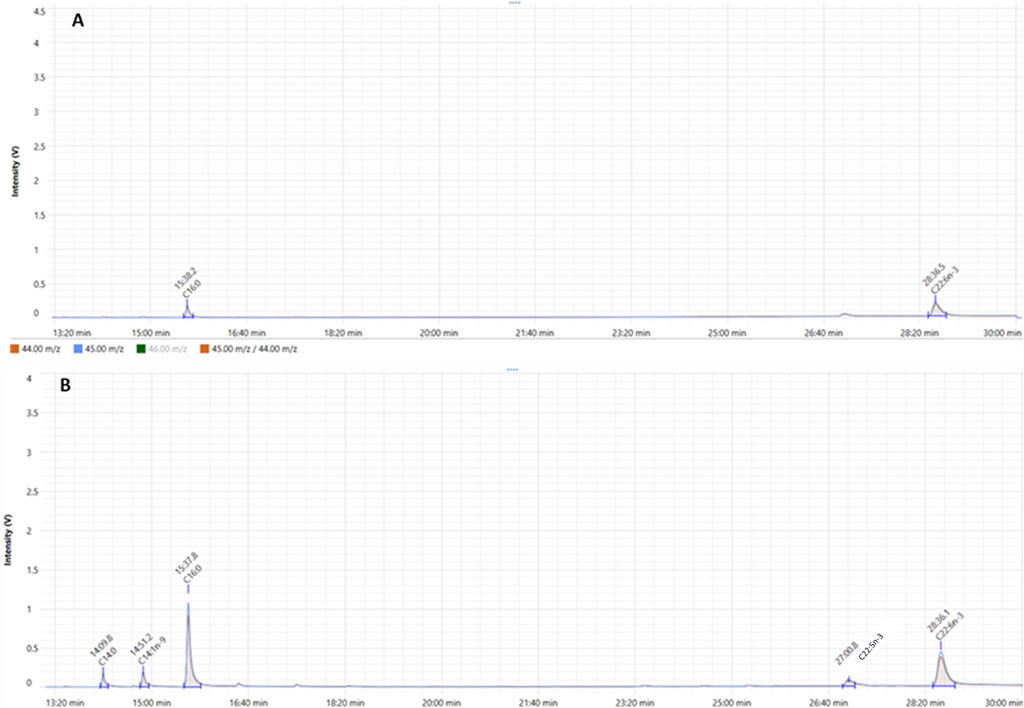
Figure 9. GC-IRMS analysis of FAMEs derived from total lipid extracted from Aurantiochytrium limacinum at exponential phase (A) and stationary phase (B). The orange plot shows the signal ratio for m/z 45/44. The blue plot shows the signal for m/z 45 for the duration of the IRMS run.
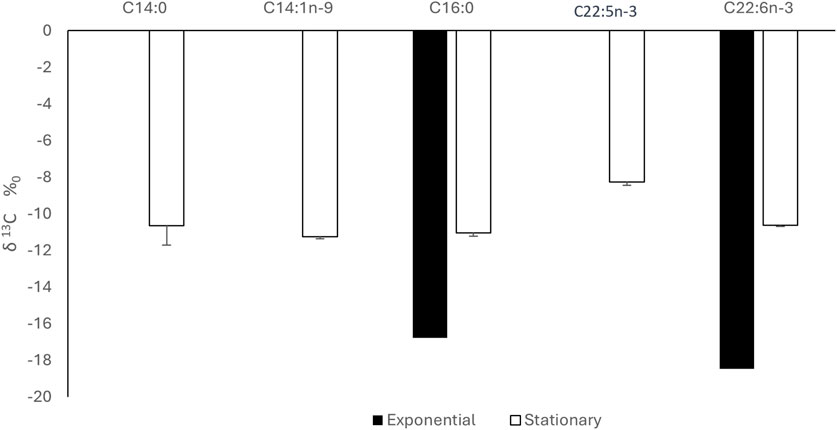
Figure 10. δ13C signature of FAME at exponential and stationary phase using GC-C-IRMS analysis. Results are expressed as percentage of FA and expressed as means+/-SD (n = 3).
5 Discussion
The life cycles of thraustochytrids are extremely reliant on nutrition. When cultivated in artificial media comprising yeast extract or peptone, thraustochytrids can accumulate great quantities of biomass and lipids, making them very attractive for biotechnological applications (Dellero et al., 2018). It is well recognised that lipid production is influenced by the composition of the culture media and differs with the life cycle. Such fluctuations are associated with significant environmental/cultivation restrictions including the C:N ratio. Certainly, a carbon source is mandatory for these heterotrophic cells to produce FAs and lipids. This carbon source can be assumed through glucose or glycerol addition to the culture media. The FA compositions of several thraustochytrid types have been investigated in order to evaluate their content in terms of several PUFAs mainly DHA. Diverse culture environments (changing the source of carbon, oxygen concentration, salinity, temperature, nitrogen accessibility, etc.) were tested to determine the effect of the culture medium on FAs’ production and unsaturation (Zhu et al., 2007). Previous researchers have showed that thraustochytrid types produced mainly C16:0 and DHA, the latter varying from one species to another. The genera Aurantiochytrium, and Schizochytrium were the most productive of DHA (Fossier Marchan et al., 2018). Certainly, the medium composition is an important parameter, the presence of glucose or glycerol as a carbon source and yeast extract or peptone as a nitrogen source allowing the highest yield (Aasen et al., 2016).
In the present study, A. limacinum cells were grown on glucose with a natural carbon isotope abundance in the presence of peptone, yeast extract as a nitrogen source allowing the highest yield and sea water collected from Persian Gulf. To avoid bacterial proliferation, three different antibiotics were added to the culture medium. All experiments were conducted in biological triplicates. Within 2 days of cultivation, the cell count was 5.53 × 10⁶ per ml of the culture, whereas, after 7 days, the cell count increased by a factor of 104 and reached 5.35 × 10¹⁰ per ml of the culture. No bacterial growth or contamination were observed during the full culture’s period.
Glucose decreased in the culture medium to 51% ± 18% on day 7. We could have increased the cultivation duration to 9 or 10 days, but it could be risky mainly related to bacterial proliferation and death of cells. The carbon conversion yield, defined as the amount of biomass produced per Gram of substrate consumed, was 0.08 g biomass/g glucose. This fairly low conversion yield is steady with literature values for Aurantiochytrium strains with comparable heterotrophic cultivation, where an important fraction of carbon is oriented toward lipid accumulation (especially PUFAs) rather than biomass. Moreover, some carbon may be missed as CO2 as a result of respiratory metabolism or diverted into non-biomass cellular components including extracellular polysaccharides or secondary metabolites. Furthermore, the high standard deviation observed in glucose consumption might represent natural biological variability among different cultures. During the stationary phase, this could reflect metabolic heterogeneity in response to nutrients in A. limacinum influencing glucose consumption and lipid biosynthesis.
A good quantity of biomass was collected with 72 ± 8 mg and 197 ± 36 mg on day 2 and day 7 of cultivation, respectively. Total lipids produced were around 16% and 52% on day 2 and day 7 of cultivation, respectively and these results aligned well with other researchers who reported that A. limacinum typically accumulates lipids up 30%–60% of its dry weight lipids at stationary phase (Hoshino et al., 2016). From the FAs profiling, we observed that at an exponential phase, DHA was the most copious FAs with 65.6% of total FAs followed by C16:0 with 34.4%. However, at the stationary phase, DPA and DHA were the most abundant FAs with 45.4% and 33.9%, respectively. Furthermore, C14:0, C14:1n-9, C16:0 were 4.6%, 6.2% and 9.9%, respectively. Indeed, the pragmatic decline in DHA abundance from 65.6% in the exponential phase to 33.9% in the stationary phase might be an indicative of a metabolic flux redirection, probably related to the physiological transition of A. limacinum from active growth to lipids’ accumulation. Throughout the exponential phase, cells prioritize membrane lipid biosynthesis and speedy proliferation (Soto-Sánchez et al., 2023), with high DHA level playing a fundamental structural role in PL-rich cellular membranes. Contrarily, during the stationary phase, the metabolic focus moves toward the accretion of storage lipids mainly triacylglycerols (TAGs), less enhanced in DHA and more connected to saturated and monounsaturated FAs. This metabolic rerouting might decrease the flux toward PUFA biosynthesis, counting DHA, thus dropping its proportion in total FAs pool. These findings are aligned with those in the literature showing that, when thraustochytrids including Aurantiochytrium and Schizochytrium are grown up in suitable environments, they can accumulate DHA with almost around half of the total FAs (Coplen et al., 2006; Brand and Coplen, 2012).
When investigating the CSIA using GC-C-IRMS at 13C natural abundance level in FAs, we found that δ13C signature of all FAME were negative suggesting that FAME were depleted in 13C since the cells were grown on 12C-glucose and not 13C. Indeed, for negative values of δ13C, the carbon isotope fractionation often happens in the process of fatty acids biosynthesis, and more 12C is used. Thus, providing a lower δ13C (Kelleway et al., 2018). The δ13C (‰) of C16:0 and DHA were −16.8 ± 0.2 and −18.5‰ ± 0.1‰, respectively, at the exponential phase while at the stationary phase, δ13C (‰) of C14:0, C14:1n-9, C16:0, C22:5n-3 and DHA were −10.6 ± 1.1, −11.3 ± 0.1, −11.1 ± 0.2, −8.3 ± 0.2 and −10.6‰ ± 0.1‰. respectively.
Notably, the exponential phase displays more negative δ13C values for DHA at −18.5‰ compared to the isotopic enrichment of DHA in the stationary phase with −10.6‰, reflecting a further direct and effective accommodation of 12C-rich glucose via central carbon metabolism and suggesting a shift in carbon source utilization or carbon allocation efficiency between growth phases. As glucose concentration decrease in the culture medium, cells might use internal carbon reserves or alternatives, which have a tendency to be comparatively 13C-enriched. Moreover, the recycling of intracellular carbon via anaplerotic paths or the improved involvement of endogenous CO2 fixation may decrease isotope fractionation, ensuing less negative δ13C values (Bowling et al., 2008). Together, these results support the hypothesis that carbon flux redirection and nutrient-driven metabolic remodeling meaningfully impact both FAs profiles and their isotopic signatures throughout diverse growth phases (Kobayashi et al., 2020; Mang Gao, 2013; D.H. et al., 1998).
During the stationary phase, the δ13C value of DPA was remarkably less negative (−8.3‰) compared to DHA (−10.6‰). This isotopic enrichment in DPA may reflect underlying variances in metabolic pathways and enzyme activity during FA biosynthesis. Additionally, DPA and DHA biosynthesis in A. limacinum likely proceeds via the polyketide synthase (PKS)-like pathway or the elongase/desaturase pathway. In the latter case, DHA is naturally derived from DPA via a Δ4 desaturase enzyme, and DPA in turn is synthesized from eicosatetraenoic acid (ETA) or arachidonic acid through elongation and Δ6 desaturation. The less negative δ13C of DPA may consequently indicate that it serves as an intermediate pool which accumulates during the stationary phase, possibly due to reduced Δ4 desaturase activity or altered enzyme kinetics under nutrient-depleted conditions. Furthermore, this isotopic pattern might be linked to carbon source allocation preferences and fractionation effects. The carbon flux during the stationary phase is likely redirected toward energy storage and structural lipid synthesis, with selective incorporation of isotopically heavier carbon (13C-enriched) into certain intermediates like DPA. This could occur due to kinetic isotope effects in elongase or desaturase enzymes or due to precursor channeling dynamics where isotopically lighter carbon is preferentially routed to DHA synthesis or other metabolic sinks.
Furthermore, at stationary phase, the higher standard deviation detected for the δ13C value of C14:0 (±1.1‰) is steady with its lower relative abundance and better sensitivity to slight shifts in precursor accessibility or enzymatic turnover. Since C14:0 is a trivial FA in the stationary phase, minor variations in its biosynthesis might lead to amplified isotopic variance. Thus, these differential δ13C signatures provide insight into the dynamic regulation of PUFA biosynthesis under varying physiological conditions and supports the utility of GC-C-IRMS in elucidating pathway-level isotope fractionation.
The newly developed CSIA method can be applied in the context of several studies focusing on targeting the brain with PUFAs, especially DHA to estimate the 13C natural abundance level in FAs. To purify different FAs including DHA produced from A. limacinum, several approaches could be applied including solid phase extraction (SPE) as well as HPLC. The purified PUFAs including DPA and DHA can have several beneficial applications mainly in nutrition and health sectors.
6 Conclusion
Aurantiochytrium limacinum can be considered as a sustainable and biotechnological source for DHA production for medical applications. The newly developed CSIA at natural abundance levels in microalgal systems could allow a better understanding of the dynamic regulation of PUFA biosynthesis as well as the metabolic flux discrepancies between growth phases supporting the significance of GC-C-IRMS in explicating pathway-level isotope fractionation.
Data availability statement
The original contributions presented in the study are included in the article/supplementary material, further inquiries can be directed to the corresponding author.
Author contributions
AD: Investigation, Formal Analysis, Writing – original draft. KC: Writing – original draft, Formal Analysis, Investigation. AA: Formal Analysis, Writing – review and editing. MA: Investigation, Writing – original draft. MR: Writing – original draft, Investigation, Formal Analysis. MH: Funding acquisition, Project administration, Formal Analysis, Supervision, Writing – review and editing, Investigation, Conceptualization.
Funding
The author(s) declare that financial support was received for the research and/or publication of this article. This work was supported by internal Fundings awarded to Mayssa Hachem RIG8474000575, at Khalifa University of Sciences and Technology, UAE.
Conflict of interest
The authors declare that the research was conducted in the absence of any commercial or financial relationships that could be construed as a potential conflict of interest.
Generative AI statement
The author(s) declare that no Generative AI was used in the creation of this manuscript.
Publisher’s note
All claims expressed in this article are solely those of the authors and do not necessarily represent those of their affiliated organizations, or those of the publisher, the editors and the reviewers. Any product that may be evaluated in this article, or claim that may be made by its manufacturer, is not guaranteed or endorsed by the publisher.
References
Aasen, I. M., Ertesvåg, H., Heggeset, T. M. B., Liu, B., Brautaset, T., Vadstein, O., et al. (2016). Thraustochytrids as production organisms for docosahexaenoic acid (DHA), squalene, and carotenoids. Appl. Microbiol. Biotechnol. 100, 4309–4321. doi:10.1007/s00253-016-7498-4
Ackman, R. G. (1998). Remarks on official methods employing BoronTrifluoride in the preparation of methyl estersof the fatty acids of fish oils. J. Am. Oil Chem. Soc. 75, 541–545. doi:10.1007/s11746-998-0263-9
Avila-Roman, J., Garda-Gil, S., Rodriguez-Luna, A., Motilva, V., and Talero, E. (2021). Anti-inflammatory and anticancer effects of microalgal carotenoids. Mar. Drugs 19, 531. doi:10.3390/md19100531
Belkouch, M., Hachem, M., Elgot, A., Lo Van, A., Picq, M., Guichardant, M., et al. (2016). The pleiotropic effects of omega-3 docosahexaenoic acid on the hallmarks of Alzheimer’s disease. J. Nutr. Biochem. 38, 1–11. doi:10.1016/j.jnutbio.2016.03.002
Bowling, D. R., Pataki, D. E., and Randerson, J. T. (2008). Carbon isotopes in terrestrial ecosystem pools and CO2 fluxes. New Phytol. 178, 24–40. doi:10.1111/j.1469-8137.2007.02342.x
Brand, W. A., and Coplen, T. B. (2012). Stable isotope deltas: tiny, yet robust signatures in nature. Isot. Environ. Health Stud. 48, 393–409. doi:10.1080/10256016.2012.666977
Cardozo, K. H. M., Guaratini, T., Barros, M. P., Falcão, V. R., Tonon, A. P., Lopes, N. P., et al. (2007). Metabolites from algae with economical impact. Comp. Biochem. Physiology - C Toxicol. Pharmacol. 146, 60–78. doi:10.1016/j.cbpc.2006.05.007
Chodchoey, K., and Verduyn, C. (2012). Growth, fatty acid profile in major lipid classes and lipid fluidity of Aurantiochytrium mangrovei Sk-02 as a function of growth temperature. Braz. J. Microbiol. 43, 187–200. doi:10.1590/s1517-83822012000100020
Coplen, T. B., Brand, W. A., Gehre, M., Gröning, M., Meijer, H. A. J., Toman, B., et al. (2006). After two decades a second anchor for the VPDB δ13C scale. Rapid Commun. Mass Spectrom. 20, 3165–3166. doi:10.1002/rcm.2727
Dellero, Y., Rose, S., Metton, C., Morabito, C., Lupette, J., Jouhet, J., et al. (2018). Ecophysiology and lipid dynamics of a eukaryotic mangrove decomposer. Environ. Microbiol. 20, 3057–3068. doi:10.1111/1462-2920.14346
D.H., T.H., Yokochi, T. N. T., Higashihara, T., and Nakahara, T. (1998). Optimization of docosahexaenoic acid production by Schizochytrium limacinum SR21. Appl. Microbiol. Biotechnol. 49, 72–76. doi:10.1007/s002530051139
Dillon, G. P., Yiannikouris, A., Brandl, W., Cardinall, C., Yuan, W., and Moran, C. A. (2019). Analytical method assessment for the determination of DHA and fatty acids present in unextracted Aurantiochytrium limacinum biomass. Food Nutr. Sci. 10, 469–483. doi:10.4236/fns.2019.104035
Fossier Marchan, L., Lee Chang, K. J., Nichols, P. D., Mitchell, W. J., Polglase, J. L., and Gutierrez, T. (2018). Taxonomy, ecology and biotechnological applications of thraustochytrids: a review. Biotechnol. Adv. 36, 26–46. doi:10.1016/j.biotechadv.2017.09.003
Hachem, M., Belkouch, M., Lo Van, A., Picq, M., Bernoud-Hubac, N., and Lagarde, M. (2020). Brain targeting with docosahexaenoic acid as a prospective therapy for neurodegenerative diseases and its passage across blood brain barrier. Biochimie 170, 203–211. doi:10.1016/j.biochi.2020.01.013
Hachem, M., Géloën, A., Lo Van, A., Foumaux, B., Fenart, L., Gosselet, F., et al. (2016). Efficient docosahexaenoic acid uptake by the brain from a structured phospholipid. Mol. Neurobiol. 53, 3205–3215. doi:10.1007/s12035-015-9228-9
Hachem, M., and Nacir, H. (2022). Emerging role of phospholipids and lysophospholipids for improving brain docosahexaenoic acid as potential preventive and therapeutic strategies for neurological diseases. Int. J. Mol. Sci. 23, 3969. doi:10.3390/ijms23073969
Hoshino, R., Murakami, K., Machmudah, S., Okita, Y., Ohashi, E., Kanda, H., et al. (2016). Economical wet extraction of lipid from labyrinthula Aurantiochytrium limacinum by using liquefied dimethyl ether. Eng. J. 20, 145–153. doi:10.4186/ej.2016.20.4.145
Hou, J., and Cui, H. L. (2018). In Vitro antioxidant, antihemolytic, and anticancer activity of the carotenoids from halophilic archaea. Curr. Microbiol. 75, 266–271. doi:10.1007/s00284-017-1374-z
Ichihara, K., and Fukubayashi, Y. (2010). Preparation of fatty acid methyl esters for gas-liquid chromatography. J. Lipid Res. 51, 635–640. doi:10.1194/jlr.D001065
Iverson, J. L., and Sheppard, A. J. (1965). Programmed temperature gas chromatographic analysis of esters of fatty acids. J. Chromatogr. Sci. 13, 505–508. doi:10.1093/chromsci/13.10.505
Jarle Horn, S., and Klüver, M. (2025). Production of DHA-Rich oil by Aurantiochytrium limacinum on lignocellulosic sugars and crude glycerol
Kelleway, J. J., Mazumder, D., Baldock, J. A., and Saintilan, N. (2018). Carbon isotope fractionation in the mangrove Avicennia marina has implications for food web and blue carbon research. Estuar. Coast Shelf Sci. 205, 68–74. doi:10.1016/j.ecss.2018.03.011
Kent, M., Welladsen, H. M., Mangott, A., and Li, Y. (2015). Nutritional evaluation of Australian microalgae as potential human health supplements. PLoS One 10, e0118985. doi:10.1371/journal.pone.0118985
Khan, M. I., Shin, J. H., and Kim, J. D. (2018). The promising future of microalgae: current status, challenges, and optimization of a sustainable and renewable industry for biofuels, feed, and other products. Microb. Cell Fact. 17, 36. doi:10.1186/s12934-018-0879-x
Kobayashi, S., Kawaguchi, H., Shirai, T., Ninomiya, K., Takahashi, K., Kondo, A., et al. (2020). Automatic redirection of carbon flux between glycolysis and pentose phosphate pathway using an oxygen-responsive metabolic switch in Corynebacterium glutamicum. ACS Synth. Biol. 9, 814–826. doi:10.1021/acssynbio.9b00493
Kumar, B. R., Mathimani, T., Sudhakar, M. P., Rajendran, K., Nizami, A. S., Brindhadevi, K., et al. (2021). A state of the art review on the cultivation of algae for energy and other valuable products: application, challenges, and opportunities. Renew. Sustain. Energy Rev. 138, 110649. doi:10.1016/j.rser.2020.110649
Mašalaitė, A., Garbaras, A., and Remeikis, V. (2012). Stable isotopes in environmental investigations. Lith. J. Phys. 52, 261–268. doi:10.3952/lithjphys.52314
Meier-Augenstein, W. (2002). Stable isotope analysis of fatty acids by gas chromatography-isotope ratio mass spectrometry. Anal. Chim. Acta X. 465, 63–79. doi:10.1016/s0003-2670(02)00194-0
Mendes, A., Reis, A., Vasconcelos, R., Guerra, P., and Lopes Da Silva, T. (2009). Crypthecodinium cohnii with emphasis on DHA production: a review. J. Appl. Phycol. 21, 199–214. doi:10.1007/s10811-008-9351-3
Morales, M., Aflalo, C., and Bernard, O. (2021). Microalgal lipids: a review of lipids potential and quantification for 95 phytoplankton species. Biomass Bioenergy 150, 106108. doi:10.1016/j.biombioe.2021.106108
Nuño, K., Villarruel-López, A., Puebla-Pérez, A. M., Romero-Velarde, E., Puebla-Mora, A. G., and Ascencio, F. (2013). Effects of the marine microalgae Isochrysis galbana and Nannochloropsis oculata in diabetic rats. J. Funct. Foods 5, 106–115. doi:10.1016/j.jff.2012.08.011
Nyunoya, H., Ishibashi, Y., Ito, M., and Okino, N. (2022). Significance of mitochondrial fatty acid β-oxidation for the survivability of Aurantiochytrium limacinum ATCC MYA-1381 during sugar starvation. Biosci. Biotechnol. Biochem. 86, 1524–1535. doi:10.1093/bbb/zbac141
Pereira, A. G., Fraga-Corral, M., Garcia-Oliveira, P., Lourenço-Lopes, C., Carpena, M., Prieto, M. A., et al. (2021). The use of invasive algae species as a source of secondary metabolites and biological activities: spain as case-study. Mar. Drugs 19, 178. doi:10.3390/md19040178
Pilecky, M., Winter, K., Wassenaar, L. I., and Kainz, M. J. (2021). Compound-specific stable hydrogen isotope (δ2H) analyses of fatty acids: a new method and perspectives for trophic and movement ecology. Rapid Commun. Mass Spectrom. 35, e9135. doi:10.1002/rcm.9135
Remize, M., Brunel, Y., Silva, J. L., Berthon, J. Y., and Filaire, E. (2021). Microalgae n-3 PUFAs production and use in food and feed industries. Mar. Drugs 19, 113. doi:10.3390/MD19020113
Remize, M., Planchon, F., Garnier, M., Loh, A. N., Le Grand, F., Bideau, A., et al. (2022). A13 CO2 enrichment experiment to study the synthesis pathways of polyunsaturated fatty acids of the haptophyte Tisochrysis lutea. Mar. Drugs 20, 22. doi:10.3390/md20010022
Rhee, S. K., Reed, R. G., and Brenna, J. T. (1997). Fatty acid carbon isotope ratios in humans on controlled diets. Lipids 32, 1257–1263. doi:10.1007/s11745-006-0161-6
Roleira, F. M. F., Tavares-Da-Silva, E. J., Varela, C. L., Costa, S. C., Silva, T., Garrido, J., et al. (2015). Plant derived and dietary phenolic antioxidants: anticancer properties. Food Chem. 183, 235–258. doi:10.1016/j.foodchem.2015.03.039
Señoráns, M., Castejón, N., and Señoráns, F. J. (2020). Advanced extraction of lipids with DHA from Isochrysis galbana with enzymatic pre-treatment combined with pressurized liquids and ultrasound assisted extractions. Molecules 25, 3310. doi:10.3390/molecules25143310
Shalaby, E. A. (2011). Algae as promising organisms for environment and health. Plant Signal Behav. 6, 1338–1350. doi:10.4161/psb.6.9.16779
Sirirak, K., Suanjit, S., Powtongsook, S., and Jaritkhuan, S. (2020). Characterization and PUFA production of Aurantiochytrium limacinum BUCHAXM 122 isolated from fallen mangrove leaves. ScienceAsia 46, 403–411. doi:10.2306/scienceasia1513-1874.2020.051
Soto-Sánchez, O., Hidalgo, P., González, A., Oliveira, P. E., Hernández Arias, A. J., and Dantagnan, P. (2023). Microalgae as raw materials for aquafeeds: growth kinetics and improvement strategies of polyunsaturated fatty acids production. Aquac. Nutr. 2023, 1–19. doi:10.1155/2023/5110281
Twining, C. W., Taipale, S. J., Ruess, L., Bec, A., Martin-Creuzburg, D., and Kainz, M. J. (2020). Stable isotopes of fatty acids: current and future perspectives for advancing trophic ecology. Philosophical Trans. R. Soc. B Biol. Sci. 375, 20190641. doi:10.1098/rstb.2019.0641
Visudtiphole, V., Khudet, J., Chaitongsakul, P., Plaisen, S., Siriwattano, J., Laiphrom, S., et al. (2021). Growth and lipidomic analyses of penaeus Monodon larvae supplemented with Aurantiochytrium limacinum BCC52274. Front. Mar. Sci. 8. doi:10.3389/fmars.2021.771929
Wu, J. Y., Tso, R., Teo, H. S., and Haldar, S. (2023). The utility of algae as sources of high value nutritional ingredients, particularly for alternative/complementary proteins to improve human health. Front. Nutr. 10, 1277343. doi:10.3389/fnut.2023.1277343
Xin, Y., Wu, S., Miao, C., Xu, T., and Lu, Y. (2024). Towards lipid from microalgae: products, biosynthesis, and genetic engineering. Life 14, 447. doi:10.3390/life14040447
Mang Gao, Q. C. (2013). “Isolation and characterization of aurantiochytrium species: high docosahexaenoic acid (DHA) production by the newly isolated microalga,” in Aurantiochytrium sp. SD116.
Zghaibi, N., Omar, R., Kamal, S. M. M., Biak, D. R. A., and Harun, R. (2019). Microwave-assisted brine extraction for enhancement of the quantity and quality of lipid production from microalgae nannochloropsis sp. Molecules 24, 3581. doi:10.3390/molecules24193581
Zhang, Y., and Liu, J. (2021). Lipid metabolism and metabolic engineering of eukaryotic microalgae. Adv. Bioenergy 6, 1–35. doi:10.1016/BS.AIBE.2021.05.001
Keywords: Aurantiochytrium limacinum, PUFA, DHA, CSIA, GC-FID, GC-C-IRMS
Citation: Dirir AM, Chokshi K, Ali AH, Alhanawi M, Rommala M and Hachem M (2025) Gas chromatography for analysis and estimation of 13C at natural abundance level in fatty acids produced from Aurantiochytrium limacinum, a sustainable source of polyunsaturated fatty acid. Front. Bioeng. Biotechnol. 13:1631063. doi: 10.3389/fbioe.2025.1631063
Received: 19 May 2025; Accepted: 11 July 2025;
Published: 22 July 2025.
Edited by:
Tingyue Gu, Ohio University, United StatesReviewed by:
Fengwei Yin, Taizhou University, ChinaArti Kumari, Bihar Agricultural University, India
Copyright © 2025 Dirir, Chokshi, Ali, Alhanawi, Rommala and Hachem. This is an open-access article distributed under the terms of the Creative Commons Attribution License (CC BY). The use, distribution or reproduction in other forums is permitted, provided the original author(s) and the copyright owner(s) are credited and that the original publication in this journal is cited, in accordance with accepted academic practice. No use, distribution or reproduction is permitted which does not comply with these terms.
*Correspondence: Mayssa Hachem, bWF5c3NhLmhhY2hlbUBrdS5hYy5hZQ==
†These authors have contributed equally to this work