 Katherine Wild
 Juan Carlos Dominguez
 Lisa Schulte Moore
 Mark Mba Wright
- 1Mechanical Engineering, Iowa State University, Ames, IA, United States
- 2Ingeniería Química y de Materiales, Complutense University of Madrid, Madrid, Spain
- 3Natural Resource Ecology and Management, Iowa State University, Ames, IA, United States
- 4Bioeconomy Institute, Iowa State University, Ames, IA, United States
Prairie grass remains an underutilized agricultural resource that could provide economic, environmental, and ecological benefits to the bioeconomy. Prairie grass and manure anaerobic digestion is a promising pathway for renewable natural gas (RNG) production, but there is limited information on how co-digestion ratios impact RNG performance. This study integrates the Anaerobic Digestion Model No. 1 (ADM1) into a techno-economic analysis (TEA) and life cycle assessment (LCA) framework to evaluate RNG production via co-digestion of prairie biomass and cattle manure. Simulations across eleven feedstock ratios showed that co-digestion can increase methane yields compared to mono-digestion of prairie biomass. The highest methane production rate (227 mL/gVS) and the lowest minimum fuel selling price (MFSP) of $41.88/GJ occurred at a 1:9 prairie-to-manure volatile solids (VS) ratio. RNG yields reached 10.1 GJ/dry tonne for this configuration—39% higher than prairie-only digestion. LCA results revealed that manure-based scenarios had the lowest global warming potential (−16.0 kg CO2-eq/GJ), while prairie-based scenarios reduced ecotoxicity (−190 kg 2,4-D-eq/GJ). Economic and environmental benefits were further improved by accounting for biochar coproducts via system expansion and allocation. Results underscore the value of ADM1 in optimizing AD system design for both profitability and sustainability.
Introduction
Renewable natural gas (RNG) from anaerobic digestion (AD) is becoming a widely explored energy source within the U.S. (U.S. EPA, 2023). Co-digestion, the addition of more than one substrate to a digester, is a common approach for optimizing feedstock digestibility (Hagos et al., 2017). Mono-digestion of manure can lead to process instability by supplying the reactor with a low carbon-to-nitrogen (C/N) ratio (Fernandes et al., 2009). The mono-digestion of lignocellulosic material is often infeasible due to the recalcitrant properties of the feedstock and high C/N ratios available (Karki et al., 2021; Paul and Dutta, 2018). Blending of manure and lignocellulosic material for co-digestion can provide optimal C/N ratios by balancing nutrient flows to the digester (Neshat, et al., 2017). Additional improvements in methane (CH4) yields from co-digestion can be attributed to an increase in microbial variations and substrate interactions within the digester (Kunatsa and Xia, 2022; Ma et al., 2020).
Several factors drive the demand for co-digestion of manure and lignocellulosic materials. Regenerative agriculture (Rhodes 2017), an alternative to single-crop farming, helps sustain food and energy production by growing feedstock that reduces soil erosion, improves nutrient retention, and provides ecological benefits. Prairie grasses provide many of these benefits (Schulte et al., 2017), but their economic value remains limited. Anaerobic digestion of lignocellulosic biomass can generate valuable fuels and chemicals (Olafasakin et al., 2024; McLaughlin et al., 2002), but this pathway faces technical and policy challenges (Groom et al., 2008; Lark 2020).
Accurate biogas modeling tools may help relieve time and economic burdens of experimentation. These models also have the potential to facilitate economic and environmental assessments of novel AD feedstocks for real-world use. Several models representing the AD process have been created, including the Anaerobic Digestion Model No. 1 (ADM1), Gaussian, and Gompertz (Emebu et al., 2022; Biernacki et al. 2013; Bułkowska et al. 2015). Modeling AD processes has become more complex throughout the years. New additions now include steps such as characterizing the feedstock by organic components, such as carbohydrates, to model the entire digestion process (Weinrich and Nelles, 2021). The International Water Association created ADM1 in 2002 (Batstone et al., 2002). ADM1 is a complex model including more than 24 dynamic variables, 19 biochemical conversion processes, and eight algebraic variables. This model encompasses five steps to represent the AD process: disintegration, hydrolysis, acidogenesis, acetogenesis, and methanogenesis.
The ADM1 model has been further expanded since 2002, incorporating various methodologies for new feedstock integration and nutrient interaction improvement (Chen et al., 2016; Koch et al., 2010; Li et al., 2020; Zhou et al., 2011). While ADM1 is widely used for biogas and CH4 estimation, there are still areas within the model that require further exploration, such as ammonia inhibition (Mo et al., 2023). There are few economic and environmental-focused studies utilizing ADM1 found within the literature. Glivin and Sekhar (2018) completed an economic analysis using experimental data and ADM1 to determine the cost of a digester within an institution in India. Usack et al. (2019) utilized ADM1 within an environmental assessment for an AD combined heat and power system on a dairy farm. Integrating ADM1 into economic and environmental assessments remains challenging due to the complexity of combining ADM1 with process simulation software.
This article describes a techno-economic analysis (TEA) and life cycle assessment (LCA) utilizing ADM1 for predicting the co-digestion of cattle manure and prairie biomass within BioSTEAM (Cortes-Peña, 2022; Python Software Foundation 2025). Within this study, eleven ratios of manure and prairie biomass will be analyzed, including mono-digestion and co-digestion scenarios. Our work is built upon Wild et al. (2024) for the process design of biogas upgraded to RNG. Our work also utilizes the same TEA methodology as Wild et al. (2024). An extended LCA was completed using the boundary expansion method to fully consider the impact of biochar. Additionally, we use physical, economic, and energy allocation methodologies to determine the environmental impacts of the products (RNG and biochar). To the author’s knowledge, this study demonstrates, for the first time, the integration of ADM1 and BioSTEAM, and contributes the most comprehensive predictive lifecycle assessment of prairie biomass and manure co-digestion for RNG.
Materials and methods
Overview
Figure 1 shows the methodology employed in this study. First, we gather feedstock characterization data for prairie biomass and manure. Then, we configure the ADM1 model to estimate biogas and methane production. Next, the ADM1 model is integrated with the biorefinery process design to gather facility material and energy balances. Finally, we conduct techno-economic (TEA) and lifecycle assessment (LCA) to estimate costs and environmental impacts under various co-digestion scenarios.
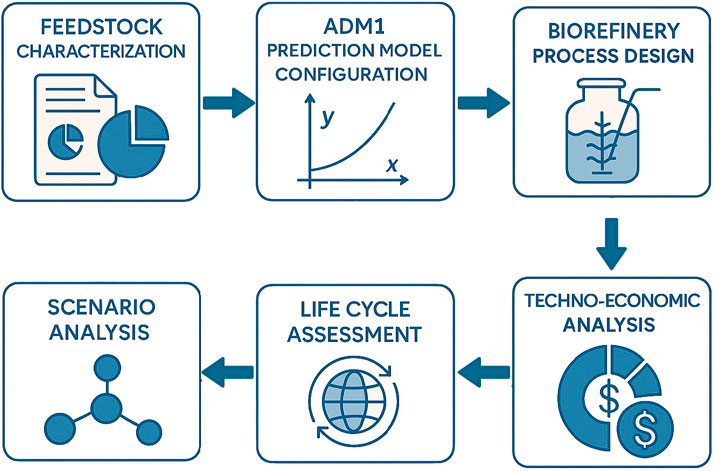
Figure 1. Overview of the ADM1-predictive techno-economic and lifecycle assessment of prairie biomass co-digestion for RNG production.
The working hypothesis for this study is that manure and prairie grass co-digestion offers economic and environmental benefits. Generally, these benefits vary based on the costs and environmental factors of each feedstock, and the regional context of the facility. Agricultural operations producing both manure and prairie grass, for example, could reduce their carbon footprint by increasing the contribution from the lower carbon intensity material. Synergistic effects, like increased biogas generation, are not fully explored in this study, but merit further consideration in future studies.
Feedstock characterization
Due to the complex and comprehensive nature of the ADM1, every employment of this model should include steps for an accurate representation of the feedstocks (Klimiuk et al., 2015; Poggio et al., 2016). There are several different methodologies for substrate integration, including proper feedstock characterization, calculation of stochiometric parameters, and calibration of kinetic parameters (Koch et al., 2010; Xie et al., 2016; Zhou et al., 2011). The methodology for feedstock characterization closely follows Koch et al. (2010), where feedstocks for the model are fractioned based on the organic matter within the material. ADM1 kinetic parameters were not adjusted for this study.
The feedstock’s volatile solids (VS) are fractioned into proteins (RP), lipids (RL), and carbohydrates (raw fiber and nitrogen-free extract (RF + NfE)). Neutral detergent fiber (NDF), acid detergent fiber (ADF), and acid detergent lignin (ADL) are used to further categorize the carbohydrate fraction as starch (RF + NfE - NDF), cellulose (ADF - ADL), hemicellulose (NDF - ADF), and lignin (ADL). Figure 2 shows the composition breakdown. We obtained the composition for each feedstock from a literature review, averaging the values found for cattle manure and prairie biomass. The average of three prairie biomass species was used to categorize prairie biomass: switchgrass (Panicum virgatum L.), indiangrass (Sorghastrum Nutans L.), and big bluestem (Andropogon Gerardii). Table 1 summarizes the feedstocks.
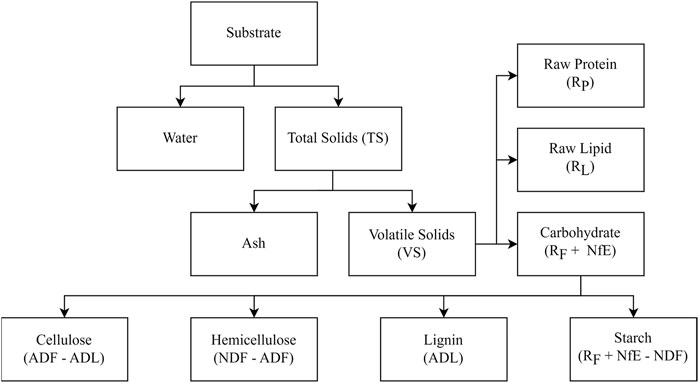
Figure 2. Composition breakdown of feedstocks following Koch et al. (2010).
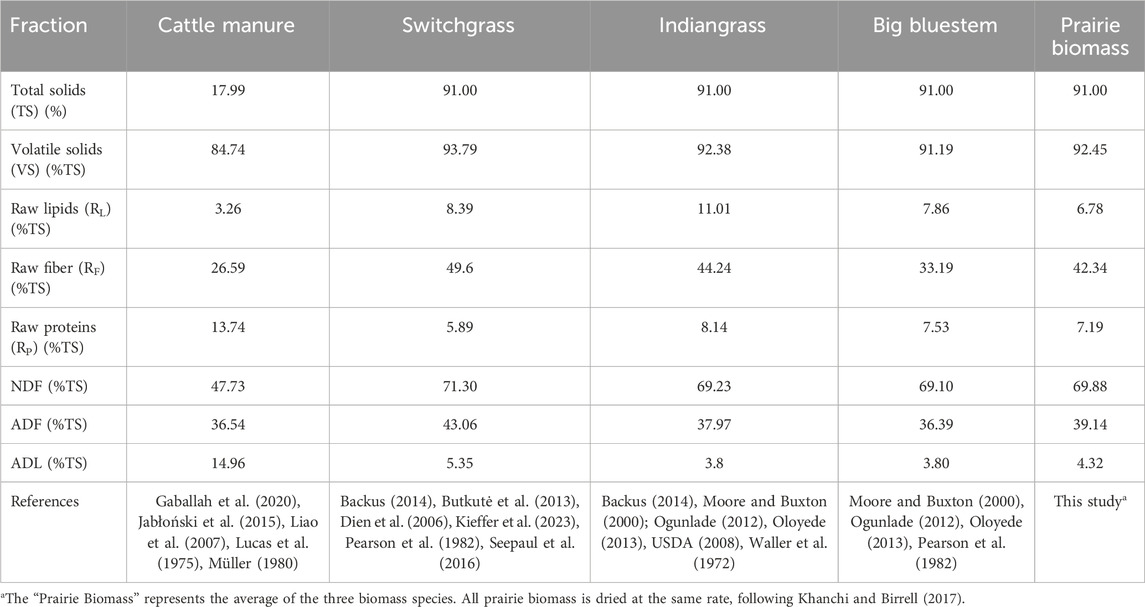
Table 1. Characterization of cattle manure and prairie biomass from literature based on total solids (TS).
After substrate characterization, NfE was calculated following Zhou et al. (2011), shown in Equation 1.
Integration of ADM1 for manure and prairie grass Co-digestion modelling
As ADM1 quantifies the system with respect to the chemical oxygen demand (COD), the theoretical oxygen demand (ThOD) is used to quantify the degradability of proteins, lipids, starch, cellulose, hemicellulose, and lignin. As lignin has no defined structure, Nadji et al. (2009) determined the formula from Stipa Tenacissima (L.). Lignin is entirely inert within this model, while lipids, proteins, and starches are entirely biodegradable. Cellulose and hemicellulose are partially degradable. Table 2 displays the ThOD for each fraction within the model (Koch et al., 2010).

Table 2. Theoretical Oxygen Demand (ThOD) of substrate fractions.
The composite material (Xc) for each feedstock was calculated via the summation of the ThOD for each fraction multiplied by the amount of the fraction present from the feedstock, shown in Equation 2 (expressed in kgCOD/m3). The density (ρ) of each substrate inside the digester was assumed to be 1,000 kg/m3.
The degradation percentages (DVS) for cattle manure and prairie biomass were assumed to be 49.5% and 36.1%, respectively (Jabłoński et al., 2015; Niu et al., 2015). We also integrated fixed stoichiometric parameters, f-factors, from Koch et al. (2010) for the feedstock characterization. These f-factors (fCh_xc, fL_xc, fP_xc, and fI_xc) allocate the various component fractions of XC, following the disintegration step as carbohydrates (XCh), lipids (XL), proteins (XP), and inert material (XI). Utilizing f-factors ensures the sum of all components equate to XC. Calculations for the f-factors utilize a degradation coefficient, d (%), calculated from the determined degradability of the substrate (DVS) and the substrate composition. The degradation coefficient, shown in Equation 3, determines the degradable parts of cellulose and hemicellulose. Equations 4–7 show the f-factor calculations, all represented in terms of kgCOD/kgCOD.
Additional characterization is required for manure, as the substrate has already been partially disintegrated from the cow’s rumen (Zhou et al., 2011). Soluble components for monosaccharides (Ssu), amino acids (Saa), long-chain fatty acids (Sfa), and inerts (Si) are calculated based on the Xc, then subtracted from the individual components as Zhou et al. (2011) proposed. Ssu was subtracted from Xch, Saa was subtracted from Xpr, Sfa was subtracted from Xli, and Si was subtracted from Xi. Table 3 highlights the soluble percentages within manure from Wichern et al. (2007). As acetate’s solubility was determined to be 0.0 by Wichern et al. (2009), it was not considered in calculations.
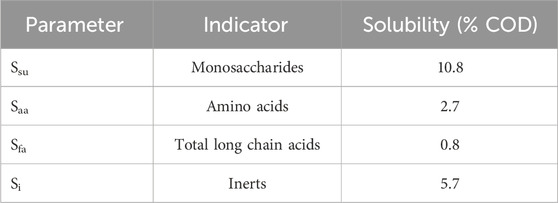
Table 3. Soluble components from disintegration of cattle manure.
Finally, each feedstock was calibrated using trial and error based on the ADM1 calibration parameters available within the literature for similar feedstocks (Lübken et al. 2007; Shi et al. 2014; Thamsiriroj and Murphy 2011). Supplementary Tables S1, S2 include information on the ADM1 calibration parameters. Various calibration parameters were tested. Parameters were chosen based on how closely the biogas and CH4 model results matched experimental CH4 production rates found within the literature. All other parameters are determined by the benchmark simulation model no. 2 (Rosén and Jeppsson, 2006). As the model is dependent on the feedstock characterization shown in Table 1, new feedstock parameters could widely impact the predicted results of the model. Additionally, there was little literature available for co-digestion calibration parameters at different ratios. All co-digestion scenarios utilized the same calibration parameters, so the amount of each co-digested feedstock had no effect on the calibration parameters chosen. Previous studies have indicated that these are some of the limitations of ADM1, and new methods have been proposed to handle dynamic feedstock properties (Long et al., 2025).
Biorefinery process design
We utilized version 2.37.4 of BioSTEAM in Python 3.11 (Cortes-Peña, 2022) for the system design and implementation of the ADM1. Wild et al. (2024) was used as a basis for biogas upgrading to RNG from the co-digestion of prairie biomass and cattle manure. While Wild et al. (2024) includes a pretreatment for biomass, we chose to simplify the inputs to the ADM1 model to focus on feedstock characterization, without the pretreatment process. The feedstocks are digested with a hydraulic retention time of 30 days under mesophilic conditions. Longer hydraulic retention times would increase biogas yields resulting in lower per-unit costs and environmental impacts. However, increasing the hydraulic retention time has diminishing returns after a certain duration, and capital cost increases can overtake cost reductions. The digestate is thermally treated for eventual soil application. After biogas is collected, hydrogen sulfide is removed from the gas stream. On-site combustion is completed to meet electricity and heat requirements, burning 5% of the biogas stream and purchased natural gas as needed. Carbon dioxide (CO2) is removed from the gas stream by an amine scrubber system with monoethanolamine (MEA). The full process diagram is shown in Figure 3.
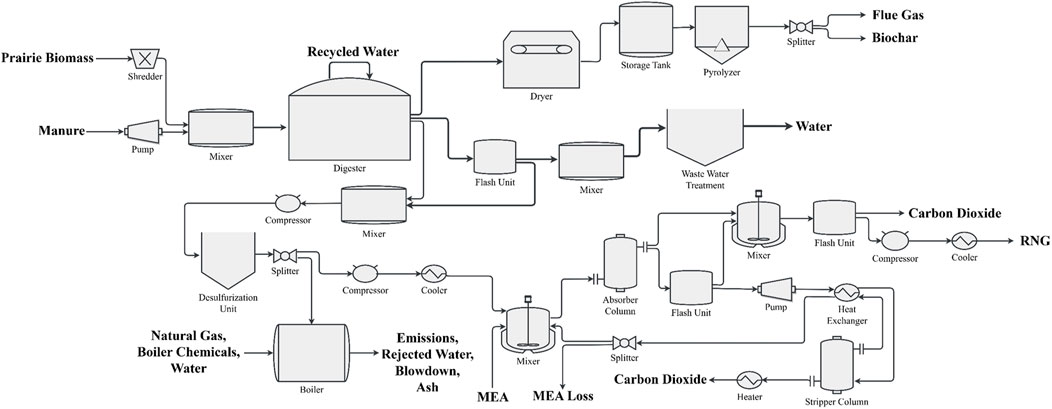
Figure 3. Full process diagram of a commercial biorefinery for the co-digestion of prairie biomass and cattle manure.
There were 11 ratios examined, each scenario changing based on the VS ratio of prairie biomass (B) and cattle manure (M). The rate of material entering the digester is 1,000 kgVS/hr for all scenarios. Scenario B10:M0 requires 100% of the VS makeup from biomass, while B9:M1 requires 90% of the VS makeup from biomass and 10% from manure, and so on. The digester’s recycled water makes up 10% TS within the reactor for each scenario. These ratios were selected to balance the tradeoffs between not having enough scenarios to capture second-order effects, like feedstock synergies (Rahic et al., 2024; Wani and Parveez 2025), and generating too many scenarios for an accessible analysis of the trends.
Techno-economic analysis
The capital costs of the BioSTEAM process units have been modified following Wild et al. (2024), including cost estimates for the digester system, biomass shredder, and gas compressor. Wild et al. (2024) determined several operating parameters to be sensitive for the estimation of the minimum fuel selling price (MFSP) of RNG. These parameters include the cost of the prairie biomass, cattle manure, biochar, and the internal rate of return (IRR). For further analysis, we are expanding upon those four parameters via an additional literature review. Wild et al. (2024) displays the full sensitivity and uncertainty analyses completed for this system.
Wild et al. (2024) determined the cost of prairie biomass from the break-even farm gate prices for switchgrass, at $105/tonne. Krohn (2015) reported that farmers selling switchgrass for $120/tonne are profitable and may have the potential to outcompete corn and soy on low-quality land. Additionally, the price of manure is now based on application rates of liquid manure to a crop field, calculated to be $41/tonne (Olsen and Leibold, 2022). While biochar prices in literature range extensively, Thengane et al. (2021) estimated the product to have a minimum selling price of $150/tonne. Finally, Rajendran et al. (2019) utilized an IRR of 7% for a biogas upgrading plant receiving incentives. All streams with associated costs are shown in Table 4.
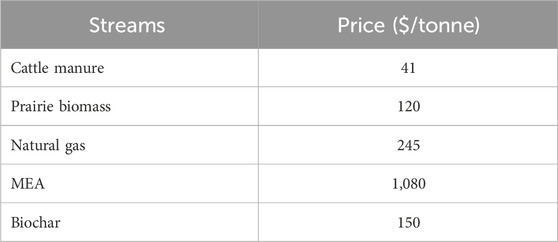
Table 4. Prices for all feedstocks, chemicals, or co-products within the system.
Life cycle assessment
Following the ISO 14,040 and 14,044 LCA framework, the goal of this attributional LCA is to compare impacts from various co-digestion ratios of cattle manure and prairie biomass (ISO, 2006a; ISO, 2006b). The system boundary expansion method is used to quantify effects due to the biochar, including the substitution of nitrogen (N) synthetic fertilizer, as biochar has several beneficial nutrient qualities (Ding et al., 2016; Wang et al., 2022). Additionally, allocation methods are used to determine the responsibility of environmental impact for each product (RNG and biochar) within the mono-digestion scenarios. Mass, energy, and economic allocation methods are used to expand upon the original LCA completed in Wild et al. (2024) to fully understand the impact of allocation methodologies. The boundary of our LCA is well-to-gate, where any physical streams crossing that boundary will be quantified as either feedstock, waste, or product.
We used EcoInvent V3.7 within OpenLCA V2.1 as our environmental impact factor database (Ecoinvent, 2025; OpenLCA, 2025). The Tool of the Reduction and Assessment of Chemical and other environmental Impacts (TRACI) was used for quantification of all streams flowing between the defined scope boundaries (Bare, 2011). TRACI was developed by the U.S. Environmental Protection Agency for conducting LCAs. We analyzed nine different impact categories within this system: one climate change impact category (global warming), three ecosystem quality impact categories (eutrophication, acidification, and ecotoxicity), three categories impacting human health (respiratory effects, carcinogenics, and non-carcinogenics), and two categories impacting both human health and ecosystem quality (ozone layer depletion and photochemical oxidation). The functional unit was considered as 1 GJ of RNG.
A transportation distance of 50 km was considered for chemicals entering the plant. Transportation was not considered for cattle manure and biomass, as they were both assumed to be located near the facility. Natural gas is transported to the facility within a pressurized pipeline. The biomass entering the plant was grass produced on a permanent grassland, therefore no additional land-use change impacts were considered beyond the feedstock-specific factor. We consider cattle manure to be an avoided waste. Synthetic N fertilizer was avoided on a 1:1 mass basis (Han et al., 2013). The total N content of biochar derived from cattle manure digestion is 1.71% of the total dry wt% (Schouten et al., 2012). The total N content of biochar derived from the digestion of herbaceous biomass and agro-industrial residues is 1.78% of the total dry wt% (Miliotti et al., 2020). Biochar N levels were determined from the feedstock ratios for each scenario. A system-wide CH4 leak was considered for the plant at a 2% volume basis of RNG collected, to consider the real-world impacts of a typical gas biorefinery. The LCA inventory can be seen in Table 5.
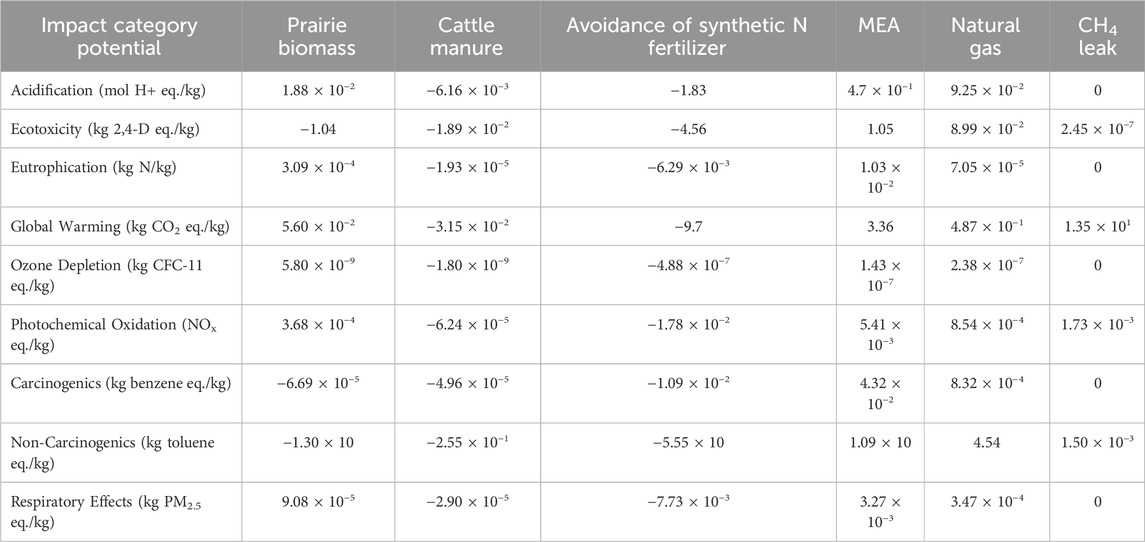
Table 5. LCA impact factor inventory from EcoInvent for the boundary expansion method for inclusion of synthetic N fertilizer offset.
Biochar offers several agricultural and environmental benefits to AD and their ecosystems (Archontoulis et al., 2016; Laird et al., 2009; Uddin et al., 2022). Previous studies have shown that adding biochar to the digester can increase biogas yields and quality leading to lower RNG prices and carbon footprints (Uddin et al., 2022). Furthermore, biochar serves as a nutrient recycling and carbon sequestration agent. Finally, biochar could have long-term benefits such as crop yield and soil organic carbon content increases that are topics of active investigation.
The lifecycle impacts of prairie grass cultivation on land use and fertilizer dynamics is a research area of growing interest (Li et al., 2025). Several groups are collecting the field data to improve the modeling of prairie grass landscapes (Edmonds et al., 2021). These factors could significantly impact the environmental performance of grass AD system. This study relies on factors available in EcoInvent, which may require updates to reflect modern practices. A detailed characterization of the land use and fertilizer displacement impact factors is outside the scope of the present study.
An additional analysis was completed for the allocation of emissions based on the mass, economic, and energy content of the system products: RNG and biochar. The total impacts of each mono-digestion scenario were allocated based on the metric used and the production rates of the products. The mass allocation metric is based on the total mass production rate. The economic allocation metric is based on the estimated price (MFSP) for biochar and RNG. The energy content of biochar and RNG was determined to be 22 MJ/kg and 52.5 MJ/kg, respectively (Lee et al., 2020).
Sensitivity analysis of key model parameters was conducted to evaluate their impacts on the MFSP and the GWP. MFSP sensitivity parameters include RNG yield, manure, biomass, biochar, and natural gas prices, and IRR. GWP sensitivity parameters include manure and biomass flow rate and emission factor, RNG yield, nitrogen fertilizer displacement, and emission factors for CH4 leakage and natural gas (purchased and avoided). Each of these parameters was varied ±20% to capture the proportional impact on the output variable.
Results
Simulated system results
The inlet concentration, Xc, was calculated for each feedstock before digestion, equaling 166 kgCOD/m3 and 1,136 kgCOD/m3 for manure and prairie biomass, respectively. The degradation coefficient, d, used for determining the degradability of cellulose and hemicellulose, was larger for all co-digestion scenarios when compared to the mono-digestion scenarios. Additionally, f-factors fCh_xc and fP_xc linearly increased with the addition of manure, while fI_xc and fL_xc linearly increased with the addition of biomass. Additional calculated parameters for the model are presented in the Supplementary Material.
The mono-digestion of prairie biomass produced 156 mL/gVS of CH4 while the mono-digestion of manure produced 219 mL/gVS of CH4. All co-digestion scenarios had larger CH4 production rates than the mono-digestion of prairie biomass. Two out of the nine co-digestion scenarios produced larger CH4 rates than the mono-digestion of manure (B8:M2 and B9:M1), with the highest CH4 production rate at 227 mL/gVS (B9:M1). The production of CH4 and biogas in shown in Figure 4.
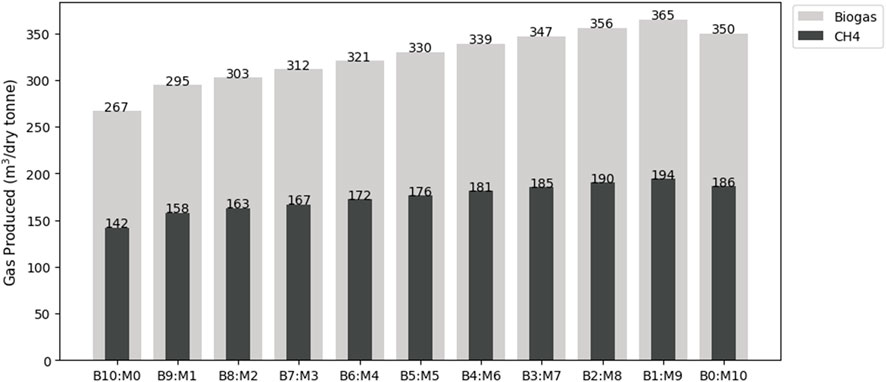
Figure 4. Biogas and CH4 output predictions from the digestion of prairie biomass and cattle manure.
As the model is based on the VS content of the feedstocks, manure is required in a much greater quantity than biomass within our system. As a result, the two mono-digestion scenarios have a flow rate of 6,560 kg/hr and 1,210 kg/hr for manure and biomass, respectively. Digestate production levels increase with the addition of biomass, with the largest production rate of 557 kg/dry tonne (B10:M0) due to the recalcitrant nature of the biomass. B1:M9 has the largest CH4 production from biogas, while B0:M10 has the largest residual CH4 collected from the digestate. The residual CH4 from the digestate increases linearly with the addition of manure, from 57 m3/dry tonne to 139 m3/dry tonne. B1:M9 is the largest producer of RNG at 10.1 GJ/dry tonne. The RNG produced in B1:M9 is 39% larger than the RNG produced in B10:M0. Further results are displayed in Table 6.
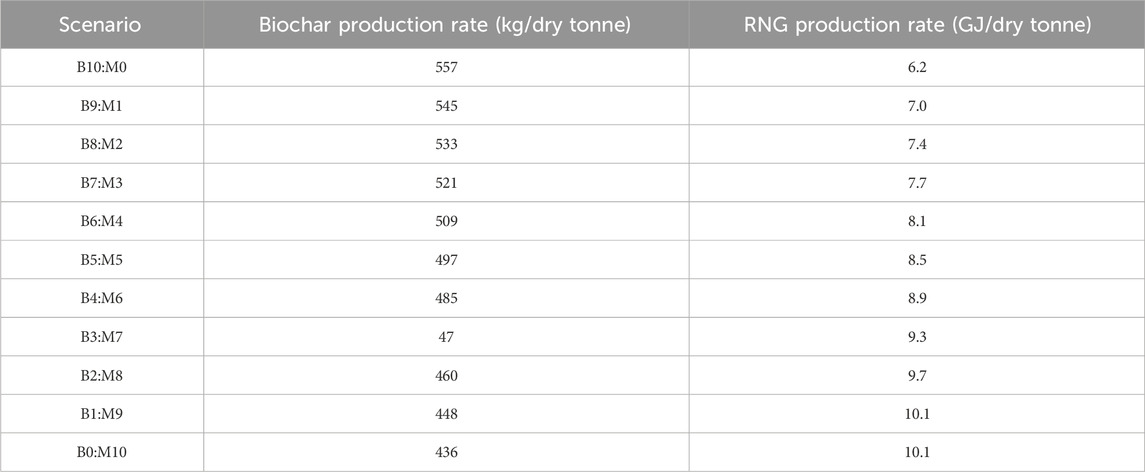
Table 6. Production rates for RNG and biochar for all scenarios.
Techno-economic analysis
The estimated MFSP for all scenarios ranged from $41.88/GJ to $51.97/GJ, as shown in Figure 5. The MFSP is heavily dependent on the production of CH4 from digestion, as B1:M9 has the smallest estimated MFSP from an increase in feedstock efficiency and residual CH4 from the digestate. The difference in feedstock pricing does not have a large effect on the MFSP. This is due to the VS content difference, as the biomass has more digestible material on a mass basis. This results in a slightly larger cost for manure acquisition, as the total feedstock costs for B10:M0 and B0:M10 are $19.38/GJ and $20.60/GJ, respectively.
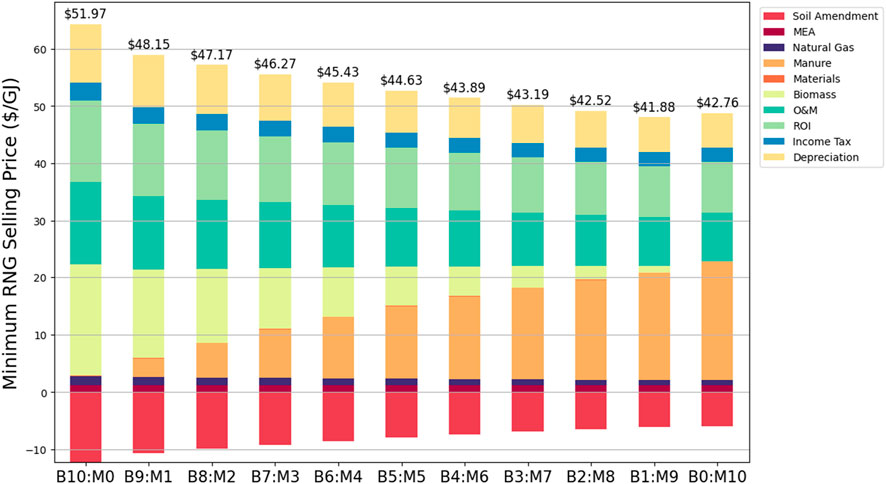
Figure 5. Minimum renewable natural gas (RNG) fuel selling price for prairie grass (B) and manure (M) ratios ranging from B10:M0 to B0:M10.
The MFSP offset from the biochar increases with the addition of biomass and larger N content found within the biochar. This results in an offset of $5.91/GJ and $12.27/GJ for scenarios B0:M10 and B10:M0, respectively. Operating and maintenance (O&M) costs make up between 20% and 28% of the total MFSP. Return on investment (ROI) costs range from 21% to 27%. As the amine used for CO2 removal (MEA) is recycled, it does not have a large effect on the MFSP ($1.21/GJ to $1.25/GJ). These costs are comparable to those reported in previous studies, which range from $10 to $100/GJ (Bhatt and Tao 2020).
Capital costs within the system ranged from $13.31 million (B10:M0) to $13.84 million (B1:M9), with significant costs coming from the stripper column, boiler, and digester. This relationship closely mirrors the biogas production rates, as more biogas and CH4 collected require larger downstream units for upgrading. For example, the absorber column equipment cost increased by 37% for B1:M9 compared to B10:M0. All scenarios within this plant have a net present value (NPV) to reach a breakeven point. B0:M10 had the largest annual variable operating cost due to a larger amount of feedstock required to meet VS feed conditions. B1:M9 had the largest calculated value of annual operating costs subtracted from the yearly sales of products.
These costs are representative of small-to medium-scale anaerobic digestion systems. Costs for larger systems may vary due to the benefits of economies-of-scale and challenges of increased logistical and complexity costs (Wright and Brown 2007). We believe most of the conclusions regarding varying feedstock type ratios will remain relevant at any scale, but this will require validation at relevant commercial scales.
Life cycle assessment
The LCA boundary of our AD upgrading facility was expanded to include impacts of biochar for the avoidance of synthetic N fertilizer. The total impact of the system is largely dependent on what feedstocks are being utilized, as manure has avoided burdens in all categories due to being an avoided waste. All avoided burdens are represented with negative values, while burdens impacting the system are represented with positive values. The GWP from the feedstocks alone ranged from −16.0 kg CO2 eq./GJ to 4.33 kg CO2 eq./GJ for B0:M10 and B10:M0, respectively. Figure 6 shows how the GWP varies for different feedstock ratios These values are comparable to commercial carbon intensity (CI) scores reported in the California Low Carbon Fuel Standard (LCFS) database for anaerobic digestion. LCFS CI scores for RNG range from −680 to 110 kg CO2 eq./GJ, with lignocellulosic biomass pathways ranging between −20 and 20 kg CO2 eq./GJ (California Air Resource Board (CARB), n. d.).
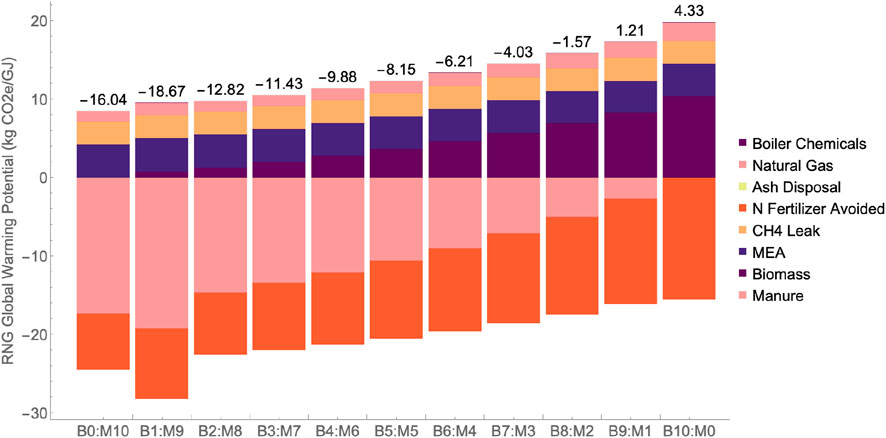
Figure 6. Renewable Natural Gas (RNG) Global Warming Potential (GWP) for prairie grass (B) and manure (M) ratios ranging from B10:M0 to B0:M10.
Biomass integration had a large estimated avoided burden for the ecotoxicity potential, with the estimated net ecotoxicity ranging from −190 kg 2,4-D eq./GJ for B10:M0 (as compared with −12 2,4-D eq./GJ for B0:M10). The net non-carcinogenic potential is also lower for B10:M0 at −2,350 kg toluene eq./GJ when compared to B0:M10 at −160 kg toluene eq./GJ. Figure 7 shows the results of the nine impact categories for the scenario with the smallest estimated MFSP (B1:M9).

Figure 7. Percentage breakdown of LCA results with each category summing to 100% for B1:M9.
The CH4 leak within the system did not vary significantly, as the global warming potential for all scenarios was between 2.91 kg CO2 eq./GJ and 2.92 kg CO2 eq./GJ. The largest contributors to the eutrophication potential are biomass cultivation (B4:M6 to B10:M0) and MEA use (B0:M10 to B3:M7). MEA is also the largest contributor to the carcinogenic potential for all scenarios. Natural gas was the largest burdening factor to ozone depletion potential, with the largest contribution at 1.14 × 10⁻⁶ kg CFC-11 eq./GJ for B10:M0. Biochar had a significant influence on all categories, due to the avoidance of synthetic N fertilizer. Further results can be seen in Table 7.
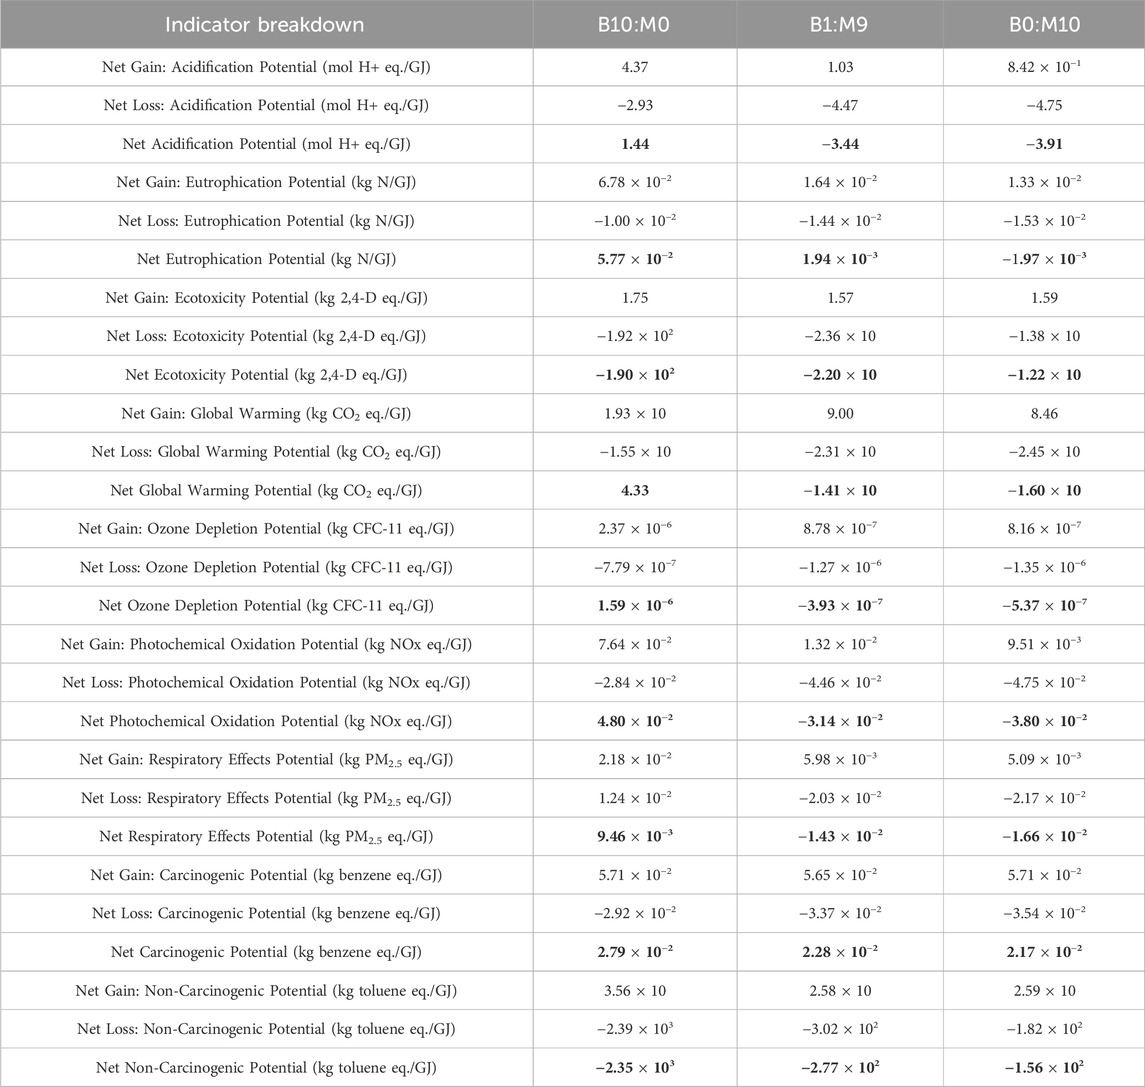
Table 7. Burdens, gains, and net values for each impact category are displayed for B10:M0, B1:M9, and B0:M10.
We also considered an attributional LCA based on the mass, energy, and economics of each product. Table 8 displays the percentage breakdown used for assigning impacts to RNG and biochar for both mono-digestion scenarios to see the range of possible outcomes. Biochar received the majority of impacts for mass allocation due to the product’s physical properties. Energy allocation favors the RNG due to its higher energy content. Economic allocation places most of the impact on RNG due to the significant price difference of the products. Scenarios with a larger use of manure place slightly more of an impact on the RNG for all allocation methods, as there is a greater production of RNG (seen through comparing B10:M0 and B0:M10).
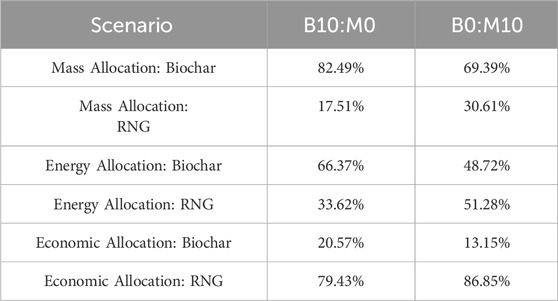
Table 8. Percentage allocation of environmental and human impact categories for biochar and RNG.
The total global warming potential for B10:M0 was estimated at 19.32 kg CO2 eq./GJ without considering the impacts of biochar. Utilizing the above allocation emissions, RNG is responsible for 3.38 kg CO2 eq./GJ (mass), 6.50 kg CO2 eq./GJ (energy), or 15.35 kg CO2 eq./GJ (economic), depending on the allocation method used. A more detailed discussion on the impact of various allocation methods on biochar and RNG systems is discussed in the study by Wild et al. (2024).
Sensitivity analysis
The results of the MFSP sensitivity analysis are shown in Figure 8. RNG yield is the most impactful parameters under most scenarios followed by the feedstock and biochar prices. The IRR has a lower relative impact. Twenty percent changes in these parameters vary the RNG costs by up to $20/GJ. This suggests that there is significant value in accurately predicting AD performance to minimize production cost uncertainty.

Figure 8. Sensitivity analysis of Renewable Natural Gas (RNG) costs to ±20 changes in RNG yield, material prices, and Internal Rate of Return (IRR).
Figure 9 shows the sensitivity analysis results for the RNG GWP. The key parameters for GWP are the manure and biomass factors, the nitrogen fertilizer displacement, and the RNG yield. Twenty percent changes in these parameters vary the GWP by up to 5 kg CO2 eq./GJ There are many reasons why these factors could vary as discussed previously. Therefore, these results highlight the importance of improving our understanding of how these factors vary across different ecological scenarios.

Figure 9. Sensitivity analysis of Renewable Natural Gas (RNG) Global Warming Potential (GWP) to ±20 changes in RNG yield, and material flow and emission factors.
Discussion
The CH4 outputs from the ADM1 model for both mono-digestion scenarios fit into the reviewed literature. Reviewed CH4 yields from the mono-digestion of cattle manure ranged from 181 mL/gVS to 270 mL/gVS (Kafle and Chen, 2016; Liu et al., 2017; Moset et al., 2017; Tsapekos et al., 2018; Varol and Ugurlu, 2017). The CH4 yields for the mono-digestion of switchgrass have a larger range within the literature, between 104 and 309 mL/gVS (Frigon et al., 2012; Labatut et al., 2011; Massé et al., 2010; Zheng et al., 2015). Massé et al. (2010) theorized this trend is not due to the energy content of the biomass changing, but instead due to the digestible material becoming more difficult to access from an increase in non-digestible material.
During a review of various feedstocks under co-digestion, Ma et al. (2020) determined that the mean of CH4 produced via co-digested cattle manure increased by 38%. Zheng et al. (2015) and Awais et al. (2016) reported a CH4 increase from the co-digestion of manure and switchgrass without pretreatment ranged from 25% to 39%. As our largest CH4 increase from co-digestion was less than 6%, our model could be enhanced to capture this synergistic relationship more accurately. This relationship may be better represented if feedstock characterization and calibration was based on experimentation rather than literature. Additionally, integration of gas curves for estimation of the degradation coefficient (d) may represent the co-digestion scenarios more accurately, instead of calculating d. Our biogas prediction model also had a large amount of CO2 present within the biogas, as the CH4 content of the biogas is typically around 55%–80% (Lusk, 1998).
The estimated MFSPs are largely dependent on the gas produced as there is an inverse relationship seen between the gas production rates and MFSPs. The estimated MFSP of co-digestion scenarios may be reduced further if the synergistic relationship was entirely captured within our model. The difference in feedstock price does not have a large impact on the MFSP as more manure is required to reach the VS digester feed. As biochar production increases with larger amounts of biomass utilized, the MFSP further decreases. If the biochar costs were set higher, this offset would be more significant and could favor scenarios with a larger biomass ratio.
Hegde and Trabold (2019) reported integration of the co-digestion of animal manure not only increases the economic efficiency of a commercial-scale AD but also increases system stability. Efficient use of feedstocks and co-digestion implementation can decrease the MFSP of RNG. While the biogas production requires higher capital costs, the additional sales revenue from an increase in RNG produced leads to a lower MFSP. Additionally, with our high CO2 makeup in the biogas from the ADM1 model, our estimation of downstream capital costs may be larger than they would be in reality.
The environmental assessments show a large difference for all impact categories analyzed based on the feedstock used. This is largely due to the manure being an avoided waste, as avoided manure decreases the amount of CH4, nitrous oxide (N2O), and ammonia emitted to the atmosphere (Havukainen et al., 2020; Sajeev et al., 2018). The impacts seen from biomass cultivation can be attributed to the use of resources such as diesel and fertilizers, which can result in ecosystem eutrophication, ozone depletion, and acidification (Larson, 2006; Zah et al., 2007). Additionally, the use of diesel for farm applications can also result in non-carcinogenics, ecotoxicity, and acidification impacts (Ashworth et al., 2015).
Cultivation of perennial biomass crops can have positive effects on the land, apparent by the beneficial impacts within the ecotoxicity category. Perennials established on marginal land can lead to soil improvements such as a decrease in soil erosion and an increase in the amount of atmospheric CO2 captured (Fernando et al., 2018; Guzman et al., 2014; Voigt et al., 2012). Not all biomass requires the same amount of system inputs, as the cultivation of prairie biomass can require lower levels of fertilizer when compared to traditional crops, due partially to efficient absorption within the root system (Cadoux et al., 2012; Hill, 2009). For example, switchgrass was reported to require less diesel fuel, pesticides, herbicides, and phosphorus nutrients than traditional row crops (Ashworth et al., 2015).
Allocation methods are typically based on the physical properties of the products themselves, such as energy or mass. Physical allocation is considered to be the most scientifically sound method of allocation methodology, as it is based on measurable properties of each product, capturing the relationships of the system (Timonen et al., 2019). Economic allocation, dependent on the product’s price, has received criticism for being an unreliable method for impact assignment as it is dependent on the product’s market and human preferences (Wilson et al., 2021). Allocation methods also typically do not consider the use of the product, such as the nutrient capacity of biochar.
Each scenario’s estimated global warming potential falls far below the global warming potential for diesel, estimated at 86 kg CO2 eq./GJ (Department for Transport, 2008). The utilization of RNG as a transportation fuel avoids the production and combustion of traditional diesel on roads (Ardolino et al., 2018). Additionally, RNG as a transportation fuel can improve the local air quality by reducing the particulate matter and N2O emitted when compared to traditional fuel (U.S. EPA, 2024). Patterson et al. (2013) reported the optimization of an RNG system can further reduce CO2 emissions. This relationship may further be seen in our co-digestion LCA results if the ADM1 had further captured the synergistic relationship between cattle manure and prairie biomass.
These results highlight opportunities to leverage co-digestion for reducing costs and environmental impacts of RNG production. Additional strategies that could benefit RNG production include novel reactor designs, electrochemical upgrading technologies, and advanced biomass pretreatment technologies (Uddin and Wright 2023). Future assessments are needed to develop an understanding of the potential for these emerging technologies.
Conclusion
The addition of co-digestion within a system can create better nutrient levels, therefore increasing AD efficiency and higher gas production levels. As seen with B1:M9, this efficiency leads to smaller MFSPs. As our model did not accurately capture the synergistic relationship between manure and prairie biomass, we expected to see this relationship for more co-digestion scenarios at a larger level. Further analysis should be completed on our ADM1 model implementation with additional integration from laboratory analysis. This may help to estimate TEA and LCA parameters more accurately for the co-digestion scenarios. This could also provide additional ADM1 validation for future models adopting ADM1 for similar economic and environmental analysis for real-world applications. Furthermore, additional factors, like reactor configuration, pretreatment methods, and catalysts could be considered to expand ADM1’s capabilities.
While biomass cultivated for co-digestion can increase environmental and health burdens due to the use of resources, prairie biomass can require fewer materials for cultivation than traditional crops. These feedstocks could make an ideal energy crop for co-digestion if the inclusion would increase the efficiency and CH4 production of the system. Establishing prairie biomass can improve ecotoxicity levels by positively influencing the local environment, such as reducing soil erosion. RNG produced from the co-digestion of manure and prairie biomass can increase CH4 levels, avoid environmental and health impacts from manure, and further improve ecosystem health from prairie biomass cultivation.
Data availability statement
The original contributions presented in the study are included in the article/Supplementary Material, further inquiries can be directed to the corresponding author.
Author contributions
KW: Investigation, Writing – original draft. JD: Formal Analysis, Writing – review and editing. LS: Funding acquisition, Writing – review and editing. MM: Supervision, Writing – review and editing.
Funding
The author(s) declare that financial support was received for the research and/or publication of this article. The authors acknowledge USDA-NIFA’s support via funding grant 2020-68012-31824.
Conflict of interest
The authors declare that the research was conducted in the absence of any commercial or financial relationships that could be construed as a potential conflict of interest.
Generative AI statement
The author(s) declare that no Generative AI was used in the creation of this manuscript.
Any alternative text (alt text) provided alongside figures in this article has been generated by Frontiers with the support of artificial intelligence and reasonable efforts have been made to ensure accuracy, including review by the authors wherever possible. If you identify any issues, please contact us.
Publisher’s note
All claims expressed in this article are solely those of the authors and do not necessarily represent those of their affiliated organizations, or those of the publisher, the editors and the reviewers. Any product that may be evaluated in this article, or claim that may be made by its manufacturer, is not guaranteed or endorsed by the publisher.
Supplementary material
The Supplementary Material for this article can be found online at: https://www.frontiersin.org/articles/10.3389/fbioe.2025.1651510/full#supplementary-material
References
Archontoulis, S. V., Huber, I., Miguez, F. E., Thorburn, P. J., Rogovska, N., and Laird, D. A. (2016). A model for mechanistic and system assessments of biochar effects on soils and crops and trade-offs. GCB Bioenergy 8 (6), 1028–1045. doi:10.1111/gcbb.12314
Ardolino, F., Parrillo, F., and Arena, U. (2018). Biowaste-to-biomethane or biowaste-to-energy? An LCA study on anaerobic digestion of organic waste. J. Clean. Prod. 174, 462–476. doi:10.1016/j.jclepro.2017.10.320
Ashworth, A. J., Taylor, A. M., Reed, D. L., Allen, F. L., Keyser, P. D., and Tyler, D. D. (2015). Environmental impact assessment of regional switchgrass feedstock production comparing nitrogen input scenarios and legume-intercropping systems. J. Clean. Prod. 87, 227–234. doi:10.1016/j.jclepro.2014.10.002
Awais, M., Alvarado-Morales, M., Tsapekos, P., Gulfraz, M., and Angelidaki, I. (2016). Methane production and kinetic modeling for Co-digestion of manure with lignocellulosic residues. Energy fuels. 30 (12), 10516–10523. doi:10.1021/acs.energyfuels.6b02105
Backus, W. M. (2014). Performance of beef cattle grazing native warm-season grasses in an integrated forage/biofuels System in the mid-south. University of Tennessee. Master’s Thesis. Available online at: https://trace.tennessee.edu/utk_gradthes/3137.
Bare, J. C. (2011). TRACI 2.0 – the tool for the Reduction and assessment of chemical and other environmental impacts. Clean Technol. Environ. Policy 13 (5), 687–696. doi:10.1007/s10098-010-0338-9
Batstone, D. J., Keller, J., Angelidaki, I., Kalyuzhnyi, S. V., Pavlostathis, S. G., Rozzi, A., et al. (2002). The IWA anaerobic digestion model No 1 (ADM1). Water Sci. Technol. 45 (10), 65–73. doi:10.2166/wst.2002.0292
Bhatt, A. H., and Tao, L. (2020). Economic perspectives of biogas production via anaerobic digestion. Bioengineering 7 (3), 74, doi:10.3390/bioengineering7030074
Biernacki, P., Steinigeweg, S., Borchert, A., Uhlenhut, F., and Brehm, A. (2013). Application of anaerobic digestion model no. 1 for describing an existing biogas power plant. Biomass Bioenergy 59, 441–447. doi:10.1016/j.biombioe.2013.08.034
Bułkowska, K., Białobrzewski, I., Gusiatin, Z. M., Klimiuk, E., and Pokój, T. (2015). ADM1-based modeling of anaerobic codigestion of maize silage and cattlemanure –a feedstock characterisation for model implementation (Part I). Archives Environ. Prot. 41 (3), 11–19. doi:10.1515/aep-2015-0027
Butkutė, B., Lemežienė, N., Cesevičienė, J., Liatukas, Z., and Dabkevičienė, G. (2013). Carbohydrate and lignin partitioning in switchgrass biomass (Panicum virgatum L.) as a bioenergy feedstock. Zemdirbyste-Agriculture 100, 251–260. doi:10.13080/z-a.2013.100.032
Cadoux, S., Riche, A. B., Yates, N. E., and Machet, J.-M. (2012). Nutrient requirements of miscanthus x giganteus: conclusions from a review of published studies. Biomass Bioenergy 38, 14–22. doi:10.1016/j.biombioe.2011.01.015
Chen, X., Chen, Z., Wang, X., Huo, C., Hu, Z., Xiao, B., et al. (2016). Application of ADM1 for modeling of biogas production from anaerobic digestion hydrilla verticillate. Bioresour. Technol. 211, 101–107. doi:10.1016/j.biortech.2016.03.002
Cortes-Peña, Y. (2022). BioSTEAM: the biorefinery simulation and techno-economic analysis modules. Available online at: https://github.com/yoelcortes/biosteam.
Department for Transport (2008). Carbon and sustainability reporting within the renewable transport obligation. London, U.K: Requirement and Guidance Government Recommendations to the Office of the Renewable Fuels Agency.
Dien, B. S., Jung, H. J. G., Vogel, K. P., Casler, M. D., Lamb, J. A. F. S., Iten, L., et al. (2006). Chemical composition and response to dilute-acid pretreatment and enzymatic saccharification of alfalfa, reed canarygrass, and switchgrass. Biomass Bioenergy 30 (10), 880–891. doi:10.1016/J.BIOMBIOE.2006.02.004
Ding, Y., Liu, Y., Liu, S., Li, Z., Tan, X., Huang, X., et al. (2016). Biochar to improve soil fertility. A review. Agron. Sustain. Dev. 36 (36), 36. doi:10.1007/s13593-016-0372-z
Ecoinvent (2025). Database v3. Available online at: https://ecoinvent.org/.
Edmonds, P., Franz, K. J., Heaton, E. A., Kaleita, A. L., Soupir, M. L., and VanLoocke, A. (2021). Planting miscanthus instead of row crops may increase the productivity and economic performance of farmed potholes. GCB Bioenergy 13 (9), 1481–1497. doi:10.1111/gcbb.12870
Emebu, S., Pecha, J., and Janáčová, D. (2022). Review on anaerobic digestion models: model classification and elaboration of process phenomena. Renew. Sustain. Energy Rev. 160, 112288. doi:10.1016/J.RSER.2022.112288
Fernandes, T. V., Klaasse Bos, G. J., Zeeman, G., Sanders, J. P. M., and van Lier, J. B. (2009). Effects of thermo-chemical pre-treatment on anaerobic biodegradability and hydrolysis of lignocellulosic biomass. Bioresour. Technol. 100 (9), 2575–2579. doi:10.1016/J.BIORTECH.2008.12.012
Fernando, A. L., Costa, J., Barbosa, B., Monti, A., and Rettenmaier, N. (2018). Environmental impact assessment of perennial crops cultivation on marginal soils in the Mediterranean Region. Biomass Bioenergy 111, 174–186. doi:10.1016/j.biombioe.2017.04.005
Frigon, J. C., Mehta, P., and Guiot, S. R. (2012). Impact of mechanical, chemical and enzymatic pre-treatments on the methane yield from the anaerobic digestion of switchgrass. Biomass Bioenergy 36, 1–11. doi:10.1016/J.BIOMBIOE.2011.02.013
Gaballah, E. S., Abomohra, A. E. F., Xu, C., Elsayed, M., Abdelkader, T. K., Lin, J., et al. (2020). Enhancement of biogas production from rape straw using different co-pretreatment techniques and anaerobic co-digestion with cattle manure. Bioresour. Technol. 309, 123311. doi:10.1016/J.BIORTECH.2020.123311
Glivin, G., and Sekhar, S. J. (2018). “Techno-economic studies on implementation of biogas plant for the energy requirement in an education institution,” in 4th International Conference on Energy Efficient Technologies for Sustainability – ICEETS’19.
Groom, M. J., Gray, E. M., and Townsend, P. A. (2008). Biofuels and biodiversity: principles for creating better policies for biofuel production. Conserv. Biol. 22 (3), 602–609. doi:10.1111/j.1523-1739.2007.00879.x
Guzman, J. G., Lal, R., Byrd, S., Apfelbaum, S. I., and Thompson, R. L. (2014). Carbon life cycle assessment for prairie as a crop in reclaimed mine land. Land Degrad. Dev. 27, 1196–1204. doi:10.1002/ldr.2291
Hagos, K., Zong, J., Li, D., Liu, C., and Lu, X. (2017). Anaerobic co-digestion process for biogas production: progress, challenges and perspectives. Renew. Sustain. Energy Rev. 76, 1485–1496. doi:10.1016/J.RSER.2016.11.184
Han, J., Elgowainy, A., Dunn, J. B., and Wang, M. Q. (2013). Life cycle analysis of fuel production from fast pyrolysis of biomass. Bioresour. Technol. 133, 421–428. doi:10.1016/j.biortech.2013.01.141
Havukainen, J., Väisänen, S., Rantala, T., Saunila, M., and Ukko, J. (2020). Environmental impacts of manure management based on life cycle assessment approach. J. Clean. Prod. 264, 121576. doi:10.1016/j.jclepro.2020.121576
Hegde, S., and Trabold, T. A. (2019). Anaerobic digestion of food waste with unconventional Co-Substrates for stable biogas production at high organic loading rates. Sustainability 11 (14), 3875. doi:10.3390/su11143875
Hill, J. (2009). “Environmental costs and benefits of transportation biofuel production from food-and lignocellulose-based energy crops: a review. Agron. Sustain. Dev. 27, 1–12. doi:10.1007/978-90-481-2666-8_10
ISO (2006a). ISO 14040: 2006 Environmental Management-Life cycle assessment – principles and framework (ISO 14040). Geneve: ISO.
ISO (2006b). ISO 14044: 2006 environmental management-life cycle assessment – life cycle impact assessment (ISO 14044). Geneve: ISO.
Jabłoński, S. J., Biernacki, P., Steinigeweg, S., and Lukaszewicz, M. (2015). Continuous mesophilic anaerobic digestion of manure and rape oilcake – experimental and modelling study. J. Waste Manag. 35, 105–110. doi:10.1016/J.WASMAN.2014.09.011
Kafle, G. K., and Chen, L. (2016). Comparison on batch anaerobic digestion of five different livestock manures and prediction of biochemical methane potential (BMP) using different statistical models. J. Waste Manag. 48, 492–502. doi:10.1016/J.WASMAN.2015.10.021
Karki, R., Chuenchart, W., Surendra, K. C., Shrestha, S., Raskin, L., Sung, S., et al. (2021). Anaerobic co-digestion: current status and perspectives. Bioresour. Technol. 330, 125001. doi:10.1016/J.BIORTECH.2021.125001
Khanchi, A., and Birrell, S. (2017). Drying models to estimate moisture change in switchgrass and corn stover based on weather conditions and swath density. Agric. For. Meteorol. 237: 1–8.
Kieffer, C., Hui, D., Matamala, R., Li, J., Tyler, D., and Dzantor, E. K. (2023). Evaluation of eastern gamagrass as dual-purpose complementary bioenergy and forage feedstock to switchgrass. GCB Bioenergy 15, 776–790. doi:10.1111/gcbb.13054
Klimiuk, E., Mariusz, Z., Bułkowska, K., Pokój, T., and Rynkowska, S. (2015). ADM1-based modeling of anaerobic codigestion of maize silage and cattle manure – a feedstock characterization for model implementation (part I). Environ. Prot. 41 (3), 11–19. doi:10.1515/aep-2015-0026
Koch, K., Lübken, M., Gehring, T., Wichern, M., and Horn, H. (2010). Biogas from grass silage – measurements and modeling with ADM1. Bioresour. Technol. 101 (21), 8158–8165. doi:10.1016/J.BIORTECH.2010.06.009
Krohn, B. (2015). Switching to switchgrass: pathways and consequences of bioenergy switchgrass entering the Midwestern landscape. ProQuest Dissertations and Theses Global. Available online at: https://www.proquest.com/dissertations-theses/switching-switchgrass-pathways-consequences/docview/1845003505/se-2.
Kunatsa, T., and Xia, X. (2022). A review on anaerobic digestion with focus on the role of biomass co-digestion, modelling and optimisation on biogas production and enhancement. Bioresour. Technol. 344, 126311. doi:10.1016/J.BIORTECH.2021.126311
Labatut, R. A., Angenent, L. T., and Scott, N. R. (2011). Biochemical methane potential and biodegradability of complex organic substrates. Bioresour. Technol. 102 (3), 2255–2264. doi:10.1016/j.biortech.2010.10.035
Laird, D. A., Brown, R. C., Amonette, J. E., and Lehmann, J. (2009). Review of the pyrolysis platform for coproducing bio-oil and biochar. Biofuel Bioprod. Biorefin. 3 (5): 547–562. doi:10.1002/bbb.169
Lark, T. J. (2020). Protecting our prairies: research and policy actions for conserving america’s grasslands. Land Use Policy 97, 104727, doi:10.1016/j.landusepol.2020.104727
Larson, E. D. (2006). A review of life-cycle analysis studies on liquid biofuel systems for the transport sector. Energy Sustain. Dev. 10 (2), 109–126. doi:10.1016/S0973-0826(08)60536-0
Lee, M., Lin, Y.-L., Chiueh, P.-T., and Den, W. (2020). Environmental and energy assessment of biomass residues to biochar as fuel: a brief review with recommendations for future bioenergy systems. J. Clean. Prod. 251, 119714. doi:10.1016/j.jclepro.2019.119714
Li, H., Chen, Z., Fu, D., Wang, Y., Zheng, Y., and Li, Q. (2020). Improved ADM1 for modelling C, N, P fates in anaerobic digestion process of pig manure and optimization approaches to biogas production. Renew. Energy 146, 2330–2336. doi:10.1016/J.RENENE.2019.08.086
Li, Y., Jin, S., Xin, X., An, Y., Huo, L., Shao, C., et al. (2025). From life cycle assessment to grass-based agriculture: a review and application. Grassl. Res. 4 (2), 161–174. doi:10.1002/glr2.70007
Liao, W., Frear, C., and Chen, S. (2007). Biomass inventory technology and economics assessment (publication no. 07-07-025). Ecology. Available online at: https://apps.ecology.wa.gov/publications/documents/0707025.pdf.
Liu, T., Sun, L., Müller, B., and Schnürer, A. (2017). Importance of inoculum source and initial community structure for biogas production from agricultural substrates. Bioresour. Technol. 245, 768–777. doi:10.1016/j.biortech.2017.08.213
Long, F., Xu, M., Liao, W., and Liu, H. (2025) Machine learning for predicting and optimizing the performance of a commercial-scale anaerobic digester with diverse feedstocks and operating conditions. Bioresour. Technol., 435, 132940, doi:10.1016/j.biortech.2025.132940
Lübken, M., Wichern, M., Schlattmann, M., Gronauer, A., and Horn, H. (2007). Modelling the energy balance of an anaerobic digester fed with cattle manure and renewable energy crops. Water Res. 41 (18), 4085–4096. doi:10.1016/j.watres.2007.05.061
Lucas, D. M., Fontenot, J. P., and Webb, K. E. (1975). Composition and digestibility of cattle fecal waste. Anim. Sci. J. 41 (5), 1480–1486. doi:10.2527/jas1975.4151480x
Lusk, P. (1998). Methane recover from animal manure. United States: The Current Opportunities Casebook. doi:10.2172/9526
Ma, G., Ndegwa, P., Harrison, J. H., and Chen, Y. (2020). Methane yields during anaerobic co-digestion of animal manure with other feedstocks: a meta-analysis. Sci. Total Environ. 728, 138224. doi:10.1016/J.SCITOTENV.2020.138224
Massé, D., Gilbert, Y., Savoie, P., Bélanger, G., Parent, G., and Babineau, D. (2010). Methane yield from switchgrass harvested at different stages of development in eastern Canada. Bioresour. Technol. 101 (24), 9536–9541. doi:10.1016/J.BIORTECH.2010.07.018
McLaughlin, S. B., De La Torre Ugarte, D. G., Garten, C. T., Lynd, L. R., Sanderson, M. A., Tolbert, V. R., et al. (2002). High-value renewable energy from prairie grasses. Environ. Sci. Technol. 36 (10), 2122–2129. doi:10.1021/es010963d
Miliotti, E., Casini, D., Rosi, L., Lotti, G., Rizzo, A. M., and Chiaramonti, D. (2020). Lab-scale pyrolysis and hydrothermal carbonization of biomass digestate: characterization of solid products and compliance with biochar standards. Biomass Bioenergy 139, 105593. doi:10.1016/J.BIOMBIOE.2020.105593
Mo, R., Guo, W., Batstone, D., Makinia, J., and Li, Y. (2023). Modifications to the anaerobic digestion model no. 1 (ADM1) for enhanced understanding and application of the anaerobic treatment processes – a comprehensive review. Water Res. 244, 120504. doi:10.1016/J.WATRES.2023.120504
Moore, K. J., and Buxton, D. R. (2000). “Fiber Composition and Digestion of Warm-Season Grasses.” In Native Warm-Season Grasses: Research Trends and Issues, 30: 23–33.
Moset, V., Fontaine, D., and Møller, H. B. (2017). Co-digestion of cattle manure and grass harvested with different technologies. Effect on methane yield, digestate composition and energy balance. Energy 141, 451–460. doi:10.1016/J.ENERGY.2017.08.068
Müller, Z. O. (1980). Feed from animal wastes: state of knowledge. technical report No. 18, FAO animal production and health papers Food and Agriculture Organization of the United Nations (FAO).
Nadji, H., Diouf, P. N., Benaboura, A., Bedard, Y., Riedel, B., and Stevanovic, T. (2009). Comparative study of lignins isolated from alfa grass (Stipa tenacissima L.). Bioresour. Technol. 100 (14), 3585–3592. doi:10.1016/j.biortech.2009.01.074
Neshat, S. A., Mohammadi, M., Najafpour, G. D., and Lahijani, P. (2017). Anaerobic co-digestion of animal manures and lignocellulosic residues as a potent approach for sustainable biogas production. Renew. Sustain. Energy Rev. 79, 308–322. doi:10.1016/J.RSER.2017.05.137
Niu, H., Kong, X., Li, L., Sun, Y., Yuan, Z., and Zhou, X. (2015). Analysis of biogas produced from switchgrass by anaerobic digestion. BioRes 10 (4), 7178–7187. doi:10.15376/biores.10.4.7178-7187
Ogunlade, J. M. (2012). Digestibility of different multi-species nativewarm-season grass mixtures grown in varied harvest regimen. Master's Thesis, Mississippi State University.
Olafasakin, O., Audia, E. M., Mba-Wright, M., Tyndall, J. C., and Schulte, L. A. (2024). Techno-economic and life cycle analysis of renewable natural gas derived from anaerobic digestion of grassy biomass: a us corn belt watershed case study. GCB Bioenergy 16 (6), e13164, doi:10.1111/gcbb.13164
Oloyede, B. (2013). Nutritional profile of native warm-season grass grown as a mono-or multi-species pasture. Master's Thesis, Mississippi State University.
Olsen, T., and Leibold, K. (2022). Value of manure nutrients. extension publication. iowa state university extension and outreach. Available online at: https://www.extension.iastate.edu/agdm/livestock/pdf/b1-65.pdf.
OpenLCA (2025). Database v2. Available online at: https://www.openlca.org/.
Patterson, T., Esteves, S., Dinsdale, R., Guwy, A., and Maddy, J. (2013). Life cycle assessment of biohydrogen and biomethane production and utilisation as a vehicle fuel. Bioresour. Technol. 131, 235–245. doi:10.1016/j.biortech.2012.12.109
Paul, S., and Dutta, A. (2018). Challenges and opportunities of lignocellulosic biomass for anaerobic digestion. Resour. Conservation Recycl. 130, 164–174. doi:10.1016/j.resconrec.2017.12.005
Pearson, H. A., Grelen, H. E., Epps, E. A., Johnson, M. K., and Blakewood, B. W. (1982). Botanical composition and nutritive value of cattle diets on southern pine range. USDA forest service, research paper SO-178. Available online at: https://www.srs.fs.usda.gov/pubs/rp/uncaptured/rp_so178.pdf.
Poggio, D., Walker, M., Nimmo, W., Ma, L., and Pourkashanian, M. (2016). Modelling the anaerobic digestion of solid organic waste – substrate characterisation method for ADM1 using a combined biochemical and kinetic parameter estimation approach. J. Waste Manag. 53, 40–54. doi:10.1016/J.WASMAN.2016.04.024
Rahic, E., Hess, C. J., Brown, R. C., and Wen, Z. (2024). Enhanced anaerobic digestion of prairie biomass through alkaline-based hydroxycinnamic acid extraction. Bioresour. Technol. Rep. 27, 101896, doi:10.1016/j.biteb.2024.101896
Rajendran, K., Browne, J. D., and Murphy, J. D. (2019). What is the level of incentivization required for biomethane upgrading technologies with carbon capture and reuse? Renew. Energy 13133, 951–963. doi:10.1016/j.renene.2018.10.091
Rhodes, C. J. (2017). The imperative for regenerative agriculture. Science progress 100 (1), 80–129.
Rosén, C., and Jeppsson, U. (2006). Aspects on ADM1 implementation within the BSM2 framework. Lund, Sweden: Department of Industrial Electrical Engineering and Automation, Lund University, 1–35.
Sajeev, E. P. M., Winiwarter, W., and Amon, B. (2018). Greenhouse gas and ammonia emissions from different stages of liquid manure management chains: abatement options and emission interactions. J. Environ. Qual. 47, 30–41. doi:10.2134/jeq2017.05.0199
Schouten, S., van Groenigen, J. W., Oenema, O., and Cayuela, M. L. (2012). Bioenergy from cattle manure? Implications of anaerobic digestion and subsequent pyrolysis for carbon and nitrogen dynamics in soil. GCB Bioenergy 4, 751–760. doi:10.1111/j.1757-1707.2012.01163.x
Schulte, L. A., Niemi, J, Helmers, M. J., Liebman, M., Arbuckle, J. G., James, D. E., et al. (2017). Prairie strips improve biodiversity and the delivery of multiple ecosystem services from corn–soybean croplands. Proc. Natl. Acad. Sci. 114 (42), 11247–11252. doi:10.1073/pnas.1620229114
Seepaul, R., Macoon, B., Reddy, K. R., and Evans, W. B. (2016). First harvest timing and nitrogen application rate effects on chemical composition and ethanol yield of switchgrass. Crop Forage Turfgrass Manage. 2, 1–16. doi:10.2134/cftm2015.0163
Shi, X.-S., Yuan, X.-Z., Wang, Y.-P., Zeng, S.-J., Qiu, Y.-L., Guo, R.-B., et al. (2014). Modeling of the methane production and pH value during the anaerobic co-digestion of dairy manure and spent mushroom substrate. J. Chem. Eng. 244, 258–263. doi:10.1016/j.cej.2014.02.007
Thamsiriroj, T., and Murphy, J. D. (2011). Modelling mono-digestion of grass silage in a 2-stage CSTR anaerobic digester using ADM1. Bioresour. Tehnol. 102 (2), 948–959. doi:10.1016/j.biortech.2010.09.051
Thengane, S. K., Kung, K., Hunt, J., Gilani, H. R., Lim, C. J., Sokhansanj, S., et al. (2021). Market prospects for biochar production and application in California. Biofpr 15 (6), 1802–1819. doi:10.1002/bbb.2280
Timonen, K., Sinkko, T., Luostarinen, S., Tampio, E., and Joensuu, K. (2019). LCA of anaerobic digestion: emission allocation for energy and digestate. J. Clean. Prod. 235, 1567–1579. doi:10.1016/J.JCLEPRO.2019.06.085
Tsapekos, P., Kougias, P. G., Kuthiala, S., and Angelidaki, I. (2018). Co-digestion and model simulations of source separated municipal organic waste with cattle manure under batch and continuously stirred tank reactors. Energy Convers. Manag. 159, 1–6. doi:10.1016/J.ENCONMAN.2018.01.002
Uddin, M. M., Wen, Z., and Mba Wright, M. M. (2022). Techno-economic and environmental impact assessment of using corn stover biochar for manure derived renewable natural gas production. Appl. Energy 321, 119376, doi:10.1016/j.apenergy.2022.119376
Uddin, M. M., and Wright, M. M. (2023). Anaerobic digestion fundamentals, challenges, and technological advances. Phys. Sci. Rev. 8 (9), 2819–2837. doi:10.1515/psr-2021-0068
U.S. EPA (2023). AgSTAR data and trends. Available online at: https://www.epa.gov/agstar/agstar-data-and-trends.
U.S. EPA (2024). Renewable natural gas. Available online at: https://www.epa.gov/lmop/renewable-natural-gas.
Usack, J. G., van Doren, L. G., Posmanik, R., Tester, J. W., and Angenent, L. T. (2019). Harnessing anaerobic digestion for combined cooling, heat, and power on dairy farms: an environmental life cycle and techno-economic assessment of added cooling pathways. J. Dairy Sci. 102 (4), 3630–3645. doi:10.3168/JDS.2018-15518
USDA (2008). Natural resources conservation service booneville plant materials center. Qual. Param. Five Indiangrass Cultiv. Available online at: https://www.nrcs.usda.gov/plantmaterials/arpmctn8014.pdf.
Varol, A., and Ugurlu, A. (2017). Comparative evaluation of biogas production from dairy manure and co-digestion with maize silage by CSTR and new anaerobic hybrid reactor. Environ. Sci. Ecotechnology 17, 402–412. doi:10.1002/elsc.201500187
Voigt, T. B., Lee, D. K., and Kling, G. J. (2012). Perennial herbaceous crops with potential for biofuel production in the temperate regions of the USA. CAB Rev. Perspect. Agric. Veterinary Sci. Nutr. Nat. Resour. 7, 1–13. doi:10.1079/PAVSNNR20127015
Waller, G. R., Nelson, A. B., and Morrison, R. D. (1972). Chemical composition of native grasses in central Oklahoma from 1947 to 1962. Oklahoma agricultural experiment station. Bulletin No. 697. Available online at: https://shareok.org/bitstream/handle/11244/332001/oksa_B-697_1972-01.pdf?sequence=1&isAllowed=y.
Wang, C., Luo, D., Zhang, X., Huang, R., Cao, Y., Liu, G., et al. (2022). Biochar-based slow-release of fertilizers for sustainable agriculture: a mini review. Environ. Sci. Ecotechnology 10, 100167. doi:10.1016/J.ESE.2022.100167
Wani, S. S., and Parveez, M. (2025) Synergistic effects of anaerobic digestion for diverse feedstocks: a holistic study on feedstock properties, process efficiency, biogas yield, and economic viability. Energy Sustain Dev. 87, 101755, doi:10.1016/j.esd.2025.101755
Weinrich, S., and Nelles, M. (2021). Systematic simplification of the anaerobic digestion model no. 1 (ADM1) – model development and stoichiometric analysis. Bioresour. Technol. 333, 125124. doi:10.1016/j.biortech.2021.125124
Wichern, M., Lübken, M., Koch, K., Gehring, T., Horn, H., and Fischer, K. (2007). Eignung des anaerobic digestion model no. 1 (adm 1) zur prozesssteuerung landwirtschaftlicher biogasanlagen (suitability of the anaerobic digestion model no. 1 (ADM 1) for process control of agricultural biogas plants). Fachagentur, 172–194.
Wichern, M., Gehring, T., Fischer, K., Andrade, D., Lübken, M., Koch, A., et al. (2009). Monofermentation of grass silage under mesophilic conditions: measurements and mathematical modeling with ADM 1. Bioresour. Technol. 100, 1675–1681. doi:10.1016/j.biortech.2008.09.030
Wild, K., Rahic, E., Schulte, L. A., and Wright, M. M. (2024). Techno-economic and environmental assessment of converting mixed prairie to renewable natural gas with co-product hydroxycinnamic acid. GCB Bioenergy 19, 288–304. doi:10.1002/bbb.2710
Wilson, N., Meiklejohn, E., Overton, B., Robinson, F., Farjana, S. H., Li, W., et al. (2021). A physical allocation method for comparative life cycle assessment: a case study of repurposing Australian electric vehicle batteries. RCR Adv. 174, 105759. doi:10.1016/J.RESCONREC.2021.105759
Wright, M. M., and Brown, R. C. (2007). Establishing the optimal sizes of different kinds of biorefineries. Biofuel Bioprod. Biorefin. 1 (3), 191–200. doi:10.1002/bbb.25
Xie, S., Hai, F. I., Zhan, X., Guo, W., Ngo, H. H., Price, W. E., et al. (2016). Anaerobic co-digestion: a critical review of mathematical modelling for performance optimization. Bioresour. Technol. 222, 498–512. doi:10.1016/J.BIORTECH.2016.10.015
Zah, R., Boeni, H., Gauch, M., Hischier, R., Lehmann, M., and Waeger, P. (2007). Life cycle assessment of energy products: environmental impact assessment of biofuels. Switzerland.
Zheng, Z., Liu, J., Yuan, X., Wang, X., Zhu, W., Yang, F., et al. (2015). Effect of dairy manure to switchgrass co-digestion ratio on methane production and the bacterial community in batch anaerobic digestion. Appl. Energy. 151, 249–257. doi:10.1016/j.apenergy.2015.04.078
Keywords: ADM1, anaerobic co-digestion, renewable natural gas, techno-economic analysis, life cycle assessment
Citation: Wild K, Dominguez JC, Moore LS and Mba Wright M (2025) Advancing the predictive techno-economic and lifecycle assessment of prairie grass and manure co-digestion for renewable natural gas applications. Front. Bioeng. Biotechnol. 13:1651510. doi: 10.3389/fbioe.2025.1651510
Received: 21 June 2025; Accepted: 29 August 2025;
Published: 30 September 2025.
Edited by:
Bikram Basak, Hanyang University, Republic of KoreaReviewed by:
Jiangxin Wang, Shenzhen University, ChinaMuhammad Yousuf Jat Baloch, Shandong University, China
Copyright © 2025 Wild, Dominguez, Moore and Mba Wright. This is an open-access article distributed under the terms of the Creative Commons Attribution License (CC BY). The use, distribution or reproduction in other forums is permitted, provided the original author(s) and the copyright owner(s) are credited and that the original publication in this journal is cited, in accordance with accepted academic practice. No use, distribution or reproduction is permitted which does not comply with these terms.
*Correspondence: Mark Mba Wright, bWFya213QGlhc3RhdGUuZWR1