 Dominik Mojzita1
 Nina Aro1
 Juha Kontturi1
 Martin Kögler2Emilia Nordlund1
 Waltteri Hosia1
 Marco G. Casteleijn1*
- 1VTT Technical Research Centre Finland, Espoo, Finland
- 2VTT Technical Research Centre Finland, Oulu, Finland
Brazzein, a small, pH-stable, and heat-stable sweet protein, is a promising alternative to sucrose because of its extreme sweetness and stability. However, large-scale production through traditional extraction methods from plant sources is not economically feasible. To this end, the current study explores the production of recombinant brazzein in the filamentous fungus Trichoderma reesei using a synthetic expression system (SES) and the native fungal cbh1 promoter. Both methods successfully expressed brazzein in 24-well liquid cultures, with the SES-system achieving a production level of ∼1.3 g/L in bioreactor cultures. The protein was purified and characterized using SDS-PAGE, liquid chromatography high-content mass spectroscopy (LC-HCMS), Timegated™ Raman spectroscopy, dynamic light scattering (DLS), and nanoscale differential scanning fluorimetry (nanoDSF). The results confirmed that the correct folding and stability of brazzein attributed to its robust internal structure, demonstrating the potential of T. reesei as an efficient host for producing this sweet protein.
1 Introduction
Sweet proteins are a group of structurally diverse proteins with no shared sequence similarity. They differ in molecular size and sweetness potency, but they are generally small (6.4 kDa–22.2 kDa) and are 500–4,000 times sweeter than sucrose (w/w) (Leone et al., 2016; Picone and Temussi, 2012). To date, eight sweet proteins have been identified: brazzein (Ming and Hellekant, 1994), thaumatin (van der Wel et al., 1975), monellin (INGLETT and MAY, 1969), miraculin (Takahashi et al., 1990), pentadin (Faus, 2000), mabinlin (Liu et al., 1993), curculin (Harada et al., 1994), and lysozyme (Maehashi and Udaka, 1998). Most of these proteins have been purified from tropical plants of South Asia or Africa, except lysozyme which is derived from egg white.
Brazzein is the smallest naturally occurring sweet protein, measuring only 6.4 kDa in size. The monomer consists of 54 amino acids and was first isolated from the fruit of Pentadiplandra brazzeana, also known as oubli, found in West Africa. Brazzein, in its powder form, is 2,000 times sweeter than a 2% (w/v) sucrose solution (Izawa et al., 1996). Whereas brazzein is derived from the fresh form of the fruit, another sweet protein, pentadin, is extracted from the heat-dried form of the fruit. Pentadin is the cross-linked, non-native form of brazzein, with twice the molecular weight and considerably reduced sweetness compared to brazzein (Assadi-Porter et al., 2000). Extracted brazzein is heterogeneous and consists of two structurally different forms. The majority of brazzein has a pyroglutamic acid (pGlu) at the amino-terminal residue; the minor version has the same sequence but lacks the amino-terminal residue (des-pGlu1-brazzein) (Ming and Hellekant, 1994). The sweetness of des-pGlu1-brazzein is approximately twice that of pGlu1-brazzein (Assadi-Porter et al., 2000). Correct folding of this small protein is crucial for its functionality and binding to taste receptors (Temussi, 2011; Zhao et al., 2021).
Brazzein is highly stable; it remains folded up to ∼85 °C and retains some of its sweetness at above 80 °C, but only ∼20% at 100 °C (Zuo et al., 2024). 1H NMR spectroscopy studies have revealed that the structure of brazzein (Figure 1) is compact, containing two short α-helices and three β-sheets linked together by four disulfide bridges and loops, which explains its thermal and pH stability (Caldwell et al., 1998; Ming and Hellekant, 1994). The brazzein structure also contains three loops (loop I, residues 9–19; loop II, residues 30–33; and loop III, residues 38–45). These loops and the N- and C-terminal regions of the protein have been identified as responsible for the sweetness of brazzein since they are involved in the interactions between brazzein and the sweet-tasting receptor (Assadi-Porter et al., 2010). Brazzein interacts with the G protein-coupled T1R2–T1R3 sweet receptor in a specific binding mode, as described earlier (Moralejo et al., 2001; Temussi, 2011; Tancredi et al., 2004; Yamamoto et al., 2020; Zhao et al., 2021).

Figure 1. Representation of the brazzein protein structure (based on the PDB file 4HE7; image created with ChimeraX v1.10). Green ribboned arrows highlight the β-strands, and magenta highlights the α-helical structures. Shown in yellow, and also indicated by the yellow arrows, are the four disulfide bonds contributing to brazzein’s thermostability. The N-terminal pyroglutamic acid is shown as a stick model. The amino acid sequence is listed directly below the image. The red Q indicates the N-terminal pyroglutamic acid, and the green and magenta boxes correspond to the β-sheet and α-helical structures in the structural image, respectively.
Sweet proteins are potential low-calorie substitutes for sugar and traditional sweeteners in the food and the pharmaceutical industries. However, major hurdles include limited extraction from fruits and low recombinant yields. The concentration of brazzein in ripe fruits is approximately 0.02%–0.5% by weight (Hellekant and Danilova, 2005), whereas the typical yields in precision fermentation in yeasts and bacteria (Kaplan Türköz et al., 2022), transgenic maize or carrots (Lamphear et al., 2005; Han et al., 2022), or the milk of transgenic mice (Yan et al., 2013) have ranged from micrograms to 0.345 g/L. The loss of sweetness has also been observed in recombinant protein samples (Assadi-Porter et al., 2000; Berlec et al., 2006), indicative of protein misfolding.
The filamentous fungus Trichoderma reesei has been used for the production of many different proteins, such as cellulases, amylases, xylanases, and proteases (Druzhinina and Kubicek, 2017; Mäntylä et al., 2007; Miettinen-Oinonen and Suominen, 2002); interferon alpha-2b (Landowski et al., 2016); and food proteins (Aro et al., 2023). Due to its ability to secrete proteins at yields as high as 100 g/L (Cherry and Fidantsef, 2003) and its GRAS status, Trichoderma is widely used in industrial processes.
Here, we utilized engineered T. reesei QM9414 strains for brazzein production in 24-well plates (batch phase) and in a 250-mL fed-batch fermentation system. Product identity and folding were assessed using liquid chromatography high-content mass spectroscopy (LC-HCMS), circular dichroism (CD) spectroscopy, nanoscale differential scanning fluorimetry (nanoDSF), and Timegated™ Raman spectroscopy. Long-term stability after 24 months at 4 °C–8 °C was evaluated using dynamic light scattering (DLS).
2 Materials and methods
All chemicals were obtained from Sigma-Aldrich (United States), unless otherwise specified.
2.1 Strains
Escherichia coli DH5α (Life Technologies) was used for the propagation of the plasmids. T. reesei strain M1908 was obtained from the strain developed by the VTT Technical Research Centre of Finland. The M1908 strain was generated from the M124 strain by sequentially deleting 11 secreted proteases as described before (Aro et al., 2023). Spore suspensions were prepared by cultivating the fungus on potato-dextrose (PD) plates (BD, Sparks, Maryland, United States) for 5 days, after which the spores were harvested; suspended in buffer A containing: 0.8% NaCl, 0.025% Tween-20, and 20% glycerol; filtered through cotton; and stored at −80 °C.
2.2 Molecular biology
To construct brazzein expression vectors, T. reesei codon-optimized gene fragments encoding brazzein with either the HFBI signal sequence or the CBHI carrier were obtained from a synthetic gene provider (GenScript Biotech, the Netherlands). Both fragments were cloned into PacI-linearized SES-vector pAWP145 (Aro et al., 2023) to generate expression vectors pSWP3 and pSWP4, respectively, by GenScript Biotech according to their proprietary methods (see Supplementary Figure S1). For expression from cbh1 promoter, the carrier containing the fragment was cloned into PacI-linearized pAWP128 vector to generate the expression plasmid pSWP10. The expression cassettes were liberated from the plasmids with PmeI restriction enzyme and purified from agarose gel.
2.2.1 Trichoderma transformation
To generate brazzein production strains, the M1908 strain was transformed with pSWP3, pSWP4, and pSWP10 expression cassettes using CRISPR/Cas9 transformation (Che, 2003; Makarova et al., 2013), targeting egl1 and cbh1 loci as described earlier (Rantasalo et al., 2019). The primers used for targeted integration and PCR screening are listed in Supplementary Table S2. Hygromycin was used as the selection marker for transformations with the SES-expression constructs, whereas the pyr4 selection marker was used for the transformation with the cbh1-promoter-containing construct.
Correct integration of the expression cassettes was assessed with PCR (3′- and 5′-ends and deletion of the egl1 or cbh1 ORF (Supplementary Table S2). The selected transformants were purified through single-colony plating. The best performing clones were grown on PD plates to induce spore formation. Spores were harvested and then suspended and stored in buffer A at −80 °C until further use.
2.2.2 Protein expression and sample preparation
For protein expression, transformants were cultivated in 3 mL within 10 mL 24-well plates (Cytiva, United States) for 5 days (28 °C, 200 RPM) and sampled at days 3, 4, and 5. The plates were sealed with a paper seal to allow maximal oxygen transfer to the cultivation broth under constant agitation in the incubator-shaker. Cultivations were carried out either in cellulase-inducing spent grain extract-lactose (SGE-lactose) medium or glucose-containing medium (Aro et al., 2023).
Bioreactor cultivations were carried out in 250-mL Ambr reactors (Sartorius, Germany). Prior to the inoculation, cells were pre-cultivated in 250-mL Erlenmeyer flasks for 2 days (28 °C, 220 RPM) in pre-culturing glucose-containing media (Aro et al., 2023). The Ambr 250 automated high-throughput bioprocess system (Sartorius, Germany) was used for the strain behavior assessment in a fed-bath process at 28 °C of strains M3728 (pH 4.0) and M3730 (pH 4.8) using the same glucose-containing media, with foaming controlled by the addition of Dow Corning 1500 antifoam (3mL/L). Two different feeding strategies (“low feed” = 1.6 g glucose L−1 h−1 and “high feed” = 2.1 g glucose L−1 h−1) were used in two bioreactors. In addition, the cultivation conditions in the 24-well automated Ambr (Sartorius) fed-batch fermentations were pH (at pH 4.0 or pH 4.8)- and temperature (at 28 °C)-controlled. Samples were taken daily in tubes at 4 °C and filtered (Whatman GF/B) on the same day prior to SDS-PAGE analysis. Brazzein samples were purified in deionized water prior to LC-HCMS, Timegated™ spectroscopy, DLS, and nanoDSF analyses to remove impurities (at approximately 60 kDa; Supplementary Figure S2) using an ultrafiltration step (Vivaspin mwco 10 kDa; Sartorius, Germany) according to the manufacturer’s protocol. For the Timegated™ Raman spectroscopy analysis, the samples were diluted with deionized water to a concentration of 1.0 g/L. One sample was heated at 75 °C for 20 min, followed by centrifugation. For the DLS measurements, the sample was stored for 24 months at 4 °C–8 °C before analysis.
2.2.3 SDS-PAGE analysis and protein quantification
SDS-PAGE analysis was carried out using 16.5% Criterion™ Tris–tricine gels that were stained with PageBlue protein staining solution (Thermo Fisher Scientific) and imaged using an Odyssey CLx imaging system instrument (LICORBio, USA). For brazzein quantification, a dilution series (0.3125 µg–5.0 µg) of recombinant brazzein with reference SKU: AA-019 (Amidebio, USA) was run along with the samples in SDS-PAGE. The protein amounts were quantified using densitometry (Bio-Rad, USA), and their images were analyzed using Image Lab software version 6.1.
2.3 Mass spectrometric sample preparation and analysis
Sample handling for intact mass analysis was conducted as follows: the non-heat-treated sample was centrifuged at 12,000 rpm for 20 min, and 10 µL of the supernatant was transferred to the UPLC vial and diluted with 90 µL of ultrapure water to a final concentration of 0.2 mg/mL. Heated samples were treated identically to the ambient samples, except they were first incubated for 20 min at 70 °C (i.e., heat-treated samples). Reduced samples were prepared by spiking the heat-treated samples with 150 mM DTT to a final DTT concentration of 15 mM and incubating them for 30 min at 50 °C. The reduced and urea-diluted sample (final urea concentration ∼7M) was obtained by mixing 10 µL of the reduced sample with 40 µL saturated (∼9 M) urea, and the mixture was briefly vortexed. Intact mass samples were analyzed using a UPLC-MS instrumentation Waters Synapt G2-Si-QTOF mass spectrometer with the Waters Acquity UPLC front end. The UPLC parameters were as follows:

Data processing was carried out using Waters MassLynx software, including deconvolutions with the MaxEnt 3 algorithm. Masses were calculated with the MassLynx BioLynx peptide editor based on the sequence, pQDKCKKVYENYPVSKCQLANQCNYDCKLDKHARSGECFYDEKRNLQCICDYCEY, where pQ is the N-terminal pyroglutamic acid. Theoretical monoisotopic masses for non-reduced and reduced proteins were 6476.828 Da and 6468.766 Da, respectively.
Peptide map mass spectrometric (P-MS) analysis was carried out in the Turku Proteomics Facility (University of Turku and Åbo Akademi University). Samples were cut from the SDS-PAGE gel, digested in-gel according to the standard protocol, and analyzed with LC-ESI-MS/MS using a Q Exactive HF mass spectrometer. Database searches were performed by the Mascot search engine against the brazzein protein sequence database.
Digested peptides were dissolved in 0.1% formic acid, and a measure of 200 ng of peptides from each sample was submitted to LC-ESI-MS/MS analysis. Wash and blank runs were submitted between each sample to reduce the carry-over of highly abundant peptides.
The LC-ESI-MS/MS analysis was performed on a nanoflow HPLC system (EASY-nLC 1000, Thermo Fisher Scientific) coupled to the Q Exactive HF mass spectrometer (Thermo Fisher Scientific, Germany) equipped with a nano-electrospray ionization source. Peptides were first loaded on a trapping column and subsequently separated inline on a 15-cm C18 column (75 μm × 15 cm, ReproSil-Pur 5 μm 200 Å C18-AQ) (Dr. Maisch HPLC GmbH, Ammerbuch-Entringen, Germany). The mobile phase consisted of water with 0.1% formic acid (solvent A) or acetonitrile/water (80:20 (v/v)) with 0.1% formic acid (solvent B). A 30-min gradient (from 8% to 43% solvent B, following a wash stage at 100% solvent B) was used to elute peptides.
MS data were acquired automatically using Thermo Xcalibur 4.1 software (Thermo Fisher Scientific). An information-dependent acquisition method consisted of an Orbitrap MS survey scan of mass range 300–2,000 m/z followed by HCD fragmentation.
Data files were searched for protein identification using Proteome Discoverer 2.3 software (Thermo Fisher Scientific, Germany) connected to an in-house server running Mascot 2.6.1 software (Matrix Science). Data from samples 1 and 2 were searched against a custom-made database containing defensin-like protein P56552 of “Pentadiplandra brazzeana” (downloaded from UniProt 19.11.2019).
2.4 Dynamic light scattering (DLS)
DLS measurements of brazzein in water (2 mg/mL) were performed using a Malvern Zetasizer Nano-ZS90 at a 173° backscattering angle equipped with a 633-nm He−Ne laser at a controlled temperature of 20 °C ± 1 °C at the start of thermal ramping, which was then increased to 92 °C at a ramp rate of 0.77 °C/min. The acquisition time was 5 s, and five acquisitions were averaged per measurement.
2.5 Circular dichroism (CD)
A ChirascanTM CD spectrometer equipped with a temperature-controlled unit (at 22 °C ± 1 °C and at 94 °C ± 1 °C) was used to collect spectra using a QS quartz cuvette with 1 mm path length. For brazzein protein in water (0.1 mg/mL), data acquisition was performed across the wavelength range of 180–280 nm, with a 1-nm bandwidth, 1-nm step size, and an averaging time of 0.5 s. For each sample, measurements were repeated five times; the spectra were averaged and smoothed. The spectra were analyzed using BeStSel v1.3.230210.
2.6 Timegated™ surface-enhanced Raman spectroscopy
Both samples (one at room temperature and one that was treated at 75 °C for 20 min) were analyzed using a wavelength-calibrated commercial Timegated™ Raman spectrometer (PicoRaman from Timegate Instruments, Oulu, Finland) using a pulsed laser with λexc = 532 nm excitation wavelength, 100 mW laser power, 100 ps pulse length, and approximately 100 kHz repetition rate. The TimegatedTM Raman spectroscopy system encompassed a temperature-stabilized CMOS SPAD array (8 × 768 pixels single-photon counting) detector with a spectral resolution of 5 cm−1 and temporal resolution of 100 ps. The TGRS was coupled to a conventional non-immersion Raman probe equipped with a quartz window (B&W Tek, BAC102, Metrohm, Herisau, Switzerland) and a working distance of 5.4 mm. The raw data were post-processed using TimegatedTM software. In addition, the spectra were baseline-corrected and smoothed using an SG (Savitzky–Golay) algorithm with the second polynomial order and five-point window using the software package OriginPro 2021b (64-bit) SR2 version 9.8.5.212 (OriginLab Corporation, MA, USA).
2.7 Nanoscale differential scanning fluorimetry (nanoDSF)
Protein thermal stability was analyzed using a Prometheus NT.48 instrument (NanoTemper Technologies). Capillaries were filled with 10 μL of protein solution at the original concentration (1.97 mg/mL) and at a 1:3 or 1:9 dilution in dH2O. The temperature was increased from 20 °C to 95 °C at a ramp rate of 1 °C/min. The excitation wavelength was 280 nm, and the ratio of emission intensities (Em350nm/Em330nm) was recorded. The fluorescence intensity ratio and its first derivative were calculated using PR.ThermControl (NanoTemper Technologies).
3 Results
The parental T. reesei strain M1908 transformed with the SES promoter constructs (pSWP3 and pSWP4) or the cbh1 promoter construct (pSWP10) exhibited brazzein production profiles when initially assessed in 24-well plate cultures. Cultivation in a glucose-based medium supported baseline expression, whereas the lactose-containing, cellulase-inducing medium resulted in higher production levels across the tested strategies. In glucose cultivations, the highest brazzein production was observed from the transformant pSWP4-1, whereas in lactose cultivations the highest brazzein production was seen from the transformants pSWP4-1 and pSWP10-1 (Supplementary Figure S2). These transformants along with the transformant pSWP3-2 were purified through single-colony plating, subsequently resulting in the following production strains: (a) M1908 + pSWP3 = M3727; (b) M1908 + pSWP4 = M3728; and (c) M1908 + PSWP10 = M3730.
Productions strains M3727, M3728, and M3730 were cultivated in both glucose and lactose media across three pH values to assess the effects on brazzein titers (Figure 2). For the M3730 strain, a pH of 4.8 yielded the best outcome for brazzein production using lactose media, whereas for M3728 in glucose media, the pH had no influence on the production levels.

Figure 2. SDS-PAGE analysis of brazzein secretion optimization screening. For comparison, the final 2 days of cultivation are shown (days 4 and 5), and the M1908 strains transformed with plasmids pSWP4 or pSWP10 were either cultivated on lactose- or glucose-containing medium (either pH 4.0, 4.8, or 5.5) corresponding to six different cultivations. Bands marked by light blue arrows were cut for MS analysis confirming the target protein brazzein (data not shown).
Bioreactor cultivations were carried out in Ambr 250-mL reactors using low and high glucose feeding and pH values for M3728 (pH 4.0) and M3730 (pH 4.8). Supernatant samples were collected daily (day 1–5). The brazzein production levels were quantified with SDS-PAGE densitometry against a brazzein standard (Figure 3). Based on the densitometry analysis, the production in both low and high glucose feed was approximately 1.3 g/L. Broths from both reactors were pooled, and the product was enriched by ultrafiltration in deionized water (Supplementary Figure S4), followed by UPLC-MS to assess purity. We have not analyzed the intracellular fraction of the brazzein production strains; however, since the separation of the secreted protein from its cellular biomass occurs under very gentle conditions, cells very rarely undergo lysis during this step in downstream processing (data not shown).
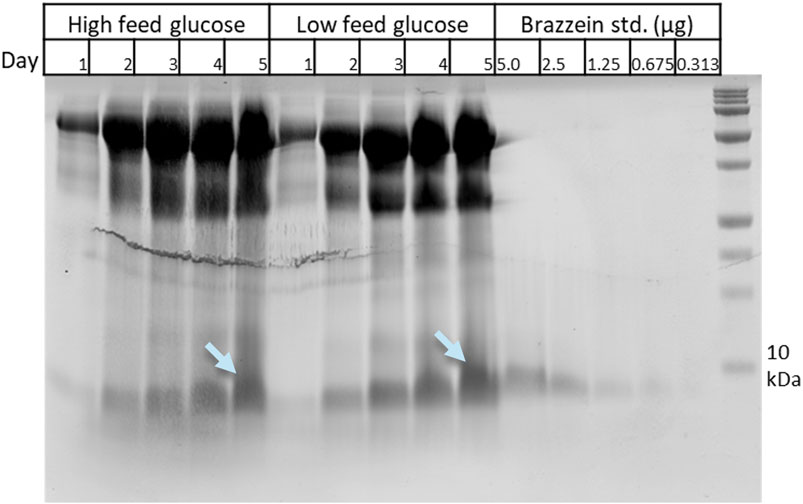
Figure 3. SDS-PAGE analysis of the Ambr bioreactor of strain M3730 (pH 4.8) samples from various timepoints (days 1–5) and a brazzein standard dilution series used for quantification using densitometry. Bands marked by light blue arrows were cut for MS analysis confirming the target protein brazzein (data not shown). Results from the Ambr bioreactor cultivation with strain M3728 (pH 4.0) provided very similar results.
NanoDSF thermal scans (350/330 nm ratio vs. temperature) did not yield typical S-shaped melting curves that are observed for most proteins (Gao et al., 2020), (Supplementary Figures S5, S6). However, in the first derivative of the curves at 330 nm or 350 nm, a peak at 64 °C could be detected. In the nanoDSF scattering measurement, the sample at the original concentration was aggregated after increasing the temperature to 72 °C. Overall, the results were indicative of a thermostable protein. However, due to the limitations of the method, the Tm is likely not representative. Therefore, other techniques were used to evaluate if brazzein was properly folded and to analyze its stability (i.e., CD spectroscopy, Timegated™ Raman spectroscopy, and LC-HCMS spectroscopy).
The overall secondary structures of brazzein can be observed from the CD spectra at 20 °C, and its thermostability, attributed to the retention of most of its main secondary structure, is demonstrated at 94 °C (Figure 4). Elucidation of the spectra reveals a mix of α-helical and anti-parallel β-sheets, which are comparable to X-ray and in-solution NMR structures (Table 2). Therefore, brazzein produced by T. reesei consists of a balanced mix of α-helical, β-sheet structures and loops.

Figure 4. Circular dichroism spectra of the purified brazzein expressed in T. reesei at 22 °C (blue solid line) and 94 °C (red dashed line).
Liquid chromatography (UPLC-MS) followed by high-resolution mass spectroscopy (LC-HCMS) of purified brazzein samples confirmed the correct amino acid sequence. The observed mass of the non-reduced sample was 6,468.79 Da, matching the expected mass with 5 ppm accuracy with an N-terminal pyroglutamic acid Gln (−17.027 Da) modification (Figure 5A), while heat treatment had no effect (Figure 5B) forms, with and without N-terminal pyroglutamic acid, and N-terminal pyroglutamic acid formation is common during recombinant protein production (Shih et al., 2014). When reduced with DTT, brazzein showed notable resistance to reduction, particularly considering the small size of the protein. Subsequently, after 30 min of reduction at 50 °C, 15 mM DTT produced a pronounced appearance of a partly reduced variant in which only one disulfide bridge was reduced. Fully reduced species could only be observed after dilution of the reduced sample with saturated urea (Figures 5C,D).

Figure 5. Chromatograms of the (A) non-reduced sample, (B) heat-treated sample, (C) DTT-reduced sample, and (D) DTT sample with urea dilution. Chromatograms are mass-filtered for clarity (m/z 926.3 ± 1 Da); insets display MaxEnt 3 deconvolution results and mass spectrum in (A,B) and the deconvolution results in (C,D). Deconvolution results from different elution times show the non-reduced mass with RT 4.1 min, one reduced disulfide bridge (+2 Da) with RT 4.9 min (C,D) and the deconvoluted mass of fully reduced protein with RT 5.7 min in (D) (+8 Da). Note that MaxEnt 3 shows deconvolution results as M + H.
Timegated™ Raman spectroscopy of brazzein showed the typical spectrum of an α-helical/β-sheet protein that contains disulfide bridges (Figure 4). In Table 1, the bonds are assigned based on Supplementary Table S3 and additional references. The Fermi doublet of tyrosine at 850/830 cm−1 of 0.77 showed that the tyrosines (11.1% of brazzein) are in an ionized state (Siamwiza et al., 1975), indicating that some phenol rings are involved in hydrophobic-type interactions. This ratio likely reflects the heterogeneous nature of tyrosines within the brazzein protein at this neutral pH (Hernández et al., 2016). The peak at 725 cm−1 is ot particular interest, which cannot be assigned easily to the most common protein peaks. However, when comparing this peak with the LC-HCMS results (pyroglutamic acid Gln), the peak can be confidently assigned to the γ(C=O) amide bond in L-pyroglutamic acid (Wagner and Baran, 2004). Additional evidence is the fairly uncommon protein Raman peak at 1,765 cm−1 and the shoulder in the amide I peak at 1,622 cm−1. Tyrosine shows a Raman band near 635 cm−1; however, the relatively high lysine content (13.3%) could also contribute to this region. The disulfide bonds are evident from the peaks at Raman shifts of 468 and 550 cm−1. Brazzein does not contain tryptophan, and therefore the strong peak at approximately 880 cm−1 is likely due to glutamate (7.4% of brazzein). We observed typical protein backbone and phenylalanine peaks between 910 and 1,210 cm−1 (Rygula et al., 2013). The amide III peak shows a maximum due to α-helices; however, as seen by the shoulder of the peak at 1,317 cm−1 (changes in the backbone), the amide II peak shows its maximum due to both α-helices and β-sheet structures (Rygula et al., 2013). The small peaks at 1,525 cm−1, which are likely -C=C- stretch of either histidine or tyrosine, are not common in protein samples. Most often, these peaks are assigned to a carotene type of compound present as either media components or cell debris. However, the other strong peak of the carotene fingerprint at 1,155 cm−1–1,160 cm−1 is missing (Tschirner et al., 2009). The peak at 1,564 cm−1 can be assigned to lysine (13% of brazzein), even though histidine (1% of brazzein) and glycine (1% of brazzein) also have a weak peak at this region. The amide I region shows some unique features. The smoothed peak shows a maximum at approximately 1,450 cm−1, indicative for α-helical proteins (Rygula et al., 2013). However, due to the N-terminal pyroglutamic acid Gln, the shoulder at 1,622 cm−1 can be assigned to the ν(C=O) amide bond (Wagner and Baran, 2004). The shoulder at 1,658 cm−1 can be assigned to β-turns and amide I (β-sheet) (Rygula et al., 2013; Sadat and Joye, 2020). Another non-typical protein Raman peak was observed at 1,765 cm−1, which can be assigned to the ν(C=O) carboxylate bond of pyroglutamic acid Gln. The peak at 1,884 cm−1 could be a possible overtone of arginine (3.7% of brazzein).
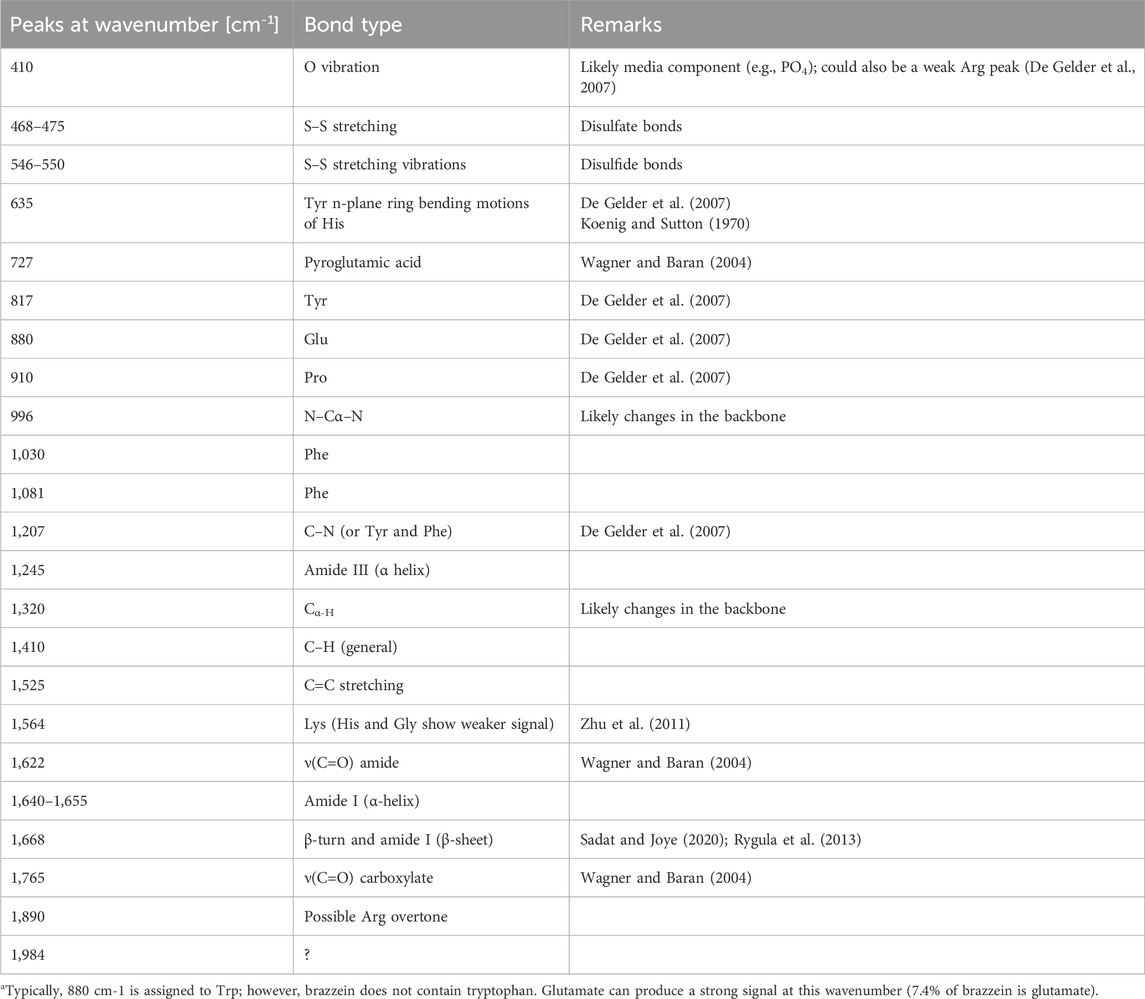
Table 1. Identification of Raman peaks and the corresponding bonds in brazzein.
The distinct Raman spectrum of brazzein at room temperature or after heating for 20 min at 75 °C showed only minor changes (Figure 6), indicative of an intact secondary structure. In addition, though the spectrum was normalized and baseline-corrected, the raw data showed no loss in signal intensity (data not shown), indicating that brazzein was not aggregated (i.e., no protein was lost during centrifugation after heating). The minor changes were observed in the proline peak at 910 cm−1–911 cm−1, the glutamate peak at 877 cm−1–880 cm−1, and an S–S peak at 468 cm−1.

Figure 6. Timegated™ Raman spectrum of brazzein (blue: 20 °C; red: 75 °C). The spectrum is normalized and baseline-corrected. The spectra were not smoothed for a more detailed comparison. The major peaks indicated by black arrows are identified in detail in Table 1.
DLS of the purified brazzein sample that was stored at 4°–8 °C for 24 months showed that 99.6% of brazzein was still in soluble monomeric conformation with a radius of 1.9 nm at room temperature. A small impurity (0.4% w/w) was also observed (Supplementary Figure S6), which is likely present due to aggregates. Incremental heating of the sample, while measuring the DLS, indicated that the start of aggregation was at approximately 76 °C, verifying the high thermostability of brazzein (Figure 7) after long-term storage.

Figure 7. Dynamic light scattering thermal scan of brazzein. The mean count rate (in counts per second) is depicted as a bold line, and the z-average (radius in nm) is depicted as a dotted line. Brazzein aggregates fully at approximately 80 °C.
4 Discussion
Filamentous fungi are traditionally used in the bioprocess industry for the large-scale production of industrial enzymes. Several new approaches for producing food ingredients are also emerging. The filamentous fungus T. reesei is an important host for the production of heterologous proteins, as it is capable of secreting large amounts of hydrolytic enzymes, as high as up to 100 g/L of protein under optimal conditions (Cherry and Fidantsef, 2003). In our laboratory, T. reesei has also been used for the production of biopharmaceutical and food proteins (Landowski et al., 2016; Aro et al., 2023) and a single heterologous protein at yields exceeding 80 g/L (VTT, unpublished data). In this study, we used T. reesei in the production of sweet-tasting protein brazzein. Using the SES-system (Rantasalo et al., 2019), it was possible to produce brazzein at 1.3 g/L in a 250-mL bioreactor using 100 mL of glucose-containing medium. Although the expression levels of the strain with the expression cassette containing the cbh1 promoter were not confirmed in bioreactor cultivations over 100 mL, the levels in 24-well plate cultures were in the same range as those of the SES-system. Based on earlier results of VTT in collaboration with industrial partners (data not shown), brazzein strains are very likely productive at similar levels at larger scales. However, proper scaling-up experiments should be carried out to ensure this. Compared to previous reports (Berlec et al., 2006; Lamphear et al., 2005; Lee et al., 2019; Poirier et al., 2012), the production levels described in this study for T. reesei are several folds higher than those for E. coli or yeast systems.
The CD spectra of brazzein expressed in T. reesei, as shown in Figure 4, show the differences between ambient temperature and above 90 °C; however, deconvolution of the spectra shows no differences. We suspect that the additional smoothing of the analysis software (BeStSel v1.3.230210) or insensitivity of our CD spectroscope resulted in misclassifying the loop and coil structures. However, when comparing our CD spectra to earlier brazzein studies (Liu et al., 2021), the CD spectrum of brazzein at 22 °C aligns well with that of the wild-type produced in E. coli. Brazzein produced by Liu and co-workers lacks the N-terminal pyroglutamic acid Gln, and differences in the CD spectra are observed between 205 and 225 nm, indicating slight differences in β-sheet and/or random coil structures. When overlaying the CD spectra reported here (Figure 4) with the data of Liu et al. (2021), the spectra between 190–205 nm and 215–25 nm were identical at ambient temperature (data not shown). When comparing both CD spectra with those of brazzein expressed in Nicotiana tabacum cv. Xanthi, which also lacks the N-terminal pyroglutamic acid Gln (Choi et al., 2022), it becomes apparent that the α-helical structures of brazzein vary widely depending on the conditions of production, purification, and storage (Table 2).
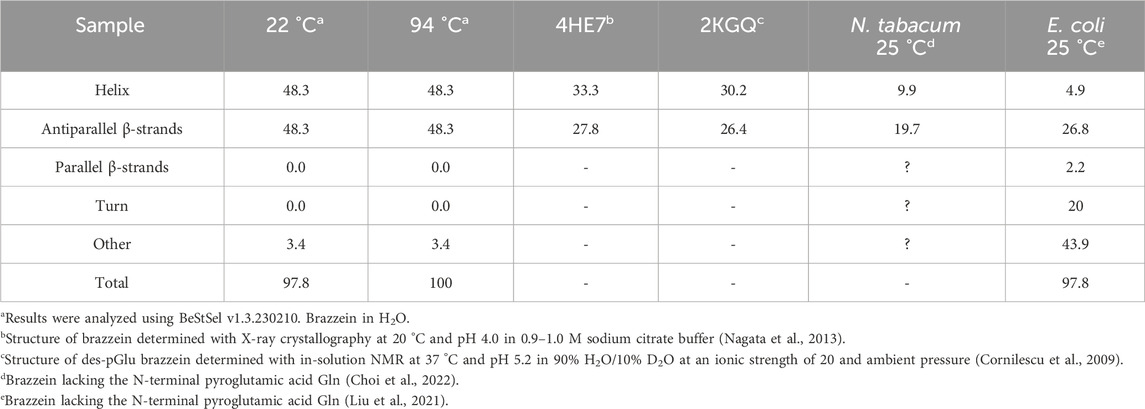
Table 2. Secondary structure analysis of the recombinant brazzein and its mutants.
Analysis of the Raman spectra of brazzein revealed that its secondary structure was similar to that of previously determined Timegated™ structural models (Nagata et al., 2013). Brazzein expressed in T. reesei had four disulfide bonds, as determined by LC-HCMS (see Figures 5A–D), contained an N-terminal pyroglutamic acid (see Figures 5, 8), and displayed α-helical and β-sheet structures (Figure 8), which is in line with earlier reports (Nagata et al., 2013). The presence of N-terminal pyroglutamic acid was further confirmed by the Raman spectra through the detection of the ν(C=O) carboxylate bond of pyroglutamic acid Gln. In addition, when comparing models of the amide I peak (Sadat and Joye, 2020) to our Timegated™ Raman spectra, we observed the typical maxima of α-helixes and β-strands even though the spectra were noisy. The overall reason for this is the relatively low concentration of brazzein in the solution and the residual fluorescence background. In addition, the noisiness of the spectra is masked by fluorescence. The PicoRaman M2 instrument allows selection of spectra in the temporal domain. Here, we used separation of binned photons containing the most Raman information of the sample (i.e., separating the part of the spectrum with the most auto-fluorescence), however some small residual fluorescence may remain. The post-processing performed using OriginPro software includes baseline correction and some minor spectral smoothing. Despite the noisiness of the spectra, they are consistent since we carried out several repetitions with one sample, as shown in Supplementary Figure S8.
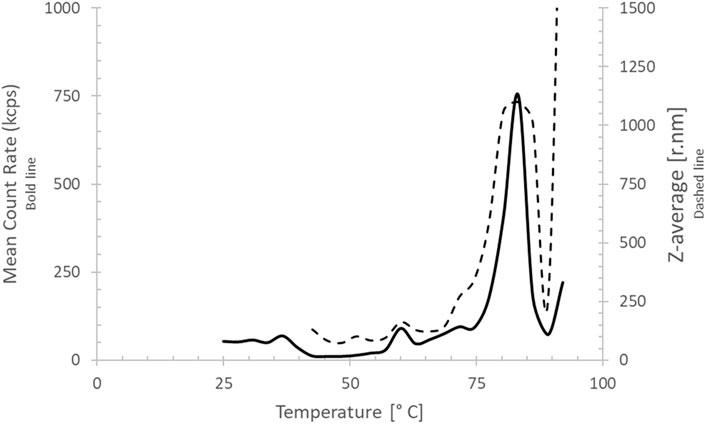
Figure 8. Timegated™ Raman spectrum of brazzein. The spectrum is normalized and baseline-corrected. The major peaks indicated by black arrows are identified in detail in Table 1. Inset: the amide I peak providing more details.
Brazzein is a thermostable protein, which was confirmed by CD spectroscopy (Figure 4; Table 2) and by comparing Timegated™ Raman spectra after heating brazzein for 20 min in deionized water at 75 °C to Timegated™ Raman spectra at room temperature (see Figure 6). On the other hand, the nanoDSF measurements (Supplementary Figures S4, S5) highlight the limitations of this fluorescence method to detect thermostability of brazzein. Since brazzein is a small protein and does not contain any tryptophan residues, significant fluorescence changes might not be observed, making it challenging to detect unfolding.
To evaluate the secondary structure of brazzein, a non-invasive technique without labels showed, as reported earlier (Zuo et al., 2024), that the α-helical structure was partly lost at 94 °C compared to that in the room temperature in the CD-spectra. Timegated™ Raman spectroscopy at two different temperatures did not indicate any major changes in the secondary structure of brazzein. These changes in the glutamate peak (880 cm−1) are likely due to backbone effects, since of the four glutamate residues, three are located in the loop regions. Only Glu35 resides at the first residue of the β-sheet structure. This further supports the slight reduction in the signal around the Cα-H peak at 1,317 cm−1 in the Timegated™ Raman spectra due to heating (Figure 6). Intact protein mass spectroscopy, however, detected changes in the proline-associated region. Brazzein has only one proline, Pro11, which sits at the start of the α-helix, and as concluded by Zuo et al. (2024), the disulfide pair Cys16–Cys37 plays an important role in thermal stability and sweetness activity.
The intact mass spectroscopy experiments demonstrated that brazzein retains identical chromatographic and mass spectrometric responses after heating at 70 °C for 20 min, indicating its relatively high resistance to reduction. The reduction experiments suggest that one of the four disulfide bonds is more accessible to reduction, whereas a fully reduced protein could be observed only after denaturation with urea. The absence of a fully reduced brazzein signal from the aqueous (non-denatured) sample could also be due to aggregation of brazzein that lacks disulfide bonds.
Brazzein combines water solubility, small size, and strong non-covalent binding to the sweet-taste receptor with exceptional heat stability. This combination of features requires a stable three-dimensional structure, in which the dense disulfide bonding likely plays a key role. The apparent importance of disulfide bonding in stabilizing brazzein is supported by a previous study (Ghanavatian et al., 2016), in which long reduction times were used to establish the low stability of reduced brazzein in different urea concentrations. In addition, correct folding facilitated by the disulfide bonds is crucial for the perception of the sweetness of brazzein (Zuo et al., 2024). Moreover, protein stability was assessed with DLS thermo-scanning to detect aggregation in a 24-month-old brazzein sample (stored in deionized water at 4 °C–8 °C) aggregated at 80 °C, confirming the stability of brazzein produced by T. reesei.
Earlier reports showed that mutations causing disruptions to the loop of amino acids 9–19, general protein misfolding, and the elimination of disulfide bonds, especially the terminal disulfide bond, significantly reduce sweetness and receptor binding (Assadi-Porter et al., 2010; Singarapu et al., 2016; Dittli et al., 2011). Thus, we speculate that brazzein produced with T. reesei retains its sweetness since we demonstrated correct folding, including correct disulfide bond formation. However, we have not confirmed this with panel-based taste testing.
5 Conclusion
We demonstrated that brazzein with correct folding can be produced using the filamentous fungus T. reesei. LC-HCMS in combination with TimegatedTM Raman spectroscopy outperformed other previously implemented approaches for analyzing the folding of small proteins that lack the amino acid tryptophan, a feature that is critical for nanoDSF measurements. Since correct folding is essential for brazzein to interact with its receptors on the tongue, the approaches presented here, along with previously discussed methods (Saraiva et al., 2023), could provide an alternative when taste testing cannot be performed.
Based on our earlier cost models for heterologous protein production using T. reesei (Järviö et al., 2021) and extrapolating production costs for secreted protein as described earlier (Taiwo et al., 2022; de Lima et al., 2022), we can estimate 57 €–80 € per kg of brazzein at 1.3 g/L production levels, which is equivalent to 29 €–40 € per ton, when normalized for the sweetness of sucrose (i.e., cost per ton divided by 2000). Compared to 406 € per ton of sucrose at the time of writing1, this indicates a significant reduction of cost for similar sweetness levels. For comparison, several patents have reported industrially relevant yields (e.g., in yeast: 0.3 g/L (HYEON, 2022) or in Aspergillus oryzae producing brazzein at a high yield in a functional form (Vind et al., 2011)). However, optimized strains (Aro, 2025) with higher production levels could reduce the cost to 20 € per kg or even lower. Therefore, based on the results of this study, it is possible to achieve the production of brazzein with correct folding at industrially and economically relevant levels using T. reesei.
Data availability statement
The original contributions presented in the study are included in the article/Supplementary Material, further inquiries can be directed to the corresponding author.
Author contributions
DM: Conceptualization, Resources, Supervision, Validation, Writing – review and editing. NA: Methodology, Supervision, Writing – original draft, Writing – review and editing. JK: Formal Analysis, Investigation, Methodology, Writing – review and editing. MK: Formal Analysis, Investigation, Methodology, Visualization, Writing – original draft, Writing – review and editing. EN: Funding acquisition, Project administration, Writing – review and editing. WH: Conceptualization, Formal Analysis, Methodology, Validation, Visualization, Writing – original draft, Writing – review and editing. MC: Conceptualization, Formal Analysis, Investigation, Methodology, Validation, Visualization, Writing – original draft, Writing – review and editing.
Funding
The authors declare that financial support was received for the research and/or publication of this article. The authors thank VTT for providing funding for the study.
Acknowledgements
The authors thank Dr. Martina Andberg for her skillful assistance in the purification of brazzein and Dr. Christopher Landowski for careful assistance in some of the experimental design. Additionally, the authors thank Biocenter Finland (Oulu, Finland) for their assistance regarding the nanoDSF measurements.
Conflict of interest
The authors declare that the research was conducted in the absence of any commercial or financial relationships that could be construed as a potential conflict of interest.
Generative AI statement
The authors declare that no Generative AI was used in the creation of this manuscript.
Any alternative text (alt text) provided alongside figures in this article has been generated by Frontiers with the support of artificial intelligence and reasonable efforts have been made to ensure accuracy, including review by the authors wherever possible. If you identify any issues, please contact us.
Publisher’s note
All claims expressed in this article are solely those of the authors and do not necessarily represent those of their affiliated organizations, or those of the publisher, the editors and the reviewers. Any product that may be evaluated in this article, or claim that may be made by its manufacturer, is not guaranteed or endorsed by the publisher.
Supplementary material
The Supplementary Material for this article can be found online at: https://www.frontiersin.org/articles/10.3389/fbioe.2025.1688495/full#supplementary-material
References
Aro, N. (2025). “Development of Trichoderma reesei strains for high-level production of the sweet protein brazzein,” in RPP12 (recombinant protein Production Conference). Available online at: https://efbiotechnology.org.
Aro, N., Ercili-Cura, D., Andberg, M., Silventoinen, P., Lille, M., Hosia, W., et al. (2023). Production of bovine beta-lactoglobulin and hen egg ovalbumin by Trichoderma reesei using precision fermentation technology and testing of their techno-functional properties. Food Res. Int. 163, 112131. doi:10.1016/j.foodres.2022.112131
Assadi-Porter, F. M., Aceti, D. J., Cheng, H., and Markley, J. L. (2000). Efficient production of recombinant brazzein, a small, heat-stable, sweet-tasting protein of plant origin. Archives Biochem. Biophysics 376, 252–258. doi:10.1006/abbi.2000.1725
Assadi-Porter, F. M., Tonelli, M., Maillet, E. L., Markley, J. L., and Max, M. (2010). Interactions between the human sweet-sensing T1R2–T1R3 receptor and sweeteners detected by saturation transfer difference NMR spectroscopy. Biochimica Biophysica Acta (BBA) - Biomembr. 1798, 82–86. doi:10.1016/j.bbamem.2009.07.021
Berlec, A., Jevnikar, Z., Rogelj, I., and Štrukelj, B. (2006). Expression of the sweet-tasting plant protein brazzein in Escherichia coli and Lactococcus lactis: a path toward sweet lactic acid bacteria. Appl. Microbiol. Biotechnol. 73, 158–165. doi:10.1007/s00253-006-0438-y
Caldwell, J. E., Abildgaard, F., Ming, D., Hellekant, G., and Markley, J. L. (1998). Erratum Complete 1H and partial 13C resonance assignments at 37 and 22 °C for brazzein, an intensely sweet protein. J. Biomol. NMR 11, 231. doi:10.1023/a:1008386428465
Che, T. (2003). MIT artificial intelligence laboratory MDoB, MIT division, engineering oB. Idempotent vector design for the standard assembly of biobricks. MIT Synth. Biol. Work. Group Tech. Rep.
Cherry, J. R., and Fidantsef, A. L. (2003). Directed evolution of industrial enzymes: an update. Curr. Opin. Biotechnol. 14, 438–443. doi:10.1016/s0958-1669(03)00099-5
Choi, H. E., Lee, J. I., Jo, S. Y., Chae, Y. C., Lee, J. H., Sun, H. J., et al. (2022). Functional expression of the sweet-tasting protein brazzein in transgenic tobacco. Food Sci. Technol. 42, e40521. doi:10.1590/fst.40521
Cornilescu, C. C., Tonelli, M., Derider, M. L., Markley, J. L., and Assadi-Porter, F. M. (2009). “Refined solution structure of des-pyro Glu brazzein,” in Worldwide protein data bank.
De Gelder, J., De Gussem, K., Vandenabeele, P., and Moens, L. (2007). Reference database of Raman spectra of biological molecules. J. Raman Spectrosc. 38, 1133–1147. doi:10.1002/jrs.1734
De Lima, E. A., Mandelli, F., Kolling, D., Matsusato Souza, J., De Oliveira Filho, C. A., Ribeiro Da Silva, M., et al. (2022). Development of an economically competitive Trichoderma-based platform for enzyme production: bioprocess optimization, pilot plant scale-up, techno-economic analysis and life cycle assessment. Bioresour. Technol. 364, 128019. doi:10.1016/j.biortech.2022.128019
Dittli, S. M., Rao, H., Tonelli, M., Quijada, J., Markley, J. L., Max, M., et al. (2011). Structural role of the terminal disulfide bond in the sweetness of brazzein. Chem. Senses 36, 821–830. doi:10.1093/chemse/bjr057
Druzhinina, I. S., and Kubicek, C. P. (2017). Genetic engineering of Trichoderma reesei cellulases and their production. Microb. Biotechnol. 10, 1485–1499. doi:10.1111/1751-7915.12726
Faus, I. (2000). Recent developments in the characterization and biotechnological production of sweet-tasting proteins. Appl. Microbiol. Biotechnol. 53, 145–151. doi:10.1007/s002530050001
Gao, K., Oerlemans, R., and Groves, M. R. (2020). Theory and applications of differential scanning fluorimetry in early-stage drug discovery. Biophys. Rev. 12, 85–104. doi:10.1007/s12551-020-00619-2
Ghanavatian, P., Khalifeh, K., and Jafarian, V. (2016). Structural features and activity of Brazzein and its mutants upon substitution of a surfaced exposed alanine. Biochimie 131, 20–28. doi:10.1016/j.biochi.2016.09.006
Han, J.-E., Lee, H., Ho, T.-T., and Park, S.-Y. (2022). Brazzein protein production in transgenic carrot cells using air-lift bioreactor culture. Plant Biotechnol. Rep. 16, 161–171. doi:10.1007/s11816-022-00743-3
Harada, S., Otani, H., Maeda, S., Kai, Y., Kasai, N., and Kurihara, Y. (1994). Crystallization and preliminary X-ray diffraction studies of Curculin: a new type of sweet protein having taste-modifying action. J. Mol. Biol. 238, 286–287. doi:10.1006/jmbi.1994.1289
Hellekant, G., and Danilova, V. (2005). Brazzein a small, sweet protein: discovery and physiological overview. Chem. Senses 30 (Suppl. L), 88–89. doi:10.1093/chemse/bjh127
Hernández, B., Coïc, Y.-M., Pflüger, F., Kruglik, S. G., and Ghomi, M. (2016). All characteristic Raman markers of tyrosine and tyrosinate originate from phenol ring fundamental vibrations. J. Raman Spectrosc. 47, 210–220. doi:10.1002/jrs.4776
Hyeon, K. (2022). US2022289799 (AA) - recombinant expression vector for high expression of brazzein in Saccharomyces Cerevisiae and method for mass-production of brazzein using the same. U. S. A. Pat. Appl.
Inglett, G. E., and May, J. F. (1969). Serendipity berries–source of a new intense sweetener. J. Food Sci. 34, 408–411. doi:10.1111/j.1365-2621.1969.tb12791.x
Izawa, H., Ota, M., Kohmura, M., and Ariyoshi, Y. (1996). Synthesis and characterization of the sweet protein brazzein. Biopolymers 39, 95–101. doi:10.1002/(sici)1097-0282(199607)39:1<95::aid-bip10>3.0.co;2-b
Järviö, N., Parviainen, T., Maljanen, N.-L., Kobayashi, Y., Kujanpää, L., Ercili-Cura, D., et al. (2021). Ovalbumin production using Trichoderma reesei culture and low-carbon energy could mitigate the environmental impacts of chicken-egg-derived ovalbumin. Nat. Food 2, 1005–1013. doi:10.1038/s43016-021-00418-2
Kaplan Türköz, B., Yazdanian Asr, S., Yüksel, N., and İçier, S. (2022). Sweet plant proteins and their recombinant production. Türk Doğa ve Fen Derg. 11, 186–194. doi:10.46810/tdfd.1027978
Koenig, J. L., and Sutton, P. L. (1970). Raman spectra of poly-L-lysines. Biopolymers 9, 1229–1237. doi:10.1002/bip.1970.360091003
Lamphear, B. J., Barker, D. K., Brooks, C. A., Delaney, D. E., Lane, J. R., Beifuss, K., et al. (2005). Expression of the sweet protein brazzein in maize for production of a new commercial sweetener. Plant Biotechnol. J. 3, 103–114. doi:10.1111/j.1467-7652.2004.00105.x
Landowski, C. P., Mustalahti, E., Wahl, R., Croute, L., Sivasiddarthan, D., Westerholm-Parvinen, A., et al. (2016). Enabling low cost biopharmaceuticals: high level interferon alpha-2b production in Trichoderma reesei. Microb. Cell. Factories 15, 104–115. doi:10.1186/s12934-016-0508-5
Lee, H. M., Park, S. W., Lee, S. J., and Kong, K. H. (2019). Optimized production and quantification of the tryptophan-deficient sweet-tasting protein brazzein in Kluyveromyces lactis. Prep. Biochem. Biotechnol. 49, 790–799. doi:10.1080/10826068.2019.1621892
Leone, S., Pica, A., Merlino, A., Sannino, F., Temussi, P. A., and Picone, D. (2016). Sweeter and stronger: enhancing sweetness and stability of the single chain monellin MNEI through molecular design. Sci. Rep. 6, 34045. doi:10.1038/srep34045
Liu, X., Maeda, S., Hu, Z., Aiuchi, T., Nakaya, K., and Kurihara, Y. (1993). Purification, complete amino acid sequence and structural characterization of the heat-stable sweet protein, mabinlin II. Eur. J. Biochem. 211, 281–287. doi:10.1111/j.1432-1033.1993.tb19896.x
Liu, B., Jiang, H., Wang, H., and Yang, L. (2021). Removal of the N-terminal methionine improves the sweetness of the recombinant expressed sweet-tasting protein brazzein and its mutants in Escherichia coli. J. Food Biochem. 45, e13354. doi:10.1111/jfbc.13354
Maehashi, K., and Udaka, S. (1998). Sweetness of lysozymes. Biosci. Biotechnol. Biochem. 62, 605–606. doi:10.1271/bbb.62.605
Makarova, KIRA S., Wolf, YURI I., and Koonin, EUGENE V. (2013). The basic building blocks and evolution of CRISPR–Cas systems. Biochem. Soc. Trans. 41, 1392–1400. doi:10.1042/bst20130038
Mäntylä, A., Paloheimo, M., Hakola, S., Lindberg, E., Leskinen, S., Kallio, J., et al. (2007). Production in Trichoderma reesei of three xylanases from Chaetomium thermophilum: a recombinant thermoxylanase for biobleaching of kraft pulp. Appl. Microbiol. Biotechnol. 76, 377–386. doi:10.1007/s00253-007-1020-y
Miettinen-Oinonen, A., and Suominen, P. (2002). Enhanced production of Trichoderma reesei endoglucanases and use of the new cellulase preparations in producing the stonewashed effect on denim fabric. Appl. Environ. Microbiol. 68, 3956–3964. doi:10.1128/aem.68.8.3956-3964.2002
Ming, D., and Hellekant, G. (1994). Brazzein, a new high-potency thermostable sweet protein from Pentadiplandra brazzeana B. FEBS Lett. 355, 106–108. doi:10.1016/0014-5793(94)01184-2
Moralejo, F. J., Watson, A. J., Jeenes, D. J., Archer, D. B., and Martín, J. F. (2001). A defined level of protein disulfide isomerase expression is required for optimal secretion of thaumatin by Aspergillus awamori. Mol. Genet. Genomics 266, 246–253. doi:10.1007/s004380100550
Nagata, K., Hongo, N., Kameda, Y., Yamamura, A., Sasaki, H., Lee, W. C., et al. (2013). The structure of brazzein, a sweet-tasting protein from the wild African plant Pentadiplandra brazzeana. Acta Crystallogr. Sect. D. 69, 642–647. doi:10.1107/s0907444913001005
Picone, D., and Temussi, P. A. (2012). Dissimilar sweet proteins from plants: oddities or normal components? Plant Sci. 195, 135–142. doi:10.1016/j.plantsci.2012.07.001
Poirier, N., Roudnitzky, N., Brockhoff, A., Belloir, C., Maison, M., Thomas-Danguin, T., et al. (2012). Efficient production and characterization of the sweet-tasting brazzein secreted by the yeast pichia pastoris. J. Agric. Food Chem. 60, 9807–9814. doi:10.1021/jf301600m
Rantasalo, A., Vitikainen, M., Paasikallio, T., Jäntti, J., Landowski, C. P., and Mojzita, D. (2019). Novel genetic tools that enable highly pure protein production in Trichoderma reesei. Sci. Rep. 9, 5032. doi:10.1038/s41598-019-41573-8
Rygula, A., Majzner, K., Marzec, K. M., Kaczor, A., Pilarczyk, M., and Baranska, M. (2013). Raman spectroscopy of proteins: a review. J. Raman Spectrosc. 44, 1061–1076. doi:10.1002/jrs.4335
Sadat, A., and Joye, I. J. (2020). Peak fitting applied to fourier transform infrared and raman spectroscopic analysis of proteins. Appl. Sci. 10, 5918. doi:10.3390/app10175918
Saraiva, A., Carrascosa, C., Ramos, F., Raheem, D., Pedreiro, S., Vega, A., et al. (2023). Brazzein and monellin: chemical analysis, food industry applications, safety and quality control, nutritional profile and health impacts. Foods [Online] 12, 1943. doi:10.3390/foods12101943
Shih, Y. P., Chou, C. C., Chen, Y. L., Huang, K. F., and Wang, A. H. (2014). Linked production of pyroglutamate-modified proteins via self-cleavage of fusion tags with TEV protease and autonomous N-terminal cyclization with glutaminyl cyclase in vivo. PLoS One 9, e94812. doi:10.1371/journal.pone.0094812
Siamwiza, M. N., Lord, R. C., Chen, M. C., Takamatsu, T., Harada, I., Matsuura, H., et al. (1975). Interpretation of the doublet at 850 and 830 cm-1 in the Raman spectra of tyrosyl residues in proteins and certain model compounds. Biochemistry 14, 4870–4876. doi:10.1021/bi00693a014
Singarapu, K. K., Tonelli, M., Markley, J. L., and Assadi-Porter, F. M. (2016). Structure-function relationships of brazzein variants with altered interactions with the human sweet taste receptor. Protein Sci. 25, 711–719. doi:10.1002/pro.2870
Taiwo, A. E., Tom-James, A., Falowo, O. A., Okoji, A., Adeyi, O., Olalere, A. O., et al. (2022). Techno-economic analysis of cellulase production by Trichoderma reesei in submerged fermentation processes using a process simulator. South Afr. J. Chem. Eng. 42, 98–105. doi:10.1016/j.sajce.2022.08.001
Takahashi, N., Hitotsuya, H., Hanzawa, H., Arata, Y., and Kurihara, Y. (1990). Structural study of asparagine-linked oligosaccharide moiety of taste-modifying protein, miraculin. J. Biol. Chem. 265, 7793–7798. doi:10.1016/s0021-9258(19)38998-7
Tancredi, T., Pastore, A., Salvadori, S., Esposito, V., and Temussi, P. A. (2004). Interaction of sweet proteins with their receptor: a conformational study of peptides corresponding to loops of brazzein, monellin and thaumatin. Eur. J. Biochem. 271, 2231–2240. doi:10.1111/j.1432-1033.2004.04154.x
Temussi, P. A. (2011). Determinants of sweetness in proteins: a topological approach. J. Mol. Recognit. 24, 1033–1042. doi:10.1002/jmr.1152
Tschirner, N., Schenderlein, M., Brose, K., Schlodder, E., Mroginski, M. A., Thomsen, C., et al. (2009). Resonance Raman spectra of β-carotene in solution and in photosystems revisited: an experimental and theoretical study. Phys. Chem. Chem. Phys. 11, 11471–11478. doi:10.1039/b917341b
Van Der Wel, H., Van Soest, T. C., and Royers, E. C. (1975). Crystallization and crystal data of thaumatin I, a sweet-tasting protein from Thaumatococcus daniellii benth. FEBS Lett. 56, 316–317. doi:10.1016/0014-5793(75)81117-3
Vind, J., Tams, J. W., Beier, L., and Olsen, C. L. (2011). Method of producing a sweet protein (WO2011015633A1).
Wagner, C. C., and Baran, E. J. (2004). Vibrational spectra of some pharmacologically interesting pyroglutamato complexes. J. Raman Spectrosc. 35, 395–400. doi:10.1002/jrs.1129
Yamamoto, M., Terada, Y., Motoyama, T., Saito, T., and Ito, K. (2020). Sweet proteins lysozyme and thaumatin are protein-type agonists for the calcium-sensing receptor. Biochem. Biophysical Res. Commun. 521, 227–231. doi:10.1016/j.bbrc.2019.10.111
Yan, S., Song, H., Pang, D., Zou, Q., Li, L., Yan, Q., et al. (2013). Expression of plant sweet protein brazzein in the milk of transgenic mice. PLoS ONE 8, e76769. doi:10.1371/journal.pone.0076769
Zhao, X., Wang, C., Zheng, Y., and Liu, B. (2021). New insight into the structure-activity relationship of sweet-tasting proteins: protein sector and its role for sweet properties. Front. Nutr. 8, 691368–692021. doi:10.3389/fnut.2021.691368
Zhu, G., Zhu, X., Fan, Q., and Wan, X. (2011). Raman spectra of amino acids and their aqueous solutions. Spectrochimica Acta Part A Mol. Biomol. Spectrosc. 78, 1187–1195. doi:10.1016/j.saa.2010.12.079
Keywords: brazzein, Trichoderma, Raman spectroscopy, fungal expression system, sweet protein
Citation: Mojzita D, Aro N, Kontturi J, Kögler M, Nordlund E, Hosia W and Casteleijn MG (2025) Label-free analytical characterization of brazzein produced with the filamentous fungus Trichoderma reesei. Front. Bioeng. Biotechnol. 13:1688495. doi: 10.3389/fbioe.2025.1688495
Received: 19 August 2025; Accepted: 07 November 2025;
Published: 12 December 2025.
Edited by:
Anastassios C. Papageorgiou, University of Turku, FinlandReviewed by:
Paul P. De Waal, Dsm-firmenich, NetherlandsDiletta Ami, University of Milano-Bicocca, Italy
Copyright © 2025 Mojzita, Aro, Kontturi, Kögler, Nordlund, Hosia and Casteleijn. This is an open-access article distributed under the terms of the Creative Commons Attribution License (CC BY). The use, distribution or reproduction in other forums is permitted, provided the original author(s) and the copyright owner(s) are credited and that the original publication in this journal is cited, in accordance with accepted academic practice. No use, distribution or reproduction is permitted which does not comply with these terms.
*Correspondence: Marco G. Casteleijn, bWFyY28uY2FzdGVsZWlqbkB2dHQuZmk=