 Subhajit Ghosh
 Sukhen Das Mandal
 Subarna Thakur
- 1Department of Bioinformatics, University of North Bengal, Darjeeling, West Bengal, India
- 2Department of Computer Science and Engineering, Ghani Khan Choudhury Institute of Engineering and Technology (GKCIET), Malda, India
The incidence of non-alcoholic fatty liver disease (NAFLD), encompassing the more severe non-alcoholic steatohepatitis (NASH), is rising alongside the surges in diabetes and obesity. Increasing evidence indicates that NASH is responsible for a significant share of idiopathic hepatocellular carcinoma (HCC) cases, a fatal cancer with a 5-year survival rate below 22%. Biomarkers can facilitate early screening and monitoring of at-risk NAFLD/NASH patients and assist in identifying potential drug candidates for treatment. This study utilized an ensemble feature selection framework to analyze transcriptomic data, identifying biomarker genes associated with the stage-wise progression of NAFLD-related HCC. Seven machine learning algorithms were assessed for disease stage classification. Twelve feature selection methods including correlation-based techniques, mutual information-based methods, and embedded techniques were utilized to rank the top genes as features, through this approach, multiple feature selection methods were combined to yield more robust features important in this disease progression. Cox regression-based survival analysis was carried out to evaluate the biomarker potentiality of these genes. Furthermore, multiphase drug repurposing strategy and molecular docking were employed to identify potential drug candidates against these biomarkers. Among the seven machine learning models initially evaluated, DISCR resulted as the most accurate disease stage classifier. Ensemble feature selection identified ten top genes, among which eight were recognized as potential biomarkers based on survival analysis. These include genes ABAT, ABCB11, MBTPS1, and ZFP1 mostly involved in alanine and glutamate metabolism, butanoate metabolism, and ER protein processing. Through drug repurposing, 81 candidate drugs were found to be effective against these markers genes, with Diosmin, Esculin, Lapatinib, and Phenelzine as the best candidates screened through molecular docking and MMGBSA. The consensus derived from multiple methods enhances the accuracy of identifying relevant robust biomarkers for NAFLD-associated HCC. The use of these biomarkers in a multiphase drug repurposing strategy highlights potential therapeutic options for early intervention, which is essential to stop disease progression and improve outcomes.
1 Introduction
The alarming rise in the incidence of non-alcoholic fatty liver disease (NAFLD), triggered by obesity and the type 2 diabetes mellitus (T2D) epidemic, has increased the concerns within the healthcare system (Teng et al., 2023). NAFLD can progress to non-alcoholic steatohepatitis (NASH), liver fibrosis and cirrhosis, or even hepatocellular carcinoma (HCC), the most common form of primary liver cancer. HCC is associated with a poor prognosis, partly because it is often diagnosed at a late stage. Furthermore, the lack of approved pharmaceutical treatments specifically targeting NAFLD-induced HCC (Zhang and Yang, 2021) necessitates the urgent need for targeted therapeutic interventions. High-throughput omics technology has generated extensive gene expression datasets, allowing diverse new approaches to improve analysis and interpretation (Chen C. et al., 2023). The transition from NAFLD to HCC follows a prolonged timeline of 5–15 years, posing difficulties in conducting patient research (Straś et al., 2020). This challenge can be addressed by integrating data from various samples, though identifying key regulators of disease progression remains difficult. Conventional methods analyze disease stages separately, but merging these results often leads to issues like overfitting, technical noise, and reduced robustness (Posekany et al., 2011). These challenges can significantly impact the reliability and generalizability of the results. Machine learning-based feature selection has recently emerged as a solution to this problem. Recently, a machine learning (ML)-based approach has been applied to breast cancer prediction and classification by the detection of malignant cells using models like XGBoost, logistic regression, K-nearest neighbor, etc., (Chen H. et al., 2023). This kind of method holds great potential for early diagnosis of cancer. The results of the ML-based studies using imaging, such as lung cancer CT scans, showed promising results in identifying cancer subtypes (Nazir et al., 2023). Biomarker selection for early detection using gene expression data can be accomplished through robust feature selection methods, which have recently been applied in breast cancer (Sarkar et al., 2021), gastric cancer (Azari et al., 2023), lung and colon cancers (Talukder et al., 2022), etc., In gene expression analysis, effective feature selection techniques can pinpoint the most relevant and unique genes or molecular characteristics (Barrera et al., 2007), which facilitates the development of robust and easily interpretable gene signature models. Ensemble feature selection is a recently introduced approach, that enhances the robustness and accuracy of selected features by combining the results of multiple feature selection methods (Barrera et al., 2007; Bolón-Canedo and Alonso-Betanzos, 2019). In the last few years, this approach has been found to be effective in cancer gene expression data analysis, and in the identification of key genes as the most relevant features (Koul and Manvi, 2020; Khatun et al., 2023). In this study, after selecting and preprocessing microarray datasets, seven machine-learning techniques such as DISCR (Discriminant Analysis), NB (Naive Bayes), RF (Random Forest), DT (Decision Tree), KNN (K-Nearest Neighbors), SVM (Support Vector Machine), and ANN (Artificial Neural Network) were applied for disease stage classification. The method with the highest classification accuracy was selected using a 10-fold cross-validation for further analysis. Next, twelve feature selection strategies were utilized to identify the most significant genes. Among these twelve techniques, CIFE (Conditional Informative Feature Extraction), JMI(Joint Mutual Information), and MIM(Mutual information maximization) were based on mutual information, which selects features based on their relevance and dependency on the target variable, aiming to capture the most informative attributes for classification or analysis purposes (Gao et al., 2018). The Kendall Tau, Pearson, and Spearman methods selected the features based on their correlation or association with the target variable, focusing on measuring the strength and direction of the relationship between variables (El-Hashash and Shiekh, 2022). The other embedded methods, LASSO (Least Absolute Shrinkage and Selection Operator), Ridge, and gradient boosting utilize regularization techniques to penalize the complexity of the model, encouraging simpler models that generalize well to new data (Li Y. et al., 2022; Bhandari et al., 2022). These methods aim to prevent overfitting by constraining the coefficients of the features, thus promoting sparsity and improving the model’s interpretability and predictive performance. This study enhances feature selection, model regularization, and generalization by integrating various methods. This ensemble approach leverages diverse insights enhancing robustness and stability while revealing complex data patterns. (Castellanos-Garzón et al., 2017). This approach of feature selection helps in identifying the key genes as features that are subsequently evaluated for their prognostic potential as biomarkers in HCC applying the Cox proportional hazards model (Mohammed et al., 2021). Furthermore, it incorporates a biomarker-driven drug repurposing approach using identified biomarker genes as targets to screen out suitable drug candidates from the library of existing drugs. Drug repurposing has gained attention identification of novel uses of existing drugs, either through new combinations or in the treatment of different diseases (Krishnamurthy et al., 2022). Potential drugs were identified using connectivity map analysis, text mining, drug-gene interaction data, etc. These drug candidates were further assessed through molecular docking to evaluate their binding affinity with target proteins and to explore the therapeutic potential of these existing drugs against new targets.
2 Materials and methods
2.1 Data collection and preparation
The microarray data and clinical information for Control, Healthy obese, NAFLD, NASH, and HCC samples were obtained from the NCBI Gene Expression Omnibus (GEO) (Barrett et al., 2013) and Array Express (Parkinson et al., 2007) database. This dataset comprised a total of 132 samples with GEO accession numbers: GSE48452 with platform ID - GPL11532 (Affymetrix Human Gene 1.1 ST Array); GSE25097 with platform ID - GPL10687 (Rosetta/Merck Human RSTA Affymetrix 1.0 microarray). Details of datasets and respective sample information were provided as Supplementary Material S1. Following the merging of data, the R package “imputeTS” (version 3.3) (Moritz and Bartz-Beielstein, 2017) was utilized to impute missing values. This imputation process was only carried out on less than 5% of randomly missing values. Afterward, the “Limma” (version 3.57.3) package (Ritchie et al., 2015) was utilized to remove batch effects specific to each study, and data normalization was performed utilizing the robust multichip averaging (RMA) method (Bioconductor, 2023). Figure 1 presents a schematic diagram representing the methodology.
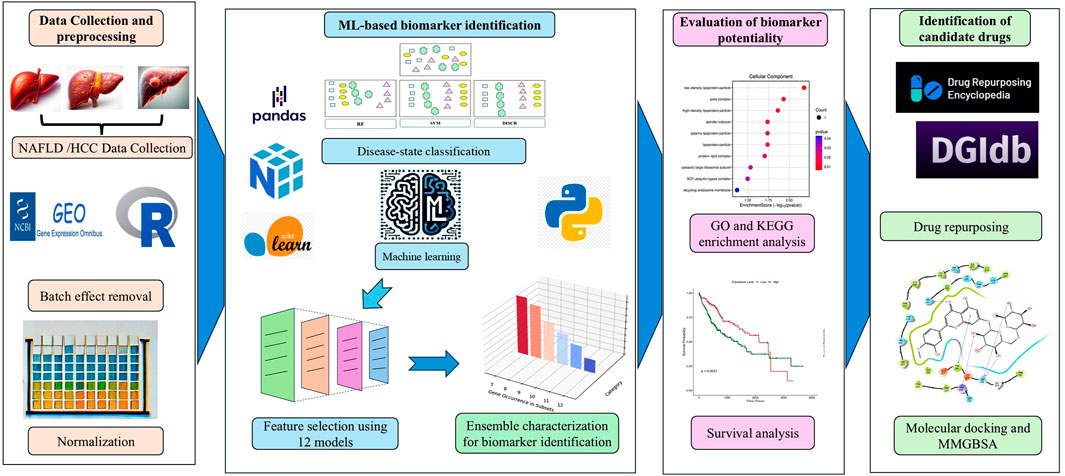
Figure 1. Schematic diagram depicting methodology.
2.2 Disease state classification using machine learning
The entire dataset, encompassing samples from various disease stages ranging from NAFLD to HCC, is utilized to identify a suitable machine-learning technique with the primary objective of effectively categorizing the data into distinct groups based on disease stages. Each of the following machine learning (ML) models is applied individually to the entire pre-processed dataset using 10-fold cross-validation: DISCR (Discriminant Analysis), NB (Naive Bayes), RF (Random Forest), DT (Decision Tree), KNN (K-Nearest Neighbors), SVM (Support Vector Machine), and ANN (Artificial Neural Network). This procedure guarantees a thorough assessment and reduces the risk of overfitting by training and verifying the models on distinct subsets of the data. Through this screening, the ML technique with the highest accuracy values and other pertinent performance indicators is chosen for further investigation.
2.3 Ensemble feature selection approach for identification of genes involved in disease progression
Twelve different feature selection methods are applied to the entire dataset. Each of these methods individually selects subsets of genes interactively, comprising varying quantities, such as the top 20, 30, 40, 50, and beyond. Subsequently, each subset generated by the different methods is utilized in the chosen machine learning technique, employing 10-fold cross-validation to calculate the classification accuracy. This guarantees that the performance of the chosen characteristics is comprehensively assessed. Furthermore, each feature selection method yields a subset of genes based on the highest level of accuracy attained. This technique enables the identification of the most pertinent genes that make a major contribution to classification, ensuring a strong and dependable selection of features. Among the feature selection techniques used, the ReliefF algorithm evaluates each feature’s significance based on its ability to distinguish between similar cases. It iteratively selects a sample, comparing it with the nearest samples from both the same and different classes. Features that effectively differentiate between classes receive higher weights, while those that distinguish within the same class receive lower weights (Urbanowicz et al., 2018). The process is repeated across multiple instances to reliably estimate feature importance, making ReliefF effective for noisy, multi-class datasets. The basic equation for updating the feature weights in ReliefF is:
Where,
W [A] This represents the updated weight or importance score of feature AAA.
Cramér’s V is a filter-based technique that measures the correlation between two nominal variables. It involves creating a contingency table to compute the Chi-Squared statistic, which quantifies the strength of the association between the variables (Kearney, 2017). To account for the bias, the Chi-Squared estimate is reformulated as a Phi-Squared value. The degrees of freedom are subtracted from both the row and column counts to obtain the denominator of the Cramér’s V formula. Taking the square root of the quotient resulting from dividing the corrected Phi-Squared value by the denominator yields Cramér’s V in the range from 0 for no association up to 1 for the perfect association. This measure helps determine categorical data as it offers an idea of the strength with which variables are correlated without the assumption of any linear relation.
Chi-Squared Statistic
where
Phi-Squared (
where
Corrected Phi-Squared
where
Corrected Row and Column Counts
Denominator:
Cramér’s V:
Pearson’s correlation coefficient (r) quantifies the strength and direction of a linear relationship between two variables (Nasir et al., 2020), ranging from −1 to +1. A value of +1 indicates a perfect positive correlation, where both variables increase together; −1 signifies a perfect negative correlation, where one variable increases as the other decreases; and 0 denotes no linear correlation.
Pearson’s correlation coefficient (
Where:
•
•
•
•
•
•
•
Kendall’s Tau is a non-parametric measure that quantifies the ordinal correlation between two variables (Valencia et al., 2019), focusing on the direction and magnitude of their association. While Pearson’s correlation coefficient measures only linear relationships, Kendall’s Tau is a measure that is very useful in cases where observations do not meet the assumptions of normality or linearity. It counts concordant and discordant pairs of observations for its calculation. Values range from −1 (perfect inverse correlation) up to +1 for perfect direct correlation. A value of 0 indicates no association.
Kendall’s Tau
Where:
• Concordant pairs: For any two pairs of observations
• Discordant pairs: For any two pairs of observations
•
Another method, Spearman’s rank correlation coefficient (ρ) is a statistical measure that quantifies the degree and direction of the relationship between two variables that have been ranked (Schober and Schwarte, 2018). It measures how well the relationship between two variables can be represented as a monotonic function. This means that the Spearman rank correlation varies from Pearson’s correlation, as it considers the variables’ ranks while trying to figure out their relationship and not the variable’s actual values. Hence, it is applicable in assessing ordinal data that deviate from the assumptions of linearity and normalcy.
Spearman’s rank correlation coefficient
Where:
•
•
On the other hand, Conditional Infomax Feature Extraction (CIFE) selects features by maximizing a score J(S) (Lin and Tang, 2006). Features are incrementally added to the set S based on their significance and redundancy relative to already chosen features. In this way, the algorithm continues till it gets some pre-defined features or threshold scores. CIFE intends to offer an informative feature set that is concise in length, by managing relevance and redundancy towards better facilitation of subsequent ML models.
The CIFE can be expressed as
Where:
•
•
•
•
Among mutual information-based feature selection methods, the Joint Mutual Information (JMI) criterion is used to identify the most relevant features for a specific task. JMI selects features based on their high mutual information with the target variable while considering the combined information among selected features (Bennasar et al., 2015). This way of approaching features ensures that they are individually relevant and also collectively informative to reduce redundancy while enhancing the predictive capability of the model. JMI helps build an efficient and effective feature set, resulting in balancing relevance with redundancy.
The JMI criterion can be defined as:
Where:
•
•
•
The goal is to maximize
Another mutual information-based method, The Maximum Relevance (MIM) criterion is a technique for selecting features that have the most mutual information with the target variable (Che et al., 2017). The main objective of MIM is to identify those attributes with the highest relevance to predict the outcome, such that it improves the performance of the machine learning models. This technique lessens the dimensionality of the data without losing the most informative attributes. MIM especially comes in handy in applications where the dataset comprises several features, and the identification of the most relevant ones can greatly enhance model efficiency and accuracy. The MIM criterion can be mathematically defined as:
Where:
•
Mutual information
where:
•
•
Normalized Mutual Information Feature Selection (NMIFS) is a feature selection technique that aims to find and rank features based on their normalized mutual information in relation to the target variable (Estévez et al., 2009). Mutual information quantifies interdependence between variables, showing how much one can inform about another. By standardizing this metric, NMIFS accounts for variable scales and distributions, helping to identify the most informative features for predicting the target variable and enhancing the effectiveness and precision of machine learning models. The NMIFS score for a feature
Where:
•
•
•
Lasso, or Least Absolute Shrinkage and Selection Operator, is a regularization technique in linear regression that enhances feature selection and controls model complexity (Muthukrishnan and Rohini, 2017). By adding a penalty based on the absolute values of coefficients, Lasso reduces the coefficients of less important features to zero, promoting simpler models and avoiding overfitting. It is widely used in data science and machine learning to streamline models and focus on the most relevant features. The objective function minimized by Lasso is given by:
Where:
•
•
•
•
•
•
Ridge regression is a regularization method employed in linear regression models to mitigate overfitting and enhance generalization (Paul and Drineas, 2016). Ridge regression employs a
Gradient Boosting is an advanced ensemble learning method that iteratively combines decision trees. Unlike Random Forests, which build trees independently, Gradient Boosting constructs trees sequentially, with each tree correcting errors made by its predecessors (Otchere et al., 2022). It uses feature importance to identify significant features, revealing how much each feature contributes to accurate predictions. High feature importances allow for more contribution toward the overall impact of model performance while allowing some form of implicit feature selection, especially with complex datasets, making the model perform better and be more interpretable. The method includes several steps, such as -
Initialization of the model with a Constant:
Initialization of the model with a constant value, typically the mean of the target values for a regression problem. This can be represented as:
Where
Iterative tree building:
For
a. Computing the Pseudo-Residuals:
where
b. Fitting a Base Learner: Fit a decision tree (base learner)
c. to the pseudo-residuals
d. Updating the Model: Updating the model by adding the newly fitted tree, scaled by a learning rate
Combining the Trees:
The final model
Next, Feature selection in Gradient Boosting is typically achieved by examining feature importances derived from the model. Each feature’s importance is calculated based on its contribution to reducing the model’s prediction error. Feature importance can be computed as follows:
• Calculating the total reduction in the loss function due to splits involving each feature across all trees.
• Aggregating these reductions to assign an importance score to each feature.
Mathematically, the importance of the feature
Where,
2.4 Categorization of features using an ensemble of different subsets of features
The genes obtained from different feature selection approaches are used as subsets. These subsets were then used to create an ensemble by categorizing the genes by assigning values 12 to 1. A gene is classified as 12 if it appears in all twelve subsets, 11 if it is present in eleven of the twelve subsets, and so on. Subsequently, genes that fell into at least 6 subsets were selected for Cox regression-based survival analysis. This decision guarantees that a minimum of 50% of the feature selection methods will support the inclusion of these genes, hence strengthening the reliability subsequent to analysis.
2.5 GO and KEGG enrichment analysis
The ensemble approach yielded a consolidated list of genes, then annotated using DAVID tool version 6.8 (https://david.ncifcrf.gov/) (Sherman et al., 2022). The criteria for conducting Gene Ontology (GO) and KEGG pathway enrichment analysis were set as a p-value below 0.05 and a false discovery rate (FDR) below 0.05. The GO enrichment analysis was utilized to ascertain the biological activities of these genes. GO ontologies are divided into three categories: molecular function (MF), cellular component (CC), and biological process (BP). The KEGG pathway enrichment analysis identified metabolic pathways that showed a significant enrichment of genes, as compared to the total genome background. The SRPlot online toolkit (http://www.bioinformatics.com.cn/srplot) (Tang et al., 2023) was used to display the findings of the Gene Ontology (GO) and Kyoto Encyclopedia of Genes and Genomes (KEGG) pathway enrichment studies.
2.6 Survival analysis
Survival analysis was performed using the TCGA-LIHC (Liver Hepatocellular Carcinoma) dataset to investigate the association between the expression level of the genes and overall survival. First, clinical data and gene expression data were retrieved from the TCGA-LIHC cohort using the “TCGAbiolinks” package (Colaprico et al., 2016). The gene expression data is preprocessed, and a Variance Stabilizing Transformation (VST) is applied using DESeq2 (Love et al., 2014). The expression levels of the genes were extracted, and a median value was calculated to stratify the samples into “HIGH” and “LOW” expression groups. Next, the clinical data is merged with the gene expression data, and a Cox proportional hazards regression model is fitted to estimate the hazard ratio (HR) and its 95% confidence interval (CI) using the survival package (Therneau, 2021). Finally, a Kaplan-Meier survival curve is plotted using the “survminer” package (Pawar et al., 2022).
2.7 Screening of possible drug candidates for repurposing
The biomarkers identified through survival analysis were used as input in two separate databases i.e., DGIdb (The Drug Gene Interaction Database) (Cannon et al., 2024) and Drug repurposing encyclopedia (Li et al., 2023). Additionally, clue.io COMMAND app web tool (Xie et al., 2022) was utilized to screen potential drug candidates. The DGIdb database uses a combination of expert curation and text-mining approaches to mine drug-gene interactions mined from DrugBank, PharmGKB, ChEMBL, Drug Target Commons, and others. On the other hand, The Drug Repurposing Encyclopedia utilizes the Molecular Signatures Database (MSigDB, https://www.gsea-msigdb.org/gsea/msigdb/), and consensus drug profiles from DREIMT (http://www.dreimt.org/), which are derived from the Connectivity Map (CMap) LINCS gene expression dataset (https://clue.io/). The command app also utilizes connectivity map (CMap) analysis to screen possible drugs.
2.8 Molecular docking and MMGBSA analysis
2.8.1 Structure retrieval
The potential drugs screened through drug repurposing were used as ligands in the docking analysis against the targets implicated in disease progression. The chemical structures of the drugs were obtained from the PubChem database (https://pubchem.ncbi.nlm.nih.gov/) (Wang et al., 2009). The structures of the targets, namely, ABAT (PDB ID: 1OHW), ABCB11 (PDB ID: 6LRO), C8B (PDB ID: 3OJY), and FBX23 (PDB ID: 416J), were obtained from the RCSB database (https://www.rcsb.org/) (Deshpande et al., 2005) in PDB format. The RCSB-PDB database (https://www.rcsb.org/) (Deshpande et al., 2005) lacked monomeric structures for the proteins APOF, CENPV, MBTPS1, and ZFP1. Therefore, the protein sequences were obtained from the NCBI database, and a BLAST search was conducted in the SWISS-MODEL template library to identify structurally comparable homologous structures. The structures exhibiting similarity were subsequently acquired via the SWISS-MODEL tool (Kiefer et al., 2009).
2.8.2 Protein and ligand preparation
The proteins were prepared using the Schrödinger software (Maestro Version 12.5.139, Schrödinger, LLC, New York) with the OPLS3 force field (Harder et al., 2016) to ensure precise depiction. Similarly, the ligands were produced using the OPLS3 force field in LigPrep (Maestro Version 12.5.139, Schrödinger, LLC, New York). This preparatory step aimed to ensure that the docking analysis was consistent and reliable.
2.8.3 Docking procedure
Before docking analysis, receptor grids were created for each protein using Glide (Maestro Version 12.5.139, Schrödinger, LLC, New York) to ensure precise accommodation. The grids were constructed with accurate coordinates based on binding pocket predictions from PrankWeb (https://prankweb.cz/) (Jendele et al., 2019). After generating the grids, the docking scores were calculated systematically using Glide’s Extra-precision (XP) docking model. The scores provided measurable data on the binding affinities between each ligand and its respective protein target.
2.8.4 Binding energy calculations using Prime/MM GBSA analysis
The binding free energies of the protein-ligand complex are evaluated using the Molecular Mechanics-Generalized Born Surface Area (MM-GBSA) approach, implemented in the Prime module of the Schrödinger suite (Maestro Version 12.5.139, Schrödinger, LLC, New York). The calculations utilize the OPLS 2005 force field and the VSGB solvation model for accurate energy estimations.
3 Results
3.1 Key features selected by the ensemble feature selection approach
After data preparation, seven well-known machine learning techniques such as DISCR, NB, RF, DT, KNN, SVM, and ANN, were tested on the entire dataset. Figure 2 illustrates the accuracy scores of these machine learning techniques, each conducted independently on the whole preprocessed dataset using 10-fold cross-validation. Based on the accuracy values, DISCR outperformed other machine learning techniques, achieving the highest accuracy score of 0.90.
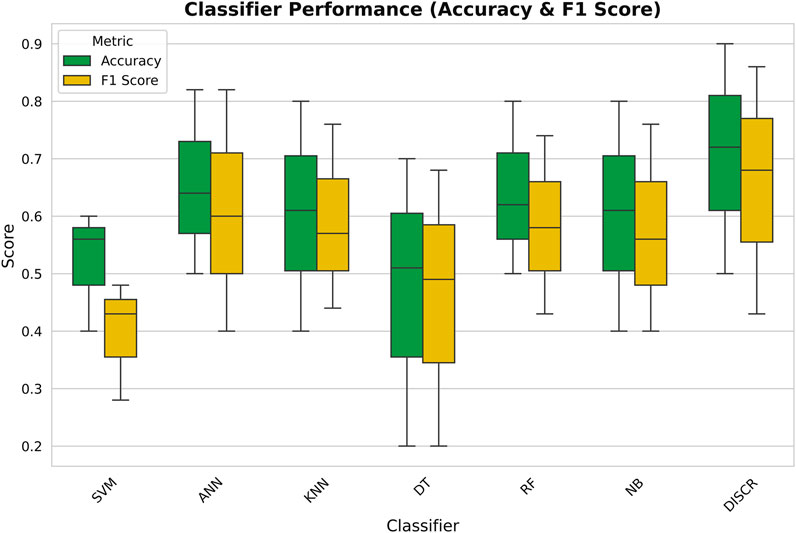
Figure 2. Box plot comparing the performance of different classifiers in terms of Accuracy (green) and F1 Score (yellow).
After selecting DISCR as the optimal classification method, twelve feature selection models were applied to identify the most significant gene subsets. These models included ReliefF, Cramér’s V, Kendall’s Tau, Pearson’s correlation, Spearman’s correlation coefficient, CIFE, JMI, MIM, NMIFS, LASSO, RIDGE, and Gradient Boosting. Iteratively, each of the twelve methods separately selects different subsets of genes like top 30, 40, 50, and so on. DISCR with 10-fold cross-validation is used for each subset of the different methods separately to check the classification accuracy. The accuracy details for different subsets of the genes, such as 30, 40, 50 to 150 genes, are reported in Table 1. Out of all the filter-based strategies, Relief F achieved the greatest accuracy of 0.70297 using a set of 30 characteristics. Similarly, the accuracy reached by Cramér’s V, Kendall Tau, Pearson’s correlation, and Spearman’s correlation coefficient was 0.623762, 0.683168, 0.722772, and 0.673267, respectively. These accuracies were obtained using 40, 20, 20, and 10 features. Among the approaches that use mutual information, CIFE, JMI, MIM, and NMIFS achieved accuracies of 0.643564, 0.752475, 0.475248, and 0.712871 using 40, 30, 70, and 20 features, respectively. Within the set of embedded methods, the LASSO algorithm achieved the highest accuracy score of 1 while using 40 features. Ridge and elastic-net algorithms achieved an accuracy of 0.752475 and 0.712871, respectively, using a total of 30 features. Figure 3 illustrates the performance matrices of different feature selection models (A-D) (Performance metrics for different feature selection models (E-L) were provided as Supplementary Material S2).
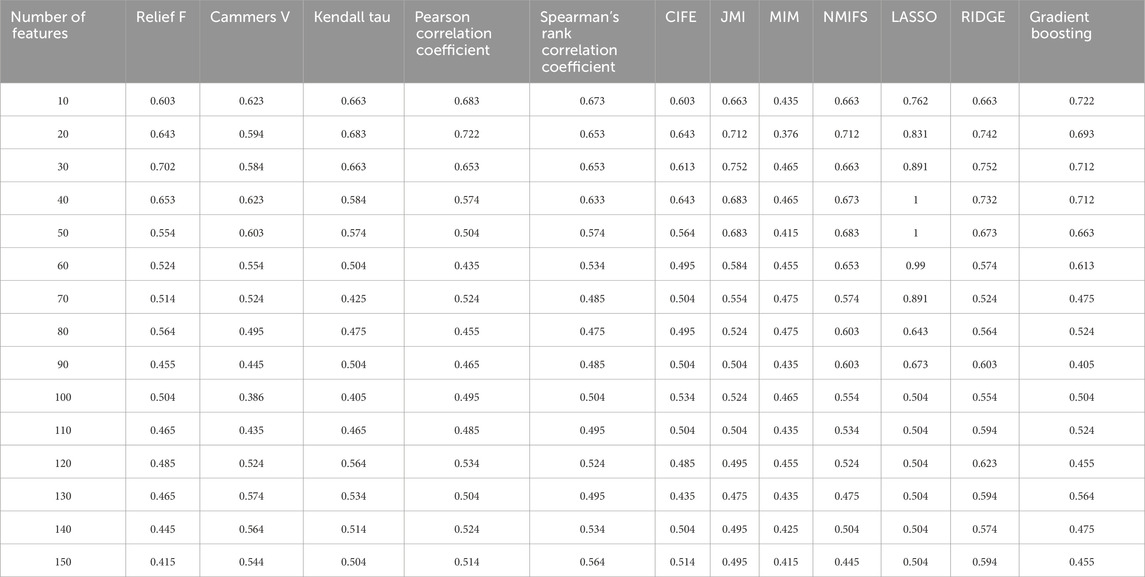
Table 1. Classification accuracy values of DISCR using twelve separate feature selection methods.
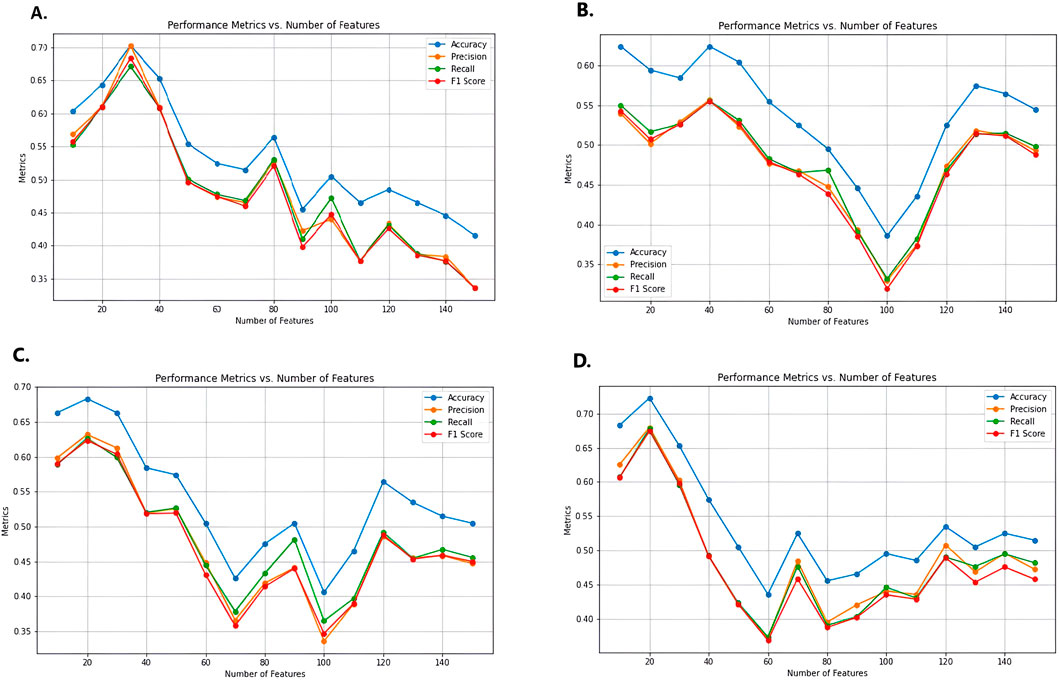
Figure 3. Performance metrics for different feature selection models, (A) Relief F, (B) Cammers V, (C) Kendall Tau, and (D) Pearson Correlation. Metrics for the rest of the feature selection models (E-L) were provided as supplementary file 2. Here X-axis represents the numbers of features, and the Y-axis represents performance metrics.
The subsets of genes obtained from different feature selection approaches are subsequently merged to create an ensemble set of genes. These genes are then categorized from 12 to 1 using a consensus approach with those scoring at least 6 being considered as most important features. Through this ensemble approach a set of ten genes were identified. These genes include C8B (Complement C8 Beta Chain), APOF (Apolipoprotein F), FBXL3 (F-Box and Leucine Rich Repeat Protein 3), ABAT (4-Aminobutyrate Aminotransferase), ZFP1 (ZFP1 Zinc Finger Protein), MBTPS1(Membrane Bound Transcription Factor Peptidase, Site 1), CENPV (Centromere Protein V), METTL23 (Methyltransferase 23, Arginine), RPL9 (Ribosomal Protein L9), and ABCB11 (ATP Binding Cassette Subfamily B Member 11).
3.2 Evaluating the biomarker potential through survival analysis
Kaplan-Meier survival analysis was used to evaluate the predicted survival probability over time in liver cancer patients, comparing normal and HCC samples based on the expression levels of key genes identified through an ensemble approach. Out of the ten identified genes, eight genes were found to have the worst overall survival rate for HCC. The identified genes were ABAT (HR: 1.69), C8B (HR: 1.69), FBXL3 (HR: 1.43), ZFP1 (HR: 1.35), ABCB11(HR: 1.33), MBTPS1(HR: 1.21), CENPV (HR: 1.2) and APOF (HR: 1.18). In the case of ABAT gene, the average hazard ratio stands at 1.69. This suggests that individuals with high gene expression face a 69% elevated risk of death compared to those with low gene expression, regardless of the circumstance as depicted in Figure 4. Similarly, for C8B and FBXL3, high expression corresponds to a 69% and 43% increased risk of death, respectively, in comparison to scenarios with low expression of these genes. HR value greater than 1 indicates a higher hazard rate in the reference group compared to the comparison group, suggesting that genes with higher expression in the comparison group are associated with an increased risk of death. Therefore, these genes could serve as predictive markers for poor prognosis. Survival analysis results of the rest of the genes are provided in Supplementary Material S3.
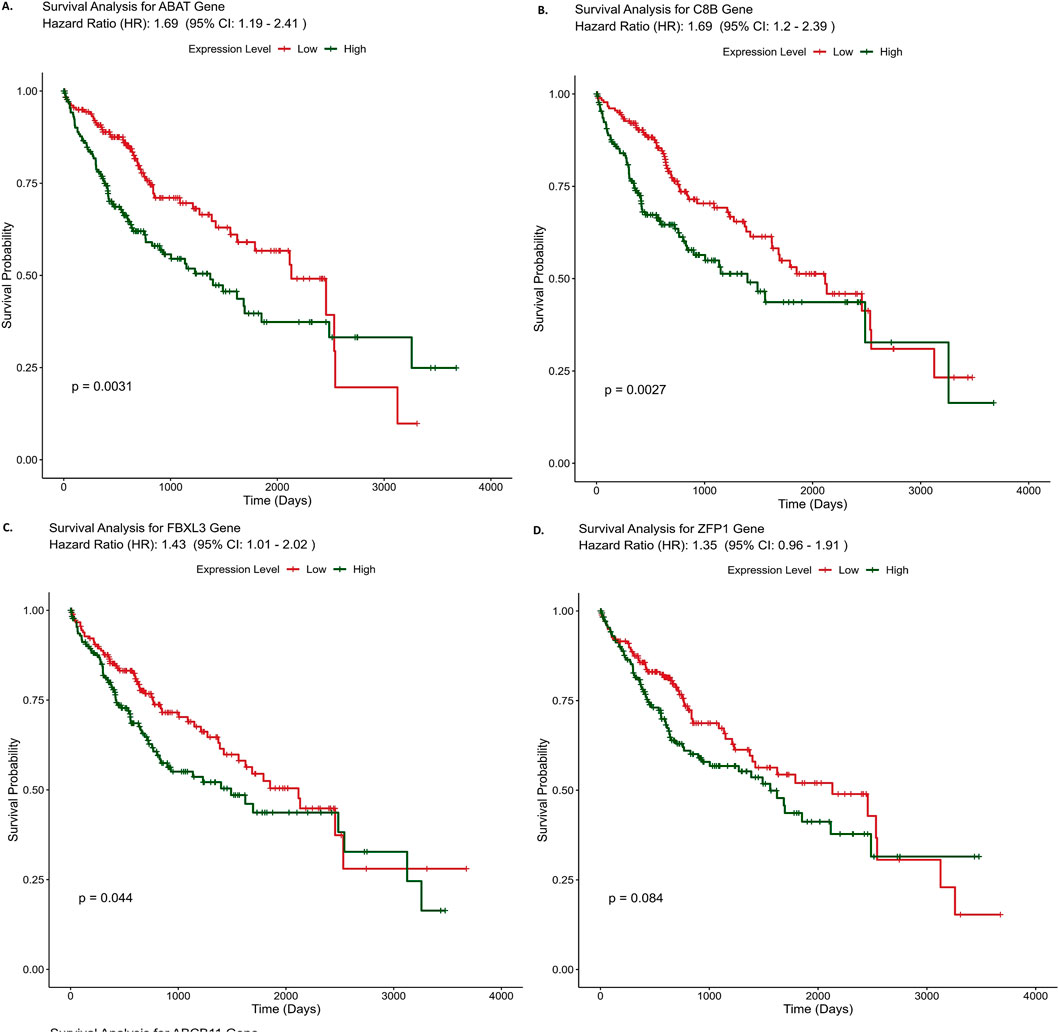
Figure 4. Survival curve analysis results of three hub genes (A)- ABAT, (B)- C8B, (C)- FBXL3 and (D)- ZFP1. X-axis represents time in months and Y-axis represents denotes survival probability, survival curve for other genes (E-J) are provided in supplementary file 3.
3.3 GO term enrichment analyses and KEGG pathway analyses
The gene ontology analysis using the ten identified genes from feature selection and based on the selected identifier - “OFFICIAL GENE SYMBOL,” and p-value < 0.05 and FDR <0.05 cut-offs yielded significant GO terms, depicted in Figure 5, for the marker genes. The enriched GO terms related to biological processes found to be negative regulation of gamma-aminobutyric acid secretion (GO:0014053), histone H3-R17 methylation (GO:0034971), gamma-aminobutyric acid biosynthetic process (GO:0009449), positive regulation of catecholamine metabolic process (GO:0045915), regulation of cholesterol biosynthetic process (GO:0045540), regulation of sterol biosynthetic process (GO:0106118), etc. The results suggest the involvement of metabolism and epigenetic processes, indicating dynamic changes in the disease progression. The top GO terms associated with cellular components terms identified as membrane attack complex (GO:0005579), low-density lipoprotein particle (GO:0034362), pore complex (GO:0046930), plasma lipoprotein particle (GO:0034358), etc; suggesting the involvement of membrane structure changes, lipid transport, etc, that are key characteristics of changes due to lipid accumulation and oxidative damage in hepatic cells in cellular dysfunction. The GO terms associated with molecular functions are histone-arginine N-methyltransferase activity (GO:0008469), carbon-sulfur lyase activity (GO:0016846), cholesterol binding (GO:0015485), pyridoxal phosphate binding (GO:0030170), etc., indicating lipid interaction and metabolic processes as important factors in this disease progression.
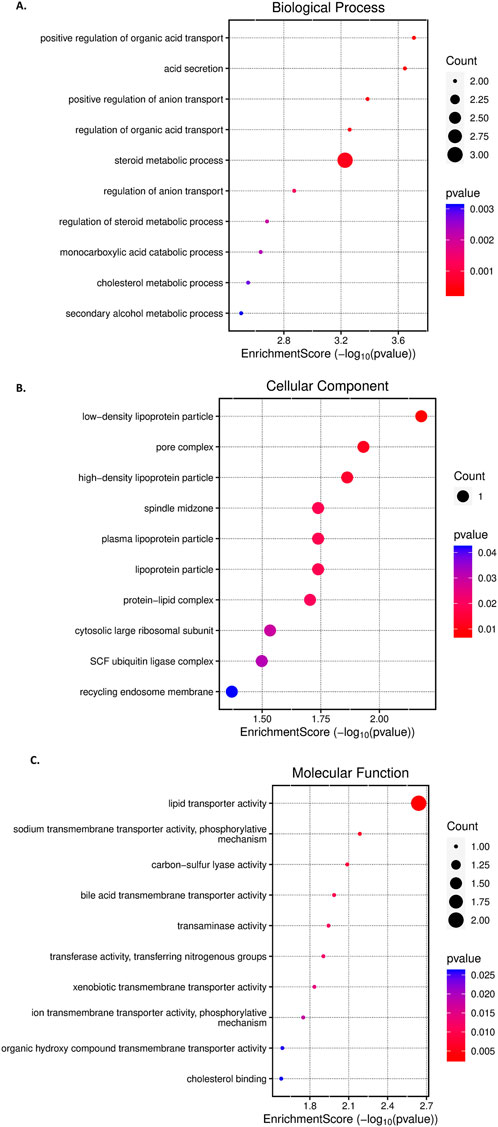
Figure 5. The results of the Gene Ontology (GO) enrichment analysis, visualized through a bubble chart, (A)-GO terms related to Biological Processes, (B)-GO terms associated with Cellular Components, and (C)-GO terms related to Molecular Functions. Each bubble on the Y-axis represents a different GO term, while the X-axis displays the enrichment score. The size of each bubble corresponds to the gene counts associated with the term. The colour of the bubbles reflects the P-value for each GO term, with the intensity of red indicating higher corrected P-values.
The genes were also subjected to KEGG pathway analysis to determine their association with their corresponding biological pathways. A total of 13 pathways-related KEGG terms were obtained from the database. The criteria of p-value less than 0.05 and FDR less than 0.05 were used for analysis. The top enriched pathways and the respective gene counts are depicted in Figure 6. The KEGG analysis results showed that the genes are enriched in Butanoate metabolism (hsa00650), Propanoate metabolism (hsa00640), Alanine aspartate and glutamate metabolism (hsa00250), Complement and coagulation cascades (hsa04610), Protein processing in the endoplasmic reticulum (hsa04141), etc.
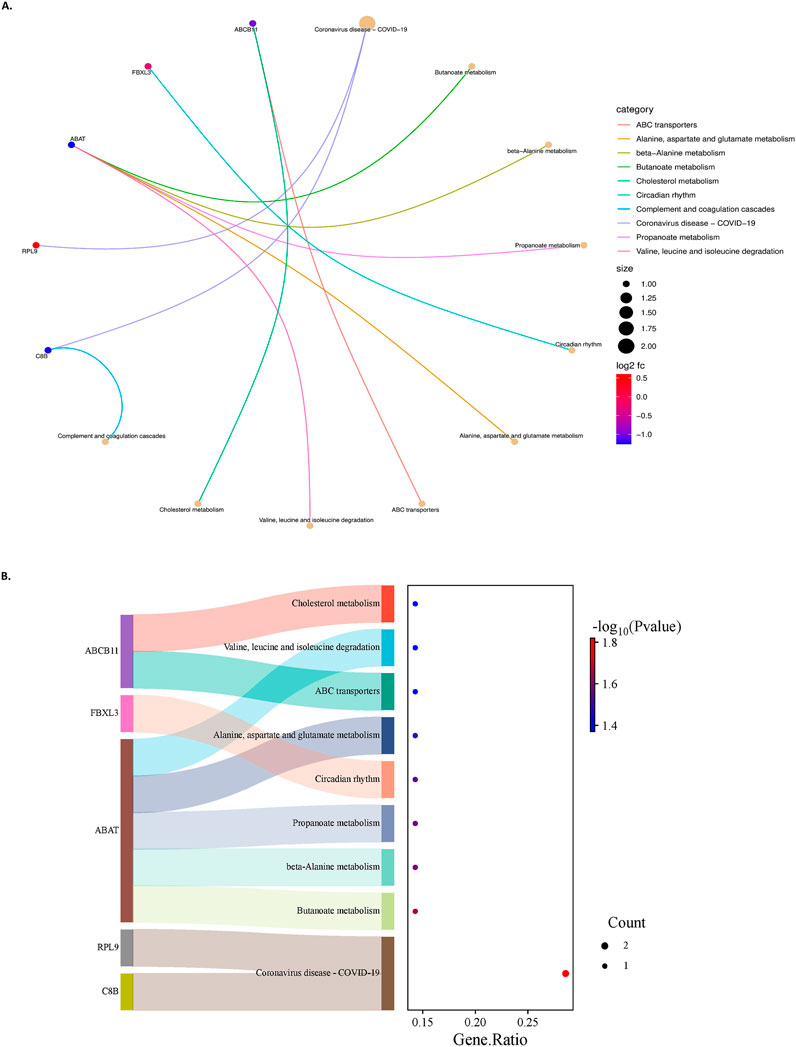
Figure 6. (A)- A chord plot represents pathways and genes’ relationship. The size of the pathway bubbles increases with the number of connected genes. (B)- The left side displays a Sankey plot, illustrating the genes within each pathway. The right side features a dot plot, where the dot sizes represent the number of genes, and the dot colours indicate P values.
3.4 Multiphase drug repurposing strategy based on identified biomarkers
The integrated approach of drug repurposing, which utilized connectivity map analysis and drug-gene interaction text-mining, etc, facilitated the creation of a library of potential repurposed drugs. This resulted in the identification of 81 potential candidate drugs. All these candidates have been utilized for molecular docking to analyze further interactions (details of the drugs are given in Supplementary Material S4). Among these 81 drugs, DGIdb (The Drug Gene Interaction Database) based screening identified a total of 19 drugs. The drugs with the highest interaction scores (IS) were Vigabatrin (IS- 11.79601078), Divalproex sodium (IS- 8.847008084), and Pyruvic Acid (IS-5.89800539). Screening using the Drug Repurposing Encyclopedia (DRE) database identified a total of 55 drugs, with Scopolamine (Enrichment score (ES) - 0.973), Amiloride (ES - 0.971), Damnacanthal (ES - 0.967), and Esculin (ES - 0.962) showing the highest enrichment scores. In addition, the search conducted by the Command app revealed a total of 6 drugs, including Glibenclamide, Phenelzine, etc.
3.5 Drug-target interaction analysis through molecular docking and MM-GBSA calculations
Docking results showed good interaction between ZFP1, C8B, MBPTS1, CENPV, ABCB11, and Diosmin with docking scores of −11.6821 kcal/mol, −11.134 kcal/mol, 10.4712 kcal/mol, −10.2391 kcal/mol, and −9.85606 kcal/mol respectively (Figures 7A–E). There are three hydrogen bonds between ZFP1 and Diosmin at THR112, ASN116 and GLU133 positions (Figure 7A) and eight hydrogen bonds between C8B and Diosmin at positions–ARG82, GLN65, CYS79, THR423, ASP424, LEU259, TYR166 and TYR141 (Figure 7B). The hydrogen bond interactions between MBPTS1 and Diosmin found at VAL54, TRP556, MET353, ARG386, and ASN515 (Figure 7C) and the interactions between CENPV and Diosmin included Hydrogen bonds at HIS210, ARG225, SER254 positions and PI-PI interactions at TYR561 and TRP256 positions (Figure 7D). The details about the interactions between top protein-ligand complexes are provided in Supplementary Material S5. ABAT and Esculin with a docking score of −4.30418 kcal/mol (Figure 7H). APOF and Lapatinib with a docking score of −6.90333 kcal/mol (Figure 7G), indicating a strong interaction between the protein and ligand. A satisfactory interaction has also been observed between FBX23 and Phenelzine with a docking score of −6.30952 kcal/mol (Figure 7F). The MM-GBSA analysis supported the docking results, showing strong binding affinities. CENPV-Diosmin had a binding free energy of −100.71 kcal/mol, with Van der Waals and electrostatic contributions of −49.50 and −46.93 kcal/mol, respectively. Similarly, C8B-Diosmin exhibited a binding free energy of −74.58 kcal/mol, with Van der Waals and electrostatic contributions of −37.40 and −52.24 kcal/mol (The detailed result of MM-GBSA analysis of the top ligand-protein complexes were provided as Supplementary Material S6). These results highlight a significant binding affinity driven by a balanced interplay of electrostatic, van der Waals, and lipophilic interactions.
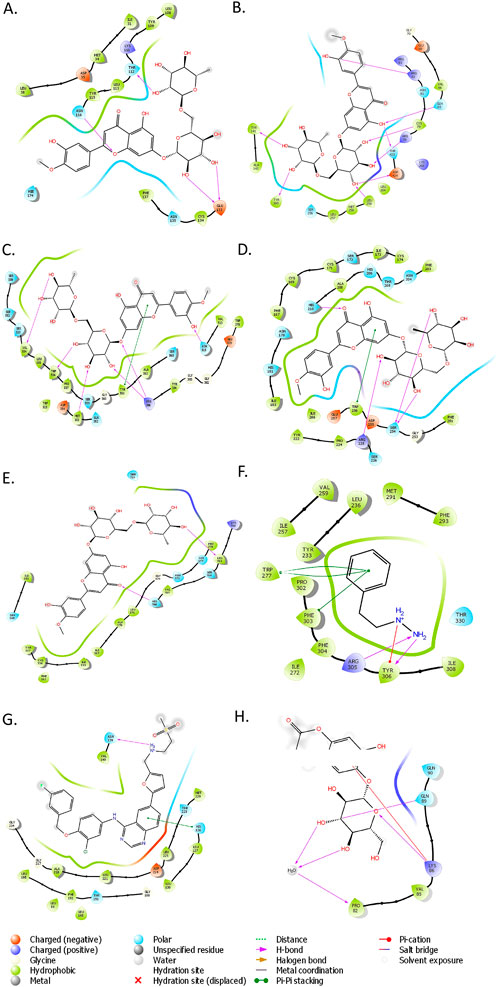
Figure 7. (A) ZFP1 with Diosmin, (B) C8B with Diosmin, (C) MBTPS1 with Diosmin, (D) CENPV with Diosmin, (E) ABCB11 with Diosmin, (F) FBXL3 with Phenelzine, (G) APOF with Lapatinib, and (H) ABAT with Esculin.
4 Discussion
Identification of biomarkers associated with NAFLD-driven HCC through conventional genomics-based methods is not an easy task, as the disease progresses through several stages over a prolonged period of time (Xu et al., 2023). The present work highlights the implementation of machine learning methods over conventional strategies in prognostic biomarker identification. The selection of an appropriate classifier for disease stage classification was the first step of this study, as different data types respond differently to various classifiers (de Amorim et al., 2023). It is essential to choose a classifier that is well-suited to the specific characteristics of the data to achieve optimal performance. Factors such as the distribution of the data, the presence of noise, and the complexity of the relationships between features can all influence the effectiveness of a given classifier (Saseendran et al., 2019). DISCR emerged as the most appropriate classifier in this analysis, exhibiting superior performance and reliability compared to other classifiers. The advantage of DISCR is that it can model intricate decision boundaries by discriminating between classes in a diverse set of data (Meyer-Baese and Schmid, 2014). Consequently, it was chosen for the subsequent steps of this study. Given that the primary objective of this work is to identify the key genes involved in the stage-wise progression of NAFLD to HCC, the main focus was on finding genes that are consistently expressed across all stages of the disease. While mutual information-based feature selection methods (such as JMI, MIM, and NMIFS) can effectively capture dependencies between variables, they also have potential disadvantages, such as high computational complexity and sensitivity to noise. To overcome these limitations, a variety of alternative feature selection methods were employed, including filter-based methods like ReliefF, Cramér’s V, Kendall’s Tau, Pearson correlation, and Spearman correlation coefficient, as well as embedded methods like LASSO, Ridge regression, and gradient boosting techniques. These methods help in addressing different aspects of feature selection. For example, filter-based methods assess the individual importance of each feature, without considering how they relate to each other (Bellotti et al., 2014), while embedded methods integrate feature selection into the model training process, simultaneously selecting the most relevant features, enabling more flexible and refined selection by considering how features interact with each other and influence the target variable (Bouchlaghem et al., 2022). This ensemble method enhances feature importance, improving model performance and identifying a robust set of ten co-expressed genes linked to disease progression. These genes include C8B, APOF, FBXL3, ABAT, ZFP1, MBTPS1, CENPV, METTL23, RPL9, and ABCB11. The pathway enrichment analysis results suggest that these genes are primarily involved in various pathways, including metabolism-related pathways such as Alanine, Aspartate, and Glutamate Metabolism, Propanoate Metabolism, Butanoate Metabolism, and Valine, Leucine, and Isoleucine Degradation. They are also involved in protein processing pathways like protein processing in the Endoplasmic Reticulum and Ribosome, as well as inflammation and immunological pathways like Complement and Coagulation Cascades and Systemic Lupus Erythematosus. These results indicate the involvement of both protein and lipid metabolism and inflammation in disease progression. Metabolic events specifically protein and lipid metabolism as well as ER-Mitochondrial dysregulation due to high metabolic stress is a long-suspected event for NAFLD to HCC progression (Zheng et al., 2023; Léveillé and Estall, 2019). Metabolic dysregulation in this disease progression is likely linked to inflammation and oxidative damage, which contribute to the onset of cirrhosis and the eventual development of liver cancer. This significant involvement of metabolism-related pathways also suggests that this evaluated energy production is possibly required for the rapid growth and division of cancer cells, a primary feature of cancer cells (Phan et al., 2014). Furthermore, out of the ten identified genes, eight genes ABAT, C8B, FBXL3, ZFP1, ABCB11, MBTPS1, CENPV, and APOF showed a strong association with lower overall survival rates in patients with HCC. The high hazard ratios (HR) for these genes indicate that patients with higher expression levels of these genes tend to have a poorer prognosis, such as a shorter overall survival time. The ABAT gene encodes the 4-Aminobutyrate Aminotransferase which is crucial for the catabolism of inhibitory neurotransmitters like GABA-transaminase (Besse et al., 2015). Altered expression of this gene has been observed in breast cancer (Chen et al., 2019), and its involvement in tumorigenesis and tumor immunity in HCC is a recent finding (Gao et al., 2022). The C8B gene encodes the beta subunit of complement complex 8 (Zhang Y. et al., 2021), which has recently been found to have predictive potential in hepatocellular carcinoma (HCC) development (Xiao et al., 2022). FBXL3 encodes for an F-box and leucine-rich repeat protein 3, which plays a vital role in regulating circadian rhythm (Fagiani et al., 2022). It works together with CRY2 to degrade the C-MYC protein, which helps prevent tumor growth (Huber et al., 2016b). FBXL3 has been previously reported as an important cancer marker (Huber et al., 2016a). The ZFP1 gene encodes zinc finger motif proteins, which play a crucial role in several transcriptional activation and repression processes (Li X. et al., 2022). ABCB11 encodes the primary ABC transporter, which is called the bile salt export pump (BSEP), in hepatic cells (Sohail et al., 2021). Malfunctioning BSEP is particularly significant in liver malignancies (Lagana et al., 2015). MBTPS1, which encodes the Membrane-Bound Transcription Factor Peptidase protein, has been implicated in the process of cancer cell proliferation (Hartal-Benishay et al., 2022). CENPV encodes Centromere Protein V, a vital component involved in the process of mitosis and exhibiting significant upregulation in several cancer types (Zhang S. et al., 2021). The APOF gene encodes Apolipoprotein F, which plays a role in lipid metabolism by binding to LDL and VLDL (Deprince et al., 2023). While its exact mechanism in HCC is not completely understood, it has been shown to act as a tumor suppressor and could be a promising target for therapeutic development in HCC. Subsequently, as these genes were identified as key modulators involved in this progression, they were further screened as targets to identify potential drug candidates utilizing DGIdb, Drug Repurposing Encyclopedia, and the COMMAND app. These databases utilize several data sources including gene expression data and approaches, such as expert curation, text-mining, etc to discover possible therapeutic interventions. The resulting combined list of 81 potential drugs was further screened through molecular docking and MM-GBSA analysis. The analysis revealed a strong interaction between the drug Diosmin and targets such as ZFP1, C8B, MBPTS1, CENPV, and ABCB11, characterized by numerous hydrogen bonds and pi-pi interactions. Diosmin is reported to have anti-inflammatory, antioxidative, insulin-sensitizing, antimutagenic, and antiulcer properties, and is widely being used for the improvement of blood-related insufficiencies (Huwait and Mobashir, 2022). ABAT had a robust interaction with Esculin, whilst APOF and FBX23 demonstrated notable interactions with Lapatinib and Phenelzine, respectively. Esculin is known to have anti-inflammatory properties and is used in multiple disorders like arthritis, ulcerative colitis, etc (Cai and Cai, 2023). Whereas, Lapatinib is reportedly used in breast cancer treatment (Opdam et al., 2012) and Phenelzine is a widely used drug in panic disorders, Chronic resistant depression, etc (Blanco et al., 2010). Since there are no direct medications available for idiopathic HCC, including those induced by NAFLD, and given that the pathogenesis of non-idiopathic HCC differs from idiopathic HCC, drug repurposing to target these mechanisms can significantly reduce the development time and cost of new treatments. This also ensures better patient outcomes using already approved drugs with known safety profiles. These findings indicate promising therapeutic paths that should be further investigated in clinical settings by experts.
5 Conclusion
In conclusion, ensemble feature selection framework used in this study improves the discrimination and stability of the final selected features. Using an ensemble feature selection approach, this study successfully identified key biomarkers, including ABAT, C8B, FBXL3, and ZFP1, providing valuable insights into NAFLD to HCC disease progression. A drug repurposing approach identified therapeutic agents, including Diosmin, Esculin, and Lapatinib, that were found to be effective against these marker genes. These findings offer a strong foundation for future research and therapeutic development in the treatment of NAFLD-mediated HCC. The integration of biomarker prediction with drug repurposing could enhance precision medicine approaches, paving the way for more effective and targeted treatments.
Data availability statement
The original contributions presented in the study are included in the article/Supplementary Material, further inquiries can be directed to the corresponding authors.
Ethics statement
Ethical approval was not required for the study involving humans in accordance with the local legislation and institutional requirements. Written informed consent to participate in this study was not required from the participants or the participants’ legal guardians/next of kin in accordance with the national legislation and the institutional requirements.
Author contributions
SG: Conceptualization, Data curation, Formal Analysis, Investigation, Methodology, Validation, Visualization, Writing – original draft, Writing – review and editing. SM: Supervision, Writing – review and editing. ST: Supervision, Writing – review and editing.
Funding
The author(s) declare that no financial support was received for the research and/or publication of this article. SG acknowledged the University of North Bengal for research assistant fellowship [University fellowship No- Ref. no.4304/R-2022].
Conflict of interest
The authors declare that the research was conducted in the absence of any commercial or financial relationships that could be construed as a potential conflict of interest.
Generative AI statement
The authors declare that no Generative AI was used in the creation of this manuscript.
Publisher’s note
All claims expressed in this article are solely those of the authors and do not necessarily represent those of their affiliated organizations, or those of the publisher, the editors and the reviewers. Any product that may be evaluated in this article, or claim that may be made by its manufacturer, is not guaranteed or endorsed by the publisher.
Supplementary material
The Supplementary Material for this article can be found online at: https://www.frontiersin.org/articles/10.3389/fbinf.2025.1522401/full#supplementary-material
References
Azari, H., Nazari, E., Mohit, R., Asadnia, A., Maftooh, M., Nassiri, M., et al. (2023). Machine learning algorithms reveal potential miRNAs biomarkers in gastric cancer. Sci. Rep. 13, 6147. doi:10.1038/s41598-023-32332-x
Barrera, J., Cesar, R. M., Humes, C., Martins, D. C., Patrão, D. F., Silva, P. J., et al. (2007). A feature selection approach for identification of signature genes from SAGE data. BMC Bioinforma. 8, 169–9. doi:10.1186/1471-2105-8-169
Barrett, T., Wilhite, S. E., Ledoux, P., Evangelista, C., Kim, I. F., Tomashevsky, M., et al. (2013). NCBI GEO: archive for functional genomics data sets—update. Nucleic Acids Res. 41 (D1), D991–D995. doi:10.1093/NAR/GKS1193
Bellotti, T., Nouretdinov, I., Yang, M., and Gammerman, A. (2014). Feature selection. Conformal Predict. Reliab. Mach. Learn. Theory, Adapt. Appl., 115–130. doi:10.1016/B978-0-12-398537-8.00006-7
Bennasar, M., Hicks, Y., and Setchi, R. (2015). Feature selection using joint mutual information maximisation. Expert Syst. Appl. 42 (22), 8520–8532. doi:10.1016/J.ESWA.2015.07.007
Besse, A., Wu, P., Bruni, F., Donti, T., Graham, B., Craigen, W., et al. (2015). The GABA transaminase, ABAT, is essential for mitochondrial nucleoside metabolism. Cell Metab. 21 (3), 417–427. doi:10.1016/j.cmet.2015.02.008
Bhandari, N., Walambe, R., Kotecha, K., and Khare, S. P. (2022). A comprehensive survey on computational learning methods for analysis of gene expression data. Front. Mol. Biosci. 9, 907150. doi:10.3389/fmolb.2022.907150
Bioconductor (2023). Normalizing Affy microarray data. Available online at: http://www.bioconductor.org/(Accessed August 13, 2023).
Blanco, C., Heimberg, R. G., Schneier, F. R., Fresco, D. M., Chen, H., Turk, C. L., et al. (2010). A placebo-controlled trial of phenelzine, cognitive behavioral group therapy and their combination for social anxiety disorder. Archives general psychiatry 67 (3), 286. doi:10.1001/ARCHGENPSYCHIATRY.2010.11
Bolón-Canedo, V., and Alonso-Betanzos, A. (2019). Ensembles for feature selection: a review and future trends. Inf. Fusion 52, 1–12. doi:10.1016/J.INFFUS.2018.11.008
Bouchlaghem, Y., Akhiat, Y., and Amjad, S. (2022). Feature selection: a review and comparative study. E3S Web Conf. 351, 01046–6. doi:10.1051/e3sconf/202235101046
Cai, T., and Cai, B. (2023). Pharmacological activities of esculin and esculetin: a review. Med. (United States) 102 (40), E35306. doi:10.1097/MD.0000000000035306
Cannon, M., Stevenson, J., Stahl, K., Basu, R., Coffman, A., Kiwala, S., et al. (2024). DGIdb 5.0: rebuilding the drug–gene interaction database for precision medicine and drug discovery platforms. Nucleic Acids Res. 52 (D1), D1227–D1235. doi:10.1093/NAR/GKAD1040
Castellanos-Garzón, J. A., Ramos, J., López-Sánchez, D., and de Paz, J. F. (2017). An ensemble approach for gene selection in gene expression data. Adv. Intelligent Syst. Comput. 616, 237–247. doi:10.1007/978-3-319-60816-7_29
Che, J., Yang, Y., Li, L., Bai, X., Zhang, S., and Deng, C. (2017). Maximum relevance minimum common redundancy feature selection for nonlinear data. Inf. Sci. 409–410, 68–86. doi:10.1016/J.INS.2017.05.013
Chen, C., Wang, J., Pan, D., Wang, X., Xu, Y., Yan, J., et al. (2023). Applications of multi-omics analysis in human diseases. MedComm 4 (4), 1–32. doi:10.1002/mco2.315
Chen, H., Wang, N., Du, X., Mei, K., Zhou, Y., and Cai, G. (2023). Classification prediction of breast cancer based on machine learning. Comput. Intell. Neurosci. 2023, 1–9. doi:10.1155/2023/6530719
Chen, X., Cao, Q., Liao, R., Wu, X., Xun, S., Huang, J., et al. (2019). Loss of ABAT-mediated GABAergic system promotes basal-like breast cancer progression by activating Ca2+-NFAT1 axis. Theranostics 9 (1), 34–47. doi:10.7150/thno.29407
Colaprico, A., Silva, T. C., Olsen, C., Garofano, L., Cava, C., Garolini, D., et al. (2016). TCGAbiolinks: an R/Bioconductor package for integrative analysis of TCGA data. Nucleic Acids Res. 44 (8), e71. doi:10.1093/NAR/GKV1507
de Amorim, L. B. V., Cavalcanti, G. D. C., and Cruz, R. M. O. (2023). The choice of scaling technique matters for classification performance. Appl. Soft Comput. 133, 109924. doi:10.1016/J.ASOC.2022.109924
Deprince, A., Hennuyer, N., Kooijman, S., Pronk, A. C. M., Baugé, E., Lienard, V., et al. (2023). Apolipoprotein F is reduced in humans with steatosis and controls plasma triglyceride-rich lipoprotein metabolism. Hepatology 77 (4), 1287–1302. doi:10.1002/hep.32631
Deshpande, N., Addess, K. J., Bluhm, W. F., Merino-Ott, J. C., Townsend-Merino, W., Zhang, Q., et al. (2005). The RCSB Protein Data Bank: a redesigned query system and relational database based on the mmCIF schema. Nucleic Acids Res. 33 (Suppl. l_1), D233–D237. doi:10.1093/NAR/GKI057
El-Hashash, E. F., and Shiekh, R. H. A. (2022). A comparison of the Pearson, spearman rank and Kendall Tau correlation coefficients using quantitative variables. Asian J. Probab. Statistics 36–48. doi:10.9734/ajpas/2022/v20i3425
Estévez, P. A., Tesmer, M., Perez, C., and Zurada, J. (2009). Normalized mutual information feature selection. IEEE Trans. Neural Netw. 20 (2), 189–201. doi:10.1109/TNN.2008.2005601
Fagiani, F., Di Marino, D., Romagnoli, A., Travelli, C., Voltan, D., Di Cesare Mannelli, L., et al. (2022). Molecular regulations of circadian rhythm and implications for physiology and diseases. Signal Transduct. Target. Ther. 7 (1), 41–20. doi:10.1038/s41392-022-00899-y
Gao, W., Hu, L., and Zhang, P. (2018). Class-specific mutual information variation for feature selection. Pattern Recognit. 79, 328–339. doi:10.1016/j.patcog.2018.02.020
Gao, X., Jia, X., Xu, M., Xiang, J., Lei, J., Li, Y., et al. (2022). Regulation of gamma-aminobutyric acid transaminase expression and its clinical significance in hepatocellular carcinoma. Front. Oncol. 12 (June), 1–16. doi:10.3389/fonc.2022.879810
Harder, E., Damm, W., Maple, J., Wu, C., Reboul, M., Xiang, J. Y., et al. (2016). OPLS3: a force field providing broad coverage of drug-like small molecules and proteins. J. Chem. Theory Comput. 12 (1), 281–296. doi:10.1021/acs.jctc.5b00864
Hartal-Benishay, L. H., Saadi, E., Toubiana, S., Shaked, L., Lalzar, M., Abu Hatoum, O., et al. (2022). MBTPS1 regulates proliferation of colorectal cancer primarily through its action on sterol regulatory element-binding proteins. Front. Oncol. 12 1–14. doi:10.3389/fonc.2022.1004014
Huber, A. L., Papp, S. J., Chan, A. B., Henriksson, E., Jordan, S. D., Kriebs, A., et al. (2016a). CRY2 and FBXL3 cooperatively degrade c-MYC. Mol. cell 64 (4), 774–789. doi:10.1016/J.MOLCEL.2016.10.012
Huber, A. L., Papp, S. J., Chan, A. B., Henriksson, E., Jordan, S. D., Kriebs, A., et al. (2016b). CRY2 and FBXL3 cooperatively degrade c-MYC. Mol. Cell 64 (4), 774–789. doi:10.1016/j.molcel.2016.10.012
Huwait, E., and Mobashir, M. (2022). Potential and therapeutic roles of Diosmin in human diseases. Biomedicines 10 (5), 1076. doi:10.3390/biomedicines10051076
Jendele, L., Krivak, R., Skoda, P., Novotny, M., and Hoksza, D. (2019). PrankWeb: a web server for ligand binding site prediction and visualization. Nucleic Acids Res. 47 (W1), W345–W349. doi:10.1093/nar/gkz424
Kearney, M. (2017). ‘Cramér’s V’. The SAGE Encyclopedia of Communication Research Methods. Thousand Oaks, CA: SAGE Publications, Inc. 4, 290. doi:10.4135/9781483381411
Khatun, R., Akter, M., Islam, M. M., Uddin, M. A., Talukder, M. A., Kamruzzaman, J., et al. (2023). Cancer classification utilizing voting classifier with ensemble feature selection method and transcriptomic data. Genes 14 (9), 1802. doi:10.3390/GENES14091802
Kiefer, F., Arnold, K., Kunzli, M., Bordoli, L., and Schwede, T. (2009). The SWISS-MODEL Repository and associated resources. Nucleic Acids Res. 37 (Suppl. l_1), D387–D392. doi:10.1093/NAR/GKN750
Koul, N., and Manvi, S. S. (2020). Ensemble feature selection from cancer gene expression data using mutual information and recursive feature elimination. 1, 6. doi:10.1109/ICAECC50550.2020.9339518
Krishnamurthy, N., Grimshaw, A. A., Axson, S. A., Choe, S. H., and Miller, J. E. (2022). Drug repurposing: a systematic review on root causes, barriers and facilitators. BMC Health Serv. Res. 22, 970. doi:10.1186/s12913-022-08272-z
Lagana, S. M., Salomao, M., Remotti, H. E., Knisely, A., and Moreira, R. K. (2015). Bile salt export pump: a sensitive and specific immunohistochemical marker of hepatocellular carcinoma. Histopathology 66 (4), 598–602. doi:10.1111/his.12601
Léveillé, M., and Estall, J. L. (2019). Mitochondrial dysfunction in the transition from NASH to HCC. Metabolites 9 (10), 233. doi:10.3390/metabo9100233
Li, X., Han, M., Zhang, H., Liu, F., Pan, Y., Zhu, J., et al. (2022). Structures and biological functions of zinc finger proteins and their roles in hepatocellular carcinoma. Biomark. Res. 10 (1), 2–13. doi:10.1186/s40364-021-00345-1
Li, X., Pan, L., Sanchez-Burgos, L., Hühn, D., and Fernandez-Capetillo, O. (2023). The Drug Repurposing Encyclopedia (DRE): a web server for systematic drug repurposing across 20 organisms. bioRxiv, 2023. doi:10.1101/2023.03.10.532084
Li, Y., Mansmann, U., Du, S., and Hornung, R. (2022). Benchmark study of feature selection strategies for multi-omics data. BMC Bioinforma. 23 (1), 412–418. doi:10.1186/s12859-022-04962-x
Lin, D., and Tang, X. (2006). Conditional infomax learning: an integrated framework for feature extraction and fusion. Lect. Notes Comput. Sci. Incl. Subser. Lect. Notes Artif. Intell. Lect. Notes Bioinforma. 3951 LNCS, 68–82. doi:10.1007/11744023_6
Love, M. I., Anders, S., and Huber, W. (2014). Moderated estimation of fold change and dispersion for RNA-seq data with DESeq2. Genome Biol. 15, 550. doi:10.1186/s13059-014-0550-8
Meyer-Baese, A., and Schmid, V. (2014). Statistical and syntactic pattern recognition. 151–196. doi:10.1016/B978-0-12-409545-8.00006-6
Mohammed, M., Mboya, I. B., Mwambi, H., Elbashir, M. K., and Omolo, B. (2021). Predictors of colorectal cancer survival using cox regression and random survival forests models based on gene expression data. PLoS ONE 16 (12), e0261625. doi:10.1371/journal.pone.0261625
Moritz, S., and Bartz-Beielstein, T. (2017). imputeTS: time series missing value imputation in R. R J. 9 (1), 207–218. doi:10.32614/rj-2017-009
Muthukrishnan, R., and Rohini, R. (2017). LASSO: a feature selection technique in predictive modeling for machine learning. 18–20. doi:10.1109/ICACA.2016.7887916
Nasir, I. M., Khan, M. A., Yasmin, M., Shah, J. H., Gabryel, M., Scherer, R., et al. (2020). Pearson correlation-based feature selection for document classification using balanced training. Sensors 20 (23), 6793. doi:10.3390/S20236793
Nazir, I., Haq, I. u., AlQahtani, S. A., Jadoon, M. M., and Dahshan, M. (2023). Machine learning-based lung cancer detection using multiview image registration and fusion. J. Sensors 2023. doi:10.1155/2023/6683438
Opdam, F. L., Guchelaar, H. J., Beijnen, J. H., and Schellens, J. H. (2012). Lapatinib for advanced or metastatic breast cancer. Oncol. 17 (4), 536–542. doi:10.1634/theoncologist.2011-0461
Otchere, D. A., Ganat, T. O. A., Ojero, J. O., Tackie-Otoo, B. N., and Taki, M. Y. (2022). Application of gradient boosting regression model for the evaluation of feature selection techniques in improving reservoir characterisation predictions. J. Petroleum Sci. Eng. 208, 109244. doi:10.1016/j.petrol.2021.109244
Parkinson, H., Kapushesky, M., Shojatalab, M., Abeygunawardena, N., Coulson, R., Farne, A., et al. (2007). ArrayExpress—a public database of microarray experiments and gene expression profiles. Nucleic Acids Res. 35 (Database issue), D747–D750. doi:10.1093/NAR/GKL995
Paul, S., and Drineas, P. (2016). Feature selection for ridge regression with provable guarantees. Neural Comput. 28 (4), 716–742. doi:10.1162/NECO_A_00816
Pawar, A., Chowdhury, O. R., and Salvi, O. (2022). A narrative review of survival analysis in oncology using R. Cancer Res. Statistics, Treat. 5 (3), 554–561. doi:10.4103/CRST.CRST_230_22
Phan, L. M., Yeung, S. C. J., and Lee, M. H. (2014). Cancer metabolic reprogramming: importance, main features, and potentials for precise targeted anti-cancer therapies. Cancer Biol. Med. 11 (1), 1–19. doi:10.7497/j.issn.2095-3941.2014.01.001
Posekany, A., Felsenstein, K., and Sykacek, P. (2011). Biological assessment of robust noise models in microarray data analysis. Bioinformatics 27 (6), 807–814. doi:10.1093/bioinformatics/btr018
Ritchie, M. E., Phipson, B., Wu, D., Hu, Y., Law, C. W., Shi, W., et al. (2015). Limma powers differential expression analyses for RNA-sequencing and microarray studies. Nucleic Acids Res. 43 (7), e47. doi:10.1093/NAR/GKV007
Sarkar, J. P., Saha, I., Sarkar, A., and Maulik, U. (2021). Machine learning integrated ensemble of feature selection methods followed by survival analysis for predicting breast cancer subtype specific miRNA biomarkers. Comput. Biol. Med. 131, 104244. doi:10.1016/J.COMPBIOMED.2021.104244
Saseendran, A. T., Setia, L., Chhabria, V., Chakraborty, D., and Roy, A. B. (2019). Impact of noise in dataset on machine learning algorithms. Mach. Learn. Module CS7CS4/CS4404. doi:10.13140/RG.2.2.25669.91369
Schober, P., and Schwarte, L. A. (2018). Correlation coefficients: appropriate use and interpretation. Anesth. Analgesia 126 (5), 1763–1768. doi:10.1213/ANE.0000000000002864
Sherman, B. T., Hao, M., Qiu, J., Jiao, X., Baseler, M. W., Lane, H. C., et al. (2022). DAVID: a web server for functional enrichment analysis and functional annotation of gene lists (2021 update). Nucleic Acids Res. 50 (W1), W216–W221. doi:10.1093/NAR/GKAC194
Sohail, M. I., Dönmez-Cakil, Y., Szöllősi, D., Stockner, T., and Chiba, P. (2021). The bile salt export pump: molecular structure, study models and small-molecule drugs for the treatment of inherited bsep deficiencies. Int. J. Mol. Sci. 22 (13), 7058. doi:10.3390/ijms22137058
Straś, W., Małkowski, P., and Tronina, O. (2020). Hepatocellular carcinoma in patients with non-alcoholic steatohepatitis - epidemiology, risk factors, clinical implications and treatment. Clin. Exp. Hepatology 6 (3), 170–175. doi:10.5114/ceh.2020.99506
Talukder, M. A., Islam, M. M., Uddin, M. A., Akhter, A., Hasan, K. F., and Moni, M. A. (2022). Machine learning-based lung and colon cancer detection using deep feature extraction and ensemble learning. Expert Syst. Appl. 205, 117695. doi:10.1016/J.ESWA.2022.117695
Tang, D., Chen, M., Huang, X., Zhang, G., Zeng, L., Zhang, G., et al. (2023). SRplot: a free online platform for data visualization and graphing. PLOS ONE 18 (11), e0294236. doi:10.1371/JOURNAL.PONE.0294236
Teng, M. L. P., Ng, C. H., Huang, D. Q., Chan, K. E., Tan, D. J., Lim, W. H., et al. (2023). Global incidence and prevalence of nonalcoholic fatty liver disease. Clin. Mol. Hepatology 29 (Suppl. 1), 32–42. doi:10.3350/CMH.2022.0365
Therneau, T. (2021). A package for survival analysis in R. Available online at: https://cran.r-project.org/package=survival.
Urbanowicz, R. J., Meeker, M., La Cava, W., Olson, R. S., and Moore, J. H. (2018). Relief-based feature selection: introduction and review. J. Biomed. Inf. 85, 189–203. doi:10.1016/j.jbi.2018.07.014
Valencia, D., Lillo, R. E., and Romo, J. (2019). A Kendall correlation coefficient between functional data. Adv. Data Analysis Classif. 13 (4), 1083–1103. doi:10.1007/s11634-019-00360-z
Wang, Y., Xiao, J., Suzek, T. O., Zhang, J., Wang, J., and Bryant, S. H. (2009). PubChem: a public information system for analyzing bioactivities of small molecules. Nucleic Acids Res. 37 (Suppl. l_2), W623–W633. doi:10.1093/NAR/GKP456
Xiao, Z., Yeung, C. L. S., Yam, J. W. P., and Mao, X. (2022). An update on the role of complement in hepatocellular carcinoma. Front. Immunol. 13 (October 2022), 1–8. doi:10.3389/fimmu.2022.1007382
Xie, Z., Kropiwnicki, E., Wojciechowicz, M. L., Jagodnik, K. M., Shu, I., Bailey, A., et al. (2022). Getting started with LINCS datasets and tools. Curr. Protoc. 2 (7), 1–90. doi:10.1002/cpz1.487
Xu, Q., Feng, M., Ren, Y., Liu, X., Gao, H., Li, Z., et al. (2023). From NAFLD to HCC: advances in noninvasive diagnosis. Biomed. Pharmacother. 165, 115028. doi:10.1016/j.biopha.2023.115028
Zhang, C., and Yang, M. (2021). The emerging factors and treatment options for nafld-related hepatocellular carcinoma. Cancers 13, 3503–3515. doi:10.2147/CMAR.S302917
Zhang, S., Xie, Y., Tian, T., Yang, Q., Zhou, Y., Qiu, J., et al. (2021). High expression levels of centromere protein A plus upregulation of the phosphatidylinositol 3-kinase/Akt/mammalian target of rapamycin signaling pathway affect chemotherapy response and prognosis in patients with breast cancer. Oncol. Lett. 21 (5), 410. doi:10.3892/ol.2021.12671
Zhang, Y., Chen, X., Cao, Y., and Yang, Z. (2021). C8b in complement and coagulation cascades signaling pathway is a predictor for survival in hbv-related hepatocellular carcinoma patients. Cancer Manag. Res. 13, 3503–3515. doi:10.2147/CMAR.S302917
Zheng, Y., Wang, S., Wu, J., and Wang, Y. (2023). Mitochondrial metabolic dysfunction and non-alcoholic fatty liver disease: new insights from pathogenic mechanisms to clinically targeted therapy. J. Transl. Med. 21 (1), 510–521. doi:10.1186/s12967-023-04367-1
Glossary
NAFLD Non-Alcoholic Fatty Liver Disease
NASH Non-Alcoholic Steatohepatitis
HCC Hepatocellular Carcinoma
ML Machine Learning
SVM Support Vector Machine
ANN Artificial Neural Network
KNN k-Nearest Neighbors
DISCR Discriminant Analysis
RF Random Forest
DT Decision Tree
NB Naive Bayes
CIFE Conditional Informative Feature Extraction
JMI Joint Mutual Information
MIM Mutual Information Maximization/Maximum Relevance
LASSO Least Absolute Shrinkage and Selection Operator
GO Gene Ontology
KEGG Kyoto Encyclopedia of Genes and Genomes
ER Endoplasmic Reticulum
GEO Gene Expression Omnibus
NCBI National Center for Biotechnology Information
RMA Robust Multichip Averaging
RMR Relevant Mutual Redundancy
DISR Double Input Symmetrical Relevance
NMIFS Normalized Mutual Information Feature Selection
DAVID Database for Annotation, Visualization, and Integrated Discovery
FDR False Discovery Rate
TCGA-LIHC The Cancer Genome AtlasLiver Hepatocellular Carcinoma
HR Hazard Ratio
CI Confidence Interval
DGIdb The Drug Gene Interaction Database
MSigDB Molecular Signatures Database
DREIMT Drug Response Element Interactions Modelling Tool
CMap Connectivity Map
PDB Protein Data Bank
RCSB Research Collaboratory for Structural Bioinformatics
BLAST Basic Local Alignment Search Tool
OPLS Optimized Potentials for Liquid Simulations
Keywords: NAFLD, HCC, machine learning, ensemble feature selection, drug repurposing, molecular docking
Citation: Ghosh S, Mandal SD and Thakur S (2025) Biomarker-driven drug repurposing for NAFLD-associated hepatocellular carcinoma using machine learning integrated ensemble feature selection. Front. Bioinform. 5:1522401. doi: 10.3389/fbinf.2025.1522401
Received: 28 November 2024; Accepted: 04 April 2025;
Published: 17 April 2025.
Edited by:
Dharmendra Kumar Yadav, Gachon University, Republic of KoreaReviewed by:
Bhavika Mam, Independent Researcher, Palo Alto, CA, United StatesNam N. Phan, The University of Texas Health Science Center at San Antonio, United States
Copyright © 2025 Ghosh, Mandal and Thakur. This is an open-access article distributed under the terms of the Creative Commons Attribution License (CC BY). The use, distribution or reproduction in other forums is permitted, provided the original author(s) and the copyright owner(s) are credited and that the original publication in this journal is cited, in accordance with accepted academic practice. No use, distribution or reproduction is permitted which does not comply with these terms.
*Correspondence: Subarna Thakur, c3ViYXJuYS50aGFrdXJAbmJ1LmFjLmlu; Sukhen Das Mandal, c3VraGVuQGdrY2lldC5hYy5pbg==