 Jing Zhang
 Xianying Chen
 Yongjun Wang
- Department of Gynecology and Obstetrics, Beijing Jishuitan Hospital, Capital Medical University, Beijing, China
Objective: Insulin resistance, a central feature of metabolic dysregulation, has been implicated in the pathogenesis of various cancers. However, the understanding of its role in ovarian cancer remains incomplete. This study explored the association between the estimated glucose disposal rate (eGDR), a robust indicator of insulin sensitivity, and ovarian cancer using data from the National Health and Nutrition Examination Survey (NHANES).
Methods: We analyzed data from 34,698 participants in the NHANES database, including 87 ovarian cancer patients and 34,611 controls. Propensity score matching (PSM) and multivariable logistic regression analysis were used to adjust for key confounders, such as race, education, poverty–income ratio, marital status, alcohol consumption, coronary artery disease diagnosis, heart failure diagnosis, triglycerides, total cholesterol, lymphocytes, and red blood cells. eGDR levels were evaluated as both continuous and categorical variables (quartiles), and restricted cubic splines (RCS) were utilized to assess the potential non-linear associations.
Results: The eGDR level was significantly lower in ovarian cancer patients compared to the controls (6.94 ± 2.71 vs. 8.29 ± 2.52, P < 0.05). Multivariable logistic regression analysis demonstrated that the eGDR is a significant protective factor against ovarian cancer (OR: 0.826, 95% CI: 0.71–0.952, P < 0.05). Quartile analysis revealed a dose-dependent reduction in the prevalence of ovarian cancer with increasing eGDR (Q4 vs. Q1, OR: 0.283, 95% CI: 0.097–0.792, P < 0.05). RCS analysis confirmed there was a non-linear inverse relationship between the eGDR and the prevalence of ovarian cancer (P_non-linear = 0.005). Subgroup analysis further indicated that the subject's education level, marital status, and alcohol consumption significantly influenced the association between eGDR and ovarian cancer.
Conclusion: A significant inverse relationship was found between the eGDR and the prevalence of ovarian cancer, suggesting that a higher eGDR was a potential protective factor against ovarian cancer. These findings provide new insights into the mechanisms of ovarian cancer and highlight the potential of using the eGDR as a tool for early risk assessment and intervention.
1 Introduction
Ovarian cancer is one of the most lethal malignancies for females, posing a severe threat to women's health. Due to its deep pelvic location, the early symptoms of ovarian cancer are often subtle and non-specific, and consequently, most patients are diagnosed at advanced stages, leading to a poor prognosis (1). Therefore, identifying the risk and protective factors for ovarian cancer would be of critical importance for the early screening and prevention of ovarian cancer.
Emerging studies are highlighting metabolic dysregulation as a critical factor in oncogenesis. In particular, metabolic syndrome (MetS), characterized by obesity, hypertension, hyperglycemia, and dyslipidemia, exhibits a robust association with elevated cancer occurrence (2). Impaired insulin sensitivity, a defining feature of MetS, has been linked to malignancies including breast, colorectal, and endometrial carcinomas (3). At the molecular level, insulin resistance accelerates cellular proliferation, suppresses apoptosis, and fosters angiogenesis through hyperinsulinemia and activation of the insulin-like growth factor-1 (IGF-1) axis, propelling neoplastic advancement (4). Notably, a systematic review identified markedly elevated IGFBP-2 and IGFBP-1 concentrations in ovarian cancer cohorts, reinforcing insulin dysregulation's role in disease etiology (5). These findings indicate that insulin resistance may contribute to the pathogenesis of ovarian cancer.
However, the current tools used for the assessment of insulin resistance(IR) all have certain limitations. For instance, the hyperinsulinemic-euglycemic clamp, while precise, is labor-intensive, costly, and impractical for use in large population studies (6), while other markers, like HOMA-IR and fasting insulin, lack consistency due to confounding variables (e.g., fasting, medications) and undefined diagnostic thresholds (7, 8). Therefore, a rapid, affordable clinical indicator is still urgently needed.
The Estimated Glucose Disposal Rate (eGDR), an integrated metric derived from anthropometric and biochemical parameters (e.g., waist circumference, hypertension, and HbA1c), can quantify insulin sensitivity and metabolic efficiency (9). Unlike conventional techniques, such as the hyperinsulinemic-euglycemic clamp, the eGDR combines cost-effectiveness with user-friendliness while retaining a strong predictive validity for diabetes-related outcomes (10, 11). However, despite its utility, scant evidence exists regarding eGDR's role in ovarian cancer screening and prevention.
Leveraging the National Health and Nutrition Examination Survey (NHANES) data, this study examined the interplay between the eGDR and the risk of ovarian cancer, while assessing heterogeneity among different demographic and clinical subgroups. By harnessing such an extensive, nationally representative dataset, we sought to elucidate novel mechanistic insights into the etiology of ovarian cancer and establish a framework for its early detection and for making preventive interventions. Our study identified a strong inverse relationship between the eGDR and the risk of ovarian cancer within a nationally representative cohort, revealing new subgroup-specific differences and proving that eGDR could be used as a potential biomarker for the early identification of ovarian cancer.
2 Materials and methods
2.1 eGDR
In recent years, an effective scoring system based on readily available clinical factors such as waist circumference, hypertension, and hemoglobin A1c (HbA1c) has been developed to estimate the glucose disposal rate (eGDR) in patients with type 1 and type 2 diabetes. Compared to the euglycemic hyperinsulinemic clamp method, this scoring system has demonstrated high accuracy in predicting insulin resistance (12, 13). Prior investigations of eGDR's utility have revealed it has robust associations with various clinical endpoints, including subclinical carotid atherosclerosis in type 1 (T1D) and type 2 diabetes (T2D) patients (12), coronary artery disease (14), stroke (10), and mortality (11). Population-based studies have further suggested that the use of the eGDR can enhance the detection of prevalent ischemic heart disease in rural Chinese cohorts (15).
The formula for calculating eGDR was as follows: eGDR (mg/kg/min) = 21.158 – (0.09 × WC) – (3.407 × hypertension) – (0.551 × HbA1c) [WC (cm), hypertension (yes = 1/no = 0), and HbA1c (%)] (9).
2.2 Data and preprocessing
NHANES represents a continuous nationally representative cross-sectional survey administered by the US CDC's National Center for Health Statistics (NCHS) to evaluate health and nutritional status among non-institutionalized US civilians. Data are collected biennially via a multi-stage probability sampling design, incorporating in-home interviews, physical examinations at mobile examination centers (MECs), and biospecimen collection (blood/urine). The NCHS Research Ethics Review Board oversees protocol approval, and all participants provide informed consent. For this study, we analyzed 10 NHANES cycles (1999–2018) containing ovarian cancer-related variables. From an initial pool of 101,316 participants, we excluded the following: (1) records missing ovarian cancer diagnoses (N = 13,402), (2) incomplete eGDR data (N = 38,619), and (3) insufficient baseline covariates (N = 14,597). The final analytical sample included 34,698 participants (87 ovarian cancer patients and 34,611 controls) (Figure 1).

Figure 1. Flowchart illustrating the investigation workflow and participant inclusion in the study.
2.3 Covariates
The covariates comprised age, race, education, poverty–income ratio, marital status, alcohol intake, hypertension diagnosis, diabetes diagnosis, coronary artery disease diagnosis, heart failure diagnosis, triglycerides, high-density lipoprotein (HDL), total cholesterol, white blood cells, neutrophils, leukocytes, red blood cell distribution width, platelet count, hemoglobin, albumin, glycated hemoglobin, and creatinine. The demographic characteristics (gender, age, race, education, poverty–income ratio, and marital status) were derived from NHANES demographic modules. Race/ethnicity classifications encompassed: Mexican American, non-Hispanic Black, non-Hispanic White, other Hispanic, and mixed/other racial backgrounds. Education was classified into three categories: ≤ high school, some college, and college degree or higher. Marital status was dichotomized (married/non-married).
Alcohol consumption was categorized as ≥12 alcoholic beverages/year, self-reported via the Alcohol Use Questionnaire (ALQ), a standardized tool for assessing alcohol consumption patterns. Participants who reported consuming ≥12 alcoholic beverages/year were categorized as alcohol consumers. Hypertension diagnosis, diabetes diagnosis, coronary artery disease diagnosis, and heart failure diagnosis were ascertained from medical condition modules (MCQ). For example, the hypertension status was established by participant confirmation of the question: “Have you ever been informed by a doctor or healthcare professional that you have elevated blood pressure?” Biological assays were acquired from NHANES biochemical records.
2.4 Propensity score matching
Propensity score matching (PSM), first proposed by Rosenbaum and Rubin (16) and Liang et al. (17), addresses the issue of confounding in observational studies by balancing the baseline characteristics between groups. We set a caliper = 0.2, and only observations with a bias score difference within this threshold will be matched. To minimize bias, we performed a 1:1 PSM on race, education, poverty–income ratio, marital status, and alcohol use, ensuring comparable distributions between the ovarian cancer cases and controls. Post-matching analyses verified the robustness of this approach.
2.5 Weighted logistic regression analysis
Survey-weighted binary logistic regression was performed to evaluate the association between estimated glucose disposal rate (eGDR) and the risk of ovarian cancer. eGDR was included in the models as both a continuous variable and a categorical variable, stratified into quartiles based on interquartile ranges. The quartiles, ranging from lowest (Q1) to highest (Q4) were treated as categorical variables, with Q1 serving as the reference group for comparison. Three models were constructed to progressively adjust for confounding factors. Model 1 was unadjusted; Model 2 adjusted for race, education, poverty–income ratio, marital status, alcohol consumption, coronary artery disease, and heart failure; Model 3 further adjusted for laboratory variables including triglycerides, total cholesterol, lymphocyte count, and red blood cell count. All regression analyses incorporated NHANES survey weights to account for the complex sampling design. Continuous variables that were not normally distributed were transformed into weighted quartiles for analysis. Interaction terms were included to examine effect modification across subgroups, and P-values were adjusted using the false discovery rate (FDR) method to control for multiple comparisons.
2.6 Restricted cubic spline
RCS is used in statistics to model continuous variables. It divides data into intervals and fits each with a cubic polynomial, creating a smooth curve. This method can capture non-linear relationships in regression analysis while preventing overfitting. It is a key concept in statistics that is commonly used in regression analysis and curve fitting.
For knot selection and positioning, based on Harrell's recommendations, we specified 3 knots to balance model flexibility and overfitting risks. Knots were positioned at the 10th, 50th, and 90th percentiles of the exposure distribution, ensuring sufficient coverage of both tails and the central range. We evaluated alternative knot configurations (4–5 knots) and confirmed that the 3-knot model yielded the lowest Akaike Information Criterion (AIC: 321.4 vs. 323.1 for 4 knots) and Bayesian Information Criterion (BIC).
Regarding model specification and validation, the RCS model was fitted using natural cubic splines (via the rms package in R, v6.2-0) to enforce linearity beyond boundary knots, mitigating extrapolation artifacts. Non-linearity was formally assessed via a likelihood ratio test comparing the RCS model to a linear model. All spline models were adjusted for key covariates (Race, education, poverty income ratio, marital status, alcohol consumption, diagnosis of coronary heart disease, diagnosis of heart failure, triglycerides, total cholesterol, lymphocytes, and red blood cells) to account for potential confounding.
For sensitivity and robustness checks, we performed 1,000 bootstrap resamples to derive 95% confidence intervals for the spline curve, confirming stability of the non-linear pattern. Results remained consistent when knots were placed at empirically derived locations.
2.7 Statistical analysis
Statistical analyses were executed using R (v4.1.1). Continuous measures were expressed as medians with interquartile ranges (IQRs); categorical variables were presented as sample counts and weighted percentages. Between-quartile disparities in the eGDR were assessed via the Wilcoxon–Mann–Whitney test (for non-Gaussian continuous variables) and the Rao–Scott χ2 test (for categorical outcomes, adjusted for survey-weighted frequencies). Statistical thresholds were established at a two-tailed P < 0.05.
3 Results
3.1 Baseline characteristics of the sample
A total of 34,698 participants were included in the final study, with comparisons made between ovarian cancer patients and controls based on their baseline characteristics, such as age, race, and education (Table 1). Before propensity score matching (PSM), notable differences were observed between ovarian cancer and control groups in terms of education level (P < 0.05) and alcohol consumption (P < 0.05). However, after PSM, these differences were no longer evident (P > 0.99 for education and P = 0.35 for alcohol consumption).
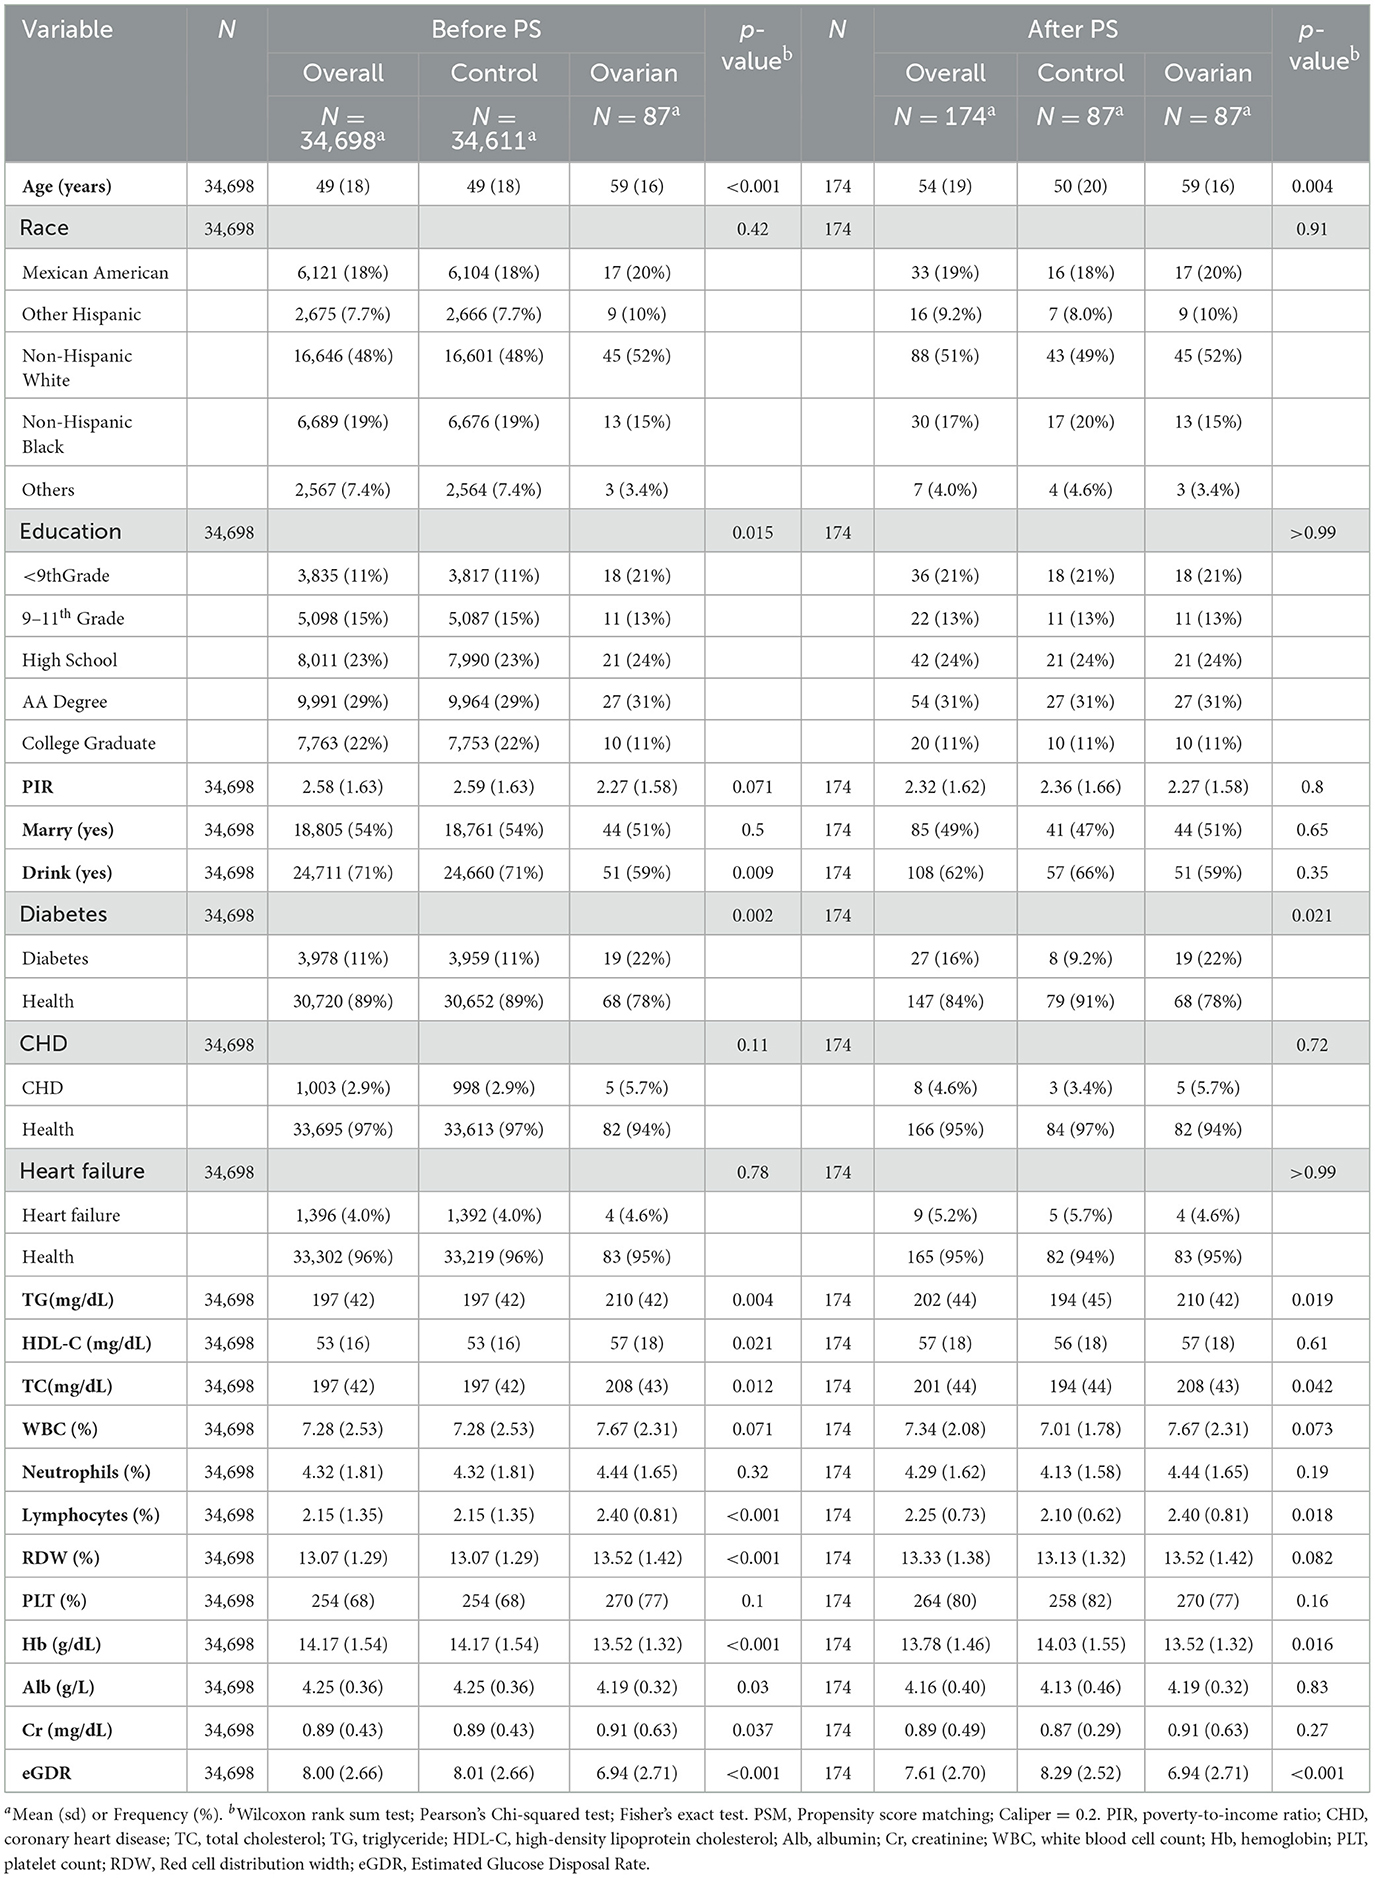
Table 1. Baseline characteristics of the study participants.
Other baseline characteristics, including diabetes diagnosis (P < 0.05 before PSM, P < 0.05 after PSM), triglycerides (P < 0.05 before PSM, P < 0.05 after PSM), total cholesterol (P < 0.05 before PSM, P < 0.05 after PSM), lymphocytes (P < 0.05 before PSM, P < 0.05 after PSM), and hemoglobin (P < 0.05 before PSM, P < 0.05 after PSM), showed significant differences between the ovarian cancer and control groups, both before and after PSM.
However, some baseline variables, such as race, poverty–income ratio, marital status, coronary artery disease diagnosis, and heart failure diagnosis, did not show significant differences before or after PSM. This indicates that these baseline characteristics were well-balanced between the ovarian cancer and control groups and that the potential confounding factors associated with these variables were at a minimum during the comparison.
3.2 Association between eGDR and ovarian cancer
Multivariable logistic regression models were used to examine the association between eGDR and ovarian cancer (Table 2). Model 1, which included no covariates, showed a negative correlation between the eGDR and ovarian cancer (OR: 0.821, 95% CI: 0.726–0.923, P < 0.05). In the quartile comparisons, Q4 had an OR of 0.267 (95% CI: 0.108–0.634, P < 0.05, P for trend = 0.0028) compared to Q1, indicating that a higher eGDR was associated with a lower probability of ovarian cancer.
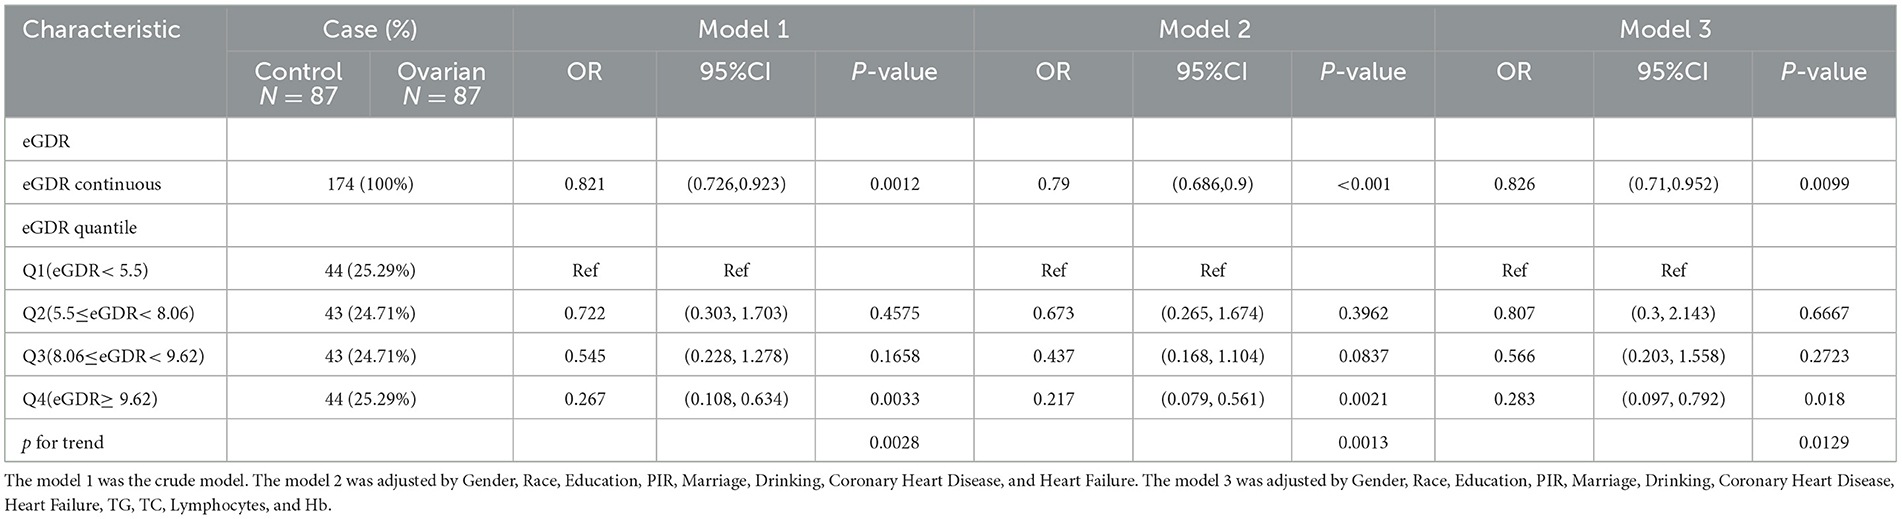
Table 2. The relationship between eGDR and Ovarian cancer.
Model 2, which adjusted for race, education, poverty–income ratio, marital status, alcohol consumption, coronary artery disease diagnosis, and heart failure diagnosis, showed a similar relationship between eGDR and ovarian cancer. Model 3, based on Model 2, further adjusted for triglycerides, total cholesterol, lymphocytes, and red blood cells. Both models confirmed the negative association, with Model 2 (OR: 0.79, 95% CI: 0.686–0.9, P < 0.05) and Model 3 (OR: 0.826, 95% CI: 0.71–0.952, P < 0.05) showing consistent results.
When stratified by quartiles, the OR for Q4 compared to Q1 was progressively lower in both Model 2 and Model 3. In Model 2, the OR was 0.217 (95% CI: 0.079–0.561, P < 0.05), and in Model 3, the OR was 0.283 (95% CI: 0.097–0.792, P < 0.05). This indicates that higher eGDR levels were associated with a lower probability of ovarian cancer in both models with covariate adjustments.
3.3 Non-linear relationship between the eGDR and ovarian cancer prevalence and subgroup RCS curves
RCS analysis was used to examine the relationship between the eGDR and ovarian cancer across three different definitions of the eGDR, adjusting for all relevant covariates. A statistically notable non-linear relationship between the total eGDR and ovarian cancer prevalence was observed (P_non-linear = 0.005, Figure 2A).
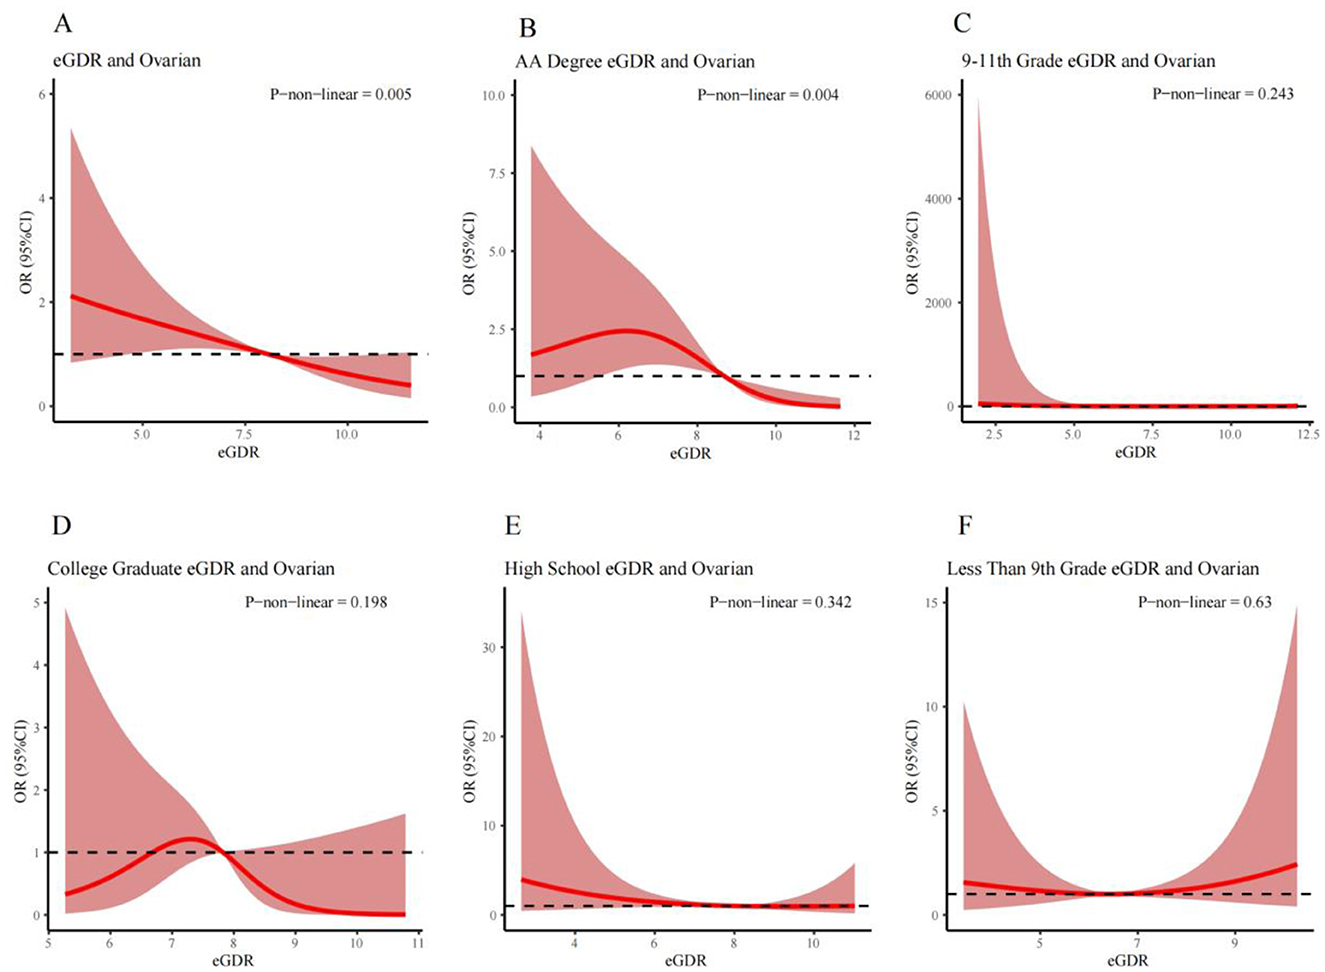
Figure 2. RCS curves illustrating the non-linear relationship between eGDR and the prevalence of ovarian cancer for different populations respectively: (A) is the Overall Population; (B) is the AA Degree Population; (C) is the 9th–11th Grade Education Population; (D) is the College Graduate Population; (E) is the High School Graduate Population; and (F) is the Less Than 9th Grade Education Population. Covariates adjusted in the model: race, education, poverty-income ratio, marital status, alcohol consumption, coronary artery disease, heart failure, triglycerides, total cholesterol, lymphocytes, and red blood cells.
Subgroup analysis based on education status revealed a significant non-linear relationship between the eGDR and ovarian cancer prevalence in the associates (AA) education group (P_non-linear = 0.004, Figure 2B). However, no significant non-linear relationships were found among those who completed only grades 9–11, the college group, the high school group, and those with fewer than 9 years of education (Figures 2C–F).
3.4 Association between the eGDR and ovarian cancer across various subgroups of baseline characteristics
Figure 3 illustrates the association between the eGDR and ovarian cancer analyzed through fully adjusted multivariable logistic regression across various subgroups stratified by education level, marital status, age, and poverty–income ratio. In the education subgroup, the AA education group appeared more sensitive to changes in the eGDR (Q4 vs. Q1, OR: 0.02, 95% CI: 0–0.29, P < 0.05). In the marital status subgroup, unmarried individuals showed higher sensitivity to changes in the eGDR (Q4 vs. Q1, OR: 0.09, 95% CI: 0.02–0.42, P < 0.05). Regarding alcohol consumption, non-drinkers exhibited greater sensitivity to changes in the eGDR (Q4 vs. Q1, OR: 0.15, 95% CI: 0.03–0.79, P < 0.05). However, in the age and poverty–income ratio subgroups, the effect of changes in the eGDR on the prevalence of ovarian cancer seemed to be less pronounced (P > 0.05 for both subgroups), indicating no significant association (Figure 3).
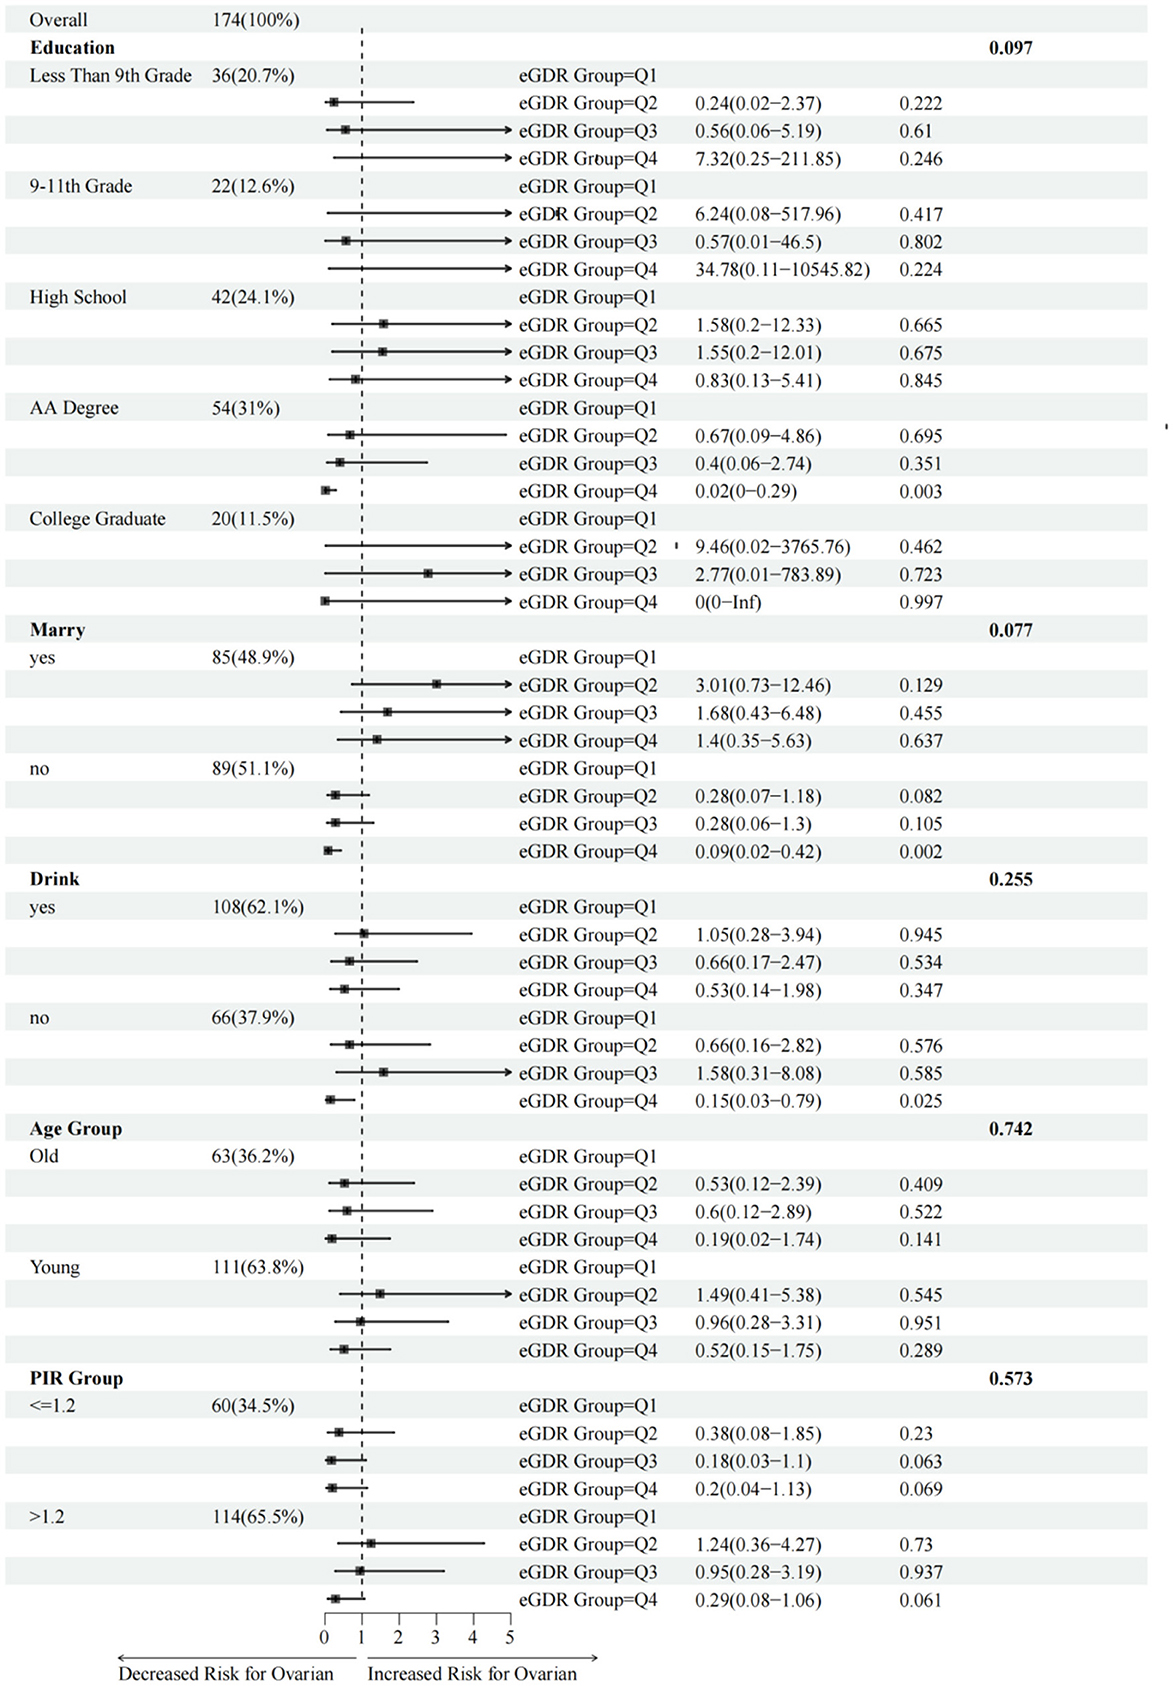
Figure 3. Association between eGDR and the risk of ovarian cancer stratified by different baseline subgroups. Age subgroups were defined as “Young” (≤65 years old) and “Old” (>65 years old). Covariates adjusted in the model: triglycerides, total cholesterol, lymphocytes, and red blood cells.
4 Discussion
Drawing on data from the NHANES, this investigation evaluated the relationship between the eGDR and the risk of ovarian cancer. Notably, individuals with ovarian cancer displayed significantly lower eGDR levels compared to controls. Even after adjusting for potential confounders such as race, education, marital status, the inverse association remained robust (OR: 0.826, 95% CI: 0.71–0.952, P < 0.05), suggesting that a lower eGDR may be associated with an increased risk of ovarian cancer. Moreover RCS modeling further showed a non-linear dose-response pattern existed, wherein ovarian cancer prevalence declined incrementally with a rising eGDR, plateauing at higher thresholds. These observations provide new mechanistic insights into ovarian cancer pathogenesis and underscore the potential utility of the eGDR in refining early detection protocols and preventive measures. Furthermore, subgroup analyses revealed some variation in the association between eGDR and ovarian cancer, particularly across education levels. The first is the potential confounding effect of education level. Higher education populations may have greater health awareness, manifested by more regular check-ups and earlier disease interventions, which may offset some of the effects of high-risk factors. Moreover, education level is closely related to socioeconomic status, and the latter may independently affect disease risk through access to medical resources, lifestyle and other ways. Second, potential confounding effects may result from data stratification limitations. These include the possibility that the classification of education level (such as “below high school/university/postgraduate”) may not adequately capture differences in education quality, leading to intra-group heterogeneity, and the insufficient sample size of some subgroups (such as “ < 5% graduate degree”) may reduce statistical effectiveness.
eGDR serves as a quantitative measure of insulin resistance and systemic glucose metabolism, thereby establishing a link between metabolic dysfunction and the risk of ovarian cancer, and its reduction indicates impaired glucose metabolism and compensatory hyperinsulinemia. Epidemiological studies have demonstrated that diabetes mellitus, characterized by hyperinsulinemia and activation of the insulin-like growth factor (IGF) pathway, is associated with a 17%−20% increase in ovarian cancer risk (18). Elevated insulin levels can stimulate the insulin-like growth factor-1 (IGF-1) axis, which plays a critical role in cell proliferation, survival, and tumor progression. IGF-1 and its receptor (IGF-1R) activate downstream oncogenic signaling pathways, including PI3K/AKT and MAPK/ERK, which have been implicated in the development and progression of ovarian cancer. These pathways promote cellular proliferation, inhibit apoptosis, and contribute to angiogenesis and metastatic potential in ovarian epithelial cells (4, 18). In addition, insulin resistance is associated with chronic low-grade inflammation and altered adipokine profiles, which may further support a tumor-promoting microenvironment (19). Thus, lower eGDR may reflect a broader metabolic state that fosters ovarian tumorigenesis.
Compared with traditional insulin resistance measures like the hyperinsulinemic-euglycemic clamp and HOMA-IR, the estimated glucose disposal rate (eGDR) offers notable advantages in feasibility, consistency, and clinical applicability. HOMA-IR, though widely used for its simplicity, is influenced by fasting state, assay variability, and medications affecting glucose or insulin levels, and its accuracy declines in patients with advanced metabolic disorders (20, 21). eGDR, by contrast, is derived from routinely collected clinical indicators—waist circumference, HbA1c, and hypertension status—and does not require insulin measurements or fasting, making it more practical for large-scale screening and retrospective analyses (9). Unlike HOMA-IR, which reflects short-term insulin-glucose interactions, eGDR provides a more stable estimate of long-term insulin resistance, enhancing its utility in both clinical and epidemiological contexts. While newer dynamic measures of HOMA-IR during OGTT or meal tolerance tests offer detailed insights into insulin sensitivity, they are labor-intensive and less suited to routine practice. eGDR, in contrast, enables efficient, low-cost identification of individuals at elevated metabolic, and cancer risk. Its simplicity and scalability support its potential use in early detection and preventive strategies, especially where laboratory-based insulin assessments are impractical.
Given that it is derived from commonly measured clinical parameters—waist circumference, HbA1c, and hypertension status—eGDR is both feasible and cost-effective for routine use in primary care or community health settings. While a universally accepted clinical threshold has not yet been established, our findings suggest that individuals with lower eGDR values—particularly those in the lowest quartile—may warrant closer metabolic monitoring and risk assessment. Future research should aim to define optimal cut-off points for eGDR to guide clinical decision-making and stratify cancer risk more precisely. Importantly, timely interventions such as lifestyle modifications (e.g., diet, exercise, weight management) or insulin-sensitizing therapies may improve metabolic health and reduce ovarian cancer risk, especially in high-risk groups identified by low eGDR values. These groups may include women with limited education, unmarried status, or non-drinking habits, who showed increased sensitivity in subgroup analyses. Integrating eGDR screening into preventive care could enhance early identification and enable targeted interventions, contributing to more personalized and effective cancer prevention strategies.
Despite the strengths of utilizing a nationally representative dataset and conducting rigorous statistical analyses, this study has several limitations. First, the relatively small sample size (n = 87) may reduce the statistical power to detect clinically meaningful differences, particularly in subgroup analyses. Although our findings showed statistical significance for primary outcomes, the possibility of type II errors (false negatives) cannot be ruled out. Second, the single-center design and strict inclusion criteria may limit the generalizability of our results to broader populations, such as patients with different treatment histories or from diverse healthcare settings. Finally, while we performed multivariate adjustments for known confounders, residual confounding due to unmeasured variables may still exist. Future large-scale, multicenter studies with prospective designs are warranted to validate our findings.
The cross-sectional nature of this study inherently limits causal interpretation of the observed associations between eGDR and ovarian cancer. While our findings provide important preliminary evidence, the temporal relationship cannot be established due to the fundamental design constraints. This limitation is further compounded by potential residual confounding from unmeasured variables. Future prospective cohort studies with repeated eGDR measurements are needed to elucidate the potential causal pathways. Intervention studies may also help determine whether modulating eGDR influences ovarian cancer risk.
Athough propensity score matching (PSM) and multivariate adjustment were used in this study to control for measurable confounders, unmeasured variables such as genetic susceptibility (such as BRCA1/2 gene mutations), family history of ovarian cancer, and environmental exposures (such as endocrine-disrupting chemicals or occupational risks) were unavailable in the NHANES dataset due to limitations of the publicly available database. Inclusion of these variables may reduce the effective sample size due to missing data, thus affecting statistical efficacy. Therefore, this study ultimately did not include some of the important factors after weighing the statistical validity against the comprehensiveness of the variables. In the future, we will further validate the current results by constructing longitudinal cohort data and incorporate key variables such as genetic factors and environmental exposures to more comprehensively explore their relationship with the risk of ovarian cancer.
5 Conclusion
This study identified a robust inverse association between the eGDR and ovarian cancer, positioning the eGDR as a potential protective biomarker for ovarian cancer screening. These findings deepen the etiological understanding and advocate for eGDR-integrated screening and prevention paradigms. Future research is needed to clarify causality, unravel the molecular mechanisms, and translate the eGDR into clinical utility.
Data availability statement
The raw data supporting the conclusions of this article will be made available by the authors, without undue reservation.
Author contributions
JZ: Data curation, Writing – original draft. XC: Methodology, Writing – original draft. YW: Project administration, Resources, Supervision, Validation, Writing – review & editing.
Funding
The author(s) declare that no financial support was received for the research and/or publication of this article.
Acknowledgments
We thank Medjaden Inc. for the scientific editing of this manuscript.
Conflict of interest
The authors declare that the research was conducted in the absence of any commercial or financial relationships that could be construed as a potential conflict of interest.
Generative AI statement
The author(s) declare that no Gen AI was used in the creation of this manuscript.
Publisher's note
All claims expressed in this article are solely those of the authors and do not necessarily represent those of their affiliated organizations, or those of the publisher, the editors and the reviewers. Any product that may be evaluated in this article, or claim that may be made by its manufacturer, is not guaranteed or endorsed by the publisher.
References
1. Siegel RL, Miller KD, Fuchs HE, Jemal A. Cancer statistics, 2022. CA Cancer J Clin. (2022) 72:7–33. doi: 10.3322/caac.21708
2. Gallagher EJ, LeRoith D. Obesity and diabetes: the increased risk of cancer and cancer-related mortality. Physiol Rev. (2015) 95:727–48. doi: 10.1152/physrev.00030.2014
3. Tsilidis KK, Kasimis JC, Lopez DS, Ntzani EE, Ioannidis JP. Type 2 diabetes and cancer: umbrella review of meta-analyses of observational studies. BMJ. (2015) 350:g7607. doi: 10.1136/bmj.g7607
4. Hopkins BD, Goncalves MD, Cantley LC. Insulin-PI3K signalling: an evolutionarily insulated metabolic driver of cancer. Nat Rev Endocrinol. (2020) 16:276–83. doi: 10.1038/s41574-020-0329-9
5. Gianuzzi X, Palma-Ardiles G, Hernandez-Fernandez W, Pasupuleti V, Hernandez AV, Perez-Lopez FR, et al. Insulin growth factor (IGF) 1, IGF-binding proteins and ovarian cancer risk: a systematic review and meta-analysis. Maturitas. (2016) 94:22–9. doi: 10.1016/j.maturitas.2016.08.012
6. DeFronzo RA, Tobin JD, Andres R. Glucose clamp technique: a method for quantifying insulin secretion and resistance. Am J Physiol. (1979) 237:E214–23. doi: 10.1152/ajpendo.1979.237.3.E214
7. Kozawa J, Iwahashi H, Okita K, Okauchi Y, Imagawa A, Shimomura I, et al. Insulin tolerance test predicts the effectiveness of insulin sensitizers in Japanese type 2 diabetic patients. Diabetes Ther. (2010) 1:121–30. doi: 10.1007/s13300-010-0011-7
8. van der Aa MP, Elst MA, van de Garde EM, van Mil EG, Knibbe CA, van der Vorst MM, et al. Long-term treatment with metformin in obese, insulin-resistant adolescents: results of a randomized double-blinded placebo-controlled trial. Nutr Diabetes. (2016) 6:e228. doi: 10.1038/nutd.2016.37
9. Zhang Z, Zhao L, Lu Y, Xiao Y, Zhou X. Insulin resistance assessed by estimated glucose disposal rate and risk of incident cardiovascular diseases among individuals without diabetes: findings from a nationwide, population based, prospective cohort study. Cardiovasc Diabetol. (2024) 23:194. doi: 10.1186/s12933-024-02256-5
10. Zabala A, Darsalia V, Lind M, Svensson AM, Franzén S, Eliasson B, et al. Estimated glucose disposal rate and risk of stroke and mortality in type 2 diabetes: a nationwide cohort study. Cardiovasc Diabetol. (2021) 20:202. doi: 10.1186/s12933-021-01394-4
11. Helmink M, de Vries M, Visseren F, de Ranitz WL, de Valk HW, Westerink J, et al. Insulin resistance and risk of vascular events, interventions and mortality in type 1 diabetes. Eur J Endocrinol. (2021) 185:831–40. doi: 10.1530/EJE-21-0636
12. Emoto M, Nishizawa Y, Maekawa K, Hiura Y, Kanda H, Kawagishi T, et al. Homeostasis model assessment as a clinical index of insulin resistance in type 2 diabetic patients treated with sulfonylureas. Diabetes Care. (1999) 22:818–22. doi: 10.2337/diacare.22.5.818
13. Komosinska-Vassev K, Gala O, Olczyk K, Jura-Półtorak A, Olczyk P. The usefulness of diagnostic panels based on circulating adipocytokines/regulatory peptides, renal function tests, insulin resistance indicators and lipid-carbohydrate metabolism parameters in diagnosis and prognosis of type 2 diabetes mellitus with obesity. Biomolecules. (2020) 10:1304. doi: 10.3390/biom10091304
14. Kim MJ, Cho YK, Kim EH, Lee MJ, Lee WJ, Kim HK, et al. Association between estimated glucose disposal rate and subclinical coronary atherosclerosis. Nutr Metab Cardiovasc Dis. (2025) 35:103686. doi: 10.1016/j.numecd.2024.07.004
15. Xuan J, Juan D, Yuyu N, Anjing J. Impact of estimated glucose disposal rate for identifying prevalent ischemic heart disease: findings from a cross-sectional study. BMC Cardiovasc Disord. (2022) 22:378. doi: 10.1186/s12872-022-02817-0
16. Rosenbaum PR, Rubin DB. The central role of the propensity score in observational studies for causal effects. Biometrika. (1983) 70:44–55.
17. Liang J, Hu Z, Zhan C, Wang Q. Using propensity score matching to balance the baseline characteristics. J Thorac Oncol. (2021) 16:e45–6. doi: 10.1016/j.jtho.2020.11.030
18. Karimi F, Dinarvand N, Sabaghan M, Azadbakht O, Ataee S, Kharazinejad E, et al. Diabetes and ovarian cancer: risk factors, molecular mechanisms and impact on prognosis. Endocrine. (2024) 83:1–9. doi: 10.1007/s12020-023-03477-6
19. Iyengar NM, Gucalp A, Dannenberg AJ, Hudis CA. Obesity and cancer mechanisms: tumor microenvironment and inflammation. J Clin Oncol. (2016) 34:4270–6. doi: 10.1200/JCO.2016.67.4283
20. Muniyappa R, Lee S, Chen H, Quon MJ. Current approaches for assessing insulin sensitivity and resistance in vivo: advantages, limitations, and appropriate usage. Am J Physiol Endocrinol Metab. (2008) 294:E15–26. doi: 10.1152/ajpendo.00645.2007
21. Song Y, Manson JE, Tinker L, Howard BV, Kuller LH, Nathan L, et al. Insulin sensitivity and insulin secretion determined by homeostasis model assessment and risk of diabetes in a multiethnic cohort of women: the Women's Health Initiative Observational Study. Diabetes Care. (2007) 30:1747–52. doi: 10.2337/dc07-0358
Keywords: ovarian cancer, estimated glucose disposal rate (eGDR), insulin resistance, NHANES database, multivariable logistic regression, restricted cubic splines
Citation: Zhang J, Chen X and Wang Y (2025) Inverse association between ovarian cancer and the estimated glucose disposal rate in NHANES 1999–2018. Front. Cancer Control Soc. 3:1579705. doi: 10.3389/fcacs.2025.1579705
Received: 19 February 2025; Accepted: 21 April 2025;
Published: 21 May 2025.
Edited by:
Edvīns Miklaševičs, Riga Stradinš University, LatviaReviewed by:
Jose Alberto Garcia Gomez, Hospital General Universitario de Elche, SpainXinghao Wang, Shengjing Hospital of China Medical University, China
Copyright © 2025 Zhang, Chen and Wang. This is an open-access article distributed under the terms of the Creative Commons Attribution License (CC BY). The use, distribution or reproduction in other forums is permitted, provided the original author(s) and the copyright owner(s) are credited and that the original publication in this journal is cited, in accordance with accepted academic practice. No use, distribution or reproduction is permitted which does not comply with these terms.
*Correspondence: Yongjun Wang, d2FuZ3lvbmdqdW5AanN0LWhvc3AuY29tLmNu