 Miaomiao Meng
 Yixin Guo1
 Zhuoran Kuang
 Xiaojia Ni
- 1The Second Clinical School, Guangzhou University of Chinese Medicine, Guangzhou, China
- 2Guangdong Provincial Hospital of Chinese Medicine, Guangdong Provincial Academy of Chinese Medical Sciences, Guangzhou, China
Background and Purpose: Overweight/obesity is a modified risk factor for stroke. This systematic review and meta-analysis aimed to assess the impact of different obesity phenotypes on stroke risk in adults.
Methods: The PubMed, Embase, and Cochrane Library databases were searched from their inception to 7 March 2021 to identify the prospective cohort studies investigating stroke risk among different metabolic overweight/obesity phenotypes. The methodological quality of the included studies was evaluated using the Newcastle–Ottawa Scale. Pooled hazard ratios (HRs) with 95% confidence intervals (CIs) were calculated using a random-effects model.
Results: A total of eleven prospective cohorts (n = 5,609,945 participants) were included in the systematic review, nine of which were included in the meta-analysis. All metabolically unhealthy phenotypes had a higher risk of stroke than the metabolically healthy normal-weight phenotypes, including metabolically unhealthy normal weight (HR = 1.63, 95% CI: 1.41–1.89, I2 = 89.74%, n = 7 cohort studies, 1,042,542 participants), metabolically unhealthy overweight (HR = 1.94, 95% CI: 1.58–2.40, I2 = 91.17%, n = 4 cohort studies, 676,166 participants), and metabolically unhealthy obese (HR = 1.99, 95% CI: 1.66–2.40, I2 = 93.49%, n = 6 cohort studies, 1,035,420 participants) phenotypes. However, no risk of stroke was observed in the populations with metabolically healthy overweight (MHOW) (HR = 1.07, 95% CI: 1.00–1.14, I2 = 69.50%, n = 5 studies, 4,171,943 participants) and metabolically healthy obese (MHO) (HR = 1.07, 95% CI: 0.99–1.16, I2 = 54.82%, n = 8 studies, 5,333,485 participants) phenotypes. The subgroup analyses for the MHO studies suggested that the risk of stroke increased only when the MHO participants were mainly females, from North America, and when the World Health Organization standard was applied to define obesity. In the subgroup analysis of the risk of stroke in MHOW, a longer follow-up duration was also associated with a higher risk of stroke.
Conclusion: The risk of stroke increase for all metabolically unhealthy phenotypes irrespective of the body mass index (BMI). The associated risk of stroke with metabolic health but high BMI shows substantial heterogeneity, which requires future research considering the impact of sex and transition of the metabolic status on the risk of stroke.
Systematic Review Registration: The study protocol was prospectively registered in PROSPERO (No. CRD42021251021).
Introduction
The Global Burden of Diseases, Injuries, and Risk Factors Study (GBD) 2019 showed that stroke is the second leading cause of death globally, and the incidence and prevalence of stroke have grown substantially (1). The identification and control of risk factors could be an effective approach for preventing new stroke cases. Global evidence has shown that obesity is a modifiable risk factor for all types of stroke (2, 3). The GBD 2019 study revealed that obesity is the fastest-growing risk factor in high body mass index (BMI) (1). These findings have been included in clinical practice guidelines in either the West or the East, and weight reduction in overweight/obese individuals is recommended to reduce the risk of stroke (4, 5). However, obesity often coexists with other cardiometabolic risk factors such as hypertension, hyperglycemia, and dyslipidemia (6–9). A meta-analysis of 97 prospective cohorts found that the partial excess risk of overweight and obesity for stroke was mediated by metabolic factors, including high blood pressure, cholesterol, and glucose (10). Thus, co-controlling metabolic factors are gaining attention to achieve optimal body weight, compared with the previous goal of an appropriate BMI only (6–9).
In the last 15 years, a concept that classifies individuals into six phenotypes based on the BMI and metabolic health has been gradually developed and supported by animal and human studies: metabolically healthy normal weight (MHNW), metabolically healthy overweight (MHOW), metabolically healthy obese (MHO), metabolically unhealthy normal weight (MUNW), metabolically unhealthy overweight (MUOW), and metabolically unhealthy obese (MUO) (11).
Whether metabolically healthy overweight/obese increases the cardio-cerebrovascular risk is a substantial debate (12–15). A recent meta-analysis of eight prospective cohorts revealed that MHO is positively associated with an elevated risk of stroke (16). However, it only calculated the risk ratio at the end of the follow-up, which might have omitted the time-dependent effect. It did not perform a subgroup analysis considering the demographic factors and the coexisting health conditions of the participants. Recently, more prospective cohorts of the same interest have been published (17–19). We updated the literature search and conducted a meta-analysis to examine the causal relationship between the obesity phenotypes and stroke risk.
Materials and Methods
The systematic review and meta-analysis were conducted according to the guidelines of the Preferred Reporting Items for Systematic Reviews and Meta-Analyses (PRISMA) statement (20). The study protocol was prospectively registered in PROSPERO (No. CRD42021251021).
Eligibility
Studies were included in the systematic review if they met the following criteria:
∎ Type of study
Only the prospective cohort study was eligible as it is the most appropriate design for examining the causal relationship between exposure and risk of disease. A pilot search found that a considerable number of prospective cohorts were published.
∎ Participants
The participants at baseline were adults (≥18 years old) without a preexisting stroke.
∎ Exposure and control
The exposure group had one of the following phenotypes: MHOW, MHO, MUNW, MUOW, or MUO, and the reference group was MHNW. Overweight/obesity was defined by BMI in compliance with the standards from one of the following organizations: the International Obesity Task Force (IOTF), Working Group on Obesity in China (WGOC), and the World Health Organization (WHO). Currently, there is no consensus regarding the definition of metabolic health. We endorsed the methodology of the previous systematic reviews (16), and ”metabolic health was defined as individuals with less than two abnormal metabolic parameters.” This enabled a direct comparison between the previous evidence and our study.
∎ Outcomes
The primary outcome was the first-ever stroke, which the participants could report—a clinical diagnosis confirmed by clinical signs/symptoms accompanied by brain images or a diagnosis in the medical records/national databases. The patients with ischemia, hemorrhage, or mixed stroke were eligible.
Studies were excluded if they were repeatedly published.
Search Strategy and Study Selection
We searched the PubMed, Embase, and the Cochrane Library databases from their inception to 7 March 2021. The search strategy is presented in Supplementary Table 1. Two researchers (MMM and GYX) independently screened the literature by removing duplicates, reading the title/abstract, and reviewing the full text. We calculated the inter-rater agreement with the reference of kappa value, and the disagreements were resolved through discussion or consultation with a third researcher (NXJ).
Data Extraction
Two researchers (MMM and GYX) extracted the data using the double-entry method and were checked by a third researcher (NXJ). The data items included author, publication year, country, sample size, mean or range of age, sex, period of baseline data collection, follow-up duration, overweight/obesity definition, definition of (un)metabolic health, the confounding factors that were adjusted for in the multivariable analysis, and adjusted or non-adjusted effect sizes [hazard ratio (HR) and relative risk (RR)] with the corresponding 95% confidence intervals (CIs).
Methodological Quality Assessment
Two researchers (KZR, LLL) independently evaluated the methodological quality of the included studies using the Newcastle–Ottawa Scale (NOS), a tool for assessing the quality of observational studies in meta-analyses (21). It was composed of three domains (eight items): selection of the study groups, comparability, and ascertainment of the outcomes for the cohort study. The assessment outcomes ranged from zero stars up to nine stars. Studies with seven or more stars were considered high quality. We calculated the inter-rater agreement concerning the intraclass correlation coefficient (ICC), and any disagreement was resolved by discussion or consultation with a third researcher (MMM).
Statistical Analysis
Pooled HRs with 95% CIs were calculated using a random-effects model to assess the risk of stroke for MHOW, MHO, MUNW, MUOW, and MUO compared to MHNW. The heterogeneity was evaluated using Cochran’s Q test and I2 statistics. If the heterogeneity was considered significant (p < 0.1 or I2 > 50%), subgroup analyses were performed according to the duration of the follow-up, number of abnormal metabolic components, criteria for defining overweight/obesity, research sites, and proportion of females to explore the potential sources of heterogeneity. A sensitivity analysis was performed based on the methodological quality of the included studies and the leave-one-out method. The publication bias was evaluated by the visual inspection of asymmetry in the funnel plots and Egger’s test for at least 10 studies. The statistical significance was set at p < 0.05. All data analyses were conducted using Stata/MP version 16.0.
Results
Search Results
We initially identified 3,381 records from the database search and finally included 11 eligible cohort studies in the systematic review (13–15, 17–19, 22–26). The inter-examiner agreement between the two reviewers was good (kappa = 0.762, 95% CI: 0.5464–0.9776). The results from nine cohorts were quantitatively synthesized as two studies reported the relative ratio (RR) instead of HR (22, 25). A full flowchart of the study selection process is shown in Figure 1. A list of the excluded studies is shown in Supplementary Data Sheet 1.
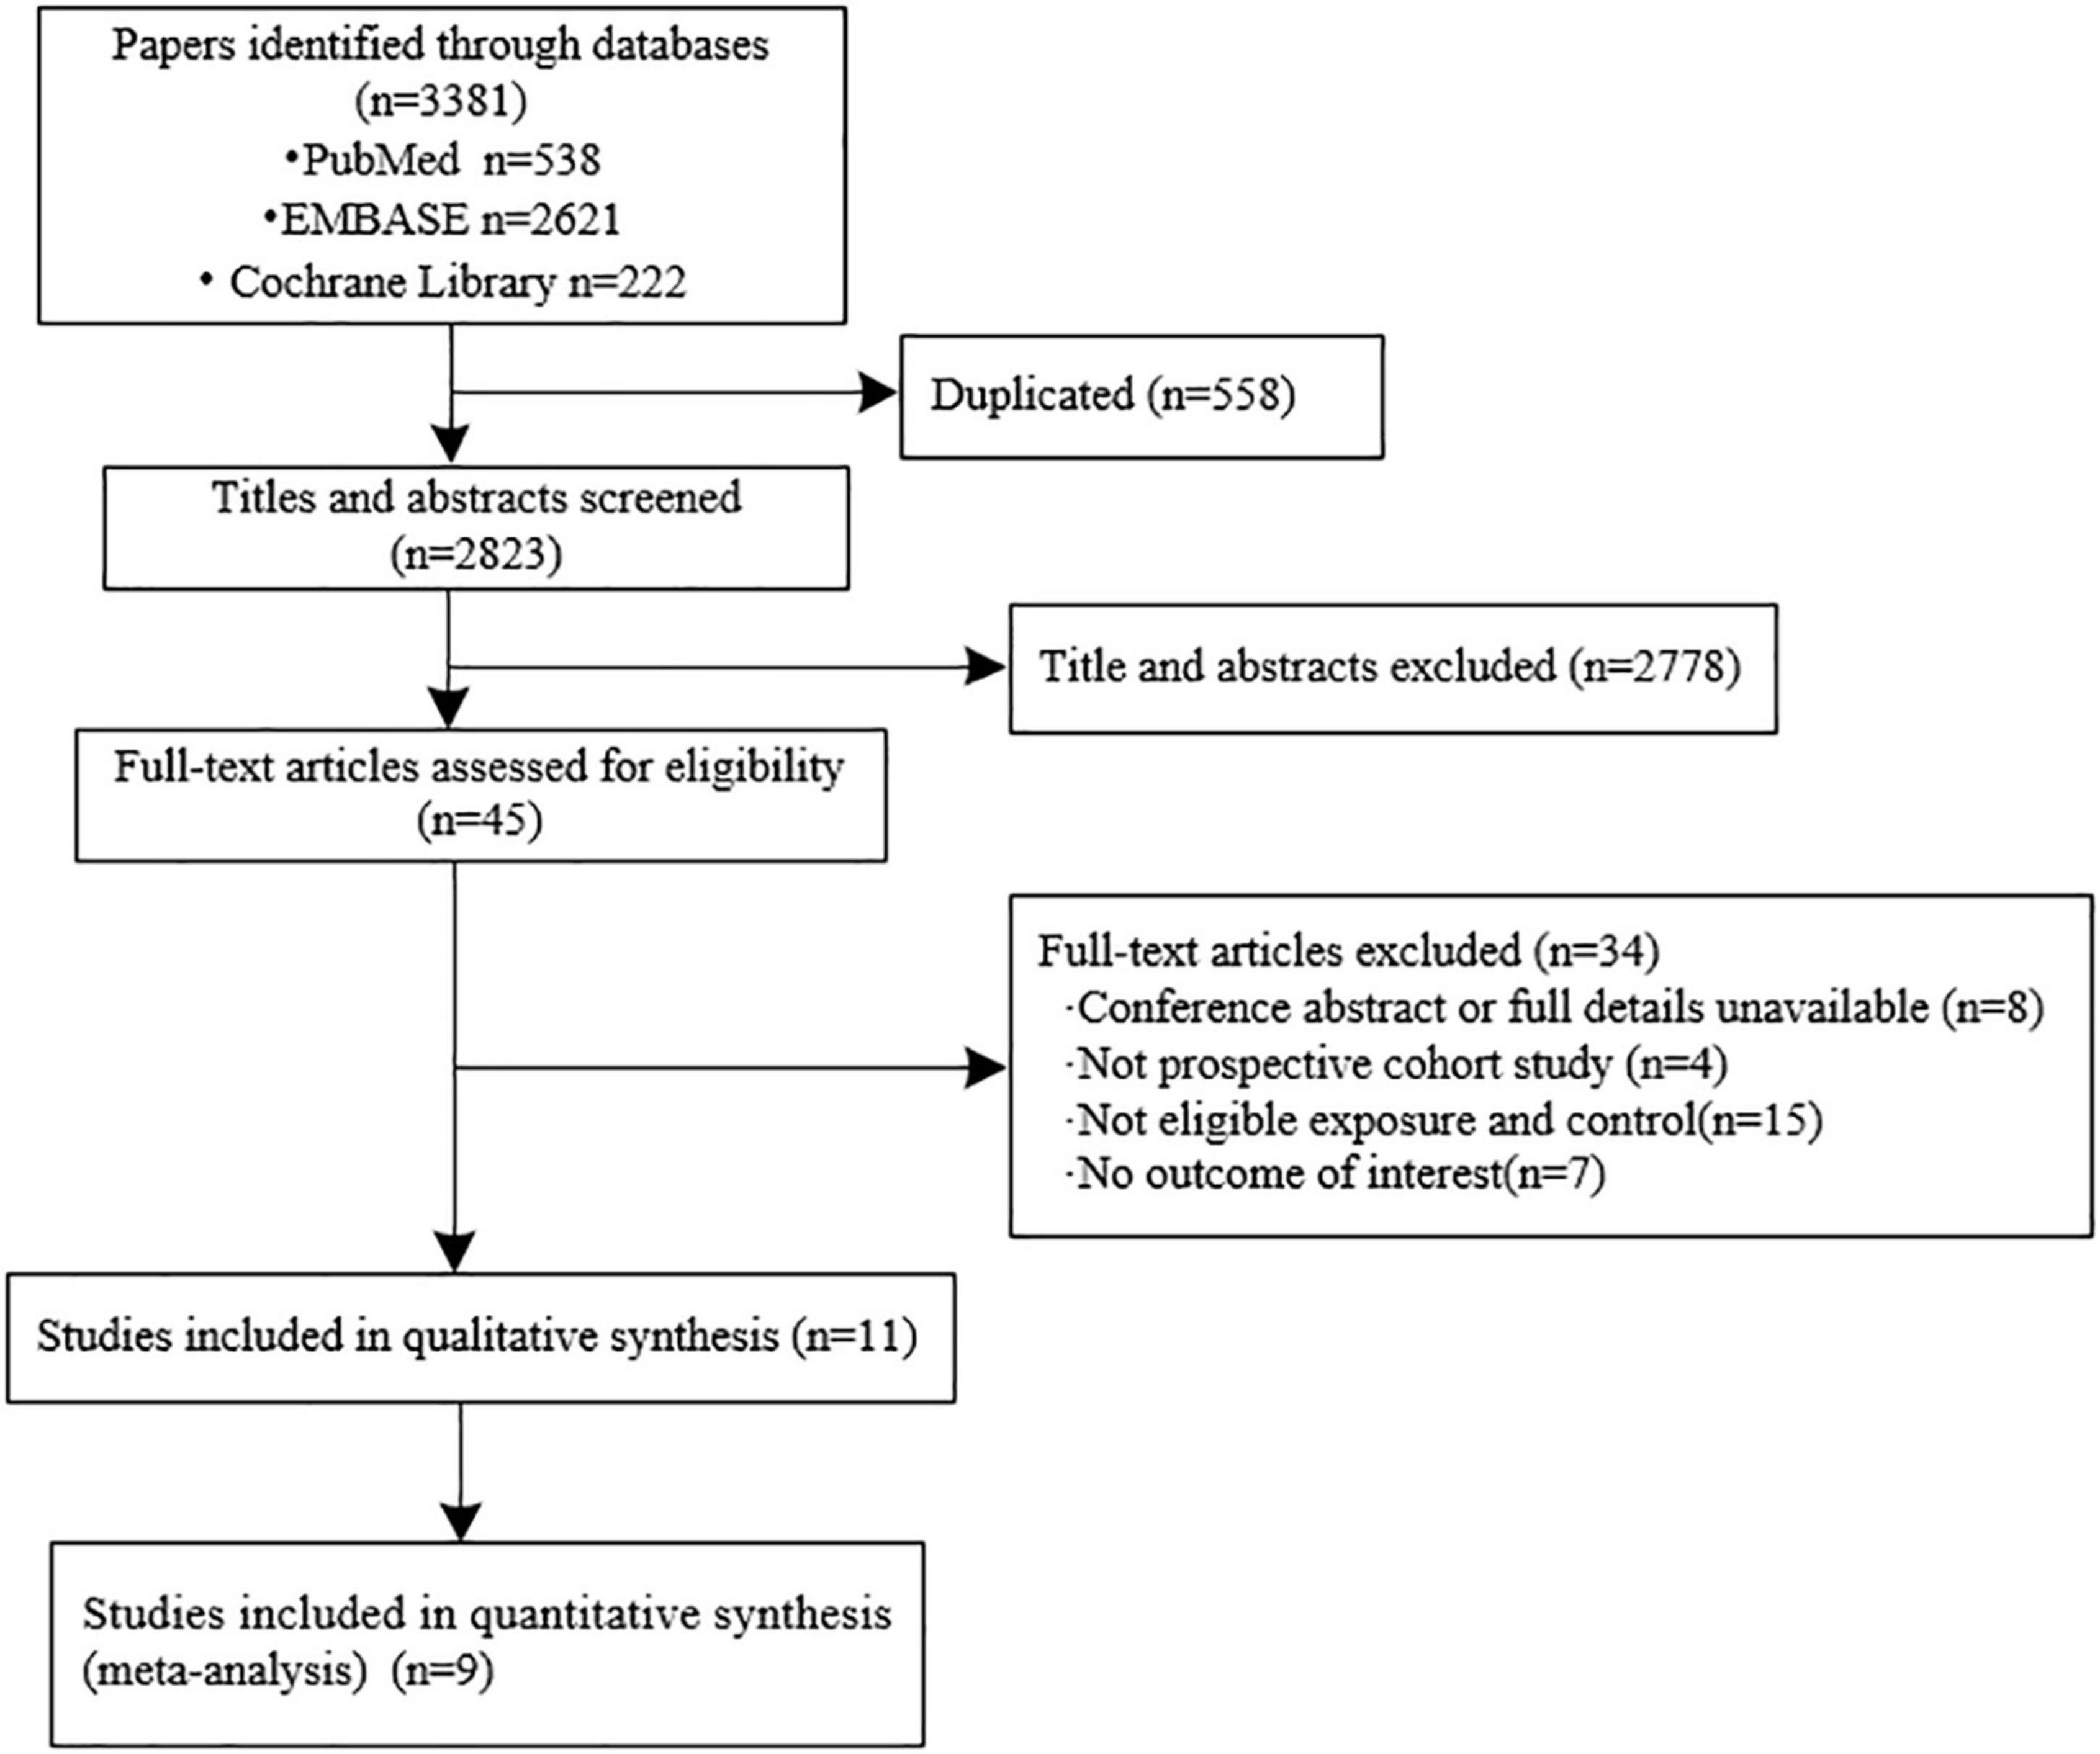
Figure 1. Flow chart for the literature search, study selection, and reasons for exclusion.
Study Characteristics
The sample sizes of the included cohorts ranged from 5,171 to 3,495,777 participants. The included studies were conducted in different geographic locations: four studies were conducted in Europe (14, 15, 24, 25), two in North America (13, 26), and five in Asia (17–19, 22, 23). Female participants were enrolled in only three studies (13, 25, 26). The baseline information was collected between 1980 and 2018, and the duration of the follow-up ranged from 3 to 24 years. The BMI threshold for obesity varied, including BMI ≥ 25 kg/m2 (International Obesity Task Force, IOTF) in two studies (17, 23), BMI ≥ 28 kg/m2 (Working Group on Obesity in China, WGOC) in three studies (18, 19, 22), and BMI ≥ 30 kg/m2 (World Health Organization, WHO) in six studies (13–15, 24–26). The definition of metabolic health was distinct, such as the Adult Treatment Panel III (ATP III) definition in three studies (14, 15, 26), the International Diabetes Federation (IDF) in one study (18), the Japanese diagnostic criteria in one study (17), modified harmonization and the Hammer’s study in three studies (19, 22, 23). The stroke event was reported by the participants in another study (22), diagnosed according to the clinical signs/symptoms and brain images in four studies (13, 14, 23, 24), and was collected from the medical records and registration information in the national databases. The full details of the basic characteristics of the included cohorts are presented in Table 1.
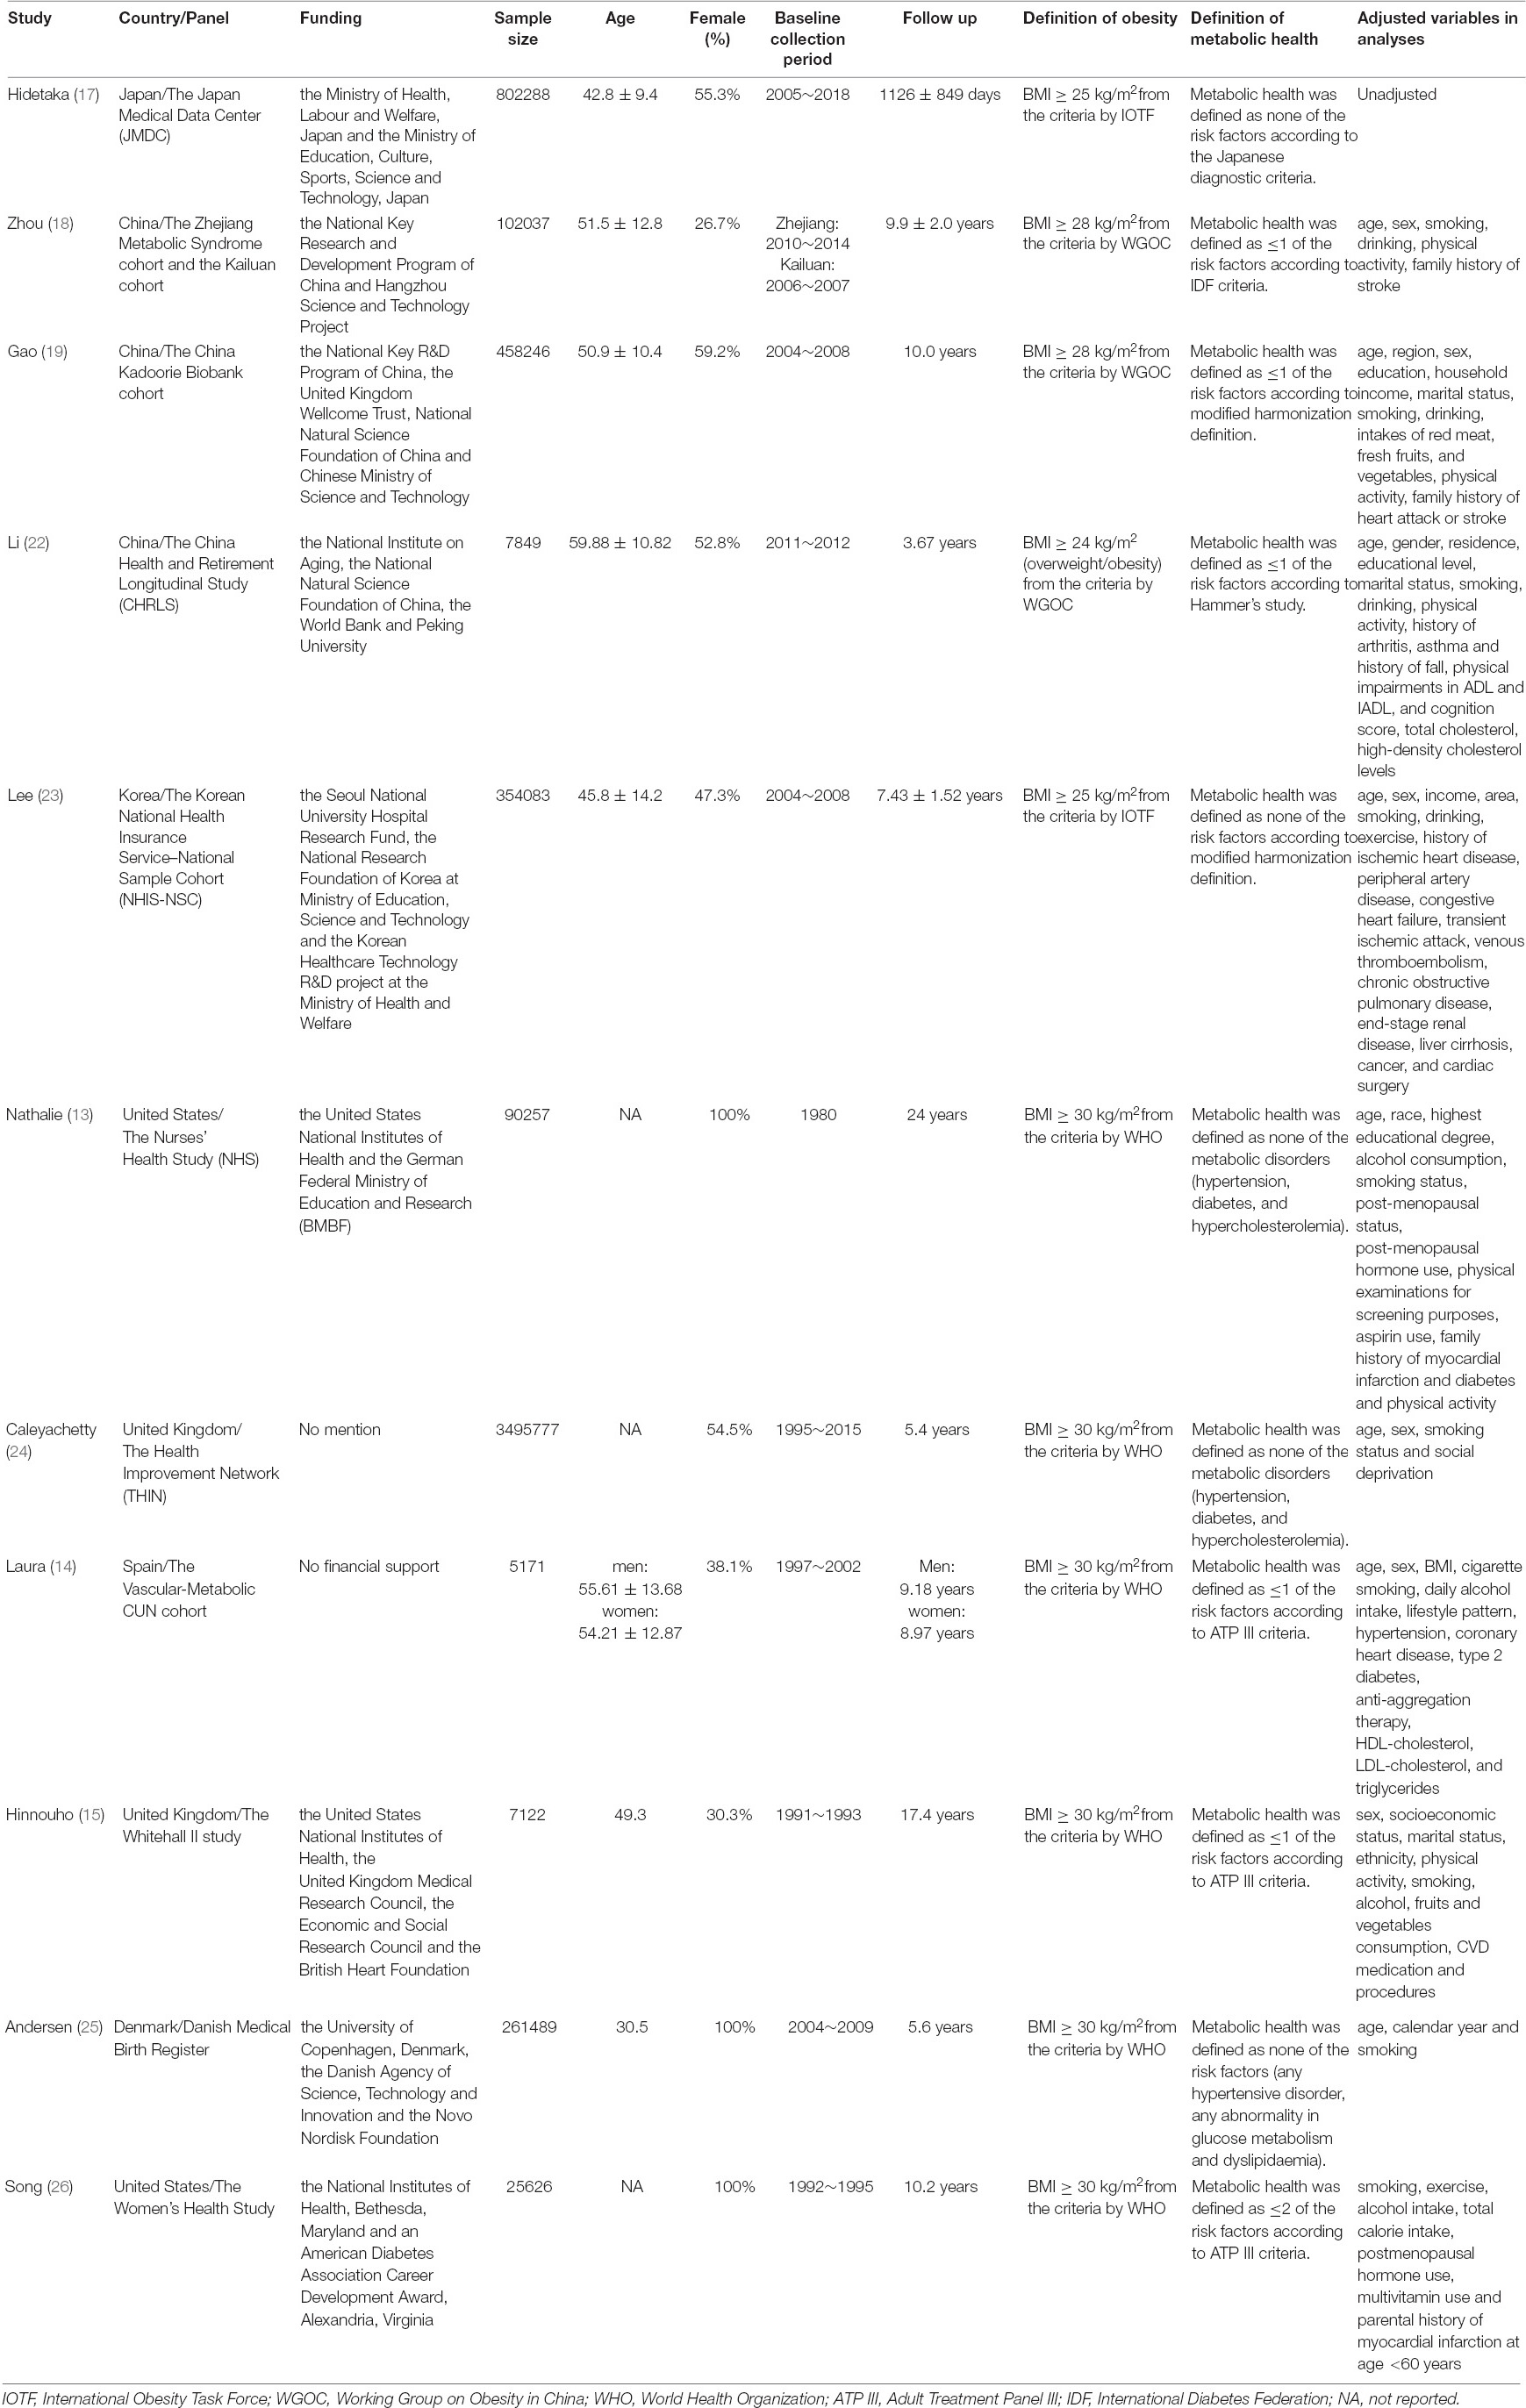
Table 1. Characteristics of the included studies.
Methodological Quality Assessment
The inter-examiner agreement was very good (ICC = 0.771, 95% CI: 0.3503–0.933). Regarding the methodological quality of the included studies, one study was awarded six stars (17), three studies evaluated eight stars (13, 15, 22), and seven studies achieved nine stars (14, 18, 19, 23–26). The average quality score was eight, suggesting that the methodological quality was generally moderate to high. The results of the quality assessments are presented in Table 2.
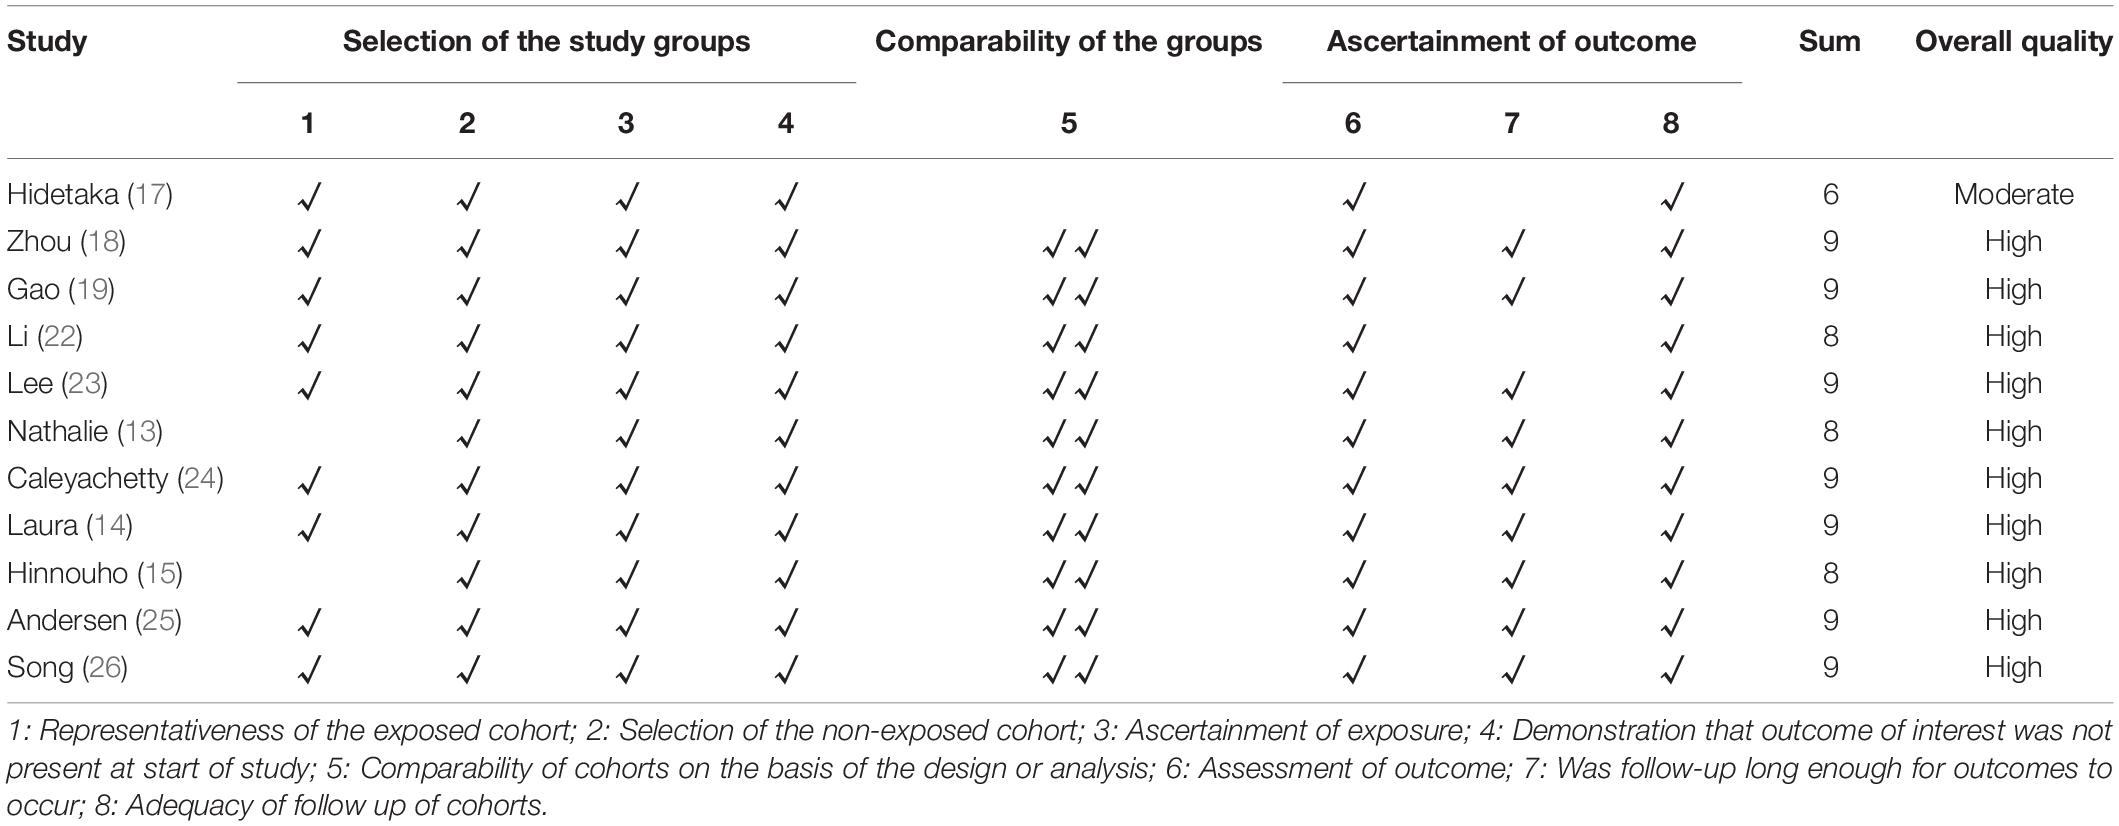
Table 2. Quality evaluation of the included studies.
Results of the Meta-Analyses
Metabolically Healthy Overweight/Metabolically Healthy Obese and Risk of Stroke
Compared with the MHNW group, the risk of stroke was not significantly increased in the participants with MHOW (MHOW: HR = 1.07, 95% CI: 1.00–1.14, I2 = 69.50%, n = 5 studies, 4,171,943 participants) (13, 18, 19, 24, 26) or MHO (HR = 1.07, 95% CI: 0.99–1.16, I2 = 54.82%, n = 8 studies, 5,333,485 participants) (13, 14, 17–19, 23, 24, 26) (Figure 2 and Supplementary Table 2). The subgroup analyses for the risk of stroke in the MHO were conducted in terms of the duration of the follow-up, the number of abnormal metabolic parameters, the definition of obesity, geographic locations, and proportion of females (Table 3 and Supplementary Figures 1–5), which revealed that the risk of stroke increased only when the MHO participants were mainly females, from North America, and when the WHO standard was applied in defining obesity, and these meta-analyses were of low heterogeneity. As for the subgroup analysis of the risk of stroke in the MHOW, a longer follow-up duration was also associated with a higher risk of stroke (Table 3 and Supplementary Figures 6–10).
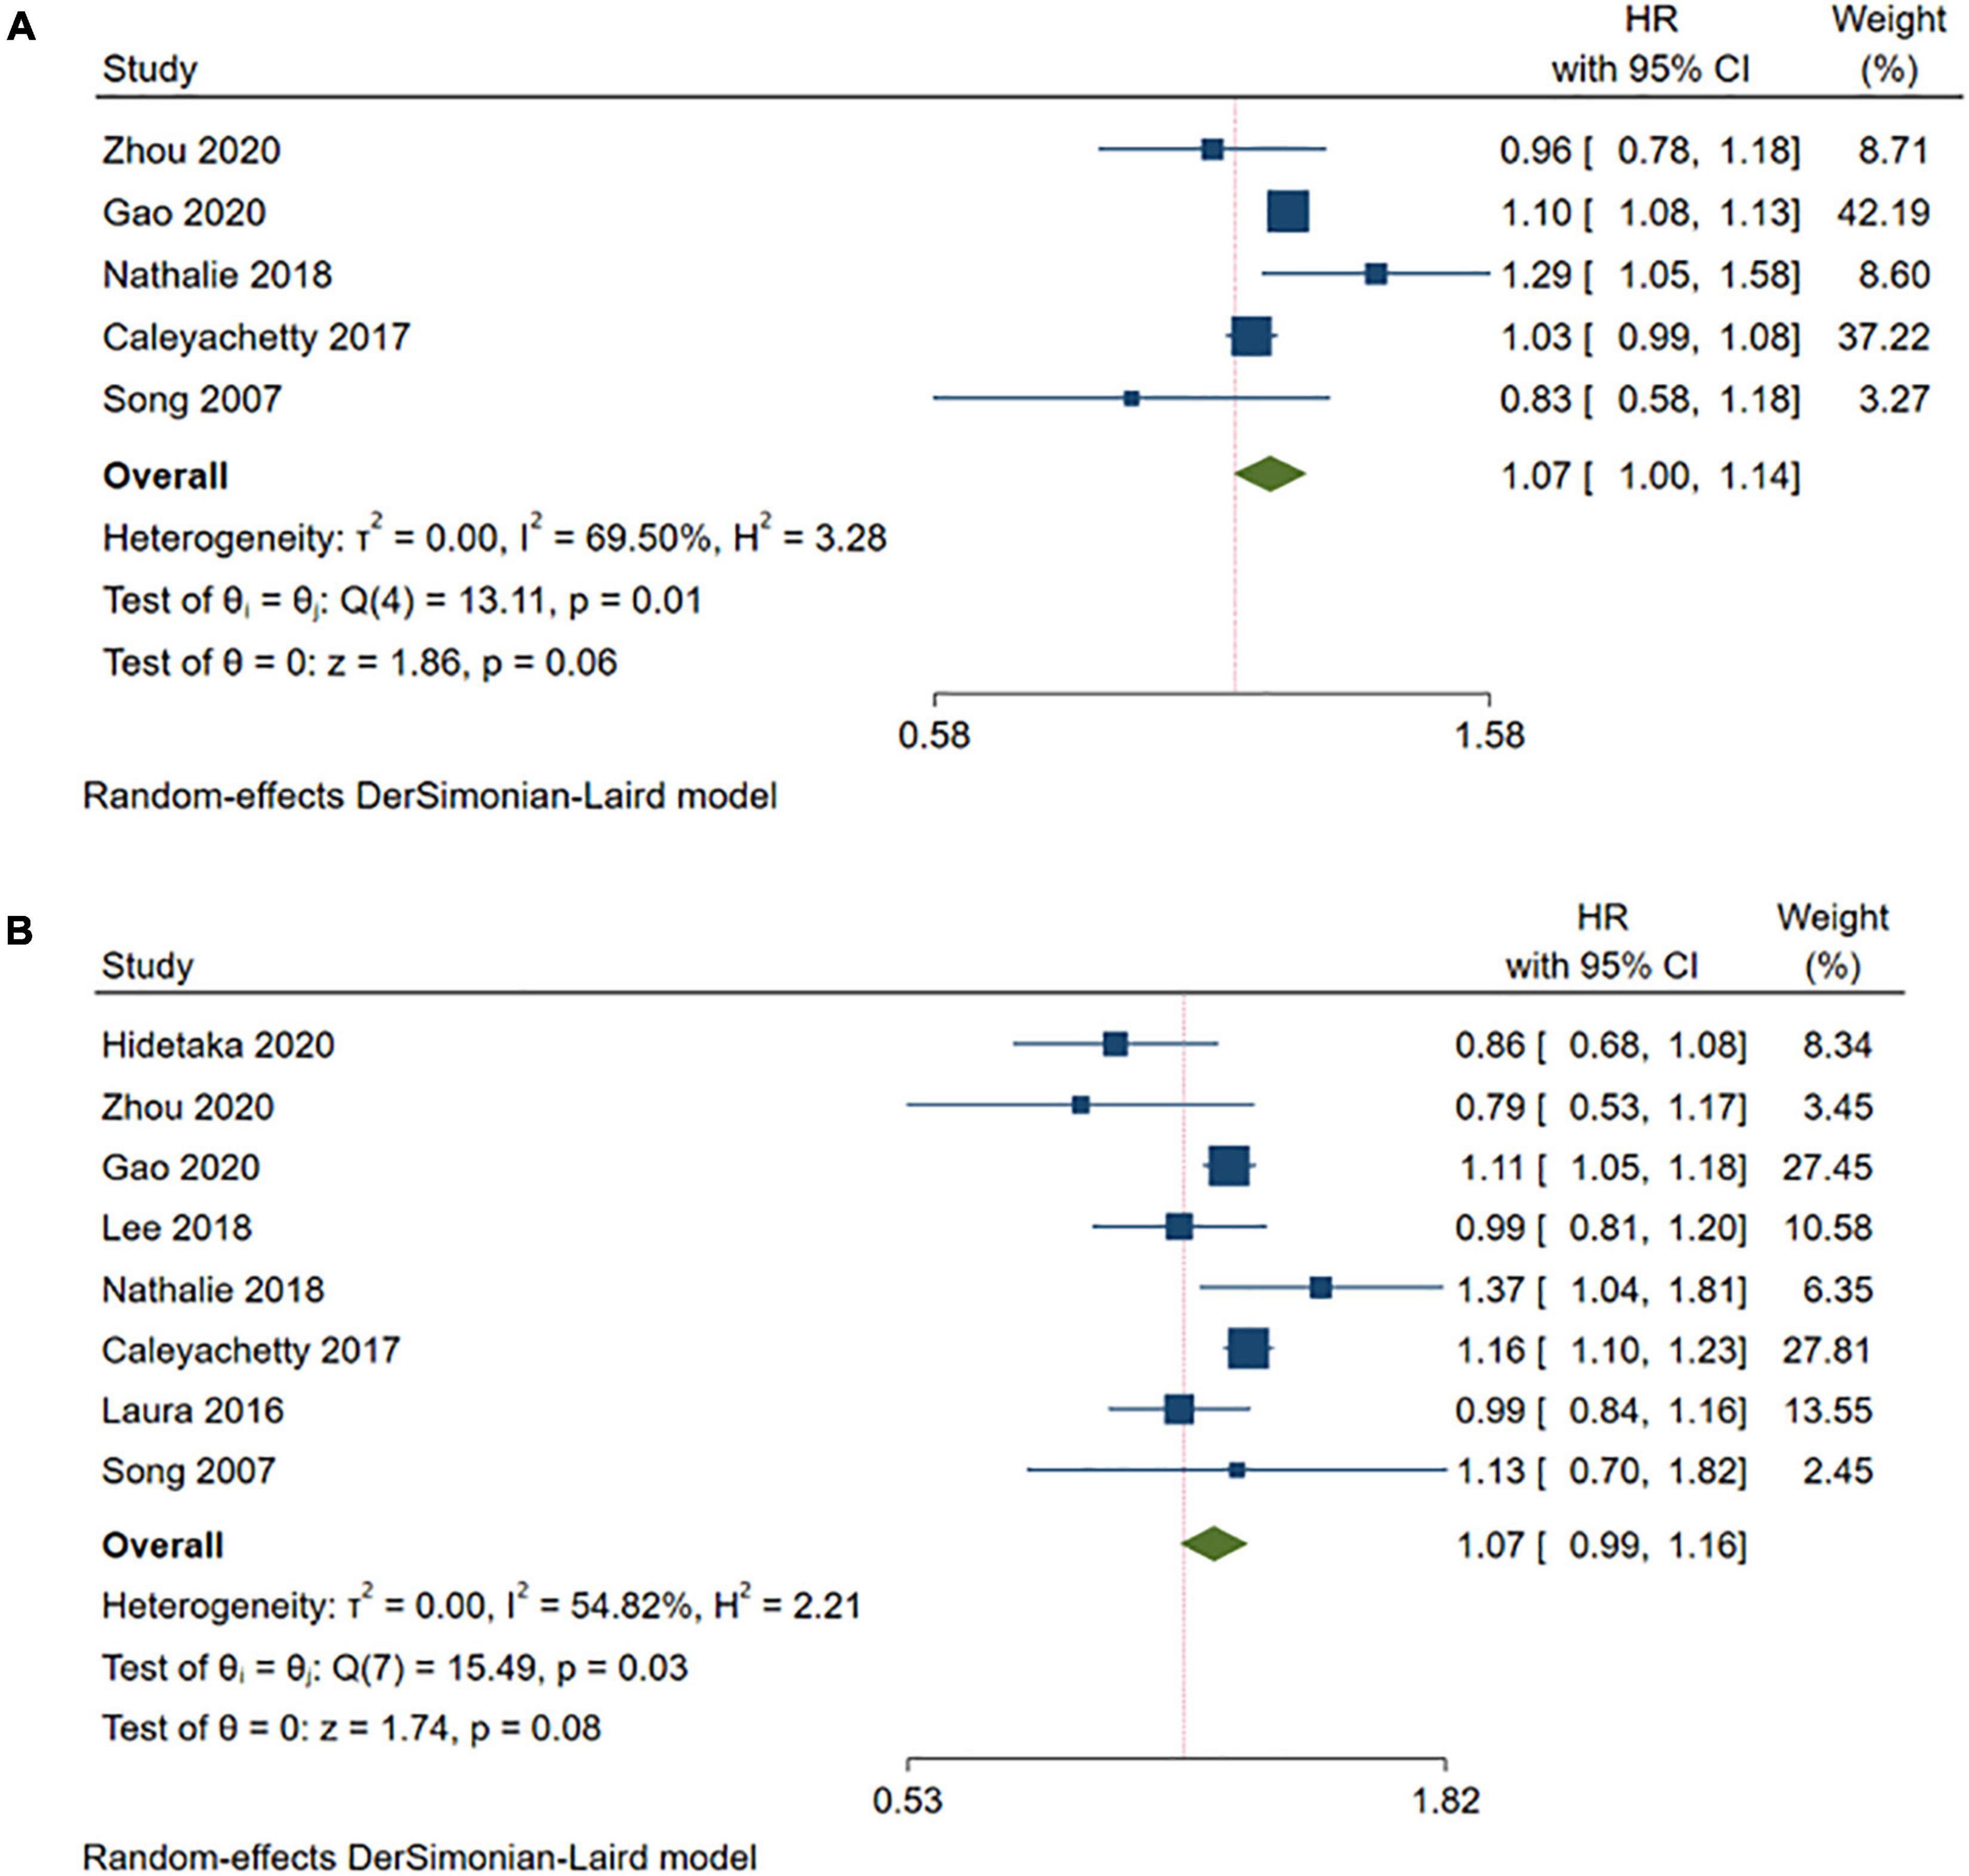
Figure 2. Meta-analysis of the risk of stroke in the MHOW/MHO phenotypes compared with the MHNW phenotypes. (A) MHOW phenotypes; (B) MHO phenotypes. MHNW, metabolically healthy normal weight; MHOW, metabolically healthy overweight; MHO, metabolically healthy obese; MUNW, metabolically unhealthy normal weight; MUOW, metabolically unhealthy overweight; MUO, metabolically unhealthy obese.
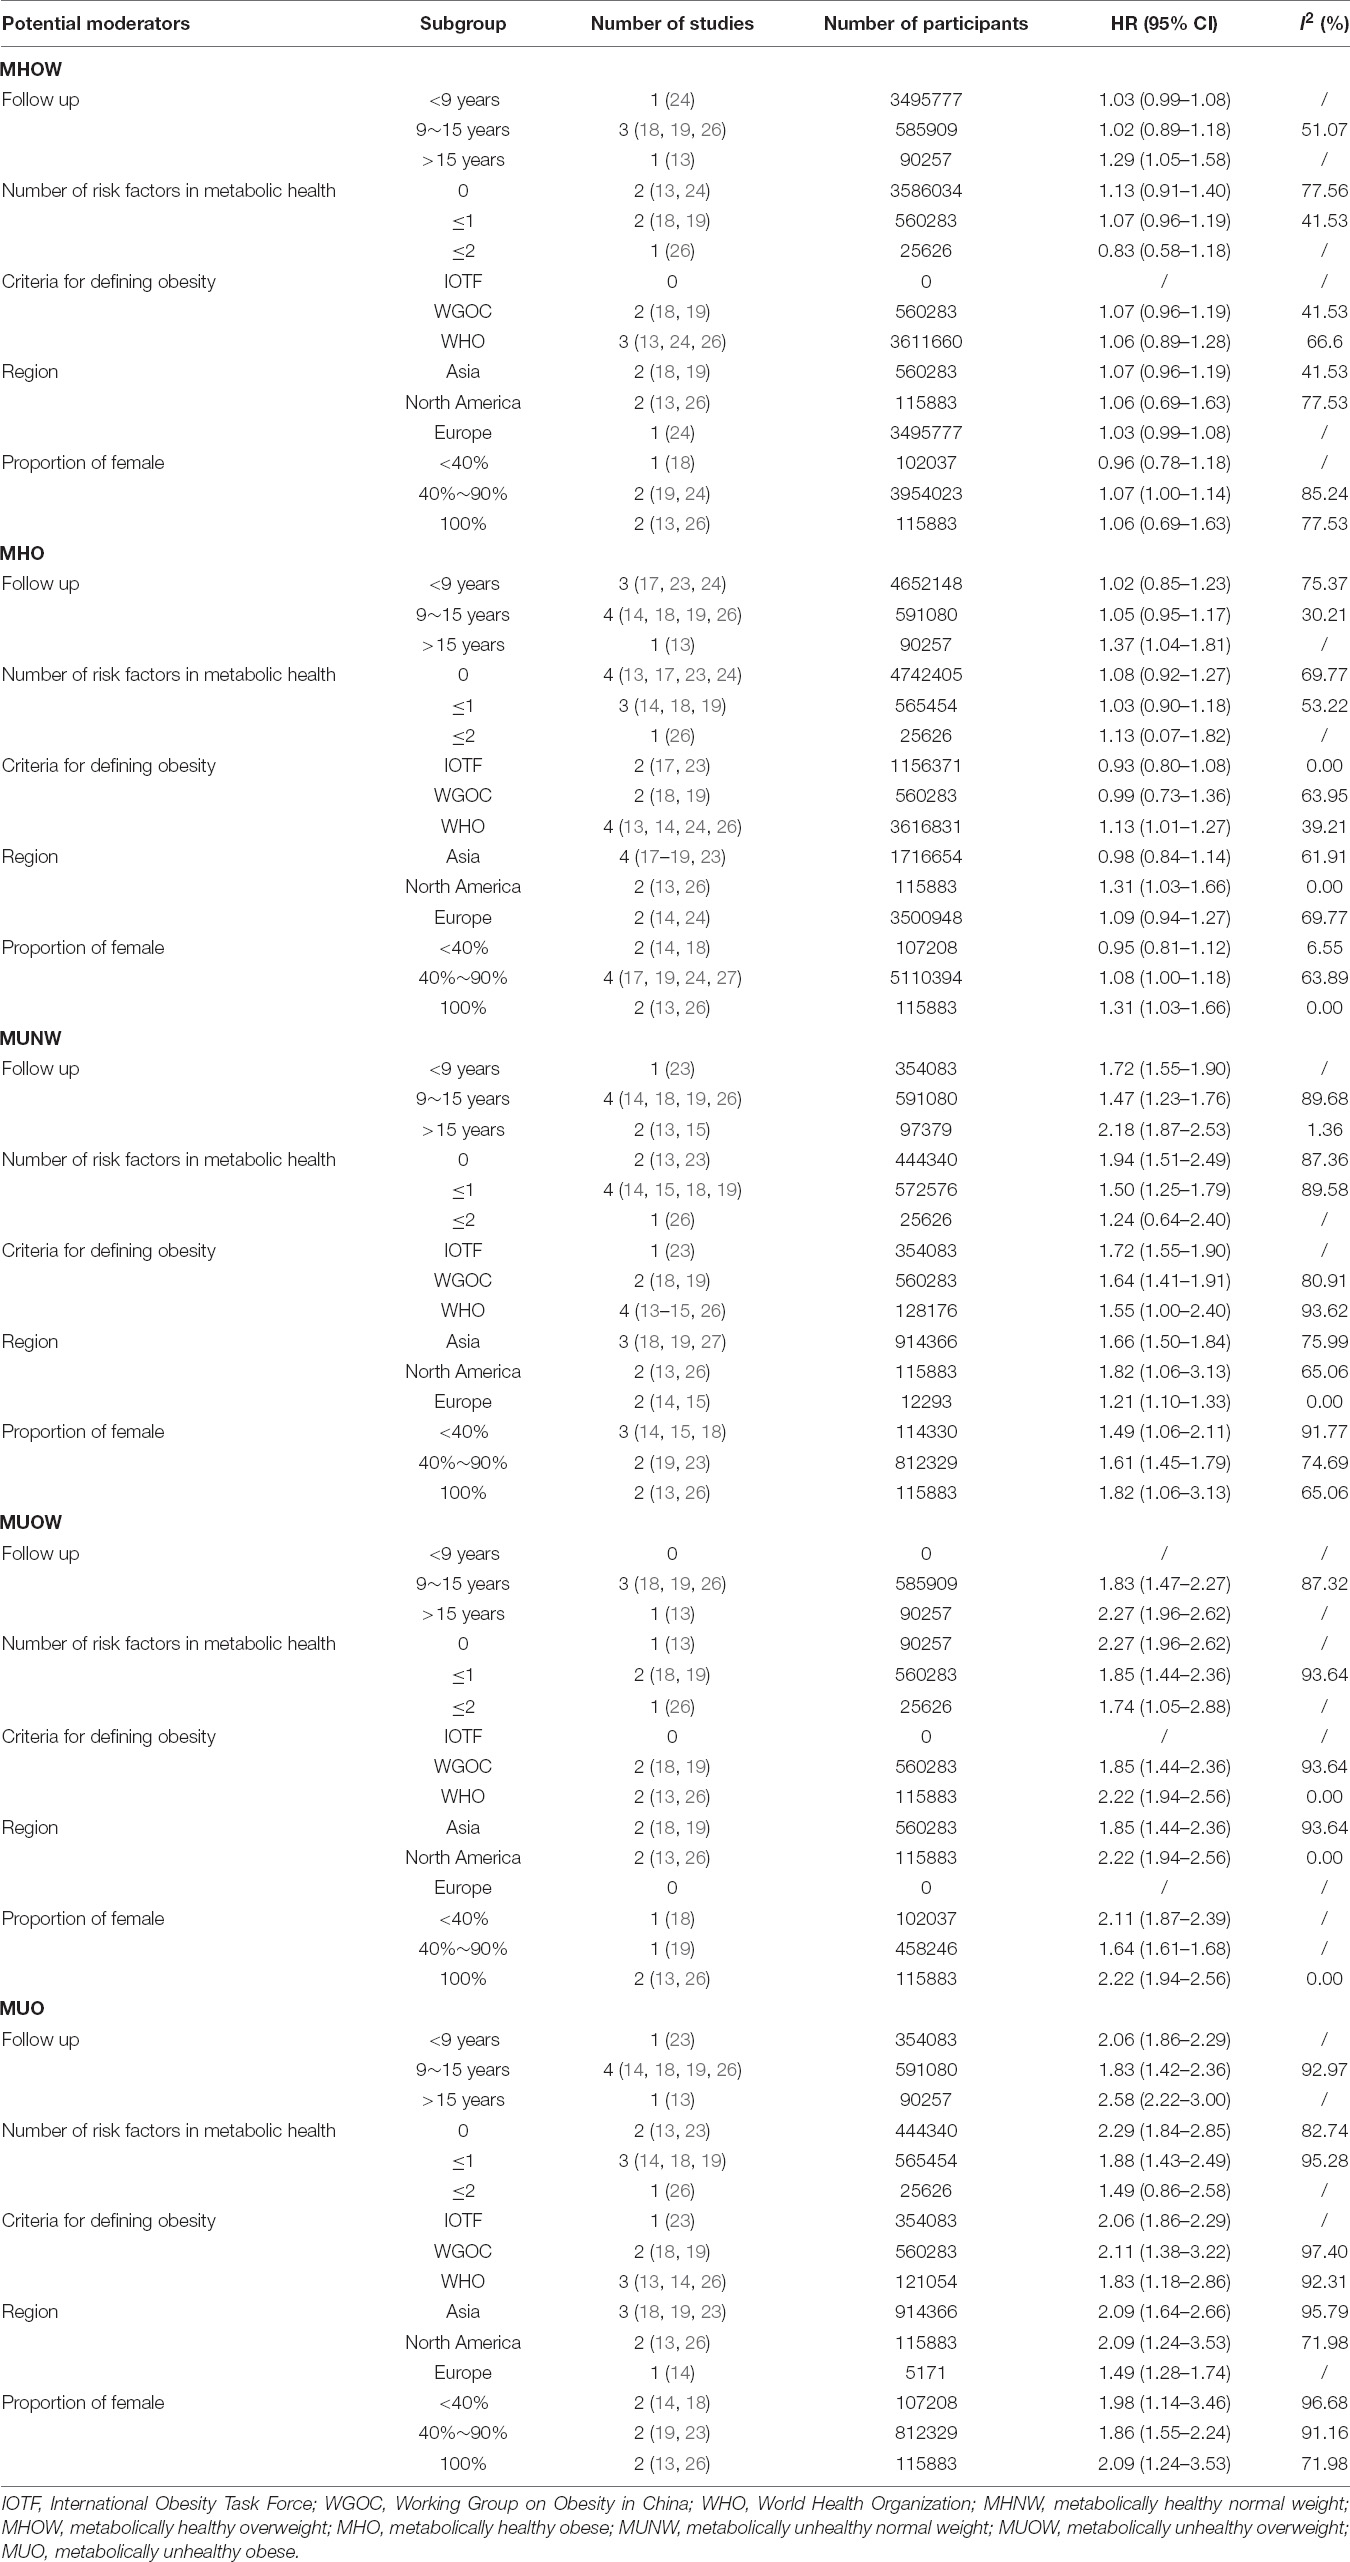
Table 3. Subgroup analysis for the association between the metabolic phenotypes and risk of stroke.
Metabolically Unhealthy Normal Weight and the Risk of Stroke
A higher risk of stroke was observed in the MUNW group than in the MHNW group (HR = 1.63, 95% CI: 1.41–1.89, I2 = 89.74%, n = 7 cohort studies, 1,042,542 participants) (13–15, 18, 19, 23, 26) (Figure 3 and Supplementary Table 2). The comprehensive subgroup analyses (Table 3 and Supplementary Figures 11–15) suggested that the risk of stroke increased when the follow-up was over 15 years (HR = 2.18, 95% CI: 1.87–2.53, I2 = 1.36%) than in those with a shorter follow-up duration, and this meta-analysis was quite homogeneous.
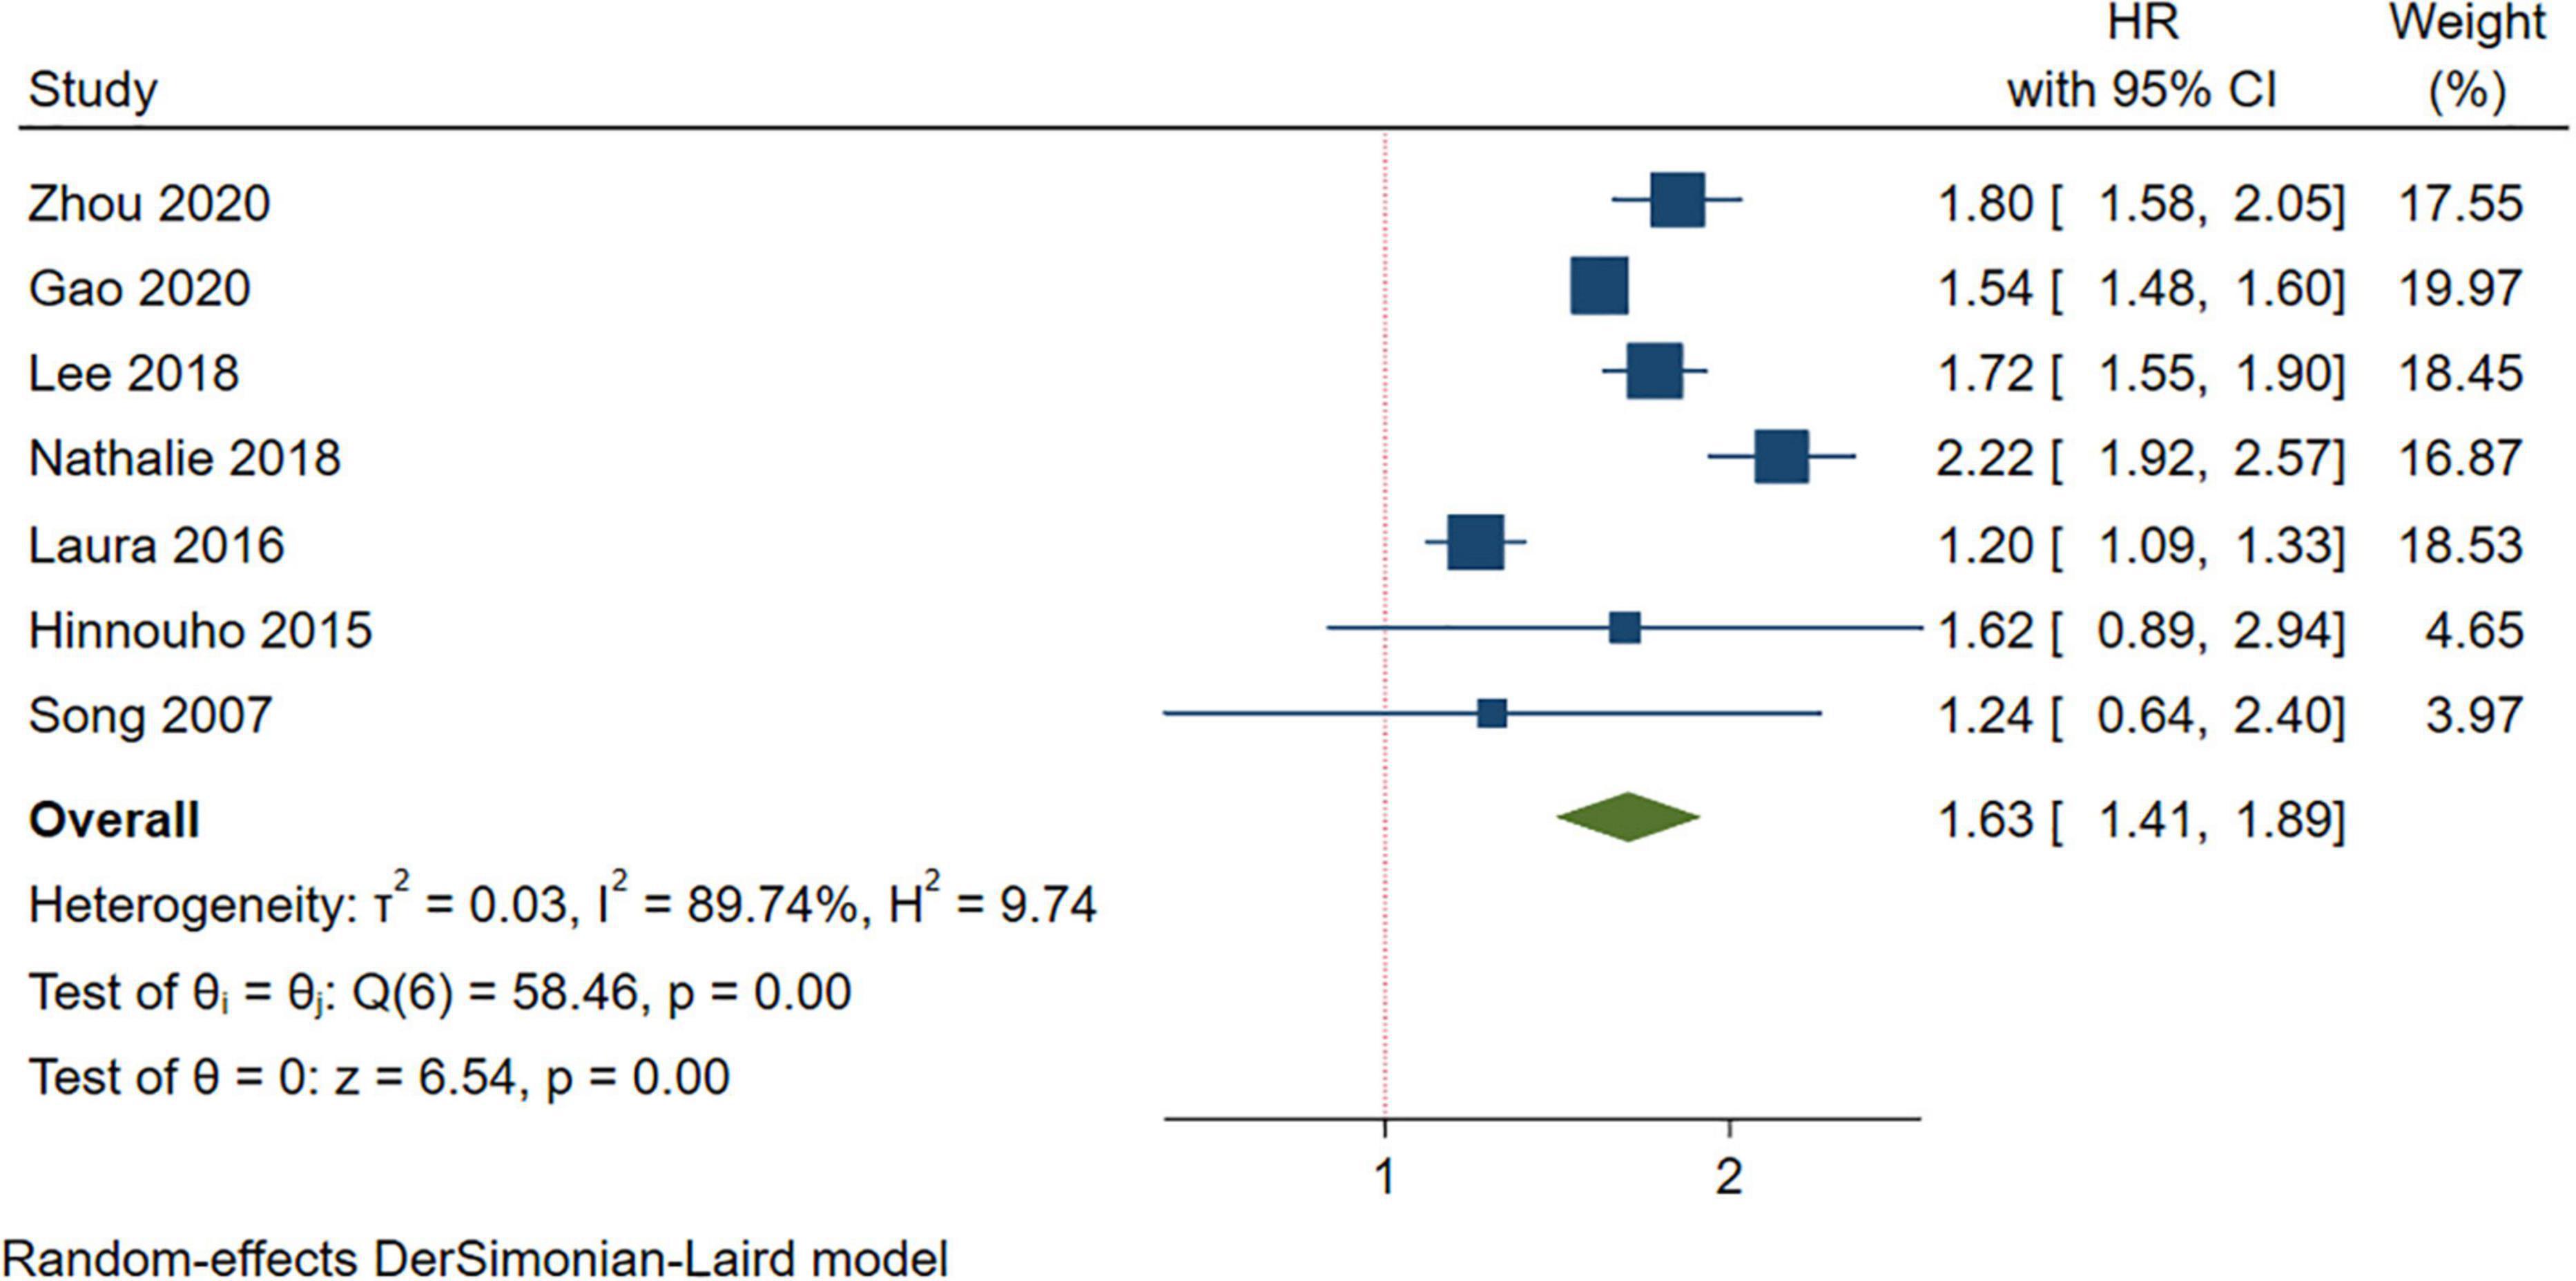
Figure 3. Meta-analysis of the risk of stroke in the MUNW phenotypes compared with the MHNW phenotypes. MUNW, metabolically unhealthy normal weight; MHNW, metabolically healthy normal weight.
Metabolically Unhealthy Overweight/Metabolically Unhealthy Obese and the Risk of Stroke
Compared with the MHNW group, a higher risk of stroke was found in either the participants with MUOW (HR = 1.94, 95% CI: 1.58–2.40, I2 = 91.17%, n = 4 cohort studies, 676,166 participants) (13, 18, 19, 26) or those with MUO (HR = 1.99, 95% CI: 1.66–2.40, I2 = 93.49%, n = 6 cohort studies, 1,035,420 participants) (13, 14, 18, 19, 23, 26) (Figure 4 and Supplementary Table 2). However, the subgroup analyses for the MUOW/MUO studies were substantially heterogeneous, except for the meta-analysis of MUOW only containing studies with a follow-up of more than 15 years, enrolling participants from North America, or studies with females accounting for most of the participants (Table 3 and Supplementary Figures 16–25).
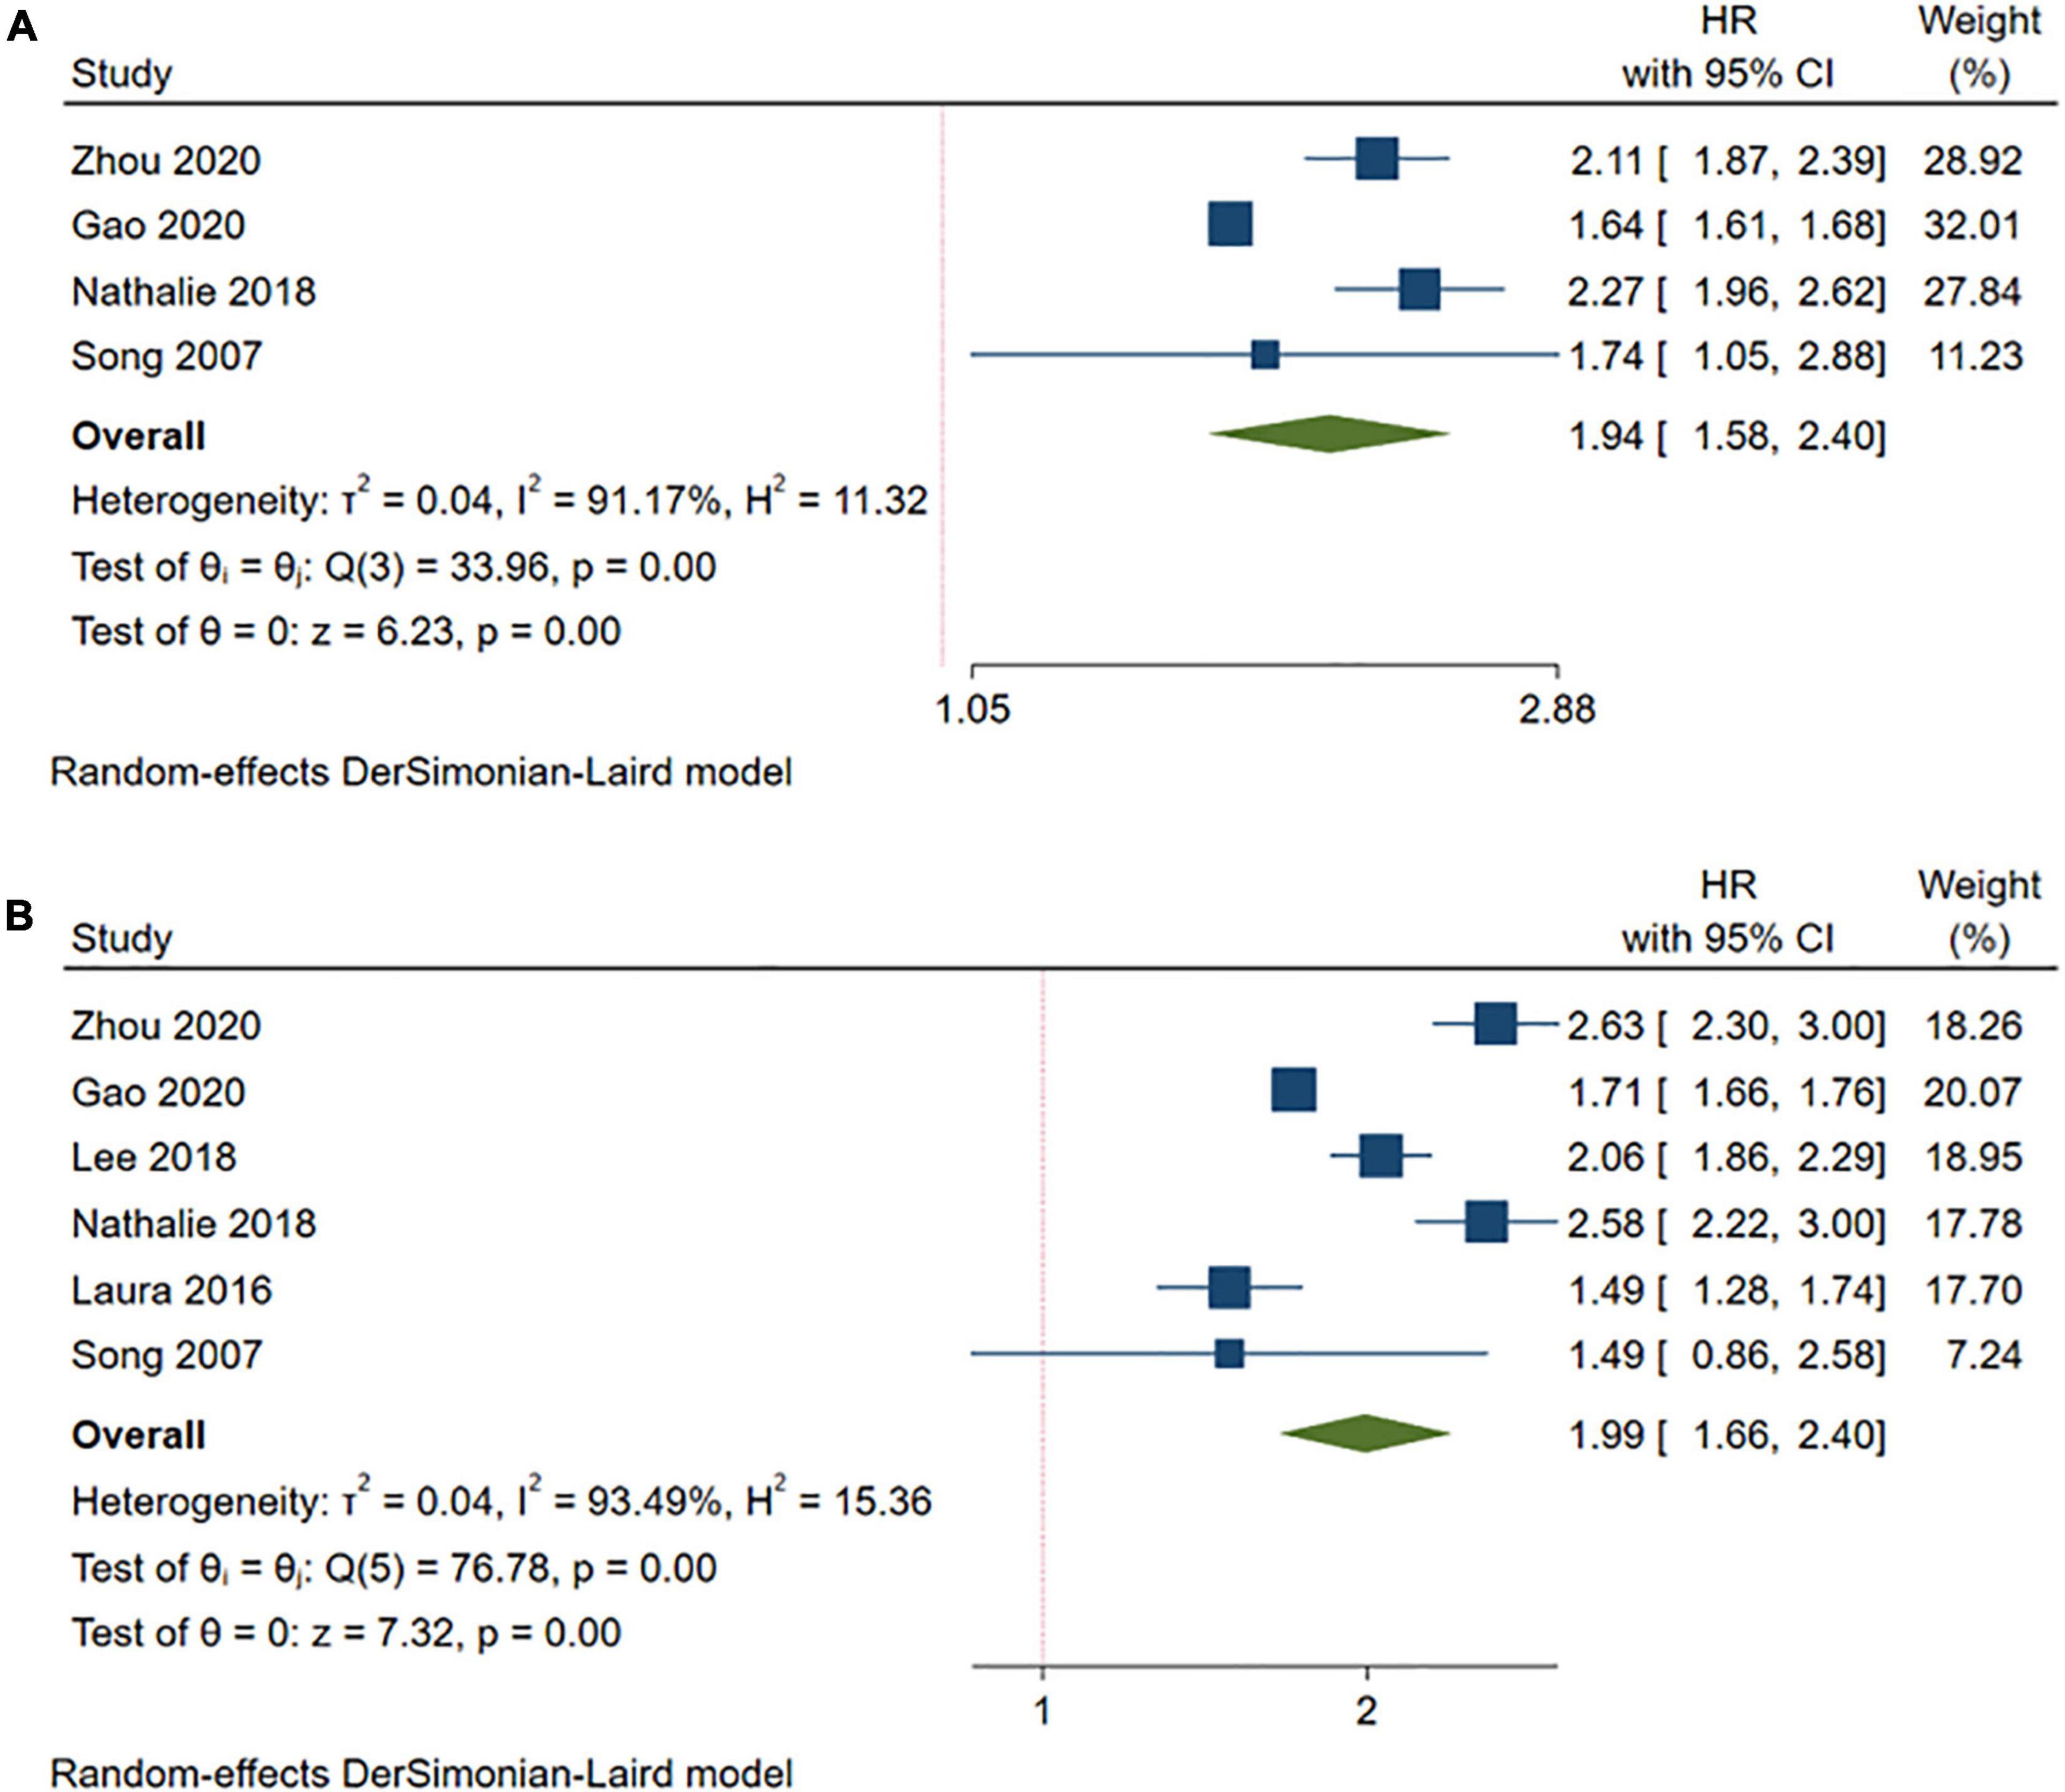
Figure 4. Meta-analysis of the risk of stroke in the MUOW/MUO phenotypes compared with the MHNW phenotypes. (A) MUOW phenotypes; (B) MUO phenotypes. MHNW, metabolically healthy normal weight; MHOW, metabolically healthy overweight; MHO, metabolically healthy obese; MUNW, metabolically unhealthy normal weight; MUOW, metabolically unhealthy overweight; MUO, metabolically unhealthy obese.
Sensitivity Analysis and Publication Bias
We performed a sensitivity analysis by omitting only one study with the lowest methodological quality of the NOS (17). An advanced risk of stroke was detected in the MHO participants compared to the MHNW participants (HR = 1.10, 95% CI: 1.03–1.18, I2 = 42.18%, n = 7 cohort studies, 4,531,197 participants) (Supplementary Figure 26), which differed from the primary analysis. An additional sensitivity analysis excluding one study at a time is shown in Supplementary Figure 27. The publication bias was not assessed because fewer than ten included studies in each phenotype.
Discussion
The Summary of the Main Findings and Strengths Compared With the Previous Studies
This systematic review and meta-analysis including nine prospective cohorts showed that metabolically unhealthy concurrent with either overweight or obesity resulted in an increased risk of stroke, which was not affected by the duration of the follow-up, the number of abnormal metabolic parameters, the definition of obesity, geographic locations, or the proportion of females. Although the primary meta-analysis supported the fact that overweight/obesity with metabolic health did not increase the risk of stroke, some subgroup analyses that only included a specific type of participant might present a different result. This study further examined the causal relationship between overweight/obesity and stroke-onset from the perspective of metabolism, which would assist with the stratified management of overweight/obesity and precision prevention for stroke. Compared with a previous study (16), our study had several strengths in terms of study design and data analyses. First, we included more recent cohorts by an updated search, which improved the precision of the estimated effect size; second, we calculated the HR instead of RR, which considered the time-dependent effect; third, we performed comprehensive subgroup analyses to explore the sources of heterogeneity and to test the robustness of the analysis models.
Explanations of the Results and Clinical Implications
We found that individuals with metabolically unhealthy phenotypes were at a higher risk of stroke, irrespective of the body weight, which was consistent with a previous systematic review (14, 16, 23). This suggests that multiple coexisting metabolic parameters play a leading role in the risk of incident stroke.
However, regarding the phenotypes of MHOW and MHO, our study suggested that the associated risk of stroke was not significantly increased, which differed from a previous systematic review (16). This was partially explained by the updates of the literature search and the different types of outcome data included in the meta-analysis. Furthermore, we observed additional findings when comprehensive subgroup analyses were performed. Concerning the participants with MHOW, a higher risk of stroke was identified by a longer duration of follow-up. This could be explained by the transition of the metabolic health status over long term. As studies have shown, MHOW is probably an unstable and intermediate condition, which could transfer to a metabolically unhealthy phenotype during the follow-up (28). Regarding the subgroup analysis of MHO, we found that MHO led to a higher risk of stroke only when the participants were all females and living in North America. This could be partially explained by the sex differences in the development of stroke. It has been well-recognized that the incidence of stroke is higher in women than in men after the menopausal period (29). The subgroup enrolled middle-aged female participants and continued the follow-up for incident stroke for more than 10 years immediately after their menopausal period. Another reason for the outstanding risk of stroke in the subgroup could be the high transition rate from metabolic health to unhealth in women. The Nurses’ Health Study reported that 84% of the women with MHO and 68% with MHNW were converted to metabolically unhealthy (13). The subgroup analysis also identified an associated risk of stroke for the MHO participants with obesity diagnosed based on the WHO criteria. This was not unexpected because the WHO defined obesity as a BMI of >30 kg/m2 (30), which was higher than any other criteria, such as the IOTF and the WGOC standards.
This study has several potential implications in clinical practice. First, metabolically unhealthy and elevated body weight had combined effects on increasing the risk of stroke. This suggests that when a strategy for stroke prevention is developed, monitoring metabolic parameters and achieving optimal body weight should be highlighted. Second, the potential long-term risk of stroke in individuals with metabolic health overweight/obesity should not be neglected, as the metabolic status might change over time, particularly in women. This suggests that maintaining metabolic health is also a goal for individuals with elevated body weight in the primary prevention of stroke. Third, as the homogeneous subgroup analysis showed, women appeared to have a higher risk of stroke when they had MHO, MUOW, and MUO. This suggests that the stroke prevention strategies tailored to female individuals with elevated body weight should be further studied and developed.
Limitations
This study has limitations. First, a few of the included cohorts performed multiple measurements of metabolic parameters during the follow-up, which might underestimate the impact of metabolic transitions on the risk of stroke. Second, our meta-analysis only calculated the risk of all stroke events, as most studies did not specify the type of stroke, and the confirmation method of the stroke events varied. This may not be sufficient to develop a precise prevention strategy for a specific type of stroke. Third, pooled HRs in this study were estimated by the random model to identify the average effect and the overall trend, therefore, although the statistical results potentially referred to a causal relationship of moderate-to-high strength, the HR value should not be considered as a typical risk effect (31, 32). Fourth, the definition of metabolic health varies, which may be changed alongside the ongoing studies. This suggests that an updated meta-analysis of the best available evidence is needed (33, 34). Finally, we only searched three representative English literature databases, which may have omitted some additional studies. However, methodological studies have suggested that restricting systematic reviews to English-language publications appears to have little impact on the effect estimates and conclusions of systematic reviews (35, 36).
Conclusion
The risk of stroke increases for all metabolically unhealthy phenotypes, irrespective of the BMI. The associated risk of stroke with metabolic health, but high BMI, is at substantial heterogeneity, which requires future research considering the impact of sex and transition of the metabolic status on the risk of stroke.
Data Availability Statement
The original contributions presented in the study are included in the article/Supplementary Material, further inquiries can be directed to the corresponding author/s.
Author Contributions
MM conceived the manuscript and analyzed the data. MM and YG searched the literature and collected the data. LL, ZK, and MM evaluated the methodological quality. XN and YC interpreted the results. XN designed the study, supervised the study implementation, validated the data, and wrote the manuscript. All authors approved the final manuscript.
Funding
This study is funded by the Guangzhou Municipal Science and Technology Bureau, China (No. 202102010300, principal investigator: XN) and is additionally supported by internal funding from the Guangzhou University of Chinese Medicine (No. 2021xk26).
Conflict of Interest
The authors declare that the research was conducted in the absence of any commercial or financial relationships that could be construed as a potential conflict of interest.
Publisher’s Note
All claims expressed in this article are solely those of the authors and do not necessarily represent those of their affiliated organizations, or those of the publisher, the editors and the reviewers. Any product that may be evaluated in this article, or claim that may be made by its manufacturer, is not guaranteed or endorsed by the publisher.
Supplementary Material
The Supplementary Material for this article can be found online at: https://www.frontiersin.org/articles/10.3389/fcvm.2022.844550/full#supplementary-material
Supplementary Data Sheet 1 | The full list of excluded studies.
Abbreviations
BMI, body mass index; MHNW, metabolically healthy normal weight; MHOW, metabolically healthy overweight; MHO, metabolically healthy obese; MUNW, metabolically unhealthy normal weight; MUOW, metabolically unhealthy overweight; MUO, metabolically unhealthy obese; IOTF, International Obesity Task Force; WGOC, Working Group on Obesity in China; WHO, World Health Organization.
References
1. GBD 2019 Stroke Collaborators. Global, regional, and national burden of stroke and its risk factors, 1990-2019: a systematic analysis for the Global Burden of Disease Study 2019. Lancet Neurol. (2021) 20:795–820. doi: 10.1016/S1474-4422(21)00252-0
2. O’Donnell MJ, Chin SL, Rangarajan S, Xavier D, Liu L, Zhang H, et al. Global and regional effects of potentially modifiable risk factors associated with acute stroke in 32 countries (INTERSTROKE): a case-control study. Lancet (London, England). (2016) 388:761–75. doi: 10.1016/s0140-6736(16)30506-2
3. Kim MS, Kim WJ, Khera AV, Kim JY, Yon DK, Lee SW, et al. Association between adiposity and cardiovascular outcomes: an umbrella review and meta-analysis of observational and Mendelian randomization studies. Eur Heart J. (2021) 42:3388–403. doi: 10.1093/eurheartj/ehab454
4. Meschia JF, Bushnell C, Boden-Albala B, Braun LT, Bravata DM, Chaturvedi S, et al. Guidelines for the primary prevention of stroke: a statement for healthcare professionals from the American Heart Association/American Stroke Association. Stroke. (2014) 45:3754–832. doi: 10.1161/str.0000000000000046
5. Chinese Society of Neurology [CSS]. Guidelines for the primary prevention of cerebrovascular diseases in China 2019. Chin J Neurol. (2019) 52:684–709. doi: 10.3760/cma.j.issn.1006-7876.2019.09.002
6. Zeng Q, Li N, Pan XF, Chen L, Pan A. Clinical management and treatment of obesity in China. Lancet Diabetes Endocrinol. (2021) 9:393–405. doi: 10.1016/s2213-8587(21)00047-4
7. Kim BY, Kang SM, Kang JH, Kang SY, Kim KK, Kim KB, et al. 2020 Korean society for the study of obesity guidelines for the management of obesity in Korea. J Obesity Metab Synd. (2021) 30:81–92. doi: 10.7570/jomes21022
8. Yumuk V, Tsigos C, Fried M, Schindler K, Busetto L, Micic D, et al. European guidelines for obesity management in adults. Obesity Facts. (2015) 8:402–24. doi: 10.1159/000442721
9. Garvey WT, Mechanick JI, Brett EM, Garber AJ, Hurley DL, Jastreboff AM, et al. American association of clinical endocrinologists and american college of endocrinology comprehensive clinical practice guidelines for medical care of patients with obesity. Endocrine Pract Off J Am College Endocrinol Am Assoc Clin Endocrinol. (2016) 22(Suppl. 3):1–203. doi: 10.4158/ep161365.gl
10. Lu Y, Hajifathalian K, Ezzati M, Woodward M, Rimm EB, Danaei G. Metabolic mediators of the effects of body-mass index, overweight, and obesity on coronary heart disease and stroke: a pooled analysis of 97 prospective cohorts with 1⋅8 million participants. Lancet (London, England). (2014) 383:970–83. doi: 10.1016/s0140-6736(13)61836-x
11. Stefan N, Häring HU, Hu FB, Schulze MB. Metabolically healthy obesity: epidemiology, mechanisms, and clinical implications. Lancet Diabetes Endocrinol. (2013) 1:152–62. doi: 10.1016/s2213-8587(13)70062-7
12. Mirzababaei A, Mozaffari H, Shab-Bidar S, Milajerdi A, Djafarian K. Risk of hypertension among different metabolic phenotypes: a systematic review and meta-analysis of prospective cohort studies. J Hum Hypertens. (2019) 33:365–77. doi: 10.1038/s41371-018-0146-y
13. Eckel N, Li Y, Kuxhaus O, Stefan N, Hu FB, Schulze MB. Transition from metabolic healthy to unhealthy phenotypes and association with cardiovascular disease risk across BMI categories in 90 257 women (the Nurses’ Health Study): 30 year follow-up from a prospective cohort study. Lancet Diabetes Endocrinol. (2018) 6:714–24. doi: 10.1016/s2213-8587(18)30137-2
14. Sánchez-Iñigo L, Navarro-González D, Fernández-Montero A, Pastrana-Delgado J, Martínez JA. Risk of incident ischemic stroke according to the metabolic health and obesity states in the Vascular-Metabolic CUN cohort. Int J Stroke Off J Int Stroke Soc. (2017) 12:187–91. doi: 10.1177/1747493016672083
15. Hinnouho GM, Czernichow S, Dugravot A, Nabi H, Brunner EJ, Kivimaki M, et al. Metabolically healthy obesity and the risk of cardiovascular disease and type 2 diabetes: the Whitehall II cohort study. Eur Heart J. (2015) 36:551–9. doi: 10.1093/eurheartj/ehu123
16. Ma LZ, Sun FR, Wang ZT, Tan L, Hou XH, Ou YN, et al. Metabolically healthy obesity and risk of stroke: a meta-analysis of prospective cohort studies. Ann Transl. Med. (2021) 9:197. doi: 10.21037/atm-20-4387
17. Itoh H, Kaneko H, Kiriyama H, Kamon T, Fujiu K, Morita K, et al. Metabolically healthy obesity and the risk of cardiovascular disease in the general population- analysis of a nationwide epidemiological database. Circ J Off J Japanese Circ Soc. (2021) 85:914–20. doi: 10.1253/circj.CJ-20-1040
18. Zhou Y, Zhang X, Zhang L, Li Z, Wu Q, Jin Z, et al. Increased stroke risk in metabolically abnormal normal weight: a 10-Year Follow-up of 102,037 participants in China. Transl Stroke Res. (2020) 12:725–34. doi: 10.1007/s12975-020-00866-1
19. Gao M, Lv J, Yu C, Guo Y, Bian Z, Yang R, et al. Metabolically healthy obesity, transition to unhealthy metabolic status, and vascular disease in Chinese adults: a cohort study. PLoS Med. (2020) 17:e1003351. doi: 10.1371/journal.pmed.1003351
20. Moher D, Liberati A, Tetzlaff J, Altman DG. Preferred reporting items for systematic reviews and meta-analyses: the PRISMA statement. BMJ (Clinical Research Ed). (2009) 339:b2535. doi: 10.1136/bmj.b2535
21. Wells G, Shea B, O’Connell D, Peterson J, Welch V, Losos M, et al. The Newcastle-Ottawa Scale (NOS) for Assessing the Quality of Nonrandomised Studies in Meta-Analyses. (2013). Available online at: http://www.ohri.ca/programs/clinical_epidemiology/oxford.asp (accessed December 28, 2021).
22. Li H, He D, Zheng D, Amsalu E, Wang A, Tao L, et al. Metabolically healthy obese phenotype and risk of cardiovascular disease: results from the China Health and Retirement Longitudinal Study. Arch Gerontol Geriatr. (2019) 82:1–7. doi: 10.1016/j.archger.2019.01.004
23. Lee HJ, Choi EK, Lee SH, Kim YJ, Han KD, Oh S. Risk of ischemic stroke in metabolically healthy obesity: a nationwide population-based study. PLoS One. (2018) 13:e0195210. doi: 10.1371/journal.pone.0195210
24. Caleyachetty R, Thomas GN, Toulis KA, Mohammed N, Gokhale KM, Balachandran K, et al. Metabolically healthy obese and incident cardiovascular disease events among 3.5 Million Men and Women. J Am College Cardiol. (2017) 70:1429–37. doi: 10.1016/j.jacc.2017.07.763
25. Andersen SS, Andersson C, Berger SM, Jensen TB, Torp-Pedersen CT, Gislason GH, et al. Impact of metabolic disorders on the relation between overweight/obesity and incident myocardial infarction and ischaemic stroke in fertile women: a nationwide cohort study. Clin Obesity. (2015) 5:127–35. doi: 10.1111/cob.12096
26. Song Y, Manson JE, Meigs JB, Ridker PM, Buring JE, Liu S. Comparison of usefulness of body mass index versus metabolic risk factors in predicting 10-year risk of cardiovascular events in women. Am J Cardiol. (2007) 100:1654–8. doi: 10.1016/j.amjcard.2007.06.073
27. Lee MJ, Kim EH, Bae SJ, Choe J, Jung CH, Lee WJ, et al. Protective role of skeletal muscle mass against progression from metabolically healthy to unhealthy phenotype. Clin Endocrinol. (2019) 90:102–13. doi: 10.1111/cen.13874
28. Mongraw-Chaffin M, Foster MC, Anderson CAM, Burke GL, Haq N, Kalyani RR, et al. Metabolically healthy obesity, transition to metabolic syndrome, and cardiovascular risk. J Am College Cardiol. (2018) 71:1857–65. doi: 10.1016/j.jacc.2018.02.055
29. Bushnell CD, Chaturvedi S, Gage KR, Herson PS, Hurn PD, Jiménez MC, et al. Sex differences in stroke: challenges and opportunities. J Cereb Blood Flow Metab Off J Int Soc Cereb Blood Flow Metab. (2018) 38:2179–91. doi: 10.1177/0271678x18793324
30. World Health Organization [WHO]. WHO Guidelines Approved by the Guidelines Review Committee. Guideline: Sugars Intake for Adults and Children. Geneva: World Health Organization (2015).
31. Deeks JJ, Higgins JPT, Altman DG. Chapter 10: Analysing data and undertaking meta-analyses. In: Higgins JPT, Thomas J, Chandler J, Cumpston M, Li T, Page MJ, et al. editors. Cochrane Handbook for Systematic Reviews of Interventions version 6.2 (Updated February 2021). London: Cochrane (2021).
32. Guyatt GH, Oxman AD, Sultan S, Glasziou P, Akl EA, Alonso-Coello P, et al. GRADE guidelines: 9. Rating up the quality of evidence. J Clin Epidemiol. (2011) 64:1311–6. doi: 10.1016/j.jclinepi.2011.06.004
33. Smith GI, Mittendorfer B, Klein S. Metabolically healthy obesity: facts and fantasies. J Clin Invest. (2019) 129:3978–89. doi: 10.1172/JCI129186
34. Tsatsoulis A, Paschou SA. Metabolically healthy obesity: criteria, epidemiology, controversies, and consequences. Curr Obes Rep. (2020) 9:109–20. doi: 10.1007/s13679-020-00375-0
35. Morrison A, Polisena J, Husereau D, Moulton K, Clark M, Fiander M, et al. The effect of English-language restriction on systematic review-based meta-analyses: a systematic review of empirical studies. Int J Technol Assess Health Care. (2012) 28:138–44. doi: 10.1017/S0266462312000086
36. Dobrescu AI, Nussbaumer-Streit B, Klerings I, Wagner G, Persad E, Sommer I, et al. Restricting evidence syntheses of interventions to English-language publications is a viable methodological shortcut for most medical topics: a systematic review. J Clin Epidemiol. (2021) 137:209–17. doi: 10.1016/j.jclinepi.2021.04.012
Keywords: obesity, stroke, risk factor, meta-analysis, metabolic health
Citation: Meng M, Guo Y, Kuang Z, Liu L, Cai Y and Ni X (2022) Risk of Stroke Among Different Metabolic Obesity Phenotypes: A Systematic Review and Meta-Analysis. Front. Cardiovasc. Med. 9:844550. doi: 10.3389/fcvm.2022.844550
Received: 28 December 2021; Accepted: 17 March 2022;
Published: 25 April 2022.
Edited by:
Konstantinos Tziomalos, Aristotle University of Thessaloniki, GreeceReviewed by:
João Botelho, Egas Moniz Interdisciplinary Research Center, PortugalYong-Jiang Li, Central South University, China
Yihun Mulugeta Alemu, Australian National University, Australia
Copyright © 2022 Meng, Guo, Kuang, Liu, Cai and Ni. This is an open-access article distributed under the terms of the Creative Commons Attribution License (CC BY). The use, distribution or reproduction in other forums is permitted, provided the original author(s) and the copyright owner(s) are credited and that the original publication in this journal is cited, in accordance with accepted academic practice. No use, distribution or reproduction is permitted which does not comply with these terms.
*Correspondence: Xiaojia Ni, Z3JhY2UxOTg0MzI1QDEyNi5jb20=