 Ruizhe Zhang
 Qingya Xie
 Pingxi Xiao
- 1Department of Cardiology, Sir Run Run, Hospital, Nanjing Medical University, Nanjing, China
- 2Department of Cardiology, The Forth Affiliated Hospital, Nanjing Medical University, Nanjing, China
Aims: This meta-analysis aimed to assess the association of the polymorphisms of cholesterol ester transfer protein (CETP) rs708272 (G>A), rs5882 (G>A), rs1800775 (C>A), rs4783961 (G>A), rs247616 (C>T), rs5883 (C>T), rs1800776 (C>A), and rs1532624 (C>A) with coronary artery disease (CAD) and the related underlying mechanisms.
Methods: A comprehensive search was performed using five databases such as PubMed, EMBASE, Web of Science, Cochrane Library and Scopus to obtain the appropriate articles. The quality of the included studies was assessed by the Newcastle-Ottawa Scale. The statistical analysis of the data was performed using STATA 17.0 software. The association between CETP gene polymorphisms and risk of CAD was estimated using the pooled odds ratio (OR) and 95% confidence interval (95% CI). The association of CETP gene polymorphisms with lipids and with CETP levels was assessed using the pooled standardized mean difference and corresponding 95% CI. P < 0.05 was considered statistically significant.
Results: A total of 70 case-control studies with 30,619 cases and 31,836 controls from 46 articles were included. The results showed the CETP rs708272 polymorphism was significantly associated with a reduced risk of CAD under the allele model (OR = 0.846, P < 0.001), the dominant model (OR = 0.838, P < 0.001) and the recessive model (OR = 0.758, P < 0.001). AA genotype and GA genotype corresponded to higher high-density lipoprotein cholesterol (HDL-C) concentrations in the blood compared with GG genotype across the studied groups (all P < 0.05). The CETP rs5882 and rs1800775 polymorphisms were not significantly associated with CAD under the allele model (P = 0.802, P = 0.392), the dominant model (P = 0.556, P = 0.183) and the recessive model (P = 0.429, P = 0.551). Similarly, the other mentioned gene polymorphisms were not significantly associated with CAD under the three genetic models.
Conclusions: The CETP rs708272 polymorphism shows a significant association with CAD, and the carriers of the allele A are associated with a lower risk of CAD and higher HDL-C concentrations in the blood compared to the non-carriers. The CETP rs5882, rs1800775, rs4783961, rs247616, rs5883, rs1800776, and rs1532624 are not significantly associated with CAD.
Systematic Review Registration: https://www.crd.york.ac.uk/prospero/display_record.php?ID=CRD42023432865, identifier: CRD42023432865.
Introduction
Characterized by the narrowing of coronary arteries, coronary artery disease (CAD) is the leading cause of morbidity and mortality worldwide (1). The etiology and progression of CAD involve complex interactions between genetic and environmental factors (2), the latter includes age, gender, hypertension, smoking, and dyslipidemia (3). Dyslipidemia refers to lipid abnormalities that include high levels of low-density lipoprotein cholesterol (LDL-C), triglycerides (TG) and total cholesterol (TC), as well as low levels of high-density lipoprotein cholesterol (HDL-C). Substantial advances in understanding the genetic basis of dyslipidemia have recently suggested that the cholesteryl ester transfer protein (CETP) is involved in the pathogenesis of CAD (4). CETP is a plasma glycoprotein that facilitates the exchange of triglycerides for cholesterol ester from HDL to apolipoprotein B-containing lipoproteins, reducing the concentration of HDL-C (5). CETP is encoded by the homonymous gene on chromosome 16q13, and its polymorphisms influence protein activity and plasma lipid profiles, thus affecting CAD development and progression (6). Many studies evaluated the association between the polymorphisms of the CETP gene and the risk of CAD to find the underlying mechanisms and potential clinical implications. Most of the studies focused on three polymorphisms in the CETP gene, such as rs708272, rs5882, and rs180075. The first (also known as TaqIB) is one of the most common polymorphisms, consisting of a G-to-A substitution in the 279th nucleotide in the first intron of the gene (7). The second polymorphism is characterized by a single nucleotide polymorphism (SNP) that leads to the substitution of an isoleucine (I) with a valine (V) at the position 405 of the CETP protein sequence (8). The third polymorphism is characterized by an SNP at position 629 of the CETP gene, which results in the substitution of C-to-A (9). Although a review already in 2008 reported that CETP rs708272, rs5882, and rs180075 polymorphisms are significantly associated with the CAD risk (10), some recent studies published contradictory results. This meta-analysis aims to assess the association between CAD and common CETP gene polymorphisms represented by three SNPs (rs708272, rs5882, rs1800775), as well as five uncommon SNPs (rs4783961, rs247616, rs5883, rs1800776, rs1532624). Figure 1 illustrates the CETP gene structure and mutation locations.

Figure 1. The structure of the CETP gene and the location of the mutations.
Methods
This meta-analysis was performed in accordance with the guidelines outlined by the statement of the Preferred Reporting Items for Systematic Reviews and Meta-analyses (PRISMA) (11).
Search strategy
We conducted a comprehensive search using the following databases: PubMed, EMBASE, Web of Science, Cochrane Library, and Scopus. The search spanned from January 1, 1988, to May 9, 2023. We used a comprehensive search strategy with the following keywords: “Cholesterol Ester Transfer Protein” or “CETP” and “Myocardial Infarction” or “Cardiovascular Stroke” or “Heart Attack” or “Coronary Disease” or “CAD” or “CHD” and “Polymorphism, Single Nucleotide” or “SNP” or “Genotype” or “mutant” or “variant”.
Inclusion and exclusion criteria
Clinical case-control studies that assessed the associations between CETP gene polymorphisms and CAD were included if they provided sufficient information on genotype counts for CAD patients and controls, allowing us to calculate the odds ratio (OR) and 95% confidence interval (95% CI). Additionally, all cases had to meet the diagnostic criteria for CAD.
We excluded duplicates, as well as articles related to animal experiments, reviews, meta-analyses, case reports, meeting abstracts, letters, and editorial comments. Non-English-language publications and those with insufficient statistical results were also excluded.
Data extraction and quality assessment
Two investigators, Ruizhe Zhang and Qingya Xie, independently extracted data from eligible articles using a standardized procedure that adhered to the inclusion and exclusion criteria. Any disagreements were resolved through discussion to achieve consensus. Data extracted from the articles included first authors' names, publication years, study population countries and ethnicities, diagnostic criteria (coronary stenosis or myocardial infarction), genotyping methods, case/control sources, age distributions of cases/controls, gender distributions of cases/controls, sample sizes of cases/controls, genotype counts in cases/controls, and p-values for Hardy-Weinberg Equilibrium (HWE). Additionally, if available, data on the associations of CETP gene polymorphisms with serum lipid concentrations and CETP levels, as well as mean and standard deviation values for CETP level, HDL-C, LDL-C, TG, and TC concentrations across genotypes, were extracted to elucidate underlying mechanisms.
The Newcastle-Ottawa Scale (NOS) was used to assess the quality of included studies. The NOS evaluation covered three aspects: selection (0–4), comparability (0–2), and outcome (0–3), with a total possible score ranging from 0 to 9 (12).
Statistical analysis
Statistical analysis was performed using the STATA software (Version 17.0, Stata Corporation, College Station, TX, USA). We estimated the association between CETP gene polymorphisms and CAD risk using the pooled OR and its 95% CI under three genetic models: the allele model (M vs. W), the dominant model (MM + MW vs. WW), and the recessive model (MM vs. WW + MW), where W represents the wild allele, M represents the mutant allele, WW stands for wild homozygote, WM for heterozygote, and MM for mutant homozygote. We assessed the association of CETP gene polymorphisms with lipid serum concentrations and CETP levels using the pooled standardized mean difference (SMD) and its corresponding 95% CI under two models: the homozygote model (MM vs. WW) and the heterozygote model (MW vs. WW). The statistical significance of the pooled OR and pooled SMD was evaluated using the Z test. The significant threshold P < 0.05 was selected. Cochran's Q-statistic and I2 tests were used to assess potential heterogeneity among the included studies. If the Q-test resulted in a P < 0.05 or I2 > 50% indicating a significant heterogeneity, we employed a random-effects model. Otherwise, a fixed-effects model was used (13). The genotype count in the control was measured for HWE using a chi-square test. Sensitivity analysis was performed to assess the impact of individual studies on the overall pooled OR and SMD by sequentially excluding one study at a time and examining the effect. We conducted sensitivity analysis by systematically excluding one study at a time and examining its impact on the overall pooled OR and SMD. To evaluate publication bias, we used funnel plots, Begg's test, and Egger's test (14). A significance threshold of P < 0.05 was selected for determining the statistical significance of Begg's test and Egger's test. Additionally, we applied the trim-and-fill method to estimate the potential number of missing studies and their outcomes, which could contribute to publication bias.
Results
Flowchart and initial selection
Figure 2 shows the flowchart of the details of the selection procedure. Initially, 908 articles were collected from five databases. A total of 763 publications were excluded based on their titles and abstracts, the full texts were evaluated, and additional 99 articles were removed. Finally, 46 articles meeting the inclusion criteria were included (15–60).
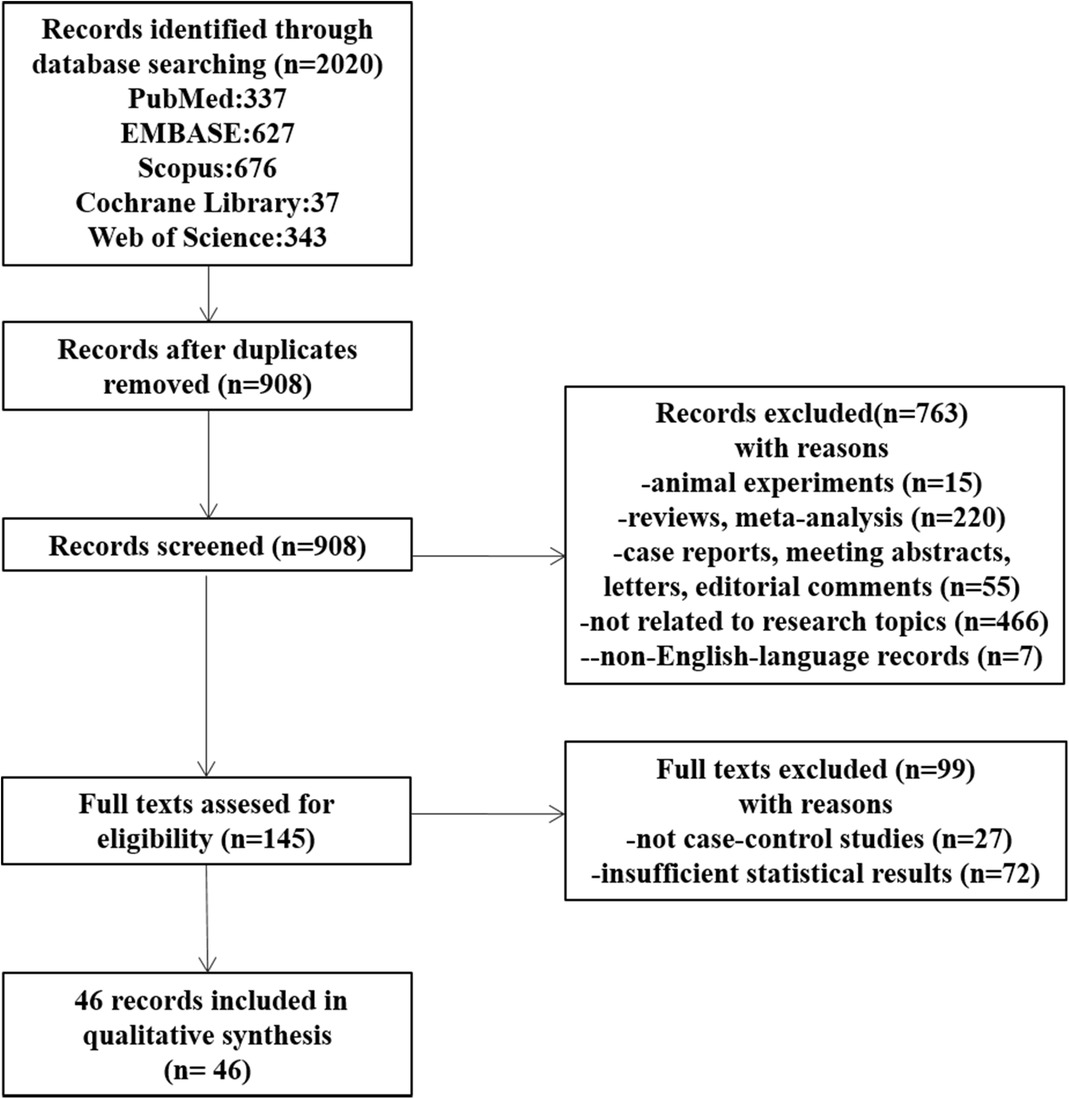
Figure 2. The flowchart shows the procedure for selecting studies.
Characteristics of included studies
Seventy case-control studies, meeting the inclusion criteria, were included in this meta-analysis, comprising a total of 30,619 cases and 31,836 controls from 46 articles. The main characteristics of the selected studies and the genotypic distributions of CETP gene polymorphisms are shown in Tables 1, 2.
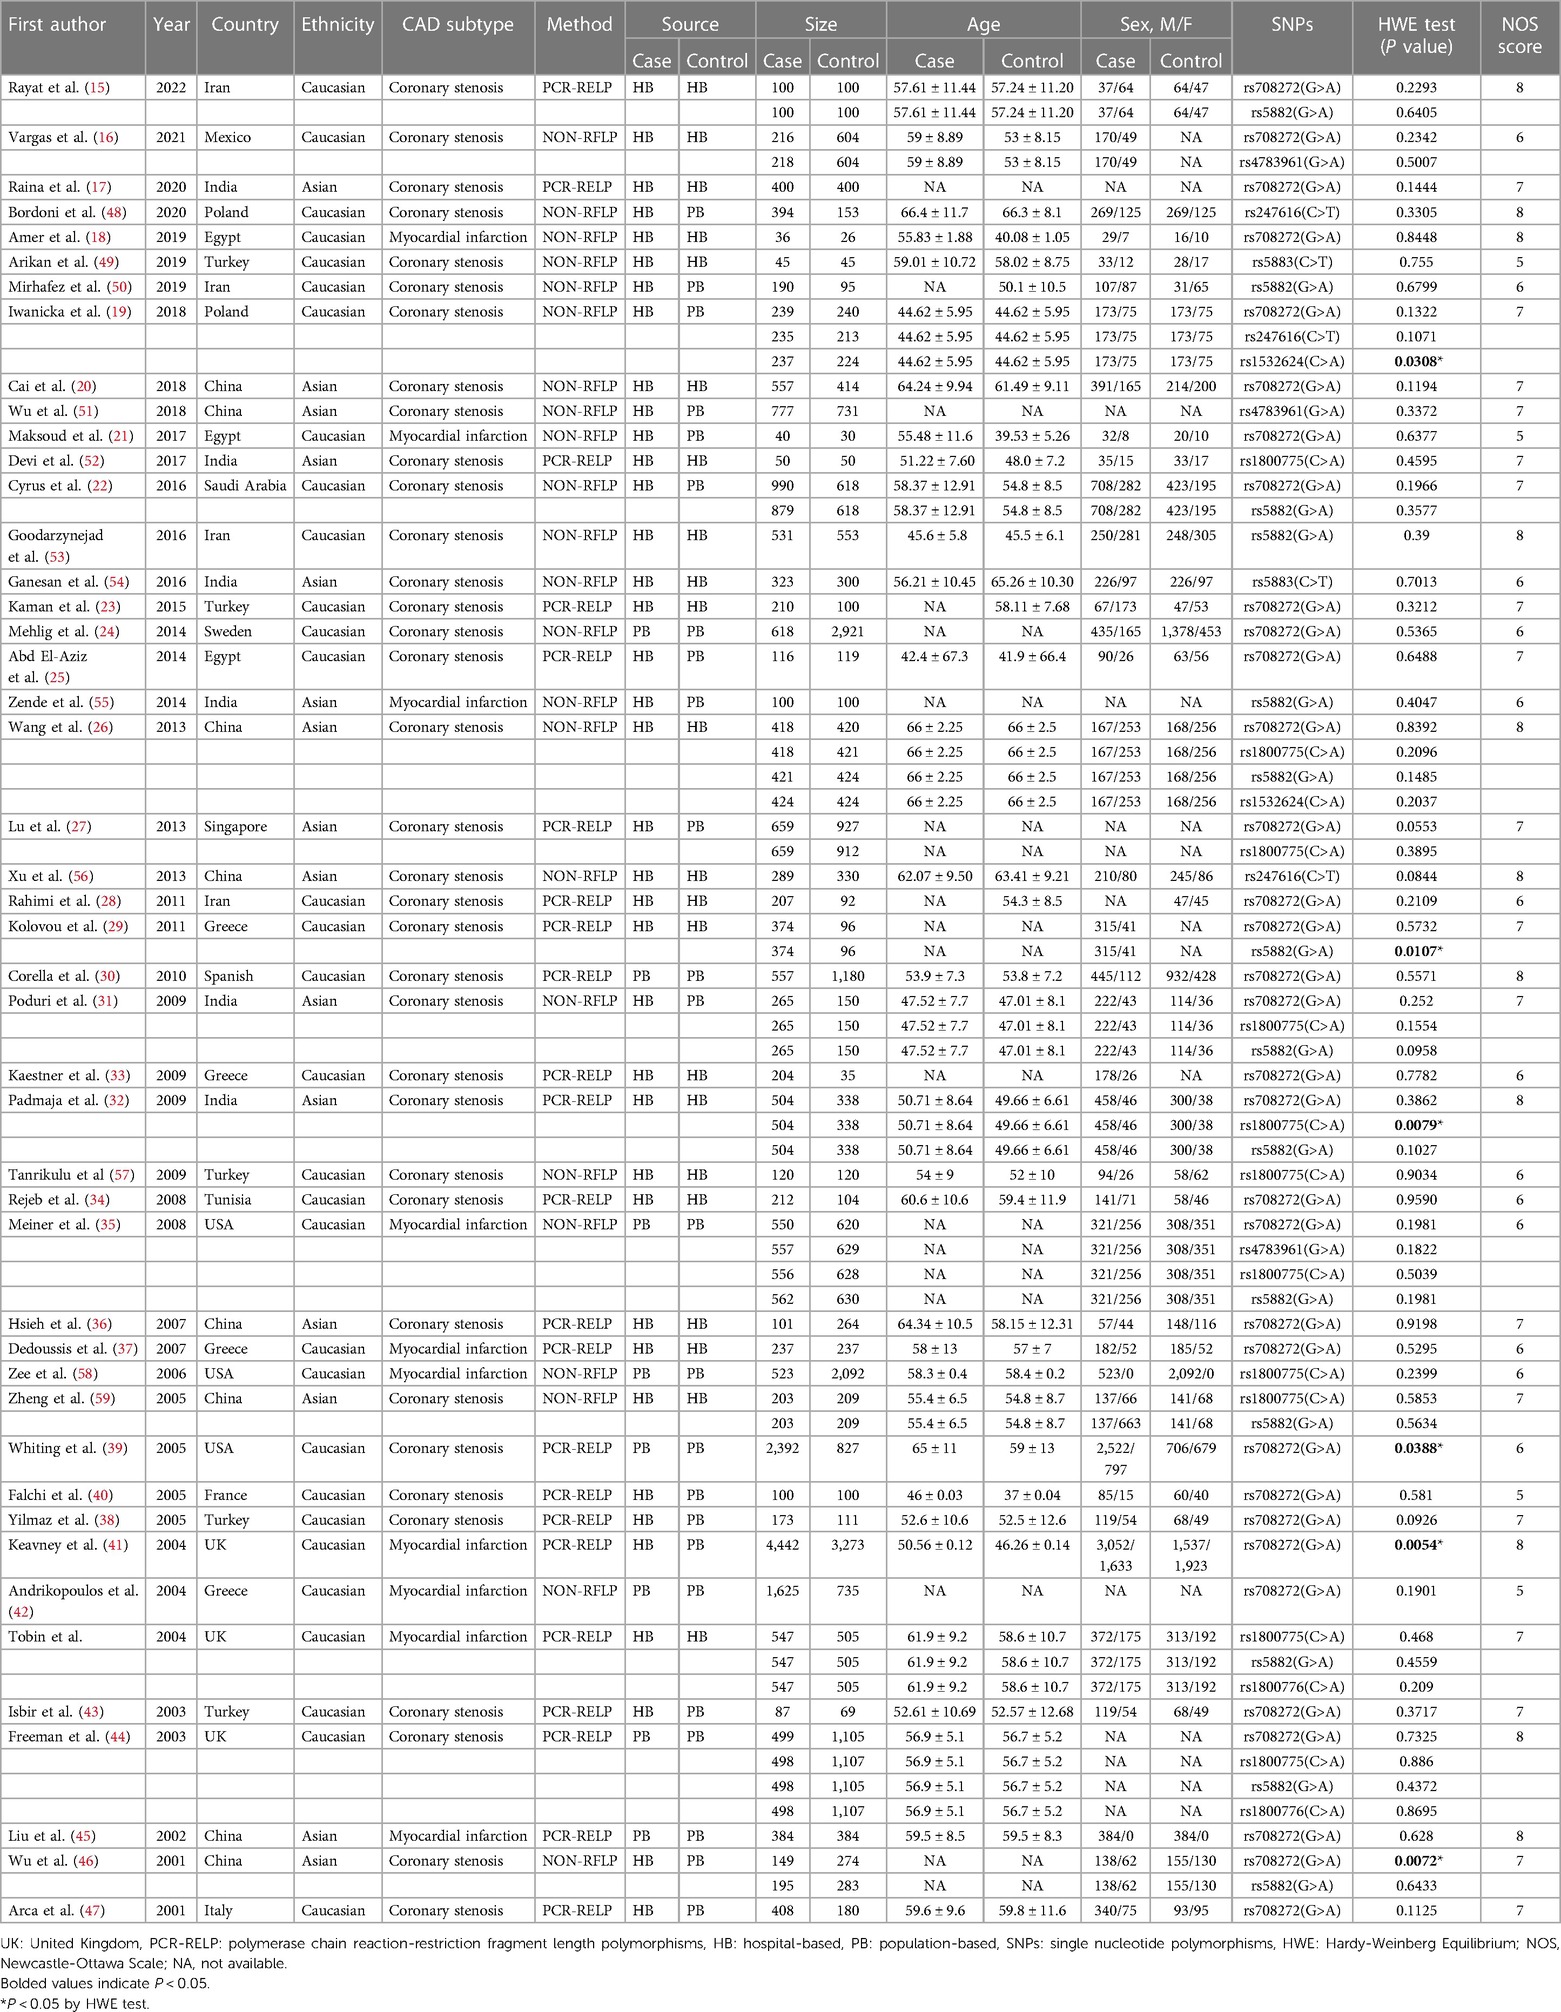
Table 1. Main characteristics of the selected studies of CETP gene polymorphisms.
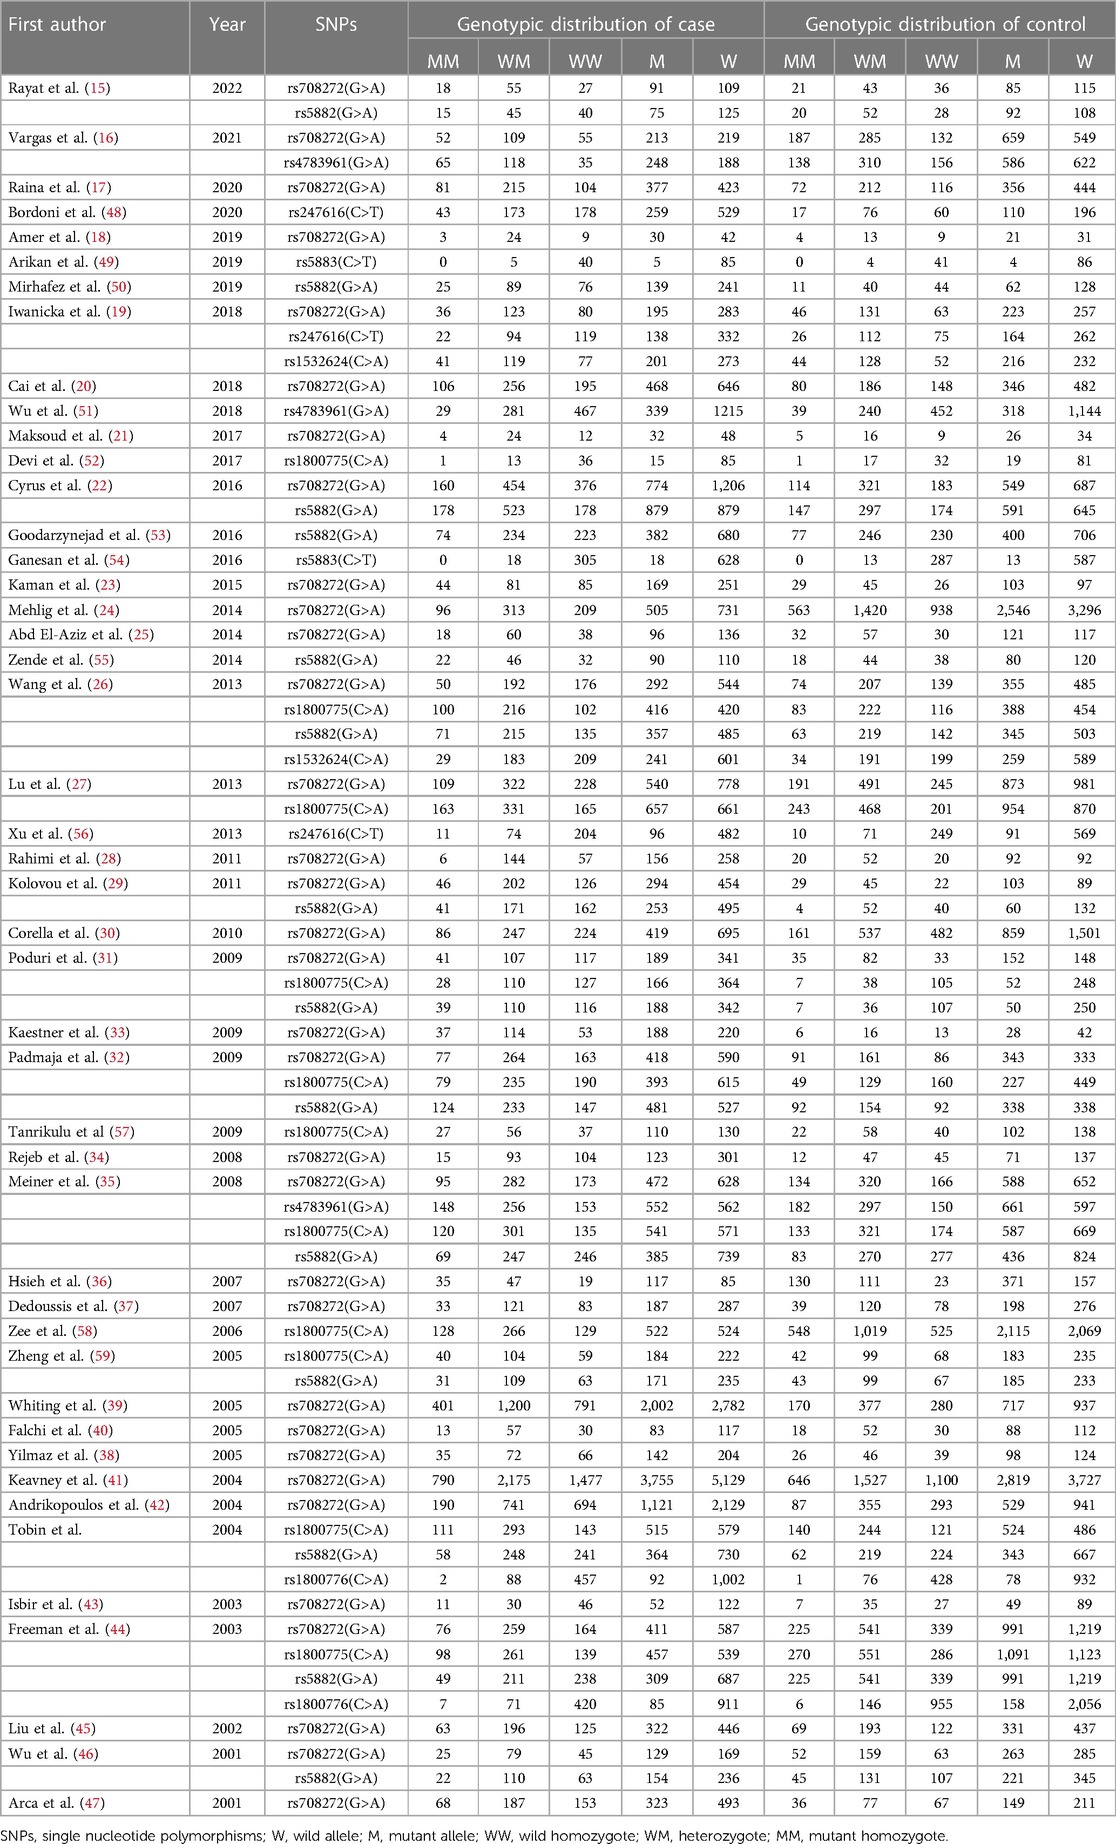
Table 2. The genotypic distributions of CETP gene polymorphisms.
Among these eligible studies, 33 involved the relationship between CETP rs708272 polymorphisms and CAD (15–47). Other 37 studied five other polymorphisms in the CETP gene, and 14 of them focused on rs5882 (15, 22, 26, 29, 31, 32, 35, 44, 46, 50, 53, 55, 59, 60), 11 on rs1800775 (26, 27, 31, 32, 35, 44, 52, 57–60)3 on rs4783961 (16, 35, 51), 3 on rs247616 (19, 48, 56), 2 on rs5883 (49, 54), 2 on rs1800776 (44, 60), and 2 on rs1532624 (19, 26). In addition, 6 studies deviated from HWE (19, 30, 32, 39, 41, 46). Among all 46 articles, 10 mentioned information on lipid serum concentrations including HDL-C, LDL-C, TG and TC for rs708272 (19–21, 23, 25, 26, 30, 31, 38, 44). One article was on the association between CETP rs708272 polymorphism and CETP level (23).
Study populations and diagnostic criteria
Thirty-one articles mentioned studies performed among Caucasians (15, 16, 18, 19, 21–25, 28–30, 33–35, 37–44, 48–50, 53, 57, 58, 60), and 15 among Asians (17, 20, 26, 27, 31, 32, 36, 45, 46, 51, 52, 54–56, 59).
Thirty-six articles involved cases with coronary stenosis (15–17, 19, 20, 22–34, 36, 38–40, 43, 44, 46–54, 56, 57, 59), and 10 involved cases with myocardial infarction (18, 21, 35, 37, 41, 42, 45, 55, 58, 60).
Genotyping methods
Genotyping methods varied among the included studies. Polymerase chain reaction-restriction fragment length polymorphisms (PCR-RFLP) is a molecular biology technology that analyzes genetic polymorphisms and sequence variations in DNA samples by combining the strength of PCR amplification with the precision of restriction enzyme cleavage. It offers relatively high resolution. NON-RFLP techniques employ methods that do not depend on restriction enzyme cleavage, such as TaqMan PCR, ARMS-PCR, MassARRAY and other approaches. Its resolution and specificity depend on the chosen approach. Twenty-three articles performed the genotyping using PCR-RELP (16, 18–22, 24, 26, 31, 35, 42, 46, 48–51, 53–59), and 23 used other methods (NON-RELP) (15, 17, 23, 25, 27–30, 32–34, 36–41, 43–45, 47, 52, 60).
Control types and sample sizes
Control types and sample sizes varied across the studies.
Hospital-based (HB) control was used in 22 articles (15–18, 20, 23, 26, 28, 29, 32–34, 36, 37, 49, 52–54, 56, 57, 59, 60), and population-based (PB) control was used in 24 articles (19, 21, 22, 24, 25, 27, 30, 31, 35, 38–48, 50, 51, 55, 58).
Fourteen articles used a sample size of coronary cases ≥500 (20, 22, 24, 27, 30, 32, 35, 39, 41, 42, 51, 53, 58, 60), while 32 had used a sample size of coronary cases <500 (15–19, 21, 23, 25, 26, 28, 29, 31, 33, 34, 36–38, 40, 43–50, 52, 54–57, 59). Fourteen articles used a sample size of the controls ≥500 (16, 22, 24, 27, 30, 35, 39, 41, 42, 44, 51, 53, 58, 60), while 32 used a sample size of the controls <500 (15, 17–21, 23, 25, 26, 28, 29, 31–34, 36–38, 40, 43, 45–50, 52, 54–57, 59).
Gender and age
Gender and age are known to be influential factors in the association between SNPs and the occurrence of CAD. Gender ratio and mean age varied across the studies.
There were 35 articles where man predominated in the case groups (16, 18–22, 24, 25, 29–41, 43, 45–50, 52, 54, 56–60), 4 articles where women did (15, 23, 26, 53), and 7 articles with insufficient information on the gender distribution in the case groups (17, 27, 28, 42, 44, 51, 55). There were 29 articles where men predominated in the control groups (18–22, 24, 25, 30–32, 34–40, 43, 45–49, 52, 54, 58–60), 8 articles where women did (23, 26, 35, 41, 47, 50, 53, 57), and 9 articles with insufficient information on the gender distribution in the control groups (16, 17, 27, 29, 33, 42, 44, 51, 55).
There were 21 articles with a mean age of the cases greater than or equal to 55 years (15, 16, 18, 20–22, 26, 34, 36, 37, 39, 44, 45, 47–49, 54, 56, 58–60), 12 articles with a mean age of cases less than 55 years (19, 25, 30–33, 38, 40, 43, 52, 53, 57), and 13 articles lacking sufficient information on the age distributions of cases (17, 23, 24, 27–29, 33, 35, 42, 46, 50, 51, 55). There were 17 articles with a mean age of controls greater than or equal to 55 years (15, 20, 23, 26, 34, 36, 37, 39, 44, 45, 47–49, 54, 56, 58, 60), 19 articles with a mean age of the controls less than 55 years (16, 18, 19, 21, 22, 25, 28, 30–32, 38, 40, 41, 43, 50, 52, 53, 57, 59), and 10 articles lacking sufficient information on the age distributions of controls (17, 24, 27, 29, 33, 35, 42, 46, 51, 55).
The NOS scores of the included articles were ≥5 and the average was 6.8.
Association of the three common CETP gene polymorphisms with CAD
The details of the overall and subgroup analyses of the association of the CETP rs708272, rs5882 and rs180075 polymorphisms with CAD are listed in Table 3.
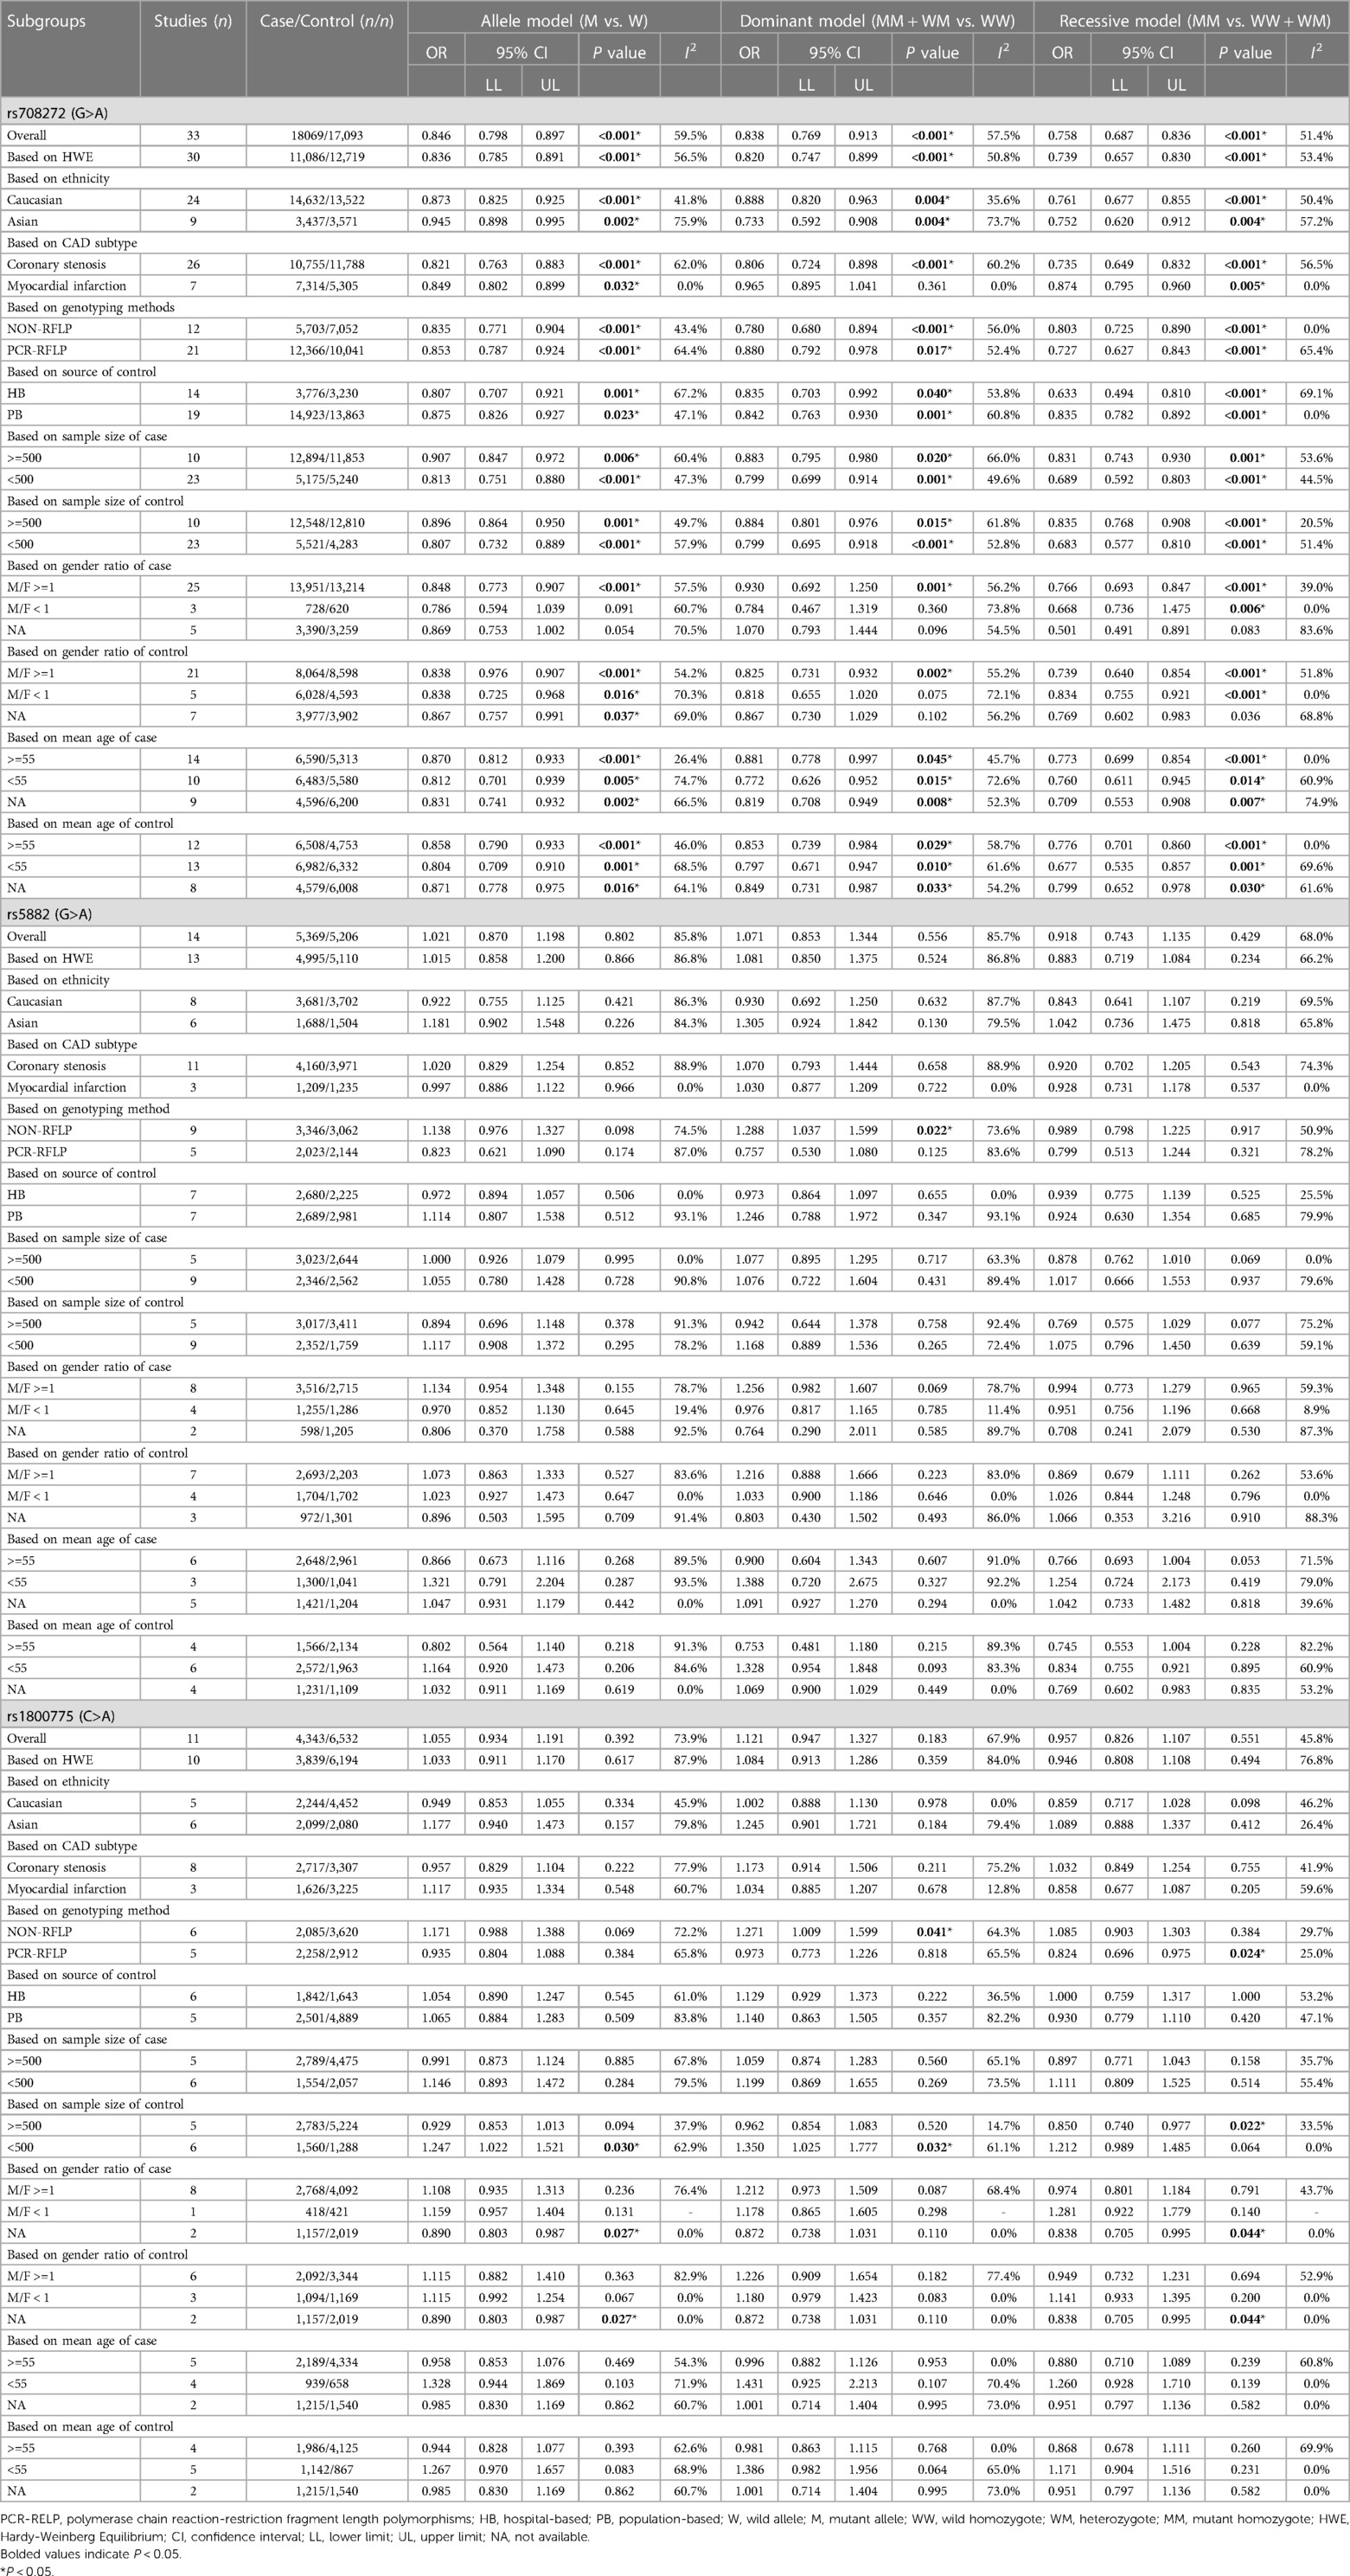
Table 3. Overall and subgroup analysis of the association of the CETP rs708272, rs5882 and rs180075 polymorphisms with CAD.
The overall analyses of all the 33 studies on rs708272 indicated that the carriers of the allele A were significantly associated with a reduced risk of CAD than the non-carriers under the allele model (OR = 0.846, 95% CI = 0.798–0.897, P < 0.001) (Figure 3), the dominant model (OR=0.838, 95% CI = 0.769–0.913, P < 0.001) and the recessive model (OR=0.758, 95% CI = 0.687–0.836, P < 0.001). Since a moderate heterogeneity was observed under the allele model (I2 = 59.5%, P < 0.001), the dominant model (I2 = 57.5%, P < 0.001), and the recessive model (I2 = 51.4%, P < 0.001), the random effects model was used.
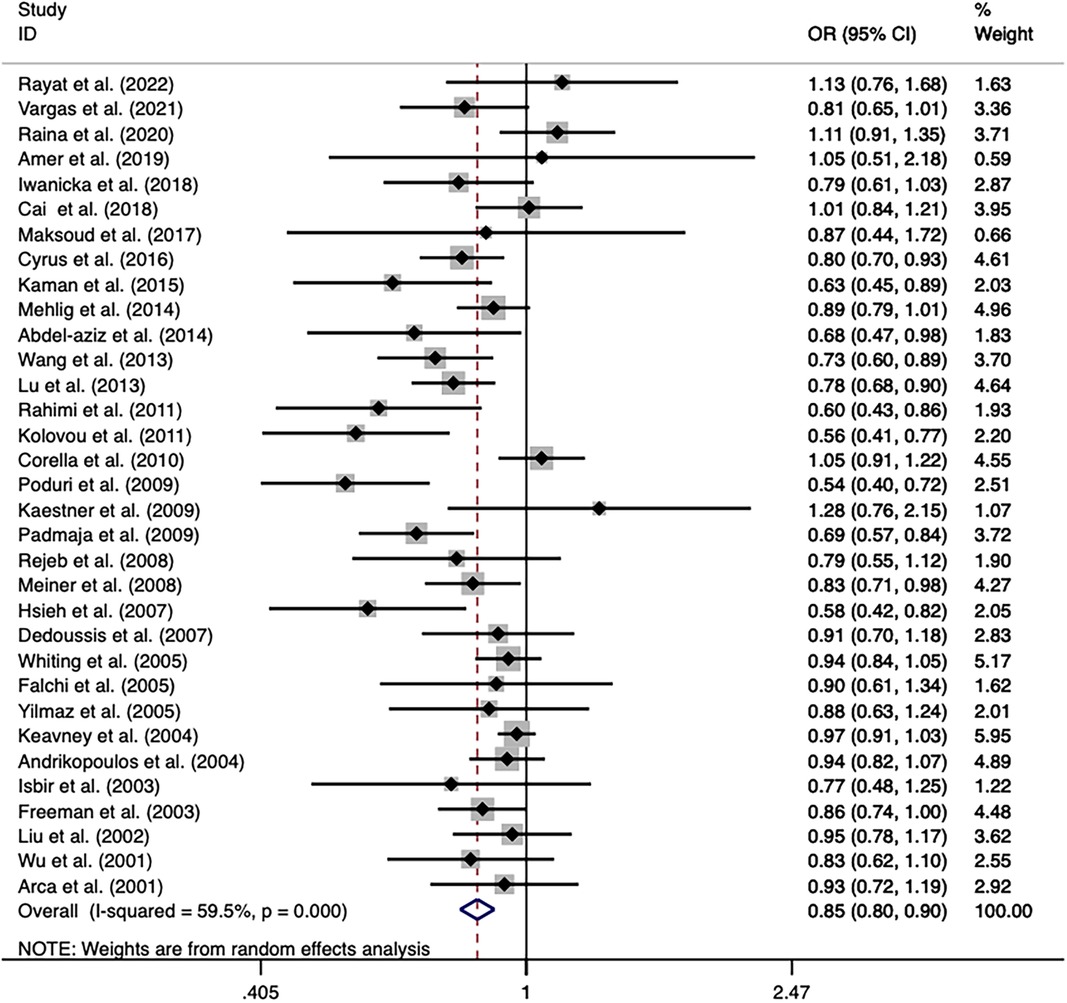
Figure 3. Forest plot of the meta-analysis between the CETP rs708272 polymorphism and CAD under the allele model (Avs.G).
After the exclusion of the studies deviating from HWE in the control, the statistical significance of the analysis did not substantially change. Subgroup analysis based on ethnicity identified a significance of association of the CETP rs708272 polymorphism with CAD both in Caucasians and Asians. The allele rs708272-A based on CAD subtypes significantly reduced the risk of myocardial infarction under the allele model (OR=0.849, P = 0.032) and recessive model (OR = 0.874, P = 0.005), but not under the dominant model (OR = 0.965, P = 0.361). Substantial heterogeneity in the coronary stenosis subgroup under the three genetic models (I2 = 62.0%, I2 = 60.2%, I2 = 56.5%) was not observed in the myocardial infarction subgroup (I2 = 0.0% for all). Table 3 also shows significant associations in NON-RFLP, RFLP, HB, and PB subgroups (all P < 0.05). Based on the patient sample size, the risk estimation in studies with large samples (size ≥ 500) appeared relatively conserved under the allele model (OR = 0.907, P = 0.006), dominant model (OR = 0.883, P = 0.02) and recessive model (OR = 0.831, P = 0.001), while the risk estimation in studies with small samples (size < 500) was slightly overestimated. Based on the size of the control, the heterogeneity of both studies with large samples (size ≥ 500) and small samples (size < 500) decreased under the allele model (I2 = 49.7%, I2 = 57.9%) and dominant model (I2 = 20.5%, I2 = 51.4%), suggesting that the heterogeneity might originate from this factor. Based on the gender ratio, the CETP rs708272 polymorphism was found to have a significant association with CAD under the three genetic models (all P < 0.05) in the cases and controls where males constituted the majority. However, in the cases where females predominated, this SNP was not significantly associated with CAD under the allele model (OR = 0.786, P = 0.091), dominant model (OR = 0.784, P = 0.360), or recessive model (OR = 0.668, P = 0.006). This non-association was also found in the female-dominated controls under the dominant model (OR = 0.818 P = 0.075). Based on the mean age of cases/controls, the significant association of this SNP with CAD was observed in all age groups under the three genetic model (all P < 0.05), and this finding was consistent with the overall analysis.
The overall analysis indicated that the CETP rs5882 and rs180075 polymorphisms were not significantly associated with CAD under the allele model (OR = 0.846, P < 0.001), dominant model (OR = 0.838, P < 0.001) and recessive model (OR = 0.758, P < 0.001) (Figures 4, 5), accompanied by a significant heterogeneity. This result contradicted the 2008 review mentioned earlier, which suggested that these two SNPs were associated with CAD.
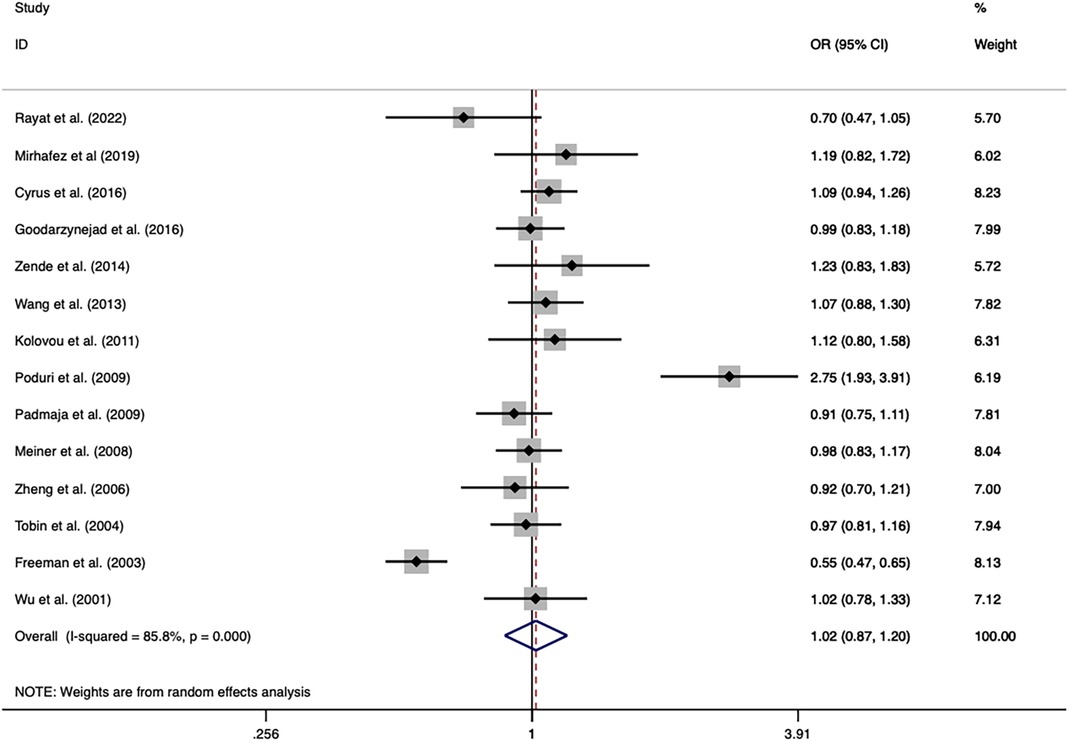
Figure 4. Forest plot of the meta-analysis between the CETP rs5882 polymorphism and CAD under the allele model (Avs.G).
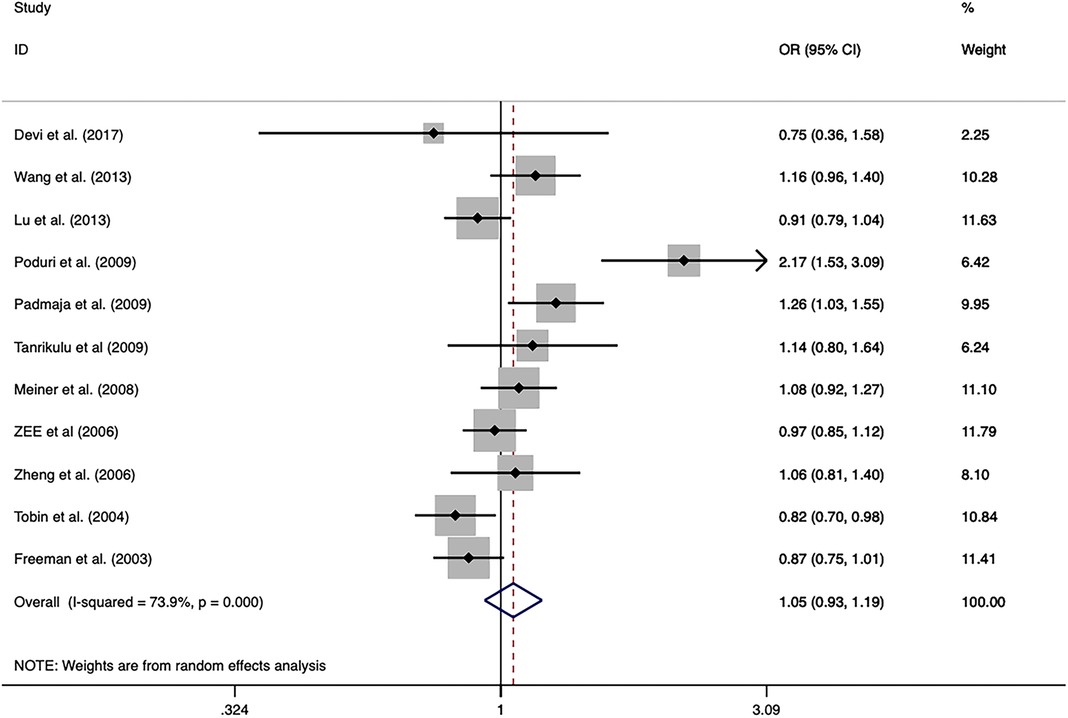
Figure 5. Forest plot of the meta-analysis between the CETP rs1800775 polymorphism and CAD under the allele model (Avs.C).
The exclusion of the studies with deviations from HWE in the control group did not substantially alter the statistical significance of the analysis. The subgroup analysis on the rs5882 polymorphism suggested that it was associated with an increased risk of CAD under the dominant model (OR = 1.288, 95% CI = 1.037–1.599, P = 0.022) in the NON-RFLP subgroup. However, all the other subgroups except this one showed that the CETP rs5882 polymorphism was not significantly associated with CAD under the three genetic models. According to genotyping methods, the CETP rs180075 polymorphism was associated with an increased risk of CAD under the dominant model (OR = 1.271, 95% CI = 1.009–1.599, P = 0.041) in the NON-RFLP subgroup, with reduced risk of CAD under the recessive model (OR = 0.824, 95% CI = 0.696–0.975, P = 0.024) in the PCR-RFLP subgroup. According to the sample size of the control, the CETP rs180075 polymorphism was associated with an increased risk of CAD under the allele model (OR = 1.247, 95% CI = 1.022–1.521, P = 0.03) and the dominant model (OR=1.35, 95% CI = 1.025–1.777, P = 0.032) in studies using small samples (size < 500). On the contrary, the CETP rs180075 polymorphism was associated with a reduced risk of CAD under the recessive model (OR = 0.85, 95% CI = 0.74–0.977, P = 0.022) in studies using large samples (size ≥ 500). The heterogeneity decreased in studies with both large samples (size ≥ 500) and small samples (size < 500) under the three genetic models, suggesting that the heterogeneity might be attributed to variations in sample size.
Association of the five uncommon CETP gene polymorphisms with CAD
Table 4 shows no significant associations of CETP rs4783961, rs247616, rs5883, rs1800776, and rs1532624 polymorphisms with CAD under the three genetic models. The results might be more susceptible to random factors due to the limited sample size, which might contribute to an increased heterogeneity. Subgroup analysis was not performed due to the lack of a sufficient number of studies.
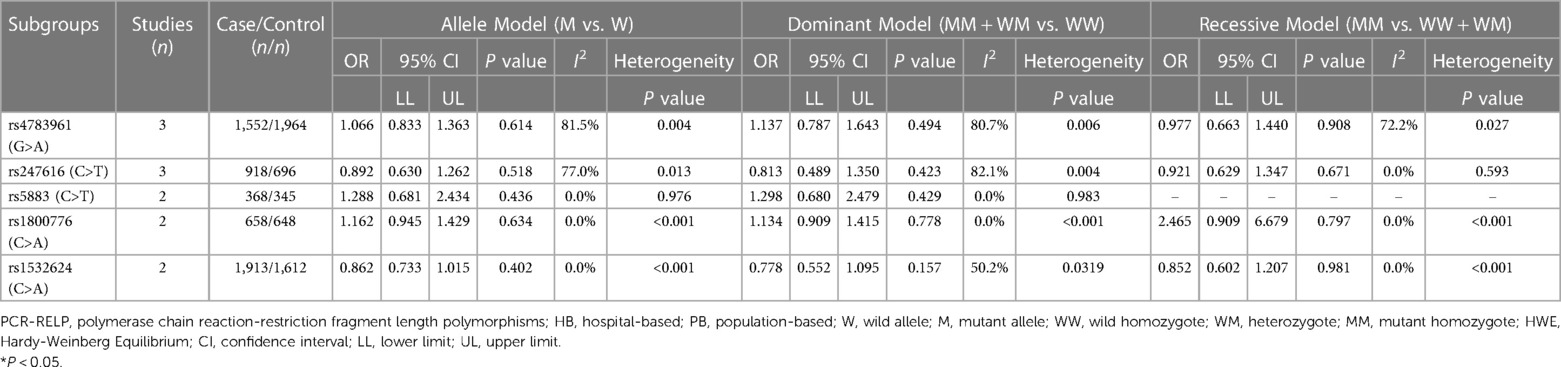
Table 4. Overall analyses of the association of the three uncommon CETP gene polymorphisms with CAD.
Association of the CETP rs708272 polymorphism with CETP level and lipid serum concentrations
A meta-analysis was performed after the extraction of the data of CETP and lipid levels to find the association. Table 5 shows which information should be extracted using HDL-C as an example. Table 6 shows the association of the CETP rs708272 polymorphism with CETP level and HDL-C, LDL-C, TG, and TC concentrations in the patients, control, and all subjects under the homozygote model and the heterozygote model. AA genotype had higher HDL-C concentrations compared with the GG genotype in the case group (SMD = 0.459, P < 0.001) and control group (SMD = 0.279, P < 0.001) without significant heterogeneity (I2 = 0.0%, I2 = 40.6%) (Figure 6). Similarly, the GA genotype had higher HDL-C concentrations than the GG genotype in the patient group (SMD = 0.216, P < 0.001) and control group (SMD = 0.197, P < 0.001) without significant heterogeneity (I2 = 20.6%, I2 = 0.0%). The overall analysis indicated that the AA genotype and GA genotype were statistically significant compared with the GG genotype, with considerable heterogeneity (I2 = 83.0%, I2 = 74.0%) which might result from the types of groups. In conclusion, the carriers of allele A had higher HDL-C concentrations than the non-carriers. HDL particles play a pivotal role in removing excess cholesterol from peripheral tissues, reducing inflammation, protecting the endothelium, and preventing oxidative damage—all of which contribute to their anti-atherogenic properties. Higher levels of HDL in the blood are generally associated with a lower risk of atherosclerosis and cardiovascular disease. No significant correlation was found between the CETP rs708272 polymorphism and TC, TG, and LDL-C across the studied groups under two genetic models.
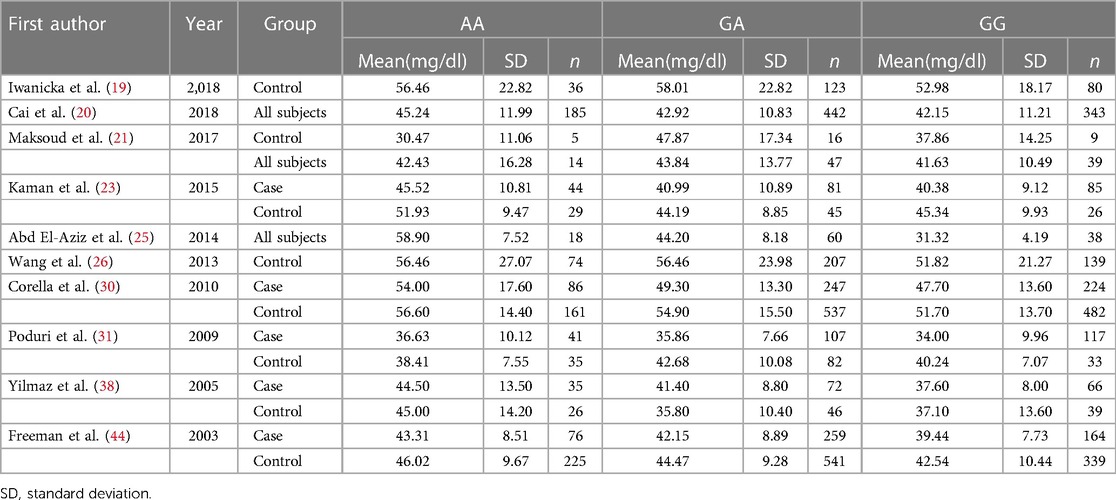
Table 5. Selected studies including the data of the HDL-C concentrations across the CETP rs708272 polymorphism genotypes.
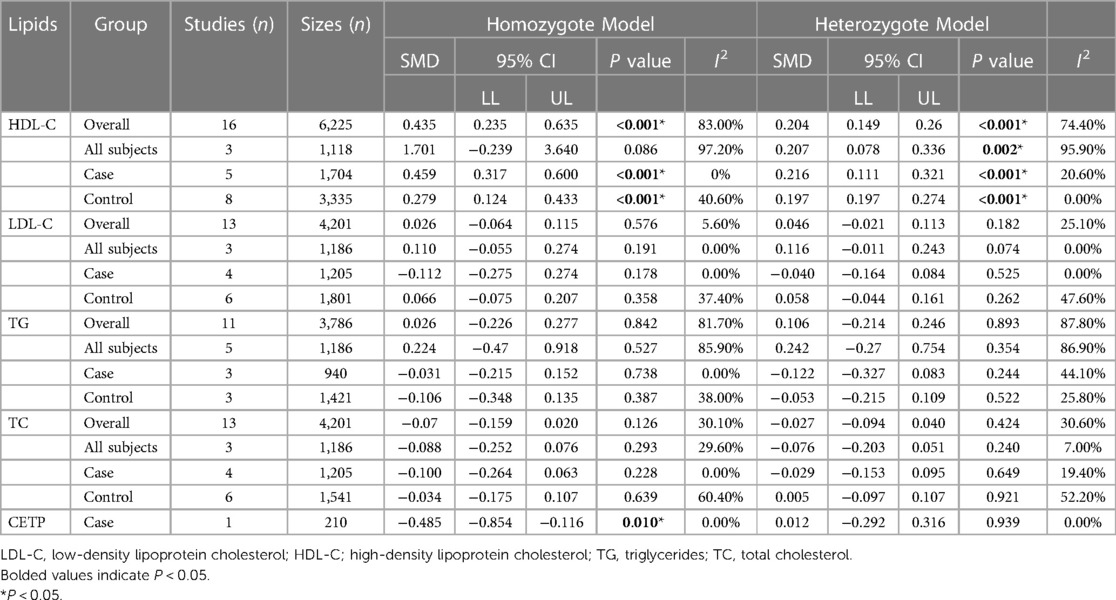
Table 6. Overall and subgroup analyses of the association of the CETP rs708272 polymorphisms with CETP and lipids levels.
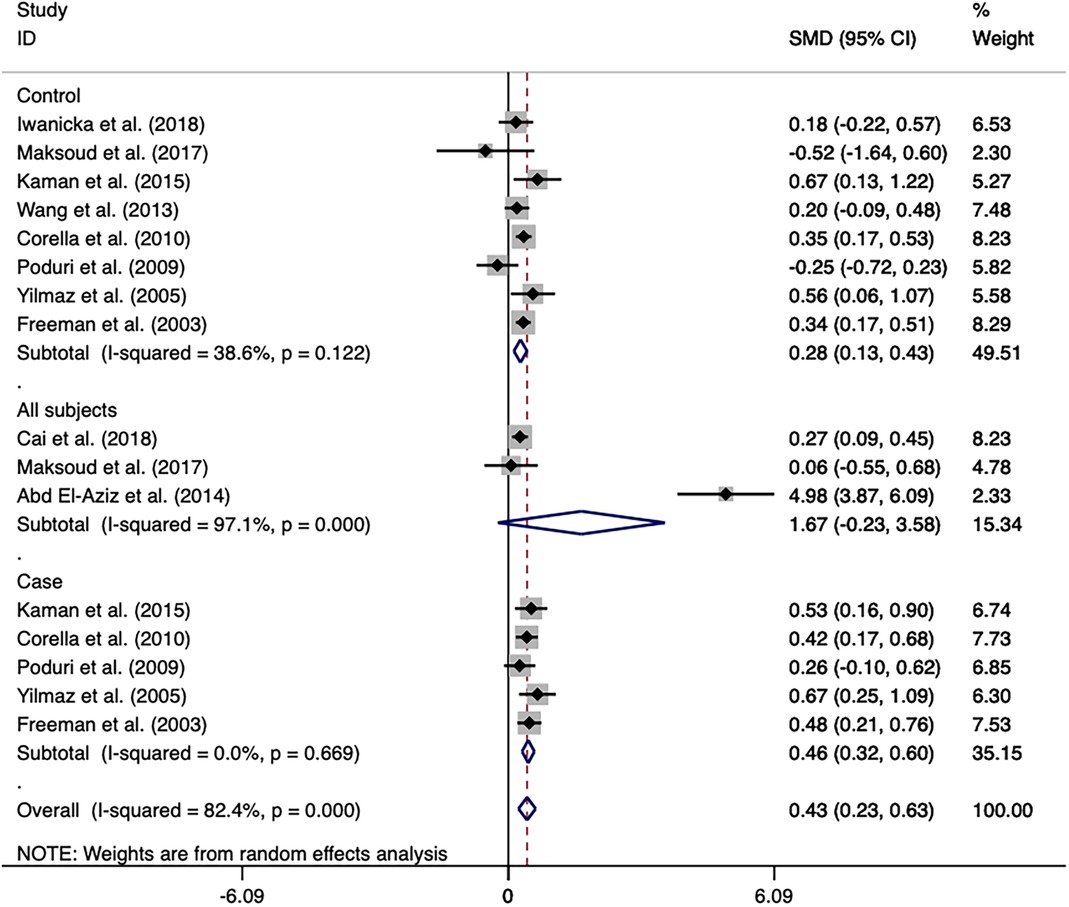
Figure 6. Forest plot of the meta-analysis between the CETP rs708272 polymorphism and HDL-C concentrations under the homozygote model (AAvs.GG).
In the patient group, the AA genotype had a lower CETP level (SMD = −0.485, P = 0.010) compared with the GG genotype. However, this conclusion is not reliable due to the limited sample size and the presence of only one study.
Meta-regression analysis
The subgroup analysis of rs708272 and rs1800775 indicated that the heterogeneity might be due to the sample size which was equivalent to the sum of each genotype count. Univariate and multivariate meta-regression analyses, including three types of genotype counts of case/control, were conducted to find potential sources of heterogeneity in the studies on the association of CETP gene polymorphism with CAD. As regards rs708272, the heterogeneity could be explained by GG genotype counts of the patients and AA and GG genotype counts of the control under the allele model (P = 0.027, P = 0.004, P = 0.041). AA and GA genotype counts of the patients and AG genotype counts of the control could explain the source of heterogeneity under the recessive model (P = 0.002, P = 0.001, P = 0.002). AA and GA genotype counts of the case/control could explain the source of heterogeneity under the dominant model (P = 0.003, P = 0.025, P = 0.001, P = 0.049). As regards rs5882, the heterogeneity could be explained by the GG genotype counts of the control under the allele model (P = 0.012). The meta-regression analysis failed to find the source of heterogeneity under the dominant model and the recessive model. As regards rs1800775, the source of heterogeneity was explained by the AA and CA genotype counts of the patients under the recessive model (P = 0.007, P = 0.019). The source of heterogeneity was explained by the AA and CA genotype counts of the patients and CC genotype counts of the control under the allele model (P = 0.008, P = 0.032, P = 0.010). The source of heterogeneity was explained by the CC genotype counts of the control under the allele model (P = 0.008).
Sensitivity analysis and publication bias
The sensitivity analysis of the association between the CETP gene polymorphism and CAD indicated that no single study affected the overall OR and the statistical significance under the three genetic models. As regards the rs708272 polymorphism, the funnel plot showed an imbalance between the number of data points on the left and right sides, resulting in an asymmetrical appearance (Figure 7). The Egger's test confirmed a remarkable publication bias under the allele model (P = 0.014), dominant model (P = 0.035), and recessive model (P = 0.02). The Begg's test did not detect any publication bias. The trim-and-fill method did not trim any studies for imputation. The Egger's test revealed the disappearance of publication bias under the allele model (P = 0.190) and the dominant model (P = 0.504), but not under the recessive model (P = 0.045) after excluding studies with significant departure from HWE. As regards the rs5882 polymorphism and rs1800775 polymorphism, the shapes of the funnel plots did not show any evident asymmetry (Figures 8, 9). Egger's test confirmed no publication bias under the allele model (P = 0.191, P = 0.173), the dominant model (P = 0.298, P = 0.400), and the recessive model (P = 0.097, P = 0.138).
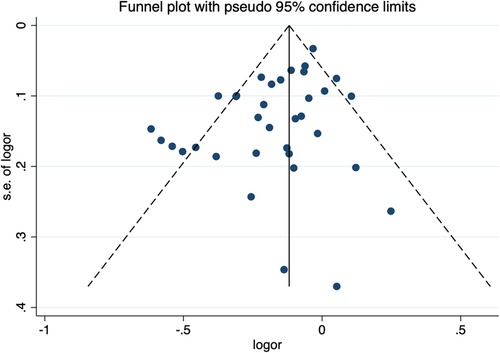
Figure 7. Funnel plot of the meta-analysis between the CETP rs708272 polymorphism and CAD under the allele model (Avs.G).

Figure 8. Funnel plot of the meta-analysis between the CETP rs5882 polymorphisms and CAD under the allele model (Avs.G).
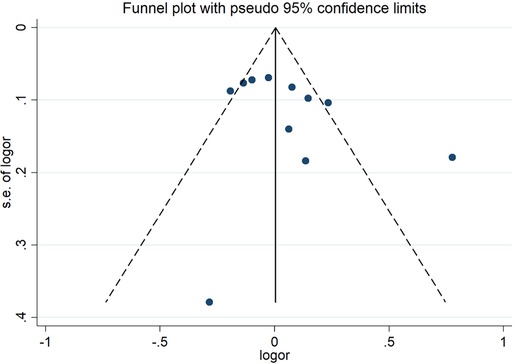
Figure 9. Funnel plot of the meta-analysis between the CETP rs1800775 polymorphism and CAD under the allele model (Avs.C).
No individual studies substantially influenced the overall SMD when associated with HDL-C. The funnel plots were almost symmetrical (Figure 10). Egger's test and Begg's test did not find any publication bias. The inclusion of studies investigating the association of the CETP rs708272 polymorphism with other lipid serum concentrations did not have any significant impact on the overall SMD. The funnel plots showed nearly symmetrical distribution of the studies. Egger's test and Begg's test did not detect any evidence of publication bias.
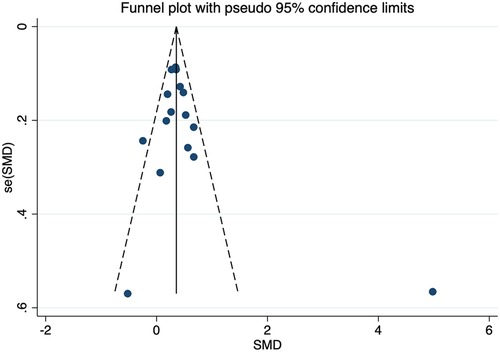
Figure 10. Funnel plot of the meta-analysis between the CETP rs708272 polymorphism and HDL-C concentrations under the homozygote model (AAvs.GG).
Discussion
In the present meta-analysis, our findings suggested that carriers of allele A of the CETP rs708272 polymorphism had higher HDL-C concentrations, lower CETP levels, and lower risk of CAD than no-carries. However, the reliability of the association between the CETP rs708272 polymorphism and CETP level was questionable considering the restricted sample size and the absence of additional studies. HDL particles exhibit a diverse range of atheroprotective activities including the efflux of cellular cholesterol, reduction of the inflammatory responses, and protection against pathological oxidation (61). Therefore, the potential mechanism underlying the observed association between the CETP rs708272 polymorphism and a reduced risk of CAD might be due to the increase of HDL-C concentrations attributed to the rs708272 G-to-A mutation. Based on the findings mentioned above, our speculation was that CETP inhibitors might prevent the development of CAD. Although some studies showed promising effects, including a modest increase in HDL cholesterol levels and a potential reduction in LDL cholesterol and triglyceride levels, the translation of these lipid-modifying effects into significant improvements in cardiovascular outcomes such as the decrease in the incidence of CAD has been inconsistent (62–65). It is possible that HDL-C concentrations may not fully reflect the functionality and diversity of HDL particles, since they primarily served as a general measure of cholesterol carried by HDL. Subgroup analyses was evaluated to examine the potential effects of CAD sub-type, genotyping techniques, source of control, sample size, gender, and age on the connection between genetic polymorphisms and CAD. The findings of the subgroup analysis revealed a significant association between the CETP rs708272 polymorphism and a decreased risk of CAD in almost all subgroups. It's worth noting that in case and control groups predominantly composed of females, no significant association was found. However, due to the limited number of studies and small sample sizes, these conclusions are not reliable. During the analysis of articles, we observed that the majority of studies include case and control groups with a significantly higher number of males than females, and gender differences were not further analyzed. This suggests that future researchers should pay more attention to the impact of gender.
However, no significant association of the CETP rs5882 and rs1800775 polymorphisms with the risk of CAD was found, which was in contradiction with the finding reported by the previous review. Subgroup analysis revealed no significant association between these two SNPs and CAD in most subgroups. It was worth noting that rs1800775 polymorphism was associated with a reduced risk of CAD in studies using large samples, while it was associated with an increased risk of CAD in studies using small samples. More accurate results might be obtained including more studies with larger sample sizes.
No significant correlation was identified between the five uncommon CETP gene polymorphisms and CAD. However, the reliability of these results was limited due to the inclusion of only 2–3 studies for each SNP.
SNPs are closely associated with the occurrence and progression of many diseases (66). The association between SNPs and specific diseases might help identifying the role of genetic factors in disease development, providing a basis for an early diagnosis, prevention, and personalized treatment (67). This meta-analysis revealed a significant association between the CETP rs708272 polymorphism and CAD. Furthermore, it is worth considering the potential for early intervention strategies aimed at individuals carrying the CETP rs708272 risk allele, with the goal of preventing CAD. Our results might help in the determination of disease etiology, as well as improve early intervention to delay or prevent the onset of CAD.
Our current meta-analysis has certain potential limitations. Firstly, studies published in English were the only included, resulting in an insufficient sample size and a limited number of studies for some SNPs. Secondly, a significant heterogeneity was found in our study, potentially compromising the robustness of the findings. Thirdly, only the relationship between each SNP and CAD was investigated due to the lack of sufficient raw data, without examining the interactions between SNPs. While these limitations are acknowledged, it is also prudent to consider the potential impact of publication bias. Publication bias, whereby studies with significant or positive findings are more likely to be published, could introduce a bias in our meta-analysis results. Although we made efforts to minimize this bias through a comprehensive literature search, it remains a potential limitation that should be recognized.
Conclusion
The CETP rs708272 polymorphism is significantly associated with a lower risk of CAD and higher HDL-C concentration. However, the CETP rs5882 and rs1800775, rs4783961, rs247616, rs5883, rs1800776, and rs1532624 do not show any significant association with CAD.
Data availability statement
The original contributions presented in the study are included in the article/Supplementary Material, further inquiries can be directed to the corresponding author.
Author contributions
RZ: Conceptualization, Data curation, Software, Writing – original draft. QX: Writing – original draft. PX: Writing – review & editing.
Funding
The author(s) declare that no financial support was received for the research, authorship, and/or publication of this article.
Conflict of interest
The authors declare that the research was conducted in the absence of any commercial or financial relationships that could be construed as a potential conflict of interest.
Publisher's note
All claims expressed in this article are solely those of the authors and do not necessarily represent those of their affiliated organizations, or those of the publisher, the editors and the reviewers. Any product that may be evaluated in this article, or claim that may be made by its manufacturer, is not guaranteed or endorsed by the publisher.
References
1. Tsao CW, Aday AW, Almarzooq ZI, Anderson CAM, Arora P, Avery CL, et al. Heart disease and stroke statistics-2023 update: a report from the American heart association. Circulation. (2023) 147 (8):e93–e621. doi: 10.1161/CIR.0000000000001123
2. Lanktree MB, Hegele RA. Gene-gene and gene-environment interactions: new insights into the prevention, detection and management of coronary artery disease. Genome Med. (2009) 1(2):28. doi: 10.1186/gm28
3. Yusuf S, Hawken S, Ounpuu S, Dans T, Avezum A, Lanas F, et al. Effect of potentially modifiable risk factors associated with myocardial infarction in 52 countries (the INTERHEART study): case-control study. Lancet. (2004) 364(9438):937–52. doi: 10.1016/S0140-6736(04)17018-9
4. de Grooth GJ, Klerkx AH, Stroes ES, Stalenhoef AF, Kastelein JJ, Kuivenhoven JA. A review of CETP and its relation to atherosclerosis. J Lipid Res. (2004) 45(11):1967–74. doi: 10.1194/jlr.R400007-JLR200
5. Sirtori CR, Corsini A, Ruscica M. The role of high-density lipoprotein cholesterol in 2022. Curr Atheroscler Rep. (2022) 24(5):365–77. doi: 10.1007/s11883-022-01012-y
6. Papp AC, Pinsonneault JK, Wang D, Newman LC, Gong Y, Johnson JA, et al. Cholesteryl ester transfer protein (CETP) polymorphisms affect mRNA splicing, HDL levels, and sex-dependent cardiovascular risk. PLoS One. (2012) 7(3):e31930. doi: 10.1371/journal.pone.0031930
7. Drayna D, Lawn R. Multiple RFLPs at the human cholesteryl ester transfer protein (CETP) locus. Nucleic Acids Res. (1987) 15(11):4698. doi: 10.1093/nar/15.11.4698
8. Boekholdt SM, Thompson JF. Natural genetic variation as a tool in understanding the role of CETP in lipid levels and disease. J Lipid Res. (2003) 44(6):1080–93. doi: 10.1194/jlr.R200018-JLR200
9. Dachet C, Poirier O, Cambien F, Chapman J, Rouis M. New functional promoter polymorphism, CETP/-629, in cholesteryl ester transfer protein (CETP) gene related to CETP mass and high density lipoprotein cholesterol levels: role of Sp1/Sp3 in transcriptional regulation. Arterioscler Thromb Vasc Biol. (2000) 20(2):507–15. doi: 10.1161/01.ATV.20.2.507
10. Thompson A, Di Angelantonio E, Sarwar N, Erqou S, Saleheen D, Dullaart RP, et al. Association of cholesteryl ester transfer protein genotypes with CETP mass and activity, lipid levels, and coronary risk. JAMA. (2008) 299(23):2777–88. doi: 10.1001/jama.299.23.2777
11. Moher D, Liberati A, Tetzlaff J, Altman DG. Preferred reporting items for systematic reviews and meta-analyses: the PRISMA statement. PLoS Med. (2009) 6(7):e1000097. doi: 10.1371/journal.pmed.1000097
12. Stang A. Critical evaluation of the Newcastle-Ottawa scale for the assessment of the quality of nonrandomized studies in meta-analyses. Eur J Epidemiol. (2010) 25(9):603–5. doi: 10.1007/s10654-010-9491-z
13. Higgins JP, Thompson SG, Deeks JJ, Altman DG. Measuring inconsistency in meta-analyses. Br Med J. (2003) 327(7414):557–60. doi: 10.1136/bmj.327.7414.557
14. Peters JL, Sutton AJ, Jones DR, Abrams KR, Rushton L. Comparison of two methods to detect publication bias in meta-analysis. JAMA. (2006) 295(6):676–80. doi: 10.1001/jama.295.6.676
15. Rayat S, Ramezanidoraki N, Kazemi N, Modarressi MH, Falah M, Zardadi S, et al. Association study between polymorphisms in MIA3, SELE, SMAD3 and CETP genes and coronary artery disease in an Iranian population. BMC Cardiovasc Disord. (2022) 22(1):298. doi: 10.1186/s12872-022-02695-6
16. Vargas-Alarcón G, Pérez-Méndez O, Posadas-Sánchez R, Peña-Duque MA, Martínez-Ríos MA, Delgadillo-Rodriguez H, et al. Los polimorfismos rs4783961 y rs708272 del gen CETP son asociados con la enfermedad arterial coronaria y no con la restenosis tras el implante de un stent coronario. Archivos de Cardiología de México. (2021) 92(3):334–41. doi: 10.24875/ACM.21000039
17. Raina JK, Sharma M, Panjaliya RK, Dogra V, Bakaya A, Kumar P. Association of ESR1 (rs2234693 and rs9340799), CETP (rs708272), MTHFR (rs1801133 and rs2274976) and MS (rs185087) polymorphisms with coronary artery disease (CAD). BMC Cardiovasc Disord. (2020) 20(1):340. doi: 10.1186/s12872-020-01618-7
18. Amer NN, Shaaban GM. Association of serum cholesterol ester transfer protein levels with taq IB polymorphism in acute coronary syndrome. Lab Med. (2019) 51(2):199–210. doi: 10.1093/labmed/lmz043
19. Iwanicka J, Iwanicki T, Niemiec P, Balcerzyk A, Krauze J, Górczyńska-Kosiorz S, et al. Relationship between CETP gene polymorphisms with coronary artery disease in polish population. Mol Biol Rep. (2018) 45(6):1929–35. doi: 10.1007/s11033-018-4342-1
20. Cai G, Shi G, Huang Z. Gender specific effect of CETP rs708272 polymorphism on lipid and atherogenic index of plasma levels but not on the risk of coronary artery disease. Medicine (Baltimore). (2018) 97(49):e13514. doi: 10.1097/MD.0000000000013514
21. Maksoud A, El-Garf SM, Ali WT, Shaaban OS, Amer GM, N N. Association of cholesterol ester transfer protein taq IB polymorphism with acute coronary syndrome in Egyptian national patients. Lab Med. (2017) 48(2):154–65. doi: 10.1093/labmed/lmw071
22. Cyrus C, Vatte C, Al-Nafie A, Chathoth S, Al-Ali R, Al-Shehri A, et al. The impact of common polymorphisms in CETP and ABCA1 genes with the risk of coronary artery disease in Saudi arabians. Hum Genomics. (2016) 10(1):8. doi: 10.1186/s40246-016-0065-3
23. Kaman D, İlhan N, Akbulut M. TaqIB and severity of coronary artery disease in the Turkish population: a pilot study. Biomol Biomed. (2015) 15(1):9–13. doi: 10.17305/bjbms.2015.157
24. Mehlig K, Strandhagen E, Svensson P-A, Rosengren A, Torén K, Thelle DS, et al. CETP TaqIB genotype modifies the association between alcohol and coronary heart disease: the INTERGENE case-control study. Alcohol. (2014) 48(7):695–700. doi: 10.1016/j.alcohol.2014.08.011
25. Abd El-Aziz TA, Mohamed RH, Hagrass HA. Increased risk of premature coronary artery disease in Egyptians with ABCA1 (R219K), CETP (TaqIB), and LCAT (4886C/T) genes polymorphism. J Clin Lipidol. (2014) 8(4):381–9. doi: 10.1016/j.jacl.2014.06.001
26. Wang J, Wang LJ, Zhong Y, Gu P, Shao JQ, Jiang SS, et al. CETP gene polymorphisms and risk of coronary atherosclerosis in a Chinese population. Lipids Health Dis. (2013) 12(1):176. doi: 10.1186/1476-511X-12-176
27. Lu Y, Tayebi N, Li H, Saha N, Yang H, Heng CK. Association of CETP Taq1B and −629C>A polymorphisms with coronary artery disease and lipid levels in the multi-ethnic Singaporean population. Lipids Health Dis. (2013) 12:85. doi: 10.1186/1476-511X-12-85
28. Rahimi Z, Nourozi-Rad R, Vaisi-Raygani A, Saidi M-R, Rahimi Z, Ahmadi R, et al. Association between cholesteryl ester transfer protein TaqIB variants and risk of coronary artery disease and diabetes mellitus in the population of western Iran. Genet Test Mol Biomarkers. (2011) 15(11):813–9. doi: 10.1089/gtmb.2011.0037
29. Kolovou G, Vasiliadis I, Kolovou V, Karakosta A, Mavrogeni S, Papadopoulou E, et al. The role of common variants of the cholesteryl ester transfer protein gene in left main coronary artery disease. Lipids Health Dis. (2011) 10:156. doi: 10.1186/1476-511X-10-156
30. Corella D, Carrasco P, Amiano P, Arriola L, Chirlaque MD, Huerta JM, et al. Common cholesteryl ester transfer protein gene variation related to high-density lipoprotein cholesterol is not associated with decreased coronary heart disease risk after a 10-year follow-up in a Mediterranean cohort: modulation by alcohol consumption. Atherosclerosis. (2010) 211(2):531–8. doi: 10.1016/j.atherosclerosis.2010.03.026
31. Poduri A, Khullar M, Bahl A, Sharma YP, Talwar KK. A combination of proatherogenic single-nucleotide polymorphisms is associated with increased risk of coronary artery disease and myocardial infarction in Asian Indians. DNA Cell Biol. (2009) 28(9):451–60. doi: 10.1089/dna.2009.0887
32. Padmaja N, Kumar RM, Balachander J, Adithan C. Cholesteryl ester transfer protein TaqIB, −629C>A and I405V polymorphisms and risk of coronary heart disease in an Indian population. Clin Chim Acta. (2009) 402(1–2):139–45. doi: 10.1016/j.cca.2008.12.041
33. Kaestner S, Patsouras N, Spathas DH, Flordellis CS, Manolis AS. Lack of association between the cholesteryl ester transfer protein gene—TaqIB polymorphism and coronary restenosis following percutaneous transluminal coronary angioplasty and stenting: a pilot study. Angiology. (2009) 61(4):338–43. doi: 10.1177/0003319709348297
34. Rejeb J, Omezzine A, Rebhi L, Naffeti I, Kchok K, Belkahla R, et al. Association of the cholesteryl ester transfer protein Taq1 B2B2 genotype with higher high-density lipoprotein cholesterol concentrations and lower risk of coronary artery disease in a Tunisian population. Arch Cardiovasc Dis. (2008) 101(10):629–36. doi: 10.1016/j.acvd.2008.09.013
35. Meiner V, Friedlander Y, Milo H, Sharon N, Ben-Avi L, Shpitzen S, et al. Cholesteryl ester transfer protein (CETP) genetic variation and early onset of non-fatal myocardial infarction. Ann Hum Genet. (2008) 72(Pt 6):732–41. doi: 10.1111/j.1469-1809.2008.00464.x
36. Hsieh MC, Tien KJ, Chang SJ, Lo CS, Hsin SC, Hsiao JY, et al. Cholesteryl ester transfer protein B1B1 genotype as a predictor of coronary artery disease in Taiwanese with type 2 diabetes mellitus. Metab Clin Exp. (2007) 56(6):745–50. doi: 10.1016/j.metabol.2006.12.023
37. Dedoussis GV, Panagiotakos DB, Louizou E, Mantoglou I, Chrysohoou C, Lamnisou K, et al. Cholesteryl ester-transfer protein (CETP) polymorphism and the association of acute coronary syndromes by obesity status in Greek subjects: the CARDIO2000-GENE study. Hum Hered. (2007) 63(3–4):155–61. doi: 10.1159/000099827
38. Yilmaz H, Isbir T, Agachan B, Karaali ZE. Effects of cholesterol ester transfer protein Taq1B gene polymorphism on serum lipoprotein levels in Turkish coronary artery disease patients. Cell Biochem Funct. (2005) 23(1):23–8. doi: 10.1002/cbf.1124
39. Whiting BM, Anderson JL, Muhlestein JB, Horne BD, Bair TL, Pearson RR, et al. Candidate gene susceptibility variants predict intermediate end points but not angiographic coronary artery disease. Am Heart J. (2005) 150(2):243–50. doi: 10.1016/j.ahj.2004.08.034
40. Falchi A, Giovannoni L, Piras IS, Calo CM, Moral P, Vona G, et al. Prevalence of genetic risk factors for coronary artery disease in Corsica Island (France). Exp Mol Pathol. (2005) 79(3):210–3. doi: 10.1016/j.yexmp.2005.09.005
41. Keavney B, Palmer A, Parish S, Clark S, Youngman L, Danesh J, et al. Lipid-related genes and myocardial infarction in 4685 cases and 3460 controls: discrepancies between genotype, blood lipid concentrations, and coronary disease risk. Int J Epidemiol. (2004) 33(5):1002–13. doi: 10.1093/ije/dyh275
42. Andrikopoulos GK, Richter DJ, Needham EW, Zairis MN, Karabinos EN, Gialafos EJ, et al. Association of the ile405val mutation in cholesteryl ester transfer protein gene with risk of acute myocardial infarction. Heart. (2004) 90(11):1336–7. doi: 10.1136/hrt.2003.019067
43. Isbir T, Yilmaz H, Agachan B, Karaali ZE. Cholesterol ester transfer protein, apolipoprotein E and lipoprotein lipase genotypes in patients with coronary artery disease in the Turkish population. Clin Genet. (2003) 64(3):228–34. doi: 10.1034/j.1399-0004.2003.00137.x
44. Freeman DJ, Samani NJ, Wilson V, McMahon AD, Braund PS, Cheng S, et al. A polymorphism of the cholesteryl ester transfer protein gene predicts cardiovascular events in non-smokers in the west of Scotland coronary prevention study. Eur Heart J. (2003) 24(20):1833–42. doi: 10.1016/j.ehj.2003.07.001
45. Liu S, Schmitz C, Stampfer MJ, Sacks F, Hennekens CH, Lindpaintner K, et al. A prospective study of TaqIB polymorphism in the gene coding for cholesteryl ester transfer protein and risk of myocardial infarction in middle-aged men. Atherosclerosis. (2002) 161(2):469–74. doi: 10.1016/S0021-9150(01)00673-6
46. Wu JH, Lee YT, Hsu HC, Hsieh LL. Influence of CETP gene variation on plasma lipid levels and coronary heart disease: a survey in Taiwan. Atherosclerosis. (2001) 159(2):451–8. doi: 10.1016/S0021-9150(01)00524-X
47. Arca M, Montali A, Ombres D, Battiloro E, Campagna F, Ricci G, et al. Lack of association of the common TaqIB polymorphism in the cholesteryl ester transfer protein gene with angiographically assessed coronary atherosclerosis. Clin Genet. (2001) 60(5):374–80. doi: 10.1034/j.1399-0004.2001.600510.x
48. Bordoni L, Samulak JJ, Sawicka AK, Pelikant-Malecka I, Radulska A, Lewicki L, et al. Trimethylamine N-oxide and the reverse cholesterol transport in cardiovascular disease: a cross-sectional study. Sci Rep. (2020) 10(1):18675. doi: 10.1038/s41598-020-75633-1
49. Arikan GD, Isbir S, Yilmaz SG, Isbir T. Characteristics of coronary artery disease patients who have a polymorphism in the cholesterol ester transfer protein (CETP) gene. In Vivo. (2019) 33(3):787–92. doi: 10.21873/invivo.11540
50. Mirhafez SR, Avan A, Khatamianfar S, Ghasemi F, Moohebati M, Ebrahimi M, et al. There is an association between a genetic polymorphism in the ZNF259 gene involved in lipid metabolism and coronary artery disease. Gene. (2019) 704:80–5. doi: 10.1016/j.gene.2019.02.101
51. Wu N, Liu G, Huang Y, Liao Q, Han L, Ye H, et al. Study of the association of 17 lipid-related gene polymorphisms with coronary heart disease. Anatol J Cardiol. (2018) 19(6):360–7. doi: 10.14744/AnatolJCardiol.2018.23682
52. Devi A, Singh R, Dawar R, Tyagi S. Association of cholesteryl ester transfer protein (CETP) gene −629C/A polymorphism with angiographically proven atherosclerosis. Indian J Clin Biochem. (2017) 32(2):235–8. doi: 10.1007/s12291-016-0585-6
53. Goodarzynejad H, Boroumand M, Behmanesh M, Ziaee S, Jalali A. Cholesteryl ester transfer protein gene polymorphism (I405V) and premature coronary artery disease in an Iranian population. Bosn J Basic Med Sci. (2016) 16(2):114–20. doi: 10.17305/bjbms.2016.942
54. Ganesan M, Nizamuddin S, Katkam SK, Kumaraswami K, Hosad UK, Lobo LL, et al. C.*84G>A mutation in CETP is associated with coronary artery disease in south Indians. PLoS One. (2016) 11(10):e0164151. doi: 10.1371/journal.pone.0164151
55. Zende PD, Bankar MP, Momin AR, Kamble PS. Study of cholesteryl ester transfer protein (CETP) I405v genotype and its association with lipid fractions in myocardial infarction patients: a case control study. J Clin Diagn Res. (2014) 8(6):Cc01–4. doi: 10.7860/JCDR/2014/7818.4441
56. Xu L, Zhou J, Huang S, Huang Y, Le Y, Jiang D, et al. An association study between genetic polymorphisms related to lipoprotein-associated phospholipase A(2) and coronary heart disease. Exp Ther Med. (2013) 5(3):742–50. doi: 10.3892/etm.2013.911
57. Tanrikulu S, Ademoglu E, Gurdol F, Mutlu-Turkoglu U, Bilge AK, Nisanci Y. Association of cholesteryl ester transfer protein −629C > A polymorphism with high-density lipoprotein cholesterol levels in coronary artery disease patients. Cell Biochem Funct. (2009) 27(7):452–7. doi: 10.1002/cbf.1593
58. Zee RY, Cook NR, Cheng S, Erlich HA, Lindpaintner K, Ridker PM. Multi-locus candidate gene polymorphisms and risk of myocardial infarction: a population-based, prospective genetic analysis. J Thromb Haemost. (2006) 4(2):341–8. doi: 10.1111/j.1538-7836.2006.01754.x
59. Zheng K, Zhang S, Zhang L, He Y, Liao L, Hou Y, et al. Carriers of three polymorphisms of cholesteryl ester transfer protein gene are at increased risk to coronary heart disease in a Chinese population. Int J Cardiol. (2005) 103(3):259–65. doi: 10.1016/j.ijcard.2004.08.065
60. Tobin MD, Braund PS, Burton PR, Thompson JR, Steeds R, Channer K, et al. Genotypes and haplotypes predisposing to myocardial infarction: a multilocus case-control study. Eur Heart J. (2004) 25(6):459–67. doi: 10.1016/j.ehj.2003.11.014
61. Kontush A. HDL-mediated mechanisms of protection in cardiovascular disease. Cardiovasc Res. (2014) 103(3):341–9. doi: 10.1093/cvr/cvu147
62. Lincoff AM, Nicholls SJ, Riesmeyer JS, Barter PJ, Brewer HB, Fox KAA, et al. Evacetrapib and cardiovascular outcomes in high-risk vascular disease. N Engl J Med. (2017) 376(20):1933–42. doi: 10.1056/NEJMoa1609581
63. Schwartz GG, Olsson AG, Abt M, Ballantyne CM, Barter PJ, Brumm J, et al. Effects of dalcetrapib in patients with a recent acute coronary syndrome. N Engl J Med. (2012) 367(22):2089–99. doi: 10.1056/NEJMoa1206797
64. Cannon CP, Shah S, Dansky HM, Davidson M, Brinton EA, Gotto AM, et al. Safety of anacetrapib in patients with or at high risk for coronary heart disease. N Engl J Med. (2010) 363(25):2406–15. doi: 10.1056/NEJMoa1009744
65. Barter PJ, Caulfield M, Eriksson M, Grundy SM, Kastelein JJ, Komajda M, et al. Effects of torcetrapib in patients at high risk for coronary events. N Engl J Med. (2007) 357(21):2109–22. doi: 10.1056/NEJMoa0706628
Keywords: coronary artery disease, single nucleotide polymorphisms, cholesteryl ester transfer protein, meta-analysis, review
Citation: Zhang R, Xie Q and Xiao P (2023) Association of the polymorphisms of the cholesteryl ester transfer protein gene with coronary artery disease: a meta-analysis. Front. Cardiovasc. Med. 10:1260679. doi: 10.3389/fcvm.2023.1260679
Received: 18 July 2023; Accepted: 7 November 2023;
Published: 7 December 2023.
Edited by:
Tommaso Gori, University Medical Centre, Johannes Gutenberg University Mainz, GermanyReviewed by:
Chiduzie Madubata, Sidney Kimmel Medical College (SKMC), United StatesHamidreza Goodarzynejad, North York General Hospital, Canada
© 2023 Zhang, Xie and Xiao. This is an open-access article distributed under the terms of the Creative Commons Attribution License (CC BY). The use, distribution or reproduction in other forums is permitted, provided the original author(s) and the copyright owner(s) are credited and that the original publication in this journal is cited, in accordance with accepted academic practice. No use, distribution or reproduction is permitted which does not comply with these terms.
*Correspondence: Pingxi Xiao eHB4QG5qbXUuZWR1LmNu