 Xinghui Li
 Huijian Yang
 Guobo Xie
 Maobin Kuang
 Guotai Sheng
 Yang Zou
- 1Department of Internal Medicine, Fuzhou Dongxiang District People’s Hospital, Fuzhou, China
- 2Department of Cardiology, Jiangxi Provincial People’s Hospital, The First Affiliated Hospital of Nanchang Medical College, Nanchang, China
- 3Jiangxi Cardiovascular Research Institute, Jiangxi Provincial People’s Hospital, The First Affiliated Hospital of Nanchang Medical College, Nanchang, China
Objective: Several recent reports have suggested the use of mean arterial blood pressure (MAP) to assess/predict the risk of developing atherosclerosis, chronic kidney disease, diabetes, metabolic syndrome, and poor prognosis in a variety of cardiovascular and cerebrovascular diseases. The current study aimed to investigate the association of MAP with non-alcoholic fatty liver disease (NAFLD) and to explore the differences in this association across populations.
Methods: This study used data from the NAGALA study from 1994 to 2016. MAP was calculated as 1/3 systolic blood pressure (SBP) + 2/3 diastolic blood pressure (DBP). Restricted cubic spline (RCS) and logistic regression models were used to examine the correlation of MAP with NAFLD.
Results: The study population was 14,251 general people undergoing health screening, with a median (interquartile range) age of 42 (36–50) years; among them, 48% were women, and 2,507 (17.59%) were diagnosed with NAFLD. After fully controlling for confounders in the current dataset, MAP was positively and non-linearly associated with NAFLD [(odds ratios (ORs): 1.39, 95% confidence intervals (CIs): 1.15, 1.68); P for non-linearity = 0.024]; the dose-response curve showed that there was a transient saturation effect interval when MAP was between 85 and 95 mmHg, where the risk of NAFLD was neither increased nor decreased. The results of the stratified analysis showed that the risk of NAFLD associated with MAP appeared to be influenced only by age (P-interaction = 0.002), but not by sex, body mass index (BMI), habits of exercise, drinking status, or smoking status (P-interaction > 0.05); further age-stratified RCS analysis showed that the non-linear association between MAP and NAFLD in the young and middle-aged and the middle-aged and elderly populations was consistent with the results of the whole population, whereas, in the elderly population, a U-shaped curve association between MAP and NAFLD was observed, with both low and high MAP increasing the risk of NAFLD.
Conclusion: In the general population, MAP was positively and non-linearly associated with NAFLD, and this association only differed significantly by age, but not by sex, BMI, habits of exercise, drinking status, and smoking status.
Introduction
NAFLD is a global public health problem that affects billions of people worldwide (1, 2). In North America and Europe, the prevalence of NAFLD is 24%, in Asia, this figure is 27%, and in South America and the Middle East, the prevalence of NAFLD is as high as 31% and 32% (1, 3). Several recent predictive analyzes based on NAFLD Markov models showed that even if the prevalence of obesity and diabetes plateaus in the future, that of NAFLD will continue to grow globally until 2030 and the number of patients with cirrhosis and advanced liver disease will more than double due to an aging/increasing population (4, 5). Fortunately, early NAFLD is reversible, and improving awareness and diagnosis of NAFLD, as well as public health campaigns to promote healthy diet and exercise, can help control the future growth of the disease burden (4, 6, 7).
MAP, defined as the mean blood pressure throughout the cardiac cycle, is a major driver of vital organ perfusion (8, 9), reflecting vascular peripheral resistance and cardiac output (10), and has been widely used in the field of critical care, where 65 mmHg is considered a critical point of poor prognosis (11–15). In addition, the accuracy of using MAP to predict preeclampsia is better than SBP or DBP alone in early and mid-trimester pregnancies (16, 17). Together, these previous studies supported that MAP is sufficiently advantageous in short-term event assessment, and in recent years, MAP has begun to be mentioned in epidemiological studies; several researchers have found MAP to be of good value in assessing the risk of developing various chronic diseases such as atherosclerosis (18), diabetes (19–21), chronic kidney disease (22, 23), and metabolic syndrome (24), as well as in predicting poor prognosis in cardiovascular disease (9, 25–28). A series of epidemiological evidence further suggested that MAP may be a useful assessment tool for common chronic diseases; however, data on the direction of the association between MAP and the risk of developing NAFLD are still scarce, and it is unclear whether MAP is associated with NAFLD in the general population, whether this association is non-linear, and whether there are differences across populations. To clarify these issues, the current study aimed to assess the association of MAP with NAFLD in the general population based on large sample data from the NAGALA study.
Methods
Study design and participants
We performed a post-hoc analysis of the data from the NAGALA study (the original data were obtained from the Murakami Memorial Hospital Physical Examination Center in Gifu, Japan, and the available data were uploaded to the Dryad database for public sharing) (29). NAGALA study was a longitudinal cohort study that continuously recruited 20,944 participants who received health checkups between 1994 and 2016 to assess risk factors for common chronic diseases with the aim of promoting public health, and it was authorized by the Ethics Committee of Murakami Memorial Hospital and informed consent was provided by all participants. The study design and part of the study results have been previously published (30). Based on the previous research, the current study used the de-identified public data in the NAGALA study for post-hoc analysis, aiming to analyze and explore the association between MAP and NAFLD in different populations. The new study protocol has been submitted to the Ethics Committee of Jiangxi Provincial People's Hospital for review and has been approved (IRB2021-066), and the STROBE reporting guidelines have been followed throughout the study. In addition, because the current data set has been de-identified, the Ethics Committee of Jiangxi Provincial People's Hospital exempted the informed consent of the subjects. According to the new study objectives we excluded participants with the following characteristics: (i) participants with diagnosed hepatitis (viral/alcoholic) or diabetes or fasting plasma glucose (FPG) above 6.1 mmol/L at baseline (n = 1,547); (ii) participants with alcohol intake ≥ 210 g/w for men or ≥ 140 g/w for women at baseline (n = 1,952) (31); (iii) participants who were taking medications at baseline (n = 2,321); (iv) participants with missing data at baseline (n = 863); and (v) participants who withdrew from the study (n = 10). Finally, we included 14,251 eligible participants, and the flowchart for selecting participants was shown in Figure 1.
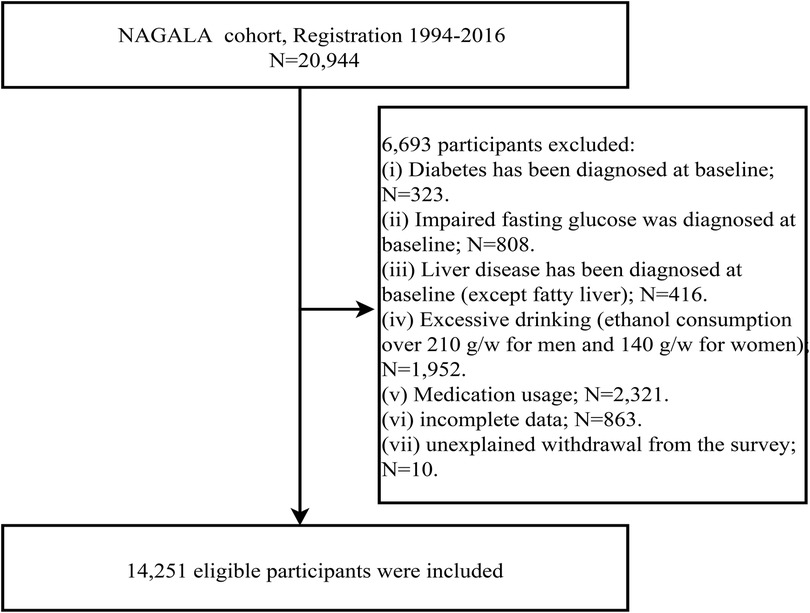
Figure 1. Flowchart of the selection process of study subjects.
Data collection and measurement
Data on participants' demographic characteristics (sex, age), lifestyle (smoking and drinking status, habits of exercise), disease history, and medication history were recorded through face-to-face interviews using a standardized questionnaire. Height, weight, waist circumference, and blood pressure were measured using standard methods in a standard setting, and BMI was calculated as weight/height2. MAP was calculated as 1/3 SBP + 2/3 DBP (19). Smoking status was divided into non-smoking, former smoking, and current smoking; drinking status was divided into non, light, and moderate based on the amount and type of weekly alcohol consumption in the past month (32). Habits of exercise were evaluated based on the frequency of exercise per week, and those who exercised more than once were considered to have exercise habits. Venous blood specimens were drawn after participants had fasted for at least 8 h, and then glycosylated hemoglobin (HbA1c), alanine aminotransferase (ALT), high-density lipoprotein cholesterol (HDL-C), aspartate aminotransferase (AST), total cholesterol (TC), triglycerides (TG), and gamma-glutamyl transferase (GGT), FPG were measured using an automated biochemical analyzer according to standard procedures.
Diagnosis of NAFLD
During the physical examination, the diagnosis of NAFLD was determined based on imaging; trained ultrasound technicians performed the abdominal ultrasound procedure, and then an experienced gastroenterologist reviewed the ultrasound images, scored them, and made the diagnosis of NAFLD based on the following four characteristics: hepatorenal echo contrast, liver brightness, deep attenuation and vascular blurring (33).
Statistical analysis
Considering the large sample size included in this study, we proposed to characterize the data of participants by MAP quintiles. Baseline characteristics of participants were reported as mean with standard deviation or median with interquartile range, and comparisons between groups were made using one-way ANOVA or Kruskal-Wallis H test, depending on whether the data distribution was normal (assessed using Q-Q plots). Categorical data were then expressed as frequencies and percentages, and comparisons between groups were made using the chi-square test.
To analyze the association between MAP and NAFLD, we calculated the ORs and 95% CIs using logistic regression analysis; in addition, we calculated variance inflation factors (Supplementary Table S1) for checking potential multicollinearity for all covariates before modeling (34). Four stepwise adjusted models were constructed according to the methodology suggested by the STROBE statement (35). Model 1 was adjusted for age, BMI, and height; model 2 further considered the effects of smoking and drinking status and habits of exercise based on model 1; model 3 continued with adjustments for AST, ALT, and GGT based on model 2; model 4 was adjusted for all non-collinear variables as the final model, i.e., it additionally considered the effects of glycemic lipid factors (TG, HDL-C, TC, FPG, and HbA1c) based on model 3. We also assessed the dose-response relationship between MAP and NAFLD using the RCS on the basis of model 4, with nodes located at the 5th, 35th, 65th, and 95th percentiles of the exposure distribution (36).
To test the robustness of the association between MAP and NAFLD, we also performed 4 sensitivity analyses. Based on model 4, we performed the same analyses in the population without exercise habits, in the young and middle-aged population, in the population with normal blood pressure, and in the non-obese population, respectively.
To explore whether the association between MAP and NAFLD differed among different populations, we further performed stratified analyses according to age, sex, BMI, habits of exercise, smoking status, and drinking status, and used likelihood ratio tests to assess differences between different subgroups.
Data analysis was performed in November 2022 using R version 3.4.3 (The R Foundation for Statistical Computing) and Empower(R) version 2.0. Statistical tests were two-tailed, and P values less than 0.05 were considered statistically significant.
Results
Study subjects and characteristics
The study population was 14,251 general people undergoing health screening, with a median (interquartile range) age of 42 (36–50) years and 48% being women. Table 1 shows the baseline characteristics of participants across MAP quintiles. The results showed that the prevalence rates of NAFLD in the MAP quintiles were 3.75%, 9.82%, 15.37, 22.85 and 35.81%, respectively. The higher MAP group was older, had higher height, weight, BMI, and WC, more people who smoked and drank alcohol, and had higher levels of liver enzymes, blood sugar, blood pressure, and blood lipids except for HDL-C. Additionally, it is worth noting that with the MAP quartile increasing, the number of men gradually increased and the number of women gradually decreased.
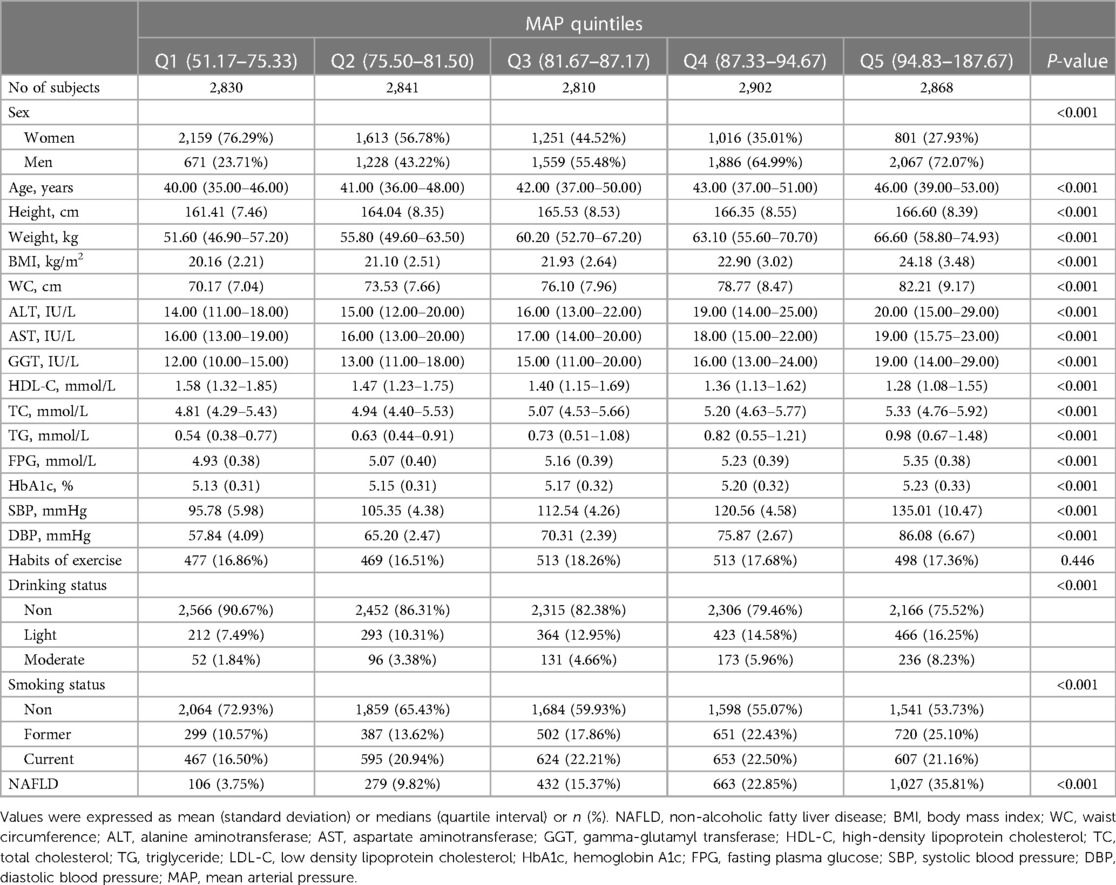
Table 1. Baseline characteristics of four groups.
Multivariate regression model analysis of the association between MAP and NAFLD
At baseline, 2,507 (17.59%) participants were diagnosed with NAFLD. In the multivariate logistic analysis (Table 2), after gradually adjusting for potential confounders, we found that MAP and NAFLD always maintained a stable positive correlation, with a large OR variation between the highest MAP quintile and the other quintiles; overall, a positive correlation trend was maintained between MAP and NAFLD in all four models. In model 4, the risk of NAFLD increased by 15% for every 10 mmHg increase in MAP, and the risk of NAFLD was 1.75 times higher in those with MAP at greater than or equal to 94.83 mmHg (Q5) than in those with MAP at 51.17–75.33 mmHg (Q1).
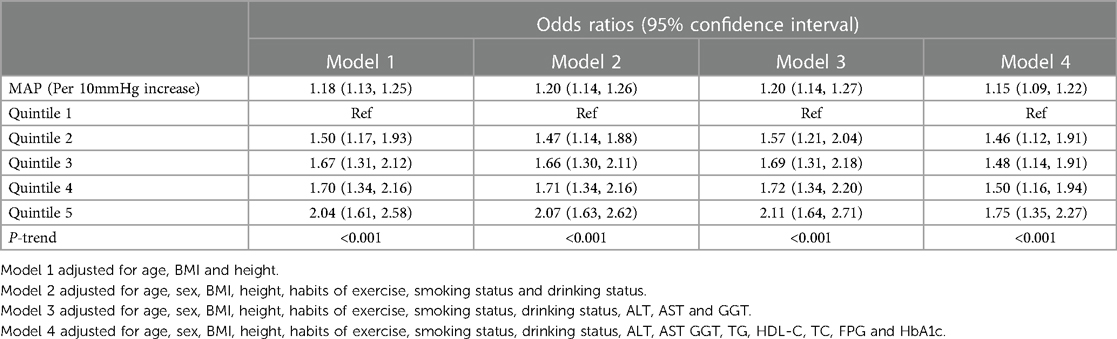
Table 2. Logistic regression analyses for the association between MAP and NAFLD.
Sensitivity analysis
Table 3 shows the results of the association between MAP and NAFLD in multiple relatively low-risk populations, and the four sensitivity analyses based on model 4 provided similar findings to the main analysis, which underscored the robustness of the current study results.
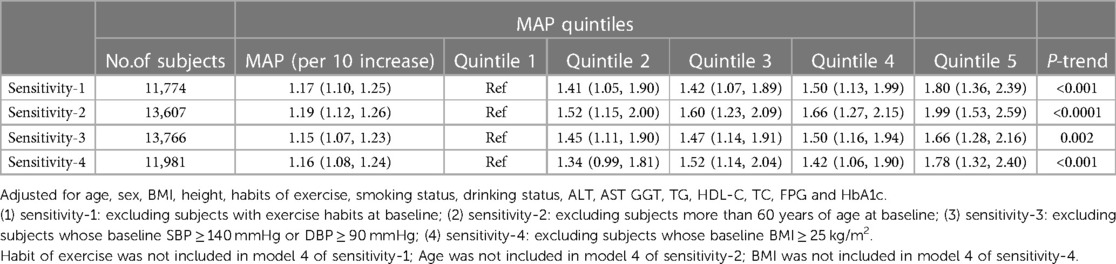
Table 3. Adjusted odds ratios and 95% confidence intervals for NAFLD risk associated with the MAP in different test populations: sensitivity analysis.
Differences in the association between MAP and NAFLD across populations
We proceeded to assess the association between MAP and NAFLD in different subgroups of age, sex, BMI, habits of exercise, smoking status, and drinking status by stratified analysis and interaction tests (Table 4). We found that MAP-related NAFLD risk appeared to be associated only with age (P-interaction = 0.002), but not with sex, BMI, habits of exercise, drinking status, or smoking status (P-interaction > 0.05).
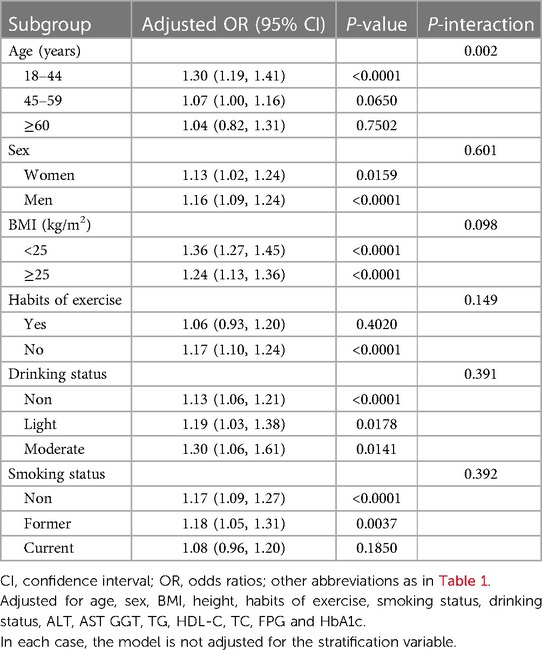
Table 4. Stratified associations between MAP and NAFLD by age, sex, BMI, habits of exercise, drinking status and smoking status.
Non-linear analysis of MAP and NAFLD
In the RCS regression analysis, we more intuitively observed a positive association between MAP and NAFLD, although it is worth noting that the association between MAP and NAFLD was not straight linear (P for non-linearity = 0.024). As seen in Figure 2, in the general population, the risk of NAFLD neither increased nor decreased when MAP was between 85 and 95 mmHg, with a transient saturation effect interval, which was similar to the results in model 4 of Table 2 [OR: (Q3)1.48 vs. (Q4)1.50]. In addition, based on the results of stratified analysis, we continued to fit the dose-response curve of the association between MAP and NAFLD in different age groups (Figure 3); the results showed that the aforementioned saturation effect interval remained in the young and middle-aged population (18–44 years old) and in the middle-aged and elderly population (45–59 years old), while in the elderly population (≥60 years old), there was a U-shaped curve association between MAP and NAFLD, where the lowest point was about 90 mmHg, and both low and high MAP would increase the risk of NAFLD.
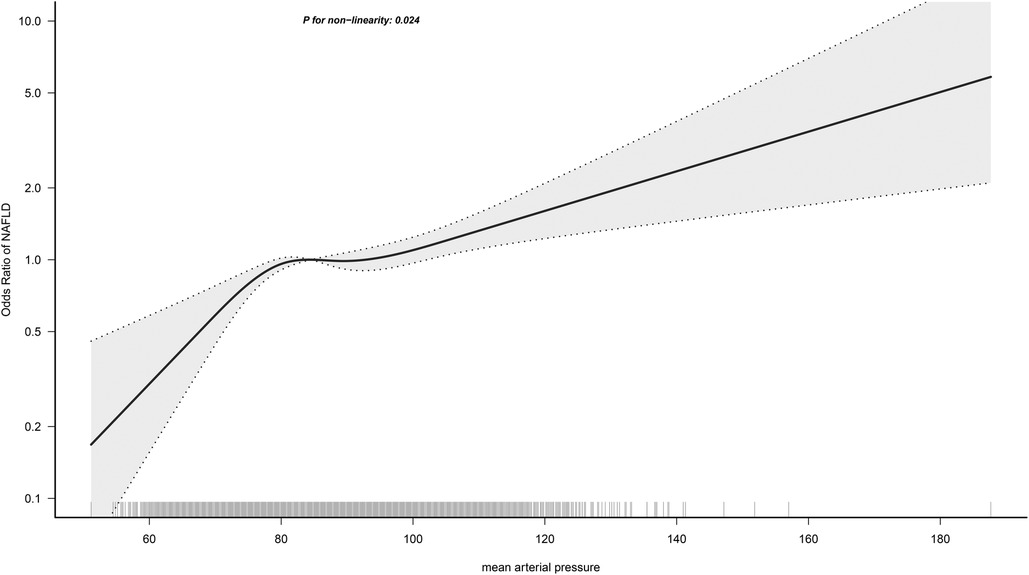
Figure 2. Dose-response curves for the association between MAP and NAFLD in the general population.
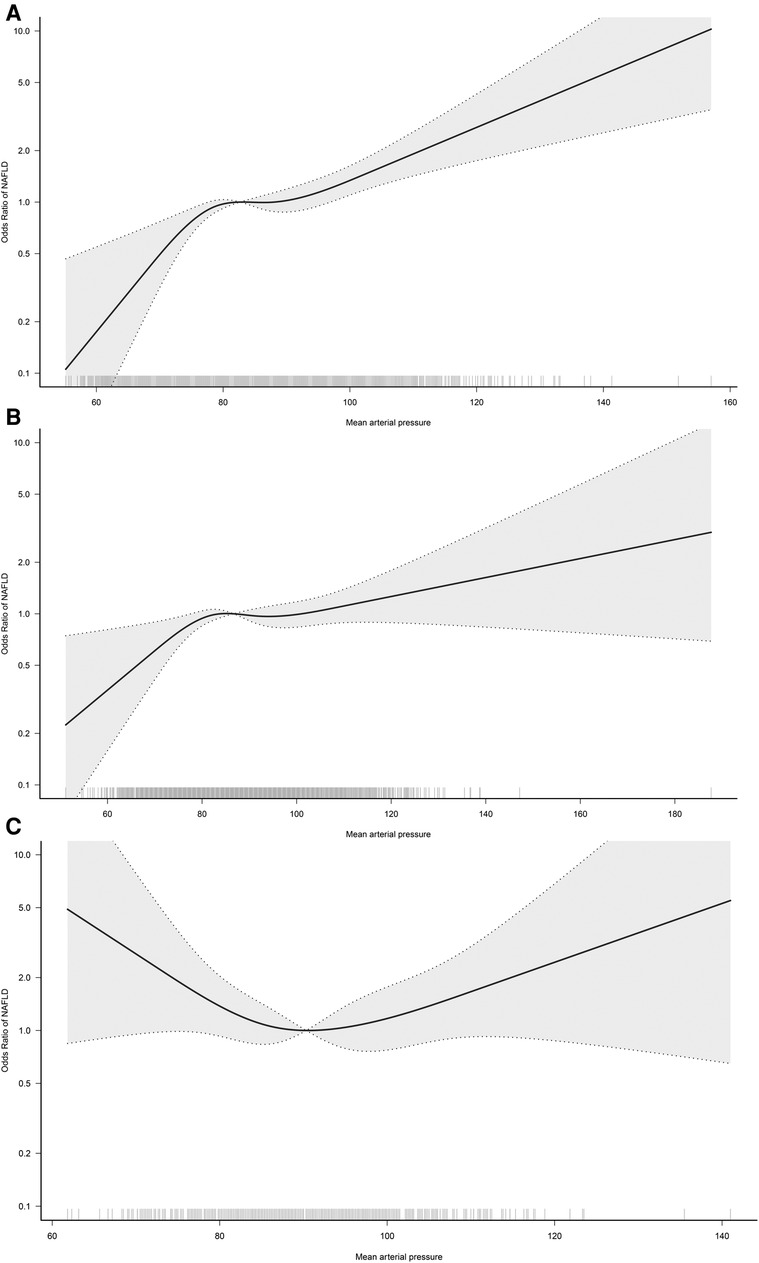
Figure 3. Dose-response curves for the association between MAP and NAFLD in 18–44 (A), 45–59 (B), and ≥60-year-old (C) populations. Adjusted for sex, BMI, height, habits of exercise, smoking status, drinking status, ALT, AST GGT, TG, HDL-C, TC, FPG and HbA1c.
Discussion
This study of 14,251 individuals aged 20–79 years in the general population provided evidence of an association between MAP and NAFLD, findings that may have implications for public health policy development. Our study found that MAP had a non-linear positive correlation with NAFLD, and when MAP was between 85 and 95 mmHg, the risk of NAFLD neither increased nor decreased, i.e., there was a transient saturation effect interval. After further RCS analysis according to age stratification, we found that this special saturation effect interval can also be observed in the young and middle-aged population and the middle-aged and elderly population, while in the elderly population, there was a U-shaped curve association between MAP and NAFLD, where the lowest point was approximately 90 mmHg, and both low and high MAP increased the risk of developing NAFLD.
The current study extended previous findings in several ways. First, the current study was the first to explore the association between MAP and NAFLD based on the general population and deeply assessed the differences in this association among different populations. To date, only one study has examined this relationship (37). In a January 2020 report by Xu and his colleagues, they reported for the first time that MAP was positively associated with NAFLD in non-obese women with normal low-density lipoprotein cholesterol levels, whereas this association was not present in non-obese men. In the current study, we also investigated the correlation between MAP and NAFLD in both sexes in subgroups. The results showed that MAP was independently associated with NAFLD in both sexes, and there was no significant difference in the risk of MAP-related NAFLD between the sexes (P-interaction = 0.601). In addition, we further evaluated the variation of the association between MAP and NAFLD in non-obese people and overweight/obese people. The results showed that although the risk of NAFLD related to MAP was relatively higher in non-obese people (OR: 1.36 vs. 1.24), the interaction test results suggested that no significant difference was found. Considering that the population surveyed in Xu et al.'s study has great particularity, the results of their study are limited in terms of extrapolation. In contrast, the present study was based on a general population and the results should be more reliable after implementing a rigorous statistical adjustment strategy and performing several sensitivity analyses.
Second, our study enriched the evidence for MAP in epidemiology. MAP is known to be defined as the mean blood pressure throughout the cardiac cycle and is a major driver of vital organ perfusion (8, 9). In a large number of early studies, MAP has been shown to be a reliable tool for assessing poor prognosis in critically ill patients and has been widely recommended in critical care medicine, surgery, and obstetrics and gynecology (11–17). And in recent years, MAP started to be mentioned in some epidemiological studies as well. Several studies pointed out that MAP was closely associated with diabetes (21) and was a predictor of cardiovascular events (38). More epidemiological investigations subsequently revealed that MAP can also be used to assess the risk of developing various chronic diseases such as atherosclerosis (18), chronic kidney disease (22, 23), and metabolic syndrome (24). All these research evidence supported that MAP not only has good application value in critical and severe cases but also should gradually receive attention in the epidemiological investigation. Our findings further enriched the references for the application of MAP in epidemics.
Third, the current study provided some useful information through further stratified analysis and RCS analysis. According to the results of the stratified analysis, we found that MAP-related NAFLD risk appeared to be influenced only by age (P-interaction = 0.002), but not by sex, BMI, exercise habits, drinking status, or smoking status (P-interaction > 0.05); in the results of the age-stratified analysis, the risk of MAP-associated NAFLD was significantly higher in the young and middle-aged population and the middle-aged and elderly population compared to the elderly population. The occurrence of this result is understandable in our opinion, because when age increases beyond 60 years, there is a gradual decrease in cardiac and vascular compliance and an increase in arterial wall stiffness, followed by a significant decrease in DBP (39, 40). While MAP is a composite of SBP and DBP, calculated as 1/3SBP + 2/3DBP (19), it can be seen that the contribution of DBP to the composition of MAP is greater. When DBP decreases significantly in older adults, MAP will also decrease significantly, and subsequently, MAP-related NAFLD risk is lower in data performance than in young and middle-aged populations. Similar findings were reported in a study by Wu et al. (19). In the study by Wu et al., they analyzed the association between MAP and diabetes and showed that the risk of MAP-related diabetes was progressively lower with increasing age (P-interaction < 0.001). Although these findings based on age stratification were similar, and even seemed to be somewhat explained by the evidence in the existing literature, considering the large blood pressure variability in the elderly population (41, 42), it may interfere with the study of the association between MAP and NAFLD in the elderly population. To address this issue, we further fitted the dose-response relationship curves between MAP and NAFLD in different age groups, and the results showed that in the young and middle-aged and the middle-aged and elderly populations, there would be a transient plateau in the risk of NAFLD when MAP was between 85 and 95 mmHg; while in the elderly population, there was a U-shaped curve association between MAP and NAFLD, with the lowest point being about 90 mmHg, and both low and high MAP would increase the risk of NAFLD. The above RCS analysis results provided new explanations for the prevention of NAFLD risk in different age groups. Combining the results of stratified analysis and RCS analysis, we suggested that it is appropriate to maintain MAP below 80–95 mmHg in the young and middle-aged population (25), while it may be appropriate to maintain MAP at 90 ± 10 mmHg in the elderly population.
Study strengths and limitations
Several strengths of the current study are worth mentioning: first, MAP is a simple and easily understood measurement parameter, and for the first time we have identified the potential clinical use of this parameter in assessing NAFLD risk in the general population. Second, the current study assessed for the first time the non-linear association between MAP and NAFLD and the differences across different populations, and these findings provided useful reference material for subsequent studies and clinical applications. Third, the participants in the current study came from physical examination centers and had a large sample size, so the results of this study were more suitable for popularization among the general public, had good external applicability, and had a high reference value.
There are some limitations of the current study that need to be mentioned: The first and most important point was that the study cannot make a causal inference between MAP and NAFLD, because it was a cross-sectional design. Second, it is about the diagnosis of NAFLD. Combined with previous experience, the use of color Doppler ultrasound for the diagnosis of NAFLD may miss approximately 30% of patients with mild hepatic steatosis (43); in the current study, only 2,507 (17.59%) subjects were diagnosed with NAFLD at baseline, significantly lower than the global or Asian average prevalence of NAFLD (1, 3). It should be noted, however, that the current study analyzed the association between MAP and NAFLD at a much lower prevalence of NAFLD, which rather further validated the stability of the findings of the current study. Third, the current study population is from Japan, and regional and ethnic limitations exist (3, 44), and more studies based on different ethnicities and countries are needed. Fourth, as with all observational studies, the current study must inevitably be subject to residual confounding because the observed covariates are finite and the risk and protective factors are relatively infinite (45). However, the current study performed rigorous statistical adjustments as well as sensitivity analyses whenever possible, and the findings can be considered relatively reliable at this point. Fifth, calculating non-invasive fibrosis scores (such as NAFLD fibrosis score, Fibrosis-4 index, aspartate transaminase-to-platelet ratio index, etc.) to determine the characteristics of the patient cohort is highly beneficial for the current study in the absence of elastography imaging; However, due to the lack of some parameters for calculating the non-invasive fibrosis score in this dataset, further staging information of liver fibrosis could not be provided in the current study. Sixth, only patients with alcoholic fatty liver disease and viral hepatitis were excluded from the current study, which may lead to potential selection bias because there are many competing causes of liver disease, including autoimmune hepatitis, Wilson's disease, alpha-1-antitrypsin disease, and hemochromatosis.
Conclusion
We observed a non-linear positive correlation between MAP and NALFD in the general population in a large NAGALA sample, where a transient saturation effect interval emerged for the risk of NAFLD when MAP was between 85 and 95 mmHg; while in the elderly population, there was a U-shaped curve association between MAP and NAFLD, with both low and high MAP increasing the risk of NAFLD. These new findings further enriched the evidence for MAP in epidemiology and provided new ideas for the prevention of NAFLD.
Data availability statement
The datasets presented in this study can be found in online repositories. The names of the repository/repositories and accession number(s) can be found in the article/Supplementary Material.
Ethics statement
The studies involving humans were approved by the Ethics Committee of Jiangxi Provincial People’s Hospital. The studies were conducted in accordance with the local legislation and institutional requirements. The Ethics Committee/institutional review board waived the requirement of written informed consent for participation from the participants or the participants’ legal guardians/next of kin because the current data set has been de-identified.
Author contributions
XL: Data curation, Formal analysis, Validation, Writing – original draft. HY: Data curation, Formal analysis, Validation, Writing – original draft. GX: Data curation, Formal analysis, Validation, Writing – original draft. MK: Writing – review & editing. GS: Writing – review & editing. YZ: Conceptualization, Supervision, Writing – review & editing.
Funding
The author(s) declare financial support was received for the research, authorship, and/or publication of this article.
This work was supported by Natural Science Foundation of Jiangxi Province [No. 20232BAB216004 to YZ].
Acknowledgments
We are very grateful to Okamura et al. for sharing scientific research data.
Conflict of interest
The authors declare that the research was conducted in the absence of any commercial or financial relationships that could be construed as a potential conflict of interest.
Publisher's note
All claims expressed in this article are solely those of the authors and do not necessarily represent those of their affiliated organizations, or those of the publisher, the editors and the reviewers. Any product that may be evaluated in this article, or claim that may be made by its manufacturer, is not guaranteed or endorsed by the publisher.
Supplementary material
The Supplementary Material for this article can be found online at: https://www.frontiersin.org/articles/10.3389/fcvm.2023.1266879/full#supplementary-material
References
1. Cotter TG, Rinella M. Nonalcoholic fatty liver disease 2020: the state of the disease. Gastroenterology. (2020) 158(7):1851–64. doi: 10.1053/j.gastro.2020.01.052
2. Wang XJ, Malhi H. Nonalcoholic fatty liver disease. Ann Intern Med. (2018) 169(9):ITC65–80. doi: 10.7326/AITC201811060
3. Younossi ZM, Koenig AB, Abdelatif D, Fazel Y, Henry L, Wymer M. Global epidemiology of nonalcoholic fatty liver disease-meta-analytic assessment of prevalence, incidence, and outcomes. Hepatology. (2016) 64(1):73–84. doi: 10.1002/hep.28431
4. Estes C, Anstee QM, Arias-Loste MT, Bantel H, Bellentani S, Caballeria J, et al. Modeling NAFLD disease burden in China, France, Germany, Italy, Japan, Spain, United Kingdom, and United States for the period 2016–2030. J Hepatol. (2018) 69(4):896–904. doi: 10.1016/j.jhep.2018.05.036
5. Estes C, Razavi H, Loomba R, Younossi Z, Sanyal AJ. Modeling the epidemic of nonalcoholic fatty liver disease demonstrates an exponential increase in burden of disease. Hepatology. (2018) 67(1):123–33. doi: 10.1002/hep.29466
6. Majumdar A, Verbeek J, Tsochatzis EA. Non-alcoholic fatty liver disease: current therapeutic options. Curr Opin Pharmacol. (2021) 61:98–105. doi: 10.1016/j.coph.2021.09.007
7. Suárez M, Boqué N, Del Bas JM, Mayneris-Perxachs J, Arola L, Caimari A. Mediterranean diet and multi-ingredient-based interventions for the management of non-alcoholic fatty liver disease. Nutrients. (2017) 9(10):1052. doi: 10.3390/nu9101052
8. Grillo A, Salvi P, Furlanis G, Baldi C, Rovina M, Salvi L, et al. Mean arterial pressure estimated by brachial pulse wave analysis and comparison with currently used algorithms. J Hypertens. (2020) 38(11):2161–8. doi: 10.1097/HJH.0000000000002564
9. Wang D, Wang J, Liu J, Qin Y, Lou P, Zhang Y, et al. The role of cumulative mean arterial pressure levels in first stroke events among adults with hypertension: a 10-year prospective cohort study. Clin Epidemiol. (2022) 14:665–76. doi: 10.2147/CLEP.S359284
10. Safar ME. Pulse pressure in essential hypertension: clinical and therapeutical implications. J Hypertens. (1989) 7(10):769–76. doi: 10.1097/00004872-198910000-00001
11. Gao Y, Wang Q, Li J, Zhang J, Li R, Sun L, et al. Impact of mean arterial pressure fluctuation on mortality in critically ill patients. Crit Care Med. (2018) 46(12):e1167–74. doi: 10.1097/CCM.0000000000003435
12. Melgarejo JD, Yang WY, Thijs L, Li Y, Asayama K, Hansen TW, et al. Association of fatal and nonfatal cardiovascular outcomes with 24-hour mean arterial pressure. Hypertension. (2021) 77(1):39–48. doi: 10.1161/HYPERTENSIONAHA.120.14929
13. Beloncle F, Radermacher P, Guerin C, Asfar P. Mean arterial pressure target in patients with septic shock. Minerva Anestesiol. (2016) 82(7):777–84.26967829
14. Song Q, Li J, Jiang Z. Provisional decision-making for perioperative blood pressure management: a narrative review. Oxid Med Cell Longev. (2022) 2022:5916040. doi: 10.1155/2022/5916040
15. Burstein B, Tabi M, Barsness GW, Bell MR, Kashani K, Jentzer JC. Association between mean arterial pressure during the first 24 h and hospital mortality in patients with cardiogenic shock. Crit Care. (2020) 24(1):513. doi: 10.1186/s13054-020-03217-6
16. Cnossen JS, Vollebregt KC, de Vrieze N, ter Riet G, Mol BW, Franx A, et al. Accuracy of mean arterial pressure and blood pressure measurements in predicting pre-eclampsia: systematic review and meta-analysis. Br Med J. (2008) 336(7653):1117–20. doi: 10.1136/bmj.39540.522049.BE
17. Zhu J, Zhang J, Syaza Razali N, Chern B, Tan KH. Mean arterial pressure for predicting preeclampsia in Asian women: a longitudinal cohort study. BMJ Open. (2021) 11(8):e046161. doi: 10.1136/bmjopen-2020-046161
18. Sheng S. Mean arterial pressure and arterial stiffness in Japanese population: a secondary analysis based on a cross-sectional study. Blood Press Monit. (2020) 25(6):310–7. doi: 10.1097/MBP.0000000000000471
19. Wu Y, Hu H, Cai J, Chen R, Zuo X, Cheng H, et al. Association of mean arterial pressure with 5-year risk of incident diabetes in Chinese adults: a secondary population-based cohort study. BMJ Open. (2022) 12(9):e048194. doi: 10.1136/bmjopen-2020-048194
20. Guo C, Qin P, Li Q, Zhang D, Tian G, Liu D, et al. Association between mean arterial pressure and risk of type 2 diabetes mellitus: the rural Chinese cohort study. Prim Care Diabetes. (2020) 14(5):448–54. doi: 10.1016/j.pcd.2020.01.007
21. Janghorbani M, Amini M. Comparison of systolic and diastolic blood pressure with pulse pressure and mean arterial pressure for prediction of type 2 diabetes: the isfahan diabetes prevention study. Endokrynol Pol. (2011) 62(4):324–30. doi: 10.1016/j.diabres.2011.03.013
22. Dionne JM, Jiang S, Ng DK, Flynn JT, Mitsnefes MM, Furth SL, et al. Mean arterial pressure and chronic kidney disease progression in the CKiD cohort. Hypertension. (2021) 78(1):65–73. doi: 10.1161/HYPERTENSIONAHA.120.16692
23. Yang H, Guo X, Zhang X, Li Z, Yu S, Zheng L, et al. The relationship between mean arterial pressure and decreased glomerular filtration rate in rural areas of Northeast China. BMC Nephrol. (2015) 16:137. doi: 10.1186/s12882-015-0115-4
24. Hsu CH, Chang JB, Liu IC, Lau SC, Yu SM, Hsieh CH, et al. Mean arterial pressure is better at predicting future metabolic syndrome in the normotensive elderly: a prospective cohort study in Taiwan. Prev Med. (2015) 72:76–82. doi: 10.1016/j.ypmed.2014.12.036
25. Avanzini F, Alli C, Boccanelli A, Chieffo C, Franzosi MG, Geraci E, et al. High pulse pressure and low mean arterial pressure: two predictors of death after a myocardial infarction. J Hypertens. (2006) 24(12):2377–85. doi: 10.1097/01.hjh.0000251897.40002.bf
26. Wei FF, Wu Y, Xue R, Liu X, He X, Dong B, et al. Clinical significance of mean and pulse pressure in patients with heart failure with preserved ejection fraction. Hypertension. (2022) 79(1):241–50. doi: 10.1161/HYPERTENSIONAHA.121.17782
27. Zheng L, Sun Z, Li J, Yu J, Wei Y, Zhang X, et al. Mean arterial pressure: a better marker of stroke in patients with uncontrolled hypertension in rural areas of China. Intern Med. (2007) 46(18):1495–500. doi: 10.2169/internalmedicine.46.0178
28. Domanski MJ, Mitchell GF, Norman JE, Exner DV, Pitt B, Pfeffer MA. Independent prognostic information provided by sphygmomanometrically determined pulse pressure and mean arterial pressure in patients with left ventricular dysfunction. J Am Coll Cardiol. (1999) 33(4):951–8. doi: 10.1016/s0735-1097(98)00679-2
29. Okamura T, Hashimoto Y, Hamaguchi M, Obora A, Kojima T, Fukui M. Data from: Ectopic fat obesity presents the greatest risk for incident type 2 diabetes: a population-based longitudinal study [Dataset]. Dryad. (2019). doi: 10.5061/dryad.8q0p192
30. Okamura T, Hashimoto Y, Hamaguchi M, Obora A, Kojima T, Fukui M. Ectopic fat obesity presents the greatest risk for incident type 2 diabetes: a population-based longitudinal study. Int J Obes. (2019) 43(1):139–48. doi: 10.1038/s41366-018-0076-3
31. Choi JH, Sohn W, Cho YK. The effect of moderate alcohol drinking in nonalcoholic fatty liver disease. Clin Mol Hepatol. (2020) 26(4):662–9. doi: 10.3350/cmh.2020.0163
32. Hashimoto Y, Hamaguchi M, Kojima T, Ohshima Y, Ohbora A, Kato T, et al. Modest alcohol consumption reduces the incidence of fatty liver in men: a population-based large-scale cohort study. J Gastroenterol Hepatol. (2015) 30(3):546–52. doi: 10.1111/jgh.12786
33. Hamaguchi M, Kojima T, Itoh Y, Harano Y, Fujii K, Nakajima T, et al. The severity of ultrasonographic findings in nonalcoholic fatty liver disease reflects the metabolic syndrome and visceral fat accumulation. Am J Gastroenterol. (2007) 102(12):2708–15. doi: 10.1111/j.1572-0241.2007.01526.x
34. Kim JH. Multicollinearity and misleading statistical results. Korean J Anesthesiol. (2019) 72(6):558–69. doi: 10.4097/kja.19087
35. Fitchett EJA, Seale AC, Vergnano S, Sharland M, Heath PT, Saha SK, et al. Strengthening the reporting of observational studies in epidemiology for newborn infection (STROBE-NI): an extension of the STROBE statement for neonatal infection research. Lancet Infect Dis. (2016) 16(10):e202–13. doi: 10.1016/S1473-3099(16)30082-2
36. Durrleman S, Simon R. Flexible regression models with cubic splines. Stat Med. (1989) 8(5):551–61. doi: 10.1002/sim.4780080504
37. Xu S, Chen L, Hong D, Yang L, Li X, Wang X. Mean arterial pressure is related to incident nonalcoholic fatty liver disease among the nonobese female with normal low-density lipoprotein cholesterol levels: a large cohort study in China. Gastroenterol Res Pract. (2020) 2020:3580840. doi: 10.1155/2020/3580840
38. Hadaegh F, Shafiee G, Hatami M, Azizi F. Systolic and diastolic blood pressure, mean arterial pressure and pulse pressure for prediction of cardiovascular events and mortality in a Middle Eastern population. Blood Press. (2012) 21(1):12–8. doi: 10.3109/08037051.2011.585808
39. Franklin SS, Gustin W 4th, Wong ND, Larson MG, Weber MA, Kannel WB, et al. Hemodynamic patterns of age-related changes in blood pressure. The framingham heart study. Circulation. (1997) 96(1):308–15. doi: 10.1161/01.cir.96.1.308
40. Wang R, Vetrano DL, Liang Y, Qiu C. The age-related blood pressure trajectories from young-old adults to centenarians: a cohort study. Int J Cardiol. (2019) 296:141–8. doi: 10.1016/j.ijcard.2019.08.011
41. Bencivenga L, De Souto Barreto P, Rolland Y, Hanon O, Vidal JS, Cestac P, et al. Blood pressure variability: a potential marker of aging. Ageing Res Rev. (2022) 80:101677. doi: 10.1016/j.arr.2022.101677
42. Pan F, He P, Pu X, Gao H, Chen F, Feng J, et al. Influence of aging and increased blood pressure on oscillometric cuff pressure waveform characteristics. J Hypertens. (2021) 39(11):2157–63. doi: 10.1097/HJH.0000000000002921
43. McMahon DM, Burch JB, Youngstedt SD, Wirth MD, Hardin JW, Hurley TG, et al. Relationships between chronotype, social jetlag, sleep, obesity and blood pressure in healthy young adults. Chronobiol Int. (2019) 36(4):493–509. doi: 10.1080/07420528.2018.1563094
44. Schwimmer JB, Celedon MA, Lavine JE, Salem R, Campbell N, Schork NJ, et al. Heritability of nonalcoholic fatty liver disease. Gastroenterology. (2009) 136(5):1585–92. doi: 10.1053/j.gastro.2009.01.050
Keywords: mean arterial blood pressure, MAP, non-alcoholic fatty liver disease, general population, NAGALA
Citation: Li X, Yang H, Xie G, Kuang M, Sheng G and Zou Y (2023) Association of mean arterial pressure with non-alcoholic fatty liver disease: results from the NAGALA study. Front. Cardiovasc. Med. 10:1266879. doi: 10.3389/fcvm.2023.1266879
Received: 16 August 2023; Accepted: 10 October 2023;
Published: 20 October 2023.
Edited by:
Teresa Vanessa Fiorentino, Magna Græcia University, ItalyReviewed by:
Francesca Cinti, Agostino Gemelli University Polyclinic (IRCCS), ItalyAlfredo Caturano, University of Campania Luigi Vanvitelli, Italy
© 2023 Li, Yang, Xie, Kuang, Sheng and Zou. This is an open-access article distributed under the terms of the Creative Commons Attribution License (CC BY). The use, distribution or reproduction in other forums is permitted, provided the original author(s) and the copyright owner(s) are credited and that the original publication in this journal is cited, in accordance with accepted academic practice. No use, distribution or reproduction is permitted which does not comply with these terms.
*Correspondence: Yang Zou anh5eHl6eUAxNjMuY29t
†These authors have contributed equally to this work and share first authorship