Abstract
Introduction:
Despite ongoing efforts to minimize sex bias in diagnosis and treatment of acute coronary syndrome (ACS), data still shows outcomes differences between sexes including higher risk of all-cause mortality rate among females. Hence, the aim of the current study was to examine sex differences in ACS in-hospital mortality, and to implement artificial intelligence (AI) models for prediction of in-hospital mortality among females with ACS.
Methods:
All ACS patients admitted to a tertiary care center intensive cardiac care unit (ICCU) between July 2019 and July 2023 were prospectively enrolled. The primary outcome was in-hospital mortality. Three prediction algorithms, including gradient boosting classifier (GBC) random forest classifier (RFC), and logistic regression (LR) were used to develop and validate prediction models for in-hospital mortality among females with ACS, using only available features at presentation.
Results:
A total of 2,346 ACS patients with a median age of 64 (IQR: 56–74) were included. Of them, 453 (19.3%) were female. Female patients had higher prevalence of NSTEMI (49.2% vs. 39.8%, p < 0.001), less urgent PCI (<2 h) rates (40.2% vs. 50.6%, p < 0.001), and more complications during admission (17.7% vs. 12.3%, p = 0.01). In-hospital mortality occurred in 58 (2.5%) patients [21/453 (5%) females vs. 37/1,893 (2%) males, HR = 2.28, 95% CI: 1.33–3.91, p = 0.003]. GBC algorithm outscored the RFC and LR models, with area under receiver operating characteristic curve (AUROC) of 0.91 with proposed working point of 83.3% sensitivity and 82.4% specificity, and area under precision recall curve (AUPRC) of 0.92. Analysis of feature importance indicated that older age, STEMI, and inflammatory markers were the most important contributing variables.
Conclusions:
Mortality and complications rates among females with ACS are significantly higher than in males. Machine learning algorithms for prediction of ACS outcomes among females can be used to help mitigate sex bias.
Introduction
Although mortality associated with Acute Coronary Syndrome (ACS) has decreased in recent years thanks to improvements in prevention as well as better pharmacologic and interventional therapies, ACS and Ischemic Heart Disease (IHD) continue to be a major cause of death and disability (1–3). Recent epidemiological studies point out that the burden of this syndrome is increasing with more than 7 million people diagnosed with ACS annually worldwide (4).
Sexbiases in ACS have received increasing attention in recent decades, with numerous studies reporting significant sex-based differences in diagnosis, management, and outcomes of ACS patients (5–9). Contemporary data demonstrates that in-hospital mortality rates and the risk of recurrent cardiovascular events are higher among females with ACS when compared with males (10–12). Several factors contribute to this disparity, including increased time between symptom onset and diagnosis (13), less aggressive treatment upon diagnosis (14), and poorer in-hospital quality of care (15).
Artificial Intelligence (AI) algorithms have revolutionized healthcare by addressing a wide range of challenges, particularly in predictive tasks (16, 17). The use of AI in cardiology has been increasingly prominent, encompassing the prediction of cardiovascular disease outcomes, non-invasive diagnostics, and identification and risk assessment of life-threatening conditions (18, 19). Hence, we sought to investigate and report sex disparities in the management and outcomes of ACS patients at a tertiary care medical center using an AI-based algorithms. The aim of the current trial was to provide a proof of concept for the use of AI algorithms that are specifically designed to predict in-hospital mortality among females with ACS, and to highlight their possible role in reducing sex bias among this population of patients.
Methods
Study population
All patients diagnosed with ACS who were admitted to a tertiary care intensive cardiac care unit (ICCU) at Shaare Zedek Medical Center between July 2019 and July 2023 were prospectively recruited. The diagnosis of ACS was based on clinical symptoms of myocardial ischemia, with or without new ECG ischemic changes, and with or without acute elevation in high-sensitivity troponin I (hs-cTnI) concentrations, according to the ESC guidelines for ACS (20).
Data collection
Data were anonymously documented in the ICCU by the local coordinator and prospectively submitted into an electronic case report form (eCRF). Data were checked for accuracy and out-of-range values by the coordinating unit. Demographic data, presenting symptoms, comorbid conditions, physical examination, and laboratory data were systematically recorded.
The Institutional review board approved the study based on strict maintenance of participants’ anonymity by de-identifying during database analysis. No individual consent was obtained. Moreover, the authors have no conflicts of interest to declare. No funding was applied to the study. All methods were performed in accordance with the relevant guidelines and regulations.
Study outcomes
The primary outcome was in-hospital mortality that was recorded as an outcome for every ACS patient.
Development and evaluation of machine-learning models
For the development of the model, only variables available at patient presentation were included, so features like culprit vessel and angiographic results were not used for model construction. The entire variables were eligible for selection in the predictive models, and no feature selection method was applied before the models training. Variables that contained missing values were not included in the analysis and are not reported here, all of the reported variables did not had missing values. The cohort of female patients with ACS was partitioned into distinct non-overlapping sets, with 70% of patients allocated to the training-validation set, and 30% assigned to the test set. The training-validation set was used for training and optimization using 5-fold cross validation. The selection of patients for each set was conducted randomly. To address the imbalance between labels, we down-sampled the training-validation set of patients who did not experience mortality during admission. All models development and parameter selection procedures were carried out exclusively on the training and validation sets, and the ultimate performance of the final model was reported based on the imbalanced test set. Our analysis includes three prediction algorithms, including gradient boosting classifier (GBC), random forest classifier (RFC), and logistic regreesion (LR). The models were optimized through a Bayesian optimization process on a set of model-specific parameters. The optimization process was carried out using a 5-fold cross-validation technique, and the best iterations were selected based on the mean area under the curve of the receiver operating characteristics curve (AUROC). We further evaluated the models based on various prediction scores including sensitivity, specificity, positive predictive value (PPV), and area under precision recall curve (AUPRC). In addition to the ROC curve, we plotted the PPV against the sensitivity (precision–recall curve). This curve enabled us to assess the clinical utility and added value of the proposed model. In order to highlight the features that influence the forecasts generated by the GBC, SHAP values (21) were calculated. SHAP values delineate the decomposition of prediction outcomes for each individual sample into the contributions attributable to distinct constituent feature values. This decomposition process is achieved through the estimation of variations between models built upon subsets of the feature space. Through the process of sample-wise averaging, SHAP values provide an assessment of the impact of each feature on the aggregate model predictions. The predictive model was developed, validated, and evaluated using Python programming language version 3.6 (Python Software Foundation).
Statistical analysis
Continuous variables were expressed as mean ± standard deviation if normally distributed or median with interquartile range if skewed. Categorical variables were presented as frequency (%). Continuous data were compared with the Student's t-test and Mann–Whitney test for comparison of normally and non-normally distributed continuous variables, respectively. Categorical data were compared with the use of the chi-square test or Fisher exact test.
All statistical analyses were performed using R software version 3.4.4 (R Foundation for Statistical Computing). An association was considered statistically significant for a two-sided P value of less than 0.05.
Results
Baseline characteristics
The study population comprised of 2,346 patients, with a median age of 64 [interquartile range (IQR): 56–74]. Of these patients, 453 (19.3%) were female. A total of 1,231 (52.5%) patients presented with ST-segment elevation myocardial infraction (STEMI), 976 (41.6%) presented with non-ST elevation myocardial infraction (NSTEMI), and 139 (5.9%) presented with unstable angina pectoris (UAP), as depicted in Figure 1. Stratification of baseline characteristics by sex revealed that female patients were predominantly older [median age 72 (IQR: 63–81) vs. median age 63 (IQR: 55–72), p < 0.001], less overweight (mean BMI 27.4 vs. 28.1, p = 0.033), had higher prevalence of NSTEMI (49.2% vs. 39.8%, p < 0.001), hypertension (68.2% vs. 57.4%, p < 0.001), and atrial fibrillation (8.6% vs. 4.6%, p = 0.003). Interestingly, females with ACS had less history of prior MI (23% vs. 34.1%, p < 0.001), and less family history of coronary artery disease (4.9% vs. 11.4%, p = 0.001). Baseline characteristics of ACS patients stratified by sex are present in Table 1.
Figure 1
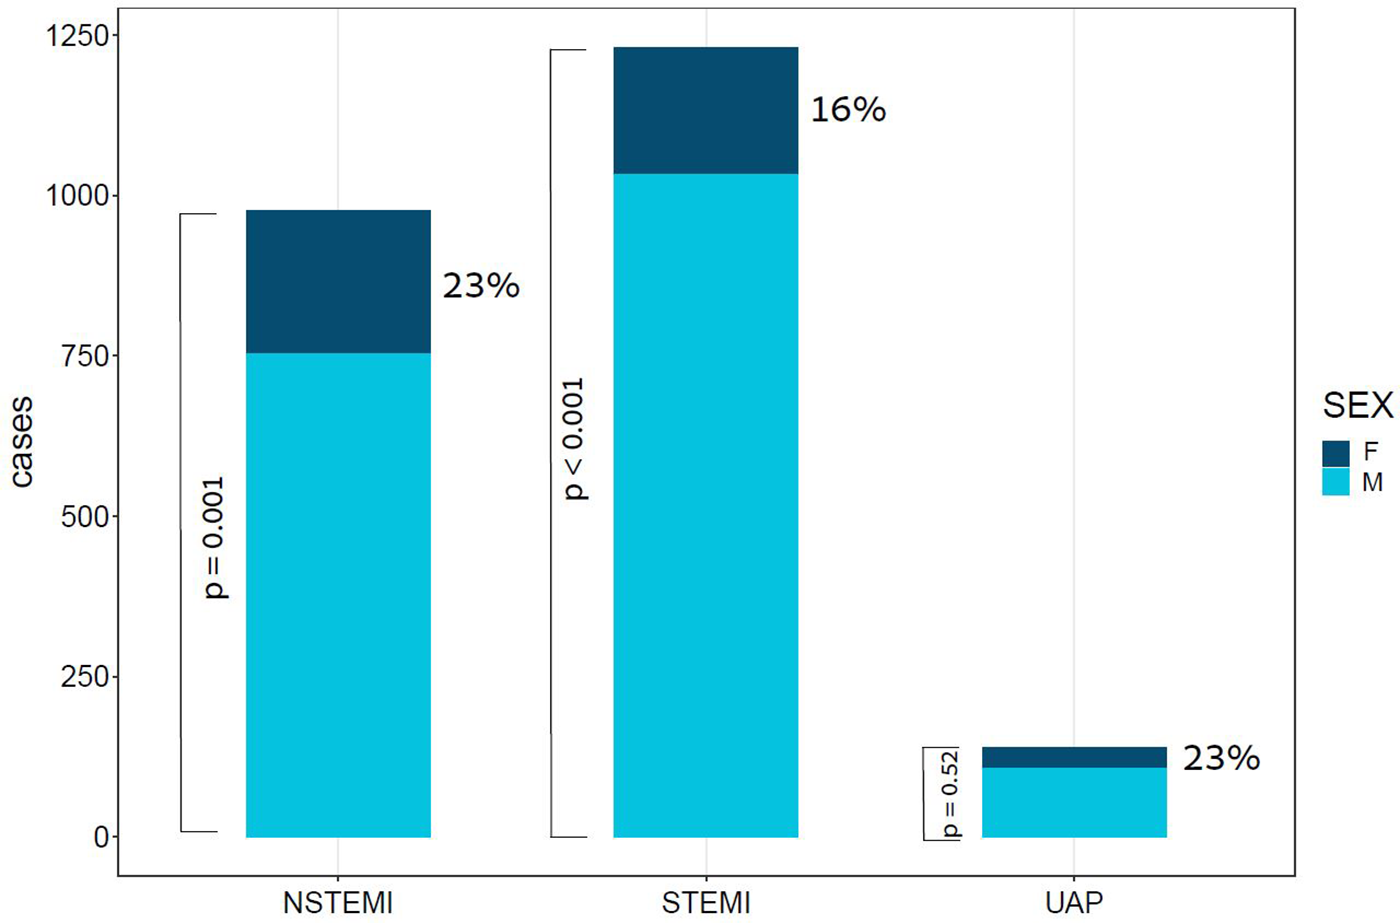
Bar plot of ACS cases by subtype and Sex. This bar plot demonstrates the relative portion of female patients in each of the subtypes of ACS. ACS, acute coronary syndrome; F, females; M, males; NSTEMI, non-ST segment elevation myocardial infraction; STEMI, ST segment elevation myocardial infraction; UAP, unstable angina pectoris; p value for the difference between sexes in STEMI < 0.001, in NSTEMI = 0.001, and in UAP = 0.52.
Table 1
| Variable | Females (N = 453) |
Males (N = 1,893) |
Overall (N = 2,346) |
P-value |
|---|---|---|---|---|
| Age (years) | 72 (63–81) | 63 (55–72) | 64 (56–74) | <0.001 |
| Height (m) | 1.61 ± 0.06 | 1.72 ± 0.07 | 1.70 ± 0.08 | <0.001 |
| Weight (Kg) | 70.8 ± 14.7 | 83.7 ± 15.8 | 81.2 ± 16.4 | <0.001 |
| BMI (kg/m2) | 27.4 ± 5.1 | 28.1 ± 5 | 28.0 ± 5 | 0.0334 |
| Admission length (days) | 2.35 ± 2 | 2.32 ± 1.8 | 2.33 ± 1.8 | 0.97 |
| ACS subtype | ||||
| STEMI—no. (%) | 198 (43.7%) | 1,033 (54.6%) | 1,231 (52.5%) | <0.001 |
| NSTEMI—no. (%) | 223 (49.2%) | 753 (39.8%) | 976 (41.6%) | 0.00121 |
| UAP—no. (%) | 32 (7.1%) | 107 (5.7%) | 139 (5.9%) | 0.52 |
| HTN—no. (%) | 309 (68.2%) | 1,086 (57.4%) | 1,395 (59.5%) | <0.001 |
| DLP—no. (%) | 260 (57.4%) | 1,104 (58.3%) | 1,364 (58.1%) | 0.938 |
| DM—no. (%) | 188 (41.5%) | 707 (37.3%) | 895 (38.2%) | 0.263 |
| PAD—no. (%) | 19 (4.2%) | 82 (4.3%) | 101 (4.3%) | 0.992 |
| CHF—no. (%) | 24 (5.3%) | 103 (5.4%) | 127 (5.4%) | 0.993 |
| PHTN—no. (%) | 9 (2.0%) | 21 (1.1%) | 30 (1.3%) | 0.328 |
| AFIB—no. (%) | 39 (8.6%) | 88 (4.6%) | 127 (5.4%) | 0.0037 |
| Prior MI—no. (%) | 104 (23.0%) | 646 (34.1%) | 750 (32.0%) | <0.001 |
| Prior CABG—no. (%) | 21 (4.6%) | 116 (6.1%) | 137 (5.8%) | 0.477 |
| COPD—no. (%) | 31 (6.8%) | 103 (5.4%) | 134 (5.7%) | 0.513 |
| CKD—no. (%) | 36 (7.9%) | 152 (8.0%) | 188 (8.0%) | 0.998 |
| RRT—no. (%) | 12 (2.6%) | 29 (1.5%) | 41 (1.7%) | 0.265 |
| Prior CVA—no. (%) | 33 (7.3%) | 113 (6.0%) | 146 (6.2%) | 0.582 |
| Cognitive_Decline—no. (%) | 11 (2.4%) | 48 (2.5%) | 59 (2.5%) | 0.991 |
| Debilitated—no. (%) | 8 (1.8%) | 27 (1.4%) | 35 (1.5%) | 0.866 |
| Malignancy—no. (%) | 42 (9.3%) | 96 (5.1%) | 138 (5.9%) | 0.00296 |
| Anemia—no. (%) | 21 (4.6%) | 40 (2.1%) | 61 (2.6%) | 0.0101 |
| Smoking—no. (%) | 74 (16.3%) | 842 (44.5%) | 916 (39.0%) | <0.001 |
| Family History of CAD—no. (%) | 22 (4.9%) | 216 (11.4%) | 238 (10.1%) | 0.001 |
| EF (%) | 49 (39–54) | 49 (39–51) | 49 (39–54) | 0.00529 |
| Cr (mg/dl) | 0.77 (0.62–0.99) | 0.9 (0.76–1.11) | 0.87 (0.73–1.1) | 0.207 |
| Albumin (g/dl) | 3.8 (3.5–4.1) | 3.9 (3.7–4.2) | 3.9 (3.6–4.2) | <0.001 |
| Peak hs-cTnI (ng/l) | 5,790 (966–37,400) | 11,100 (1,690–44,100) | 10,000 (1,530–42,700) | 0.889 |
| HDL (mg/dl) | 29 (28–31) | 29 (29–32) | 29 (29–32) | 0.0698 |
| LDL (mg/dl) | 97 (74–131) | 99 (76–129) | 99 (75–130) | 1 |
| CRP (mg/l) | 0.59 (0.24–1.7) | 0.49 (0.21–1.21) | 0.5 (0.21–1.3) | 1 |
| HbA1c (%) | 5.8 (5.5–6.6) | 5.8 (5.6–6.5) | 5.8 (5.6–6.5) | 0.971 |
| TSH (mIU/L) | 1.76 (1.1–2.7) | 1.61 (1–2.4) | 1.63 (1–2.46) | 0.00213 |
| FT4 (ng/dl) | 1 (0.98–1.15) | 1 (0.93–1.11) | 1 (0.94–1.12) | <0.001 |
| WBC (K/ul) | 9.8 (7.8–13.1) | 10.3 (8.3–12.7) | 10.2 (8.2–12.8) | 0.622 |
| Hb (g/dl) | 12.5 (11.2–13.6) | 14.3 (13–15.4) | 14 (12.5–15.2) | <0.001 |
| PLT (K/ul) | 248 (202–296) | 230 (191–279) | 234 (194–284) | <0.001 |
| MPV (fl) | 10.9 (10.4–11.6) | 10.9 (10.2–11.5) | 10.9 (10.2–11.6) | 0.128 |
| IPF (%) | 4.4 (3.2–5.9) | 4.4 (3.1–5.8) | 4.4 (3.1–5.88) | 0.542 |
| Lactate (mmol/L) | 1.6 (1.4–1.9) | 1.6 (1.5–2) | 1.6 (1.5–2) | 0.903 |
| INR | 1.07 (1–1.17) | 1.09 (1–1.18) | 1.09 (1–1.17) | 0.963 |
| PTT (sec) | 31.1 (28.3–33) | 31.1 (27.6–33.4) | 31.1 (27.7–33.3) | 0.0514 |
| Fibrinogen (mg/dl) | 517 (445–589) | 484 (412–564) | 490 (418–570) | <0.001 |
| D-dimer (ng/ml) | 813 (445–1,130) | 570 (330–864) | 616 (348–864) | <0.001 |
Baseline characteristics.
Values are mean ± SD, (%), or median [Interquartile range: (Q1–Q3)] for continuous variables, and number of occurences (frequency %) for categorical variables. ACS, acute coronary syndrome; AFIB, atrial fibrillation; BMI, body mass index; CABG, coronary artery bypass graft surgery; CAD, coronary artery disease; CHF, congestive heart failure; CKD, chronic kidney disease; COPD, chronic obstructive pulmonary disease; CRP, C reactive protein; CVA, cerebro-vascular accident; DLP, dyslipidemia; DM, diabetes mellitus; EF, ejection fraction; FT4, free T4; Hb, hemoglobin; HbA1c, hemoglobin A1c (glycated hemoglobin); HDL, high density lipoprotein; hs-cTnI, high sensitivity cardiac Troponin I; INR, international normalized ratio; IPF, immature platelet fraction; LDL, low density lipoprotein; MPV, mean platelet volume; PAD, peripheral artery disease; PHTN, pulmonary hypertension; PLT, platelets count; PTT, partial thromboplastin time; RRT, renal replacement therapy; TSH, thyroid stimulating hormone; WBC, white blood cells count.
Interventions and complications during ICCU admission
Procedures that were performed during the ICCU admission course are reported in Table 2. Percutaneous coronary intervention (PCI) was performed in 1,863 (80%) patients, coronary angiography without intervention was performed in 346 (14.7%), coronary artery bypass grafting (CABG) was performed in 79 (3.4%) patients, and conservative therapy alone was assigned to only 58 (2.5%) of ACS patients. Stratification by sex demonstrated that female patients were treated more conservatively with lower urgent PCI (<2 h) rates (40.4% vs. 50.6%, p < 0.001). Rates of usage of more advanced therapies such as mechanical ventilation, intra-aortic balloon pump (IABP), Impella, and extra-corporeal membrane oxygenation (ECMO) were similar between sexes. The overall complication rate during admission was 13.3%, with more complications seen in females than in males (17.7% vs. 12.3%, p = 0.01). Females were shown to have higher rates of shock (6.4% vs. 3.1%, p = 0.003), significant bleeding [as indicated by Bleeding Academic Research Consortium (BARC) types 3 and 5] with a subsequent need for blood transfusion (2.9% vs. 1.2%, p = 0.026), and had slightly higher rates of acute renal failure (3.8% vs. 2.7%, p = 0.48). Patient complications during admission are presented in Table 3.
Table 2
| Intervention | Females (N = 453) |
Males (N = 1,893) |
Overall (N = 2,346) |
P-value |
|---|---|---|---|---|
| Urgent PCI (<2 hr)—no. (%) | 183 (40.4%) | 957 (50.6%) | 1,140 (48.6%) | <0.001 |
| PCI—no. (%) | 120 (26.5%) | 603 (31.9%) | 723 (30.8%) | 0.0849 |
| Coronary angiography—no. (%) | 109 (24.1%) | 237 (12.5%) | 346 (14.7%) | <0.001 |
| CABG—no. (%) | 17 (3.8%) | 62 (3.3%) | 79 (3.4%) | 0.974 |
| Conservative therapy—no. (%) | 24 (5.3%) | 34 (1.8%) | 58 (2.5%) | 0.1 |
| Pacemaker/ICD—no. (%) | 8 (1.8%) | 39 (2.1%) | 47 (2.0%) | 0.923 |
| CPR—no. (%) | 20 (4.4%) | 68 (3.6%) | 88 (3.8%) | 0.71 |
| Mechanical ventilation—no. (%) | 30 (6.6%) | 120 (6.3%) | 150 (6.4%) | 0.976 |
| RRT—no. (%) | 7 (1.5%) | 31 (1.6%) | 38 (1.6%) | 0.99 |
| IABP—no. (%) | 15 (3.3%) | 51 (2.7%) | 66 (2.8%) | 0.775 |
| Impella—no. (%) | 4 (0.9%) | 15 (0.8%) | 19 (0.8%) | 0.981 |
| ECMO | 3 (0.7%) | 9 (0.5%) | 12 (0.5%) | 0.882 |
Interventions during admission.
Values are mean ± SD, (%), or median [Interquartile range: (Q1–Q3)] for continuous variables, and number of occurences (frequency %) for categorical variables. CABG, coronary artery bypass graft; CPR, cardio-pulmonary resuscitation; ECMO, extra-corporeal membrane oxygenation; IABP, intra-aortic baloon pump; ICD, implantable cardioverter defibrilator; PCI, percutaneous coronary intervention; RRT, renal replacement therapy.
Table 3
| Complication | Females (N = 453) | Males (N = 1,893) | Overall (N = 2,346) | P-value |
|---|---|---|---|---|
| Any complication—no. (%) | 80 (17.7%) | 232 (12.3%) | 312 (13.3%) | 0.01 |
| Malignant arrhythmia—no. (%) | 9 (2.0%) | 43 (2.3%) | 52 (2.2%) | 0.934 |
| Shocka—no. (%) | 29 (6.4%) | 58 (3.1%) | 87 (3.7%) | 0.0033 |
| Mechanical complication—no. (%) | 4 (0.9%) | 10 (0.5%) | 14 (0.6%) | 0.679 |
| LV thrombus—no. (%) | 1 (0.2%) | 29 (1.5%) | 30 (1.3%) | 0.083 |
| ARF—no. (%) | 17 (3.8%) | 51 (2.7%) | 68 (2.9%) | 0.483 |
| Significant bleeding—no. (%) | 13 (2.9%) | 23 (1.2%) | 36 (1.5%) | 0.0364 |
| Blood transfusion—no. (%) | 13 (2.9%) | 22 (1.2%) | 35 (1.5%) | 0.0266 |
| Vascular complication—no. (%) | 3 (0.7%) | 10 (0.5%) | 13 (0.6%) | 0.942 |
Complications during admission.
Values are mean ± SD, (%), or median [Interquartile range: (Q1–Q3)] for continuous variables, and number of occurences (frequency %) for categorical variables. ARF, acute renal failure; LV, left ventricle.
any type of shock.
In-hospital mortality and models performance
In-hospital mortality was observed in 58 (2.5%) patients. The mortality rate was found to be higher among females as compared with males (5% vs. 2%, respectively, HR = 2.28, 95% CI: 1.33–3.91, p = 0.003) as presented in Figure 2. Each of the three algorithms wereevaluated on the unseen test set. The GBC outperformed the other two algorithms with AUROC of 0.91 and an optimal operational threshold affording 83.3% sensitivity and 82.4% specificity. Figure 3 illustrates the ROC curves, complete with the corresponding AUROC values. Additionally, Figure 4 presents the precision-recall curves (PRC), illustrating the Positive Predictive Value (PPV) against sensitivity. The GBC outscored RFC and LR in this parameter as well, yielding an AUPRC of 0.92. The ranking of the GBC’s most influential features is summarized in Figure 5. Notably, advanced age, presentation with STEMI, evidence of diminished nutritional status (as evidenced by low serum albumin levels), and elevated inflammatory markers, were found to be strong indicators for predicting in-hospital mortality in female ACS patients. Furthermore, elevated levels of high-sensitivity cardiac troponin I (hs-cTnI), reduced serum hemoglobin levels, and heightened lactate levels were also identified as significant contributing factors.
Figure 2
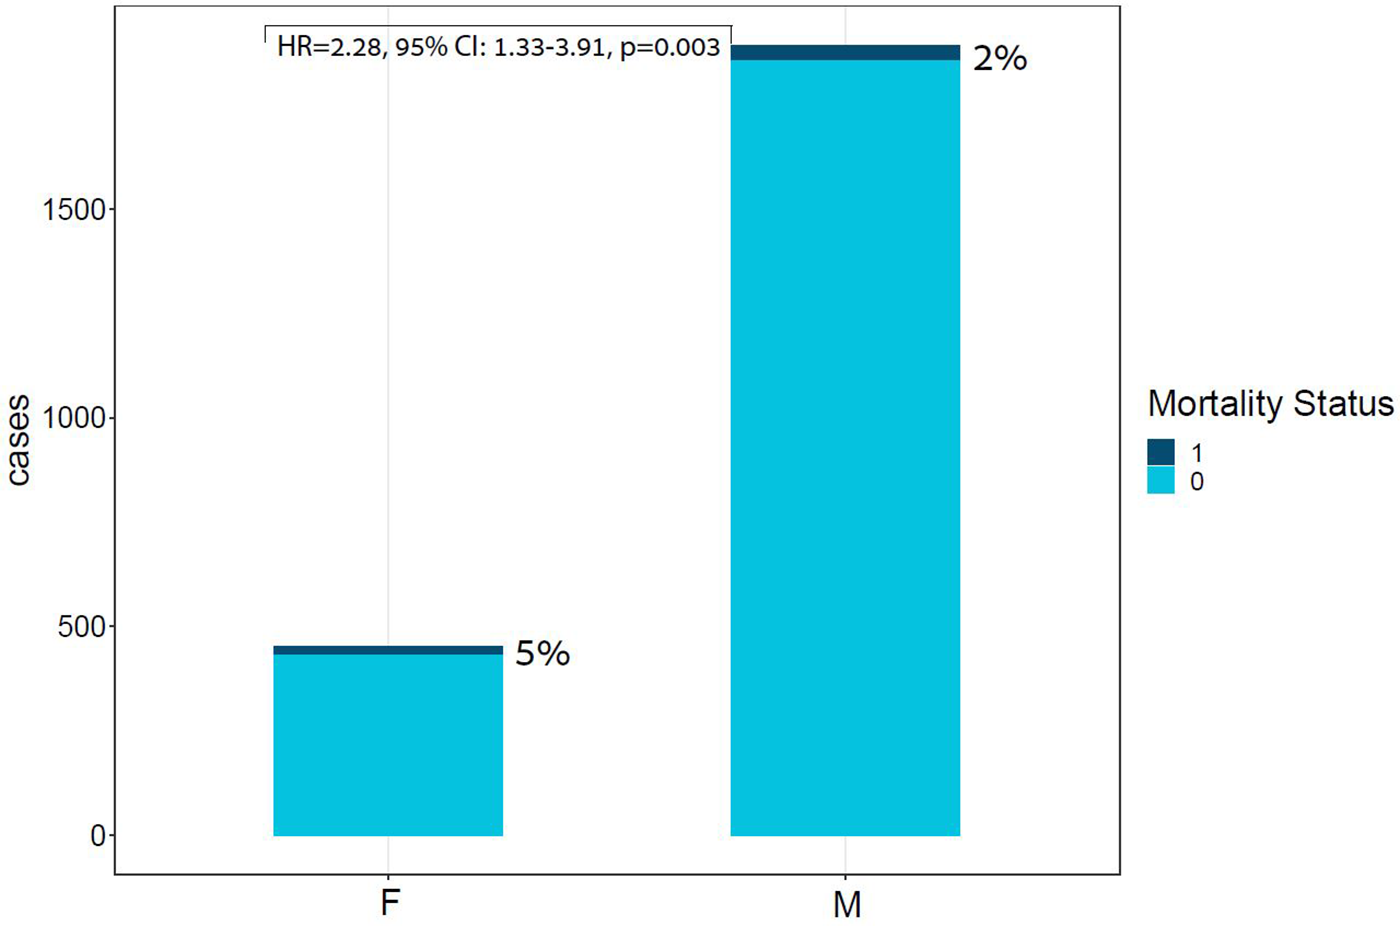
Bar plot of ACS cases by Sex and mortality Status. This bar plot demonstrates the relative portion of in-hospital mortality in each sex group, highlighting the unproportional death rates within the females subgroup. ACS, acute coronary syndrome; F, females; M, males; Unadjusted HR for sex: HR = 2.28, 95% CI: 1.33–3.91, p = 0.003.
Figure 3
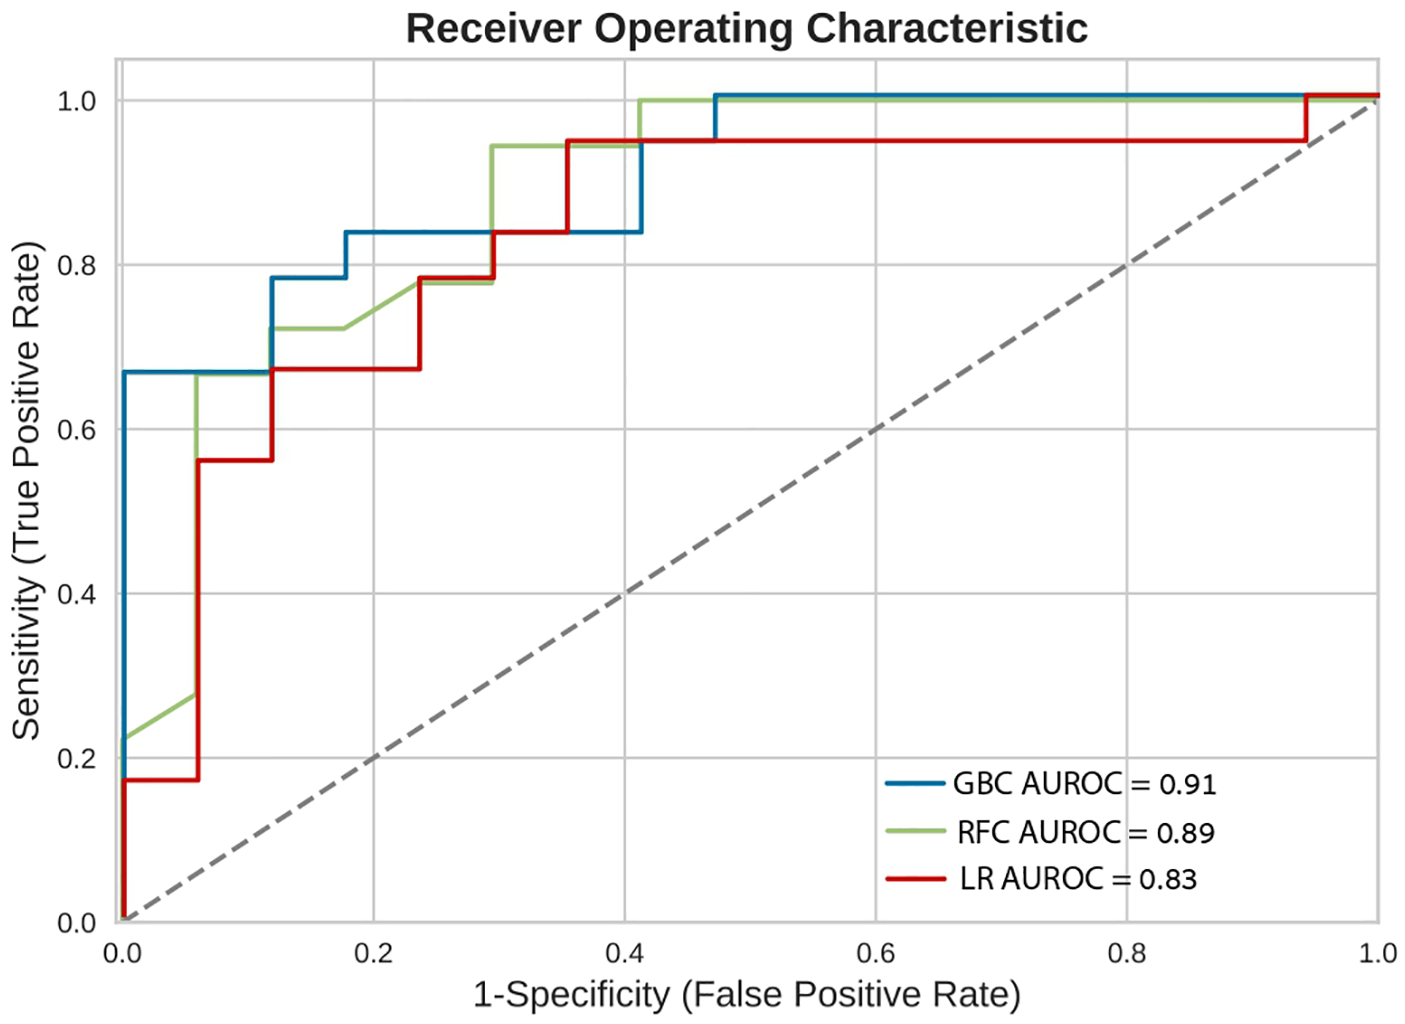
Receiver operating characteristic curves (ROC). Receiver operating characteristic (ROC) curves of the machine learning models on the selected variable set. This plot illustrates the performance of the models, including sensitivity, false positive rate, and AUROC. AUROC, area under the curve of receiver operating characterisitc curve; GBC, gradient boosting classifier; LR, logistic regression; RFC, random forest classifier.
Figure 4
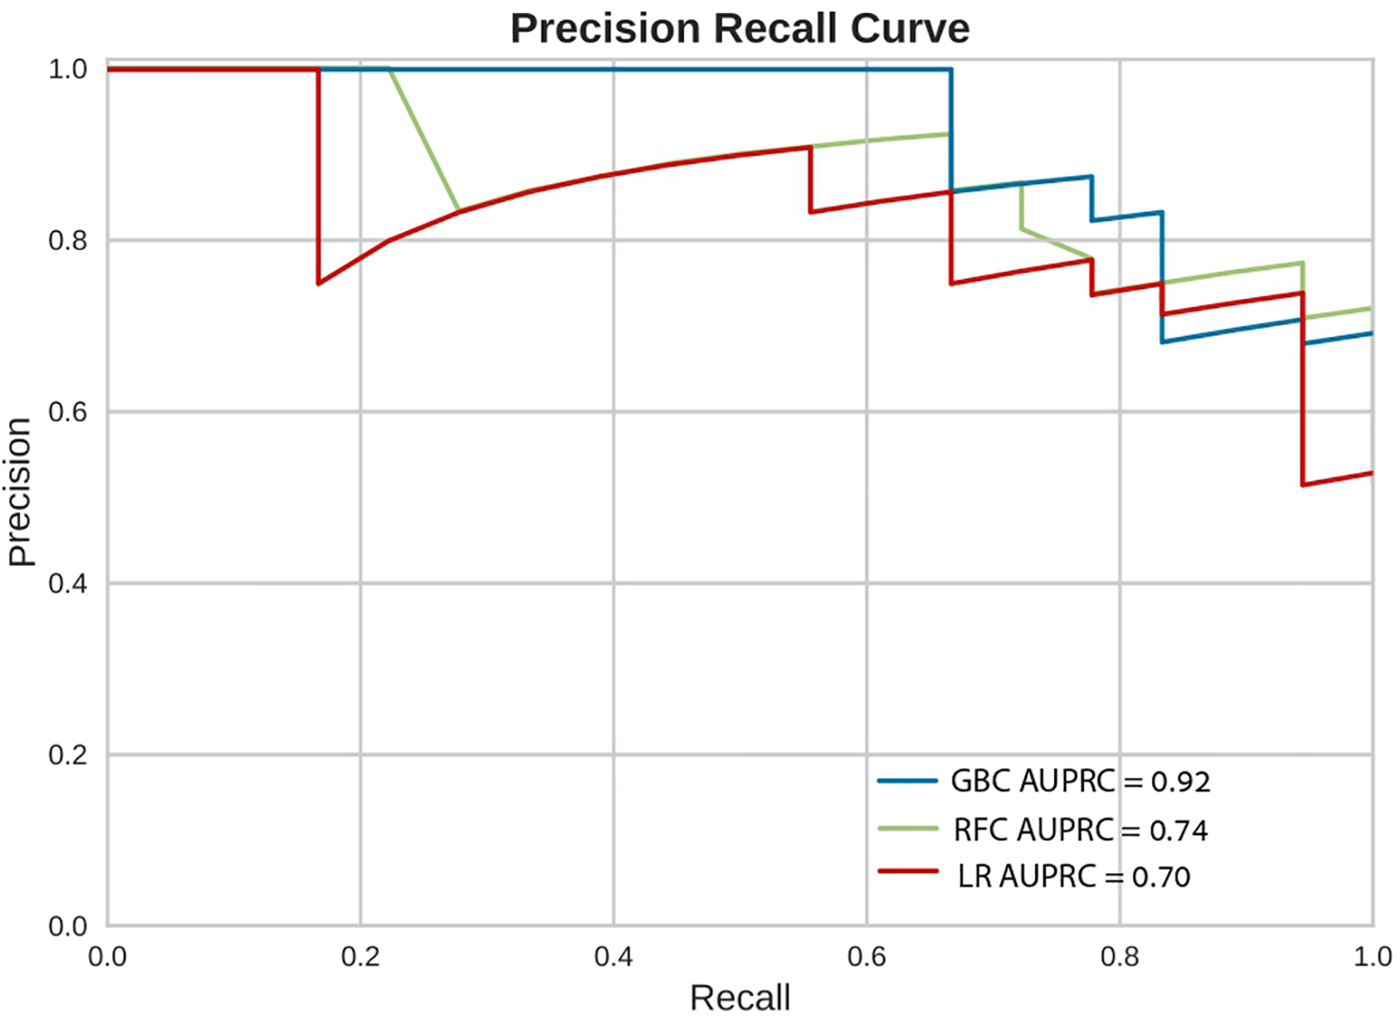
Precision recall curves (PRC). Precision Recall Curves (PRC) of the machine learning models on the selected variable set. This plot illustrates the performance of the models, including precision [positive predicted value (PPV)], recall (sensitivity), and AUPRC. AUPRC, area under the curve of precision recall curve; GBC, gradient boosting classifier; LR, logistic regression; RFC, random forest classifier.
Figure 5
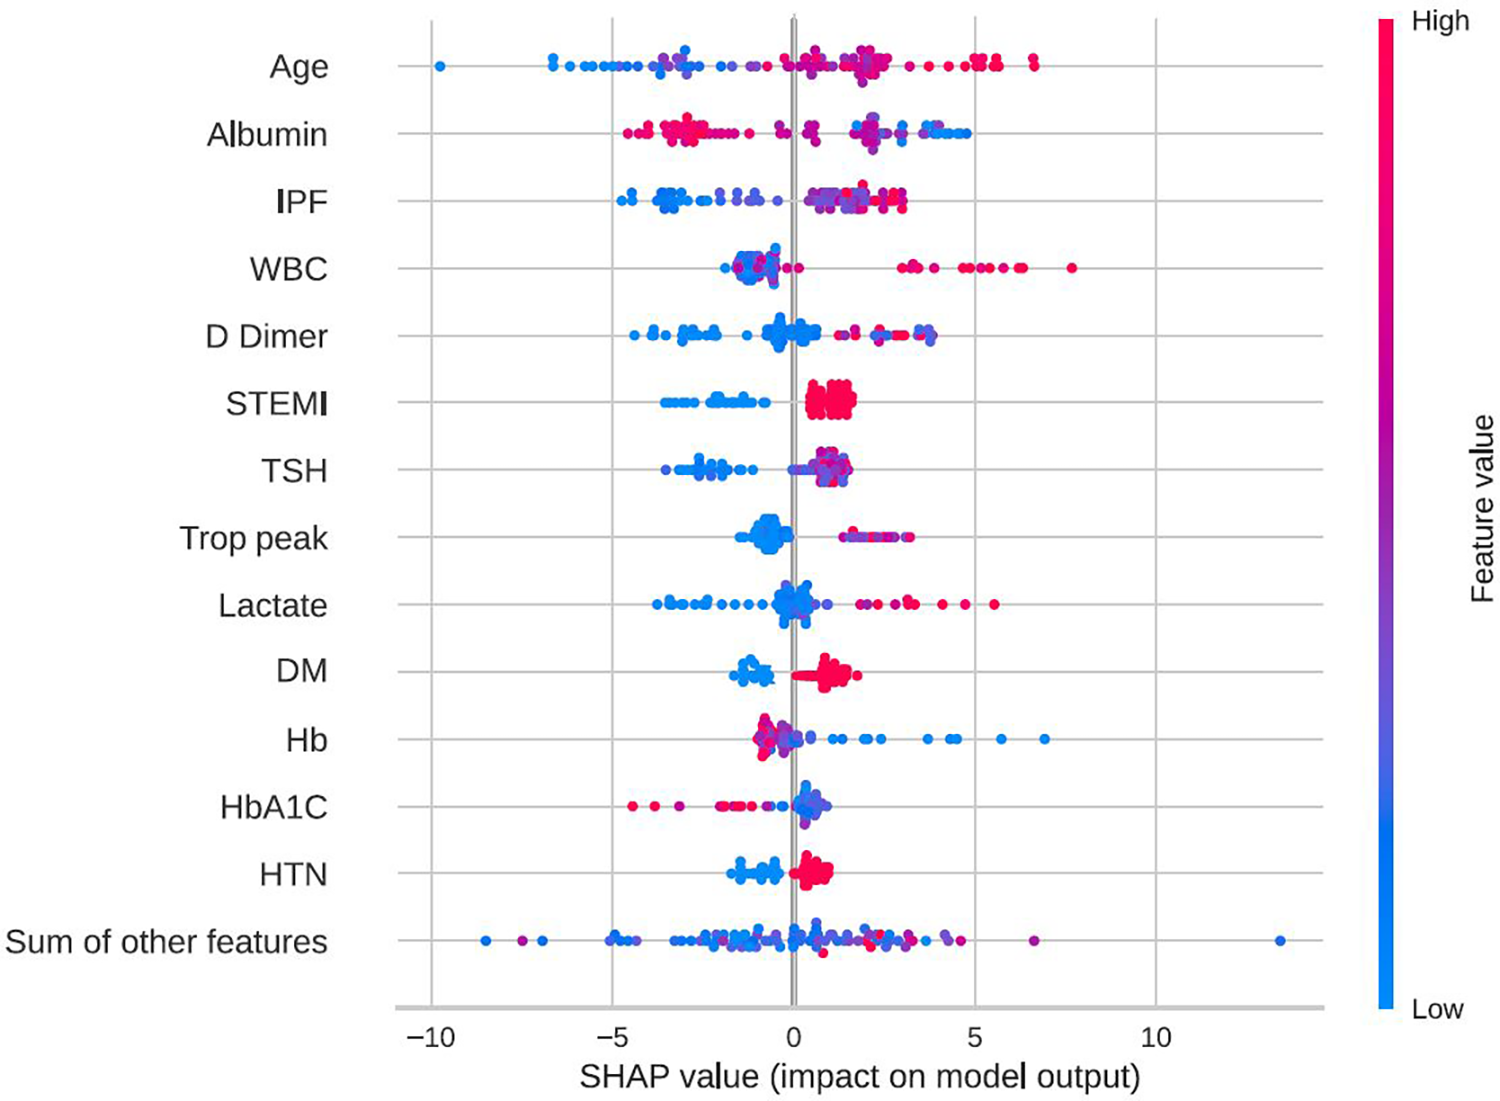
Feature importance by SHAP values. SHAP beeswarm plot of the GBC model on the selected variable set. This beeswarm plot visually depicts both the significance of variables and their effects. Every data point on the plot corresponds to a sample, with color coding indicating variable values—blue denoting low values and red signifying high values. On the X-axis, the SHAP value reflects the influence of variable values on model input, where a positive SHAP value indicates an elevated prediction probability. Moreover, greater SHAP values correlate with an increased risk of in-hospital mortality. It's essential to note that the beeswarm plot conveys the general relationship between variable values and predictions, as the color signifies relative magnitude rather than precise values. DM, diabetes mellitus; GBC, gradient boosting classifier; HbA1C, hemoglobin A1C, glycated hemoglobin; HTN, hypertension; IPF, immature platelets fraction; STEMI, ST-segment elevation myocardial infraction; Trop peak, hypersensitivity cardiac troponin I peak measure; TSH, thyroid stimulationg hormone; WBC, white blood cells count; SHAP, shapley additive explanations.
Discussion
Our analysis offers several important findings: First, it uses contemporary data to confirm and expand upon previous observations concerning sex disparities regarding outcomes of ACS patients. Second, this study demonstrates the potential of AI-based prediction models to mitigate these biases by providing an accurate risk estimator for sex-dependent outcomes such as in-hospital mortality. Lastly, this analysis provides an explainability layer with the use of SHAP values, which allows for the detection of important contributing variables for in-hospital mortality among females with ACS.
There are numerous sex-based differences in ACS patients. These range from basic biological features (5) (i.e., epicardial coronary artery diameter, myocardial blood flow, and estrogen-dependent endothelial mediators), as well as clinical features including risk factor profiles (7, 22), and clinical presentation and outcomes (5, 10–12). Hao et al. (6) studied sex differences in acute management, medical therapies, and in-hospital mortality in a large cohort from China. They found that females with ACS were less likely to receive evidence-based therapie than males, including reperfusion therapy. In a comprehensive review that focused on sex differences in patients with ACS in the current era (8), the researchers demonstrated higher prevalence of certain complications among females following ACS events, that included cardiogenic shock, bleeding, and post-discharge mortality. Our study findings further support the above investigations by showing that females with ACS received less aggressive treatment, most notably lower rates of urgent PCI (<2 h), and had higher rates of in-hospital complications and mortality. In our study there are several baseline characteristics that differ between males and females. The most notable difference is the older age of females compared to males, which provides a reasonable explanation for the lower rates of invasive treatment, and the higher rates of complications and in-hospital mortality between the two groups.
To the best of our knowledge, this is the first study to develop and train a machine-learning model for the prediction of in-hospital mortality exclusively for females with ACS. Prior studies have constructed models for the prediction of in-hospital mortality among all ACS patients (23, 24).
The utilization of explainability methods for the exploration of feature importance in the suggested model serves as further validation of our results. Older age and ST-segment elevation are well known risk factors for in-hospital mortality, which have previously been validated in several studies, including the most commonly used risk score for in-hospital mortality in ACS, the Global Registry of Acute Coronary Events (GRACE) (25–29). Wenzel et al. (29) developed the GRACE 3.0 score on over 400,000 patients by utilizing the GRACE parameters and applying machine learning algorithms for the prediction of in-hospital mortality, reporting and AUC of 0.91 and 0.87 for males and females with NSTEMI, respectively. Herein, we have evaluated a much smaller number of patients from a single center, but included not only NSTEMI patients but also STEMI and UAP. Moreover, we have used a variety of features in order to predict the desired outcome and not only the factors from the original GRACE score. Importantly, our study has confirmed older age and ST-segment elevation to be strong predictors of in-hospital mortality in females. Diabetes mellitus and arterial hypertension are two comorbidities that have been proposed in the Thrombolysis in Myocardial Infraction (TIMI) risk score for STEMI (27), and were also identified by our feature importance analysis as key predictors of in-hospital mortality. Interestingly, our analysis revealed the significance of other non-overlapping features linked to inflammatory markers including immature platelets fraction (IPF) (30), white blood cells (WBC) count, and D-dimer levels. These features have been associated in prior investigations with ACS pathogenesis and outcomes (31–33). Interestingly, elevated TSH and lower albumin levels were also among the most influential factors. These factors are not usually taken into account when discussing ACS prognosis but have previously reported as having prognosting implications (34, 35). Albumin and TSH are disturbed in numerous severe diseases, a situation which reflects both the poor baseline of the patients as well as an adaptation reaction for the disease state.
An important obstacle to implementing machine learning prediction algorithms in healthcare is clinician skepticism, largely because these algorithms are often not transparent. The explanatory analysis adds substantial value due to its ability to bridge this gap, making it easier for healthcare professionals to use these models and integrate them into operational healthcare systems.
Study limitations
Our study has several limitations: (1) it was conducted in a single tertiary-care ICCU, with all its inherent limitations including referral bias. Our proposed model is based on data from our ICCU and currently lacks external validation. (2) Our analysis was based on overall in-hospital mortality rather than cardiovascular mortality. Though mortality statistics in Israel closely resemble those of the European Union, where cardiovascular death is the second most prevalent cause of death following cancer (36). (3) There may be unmeasured laboratory and clinical variables that could have been used to enhance the performance of our prediction model, including the time elapsed between symptom onset to ACS diagnosis, Killip class, NYHA functional class, and BNP. (4) While independent associations have been demonstrated, causality could not be established due to study design, hence the utilization of the proposed model in real-life clinical practice demands further prospective work.
Conclusion
While significant efforts have been made to mitigate sex biases in the management and outcomes of patients with ACS, contemporary data indicate the persistence of such disparities. In our study, we have demonstrated the performance of an AI model in predicting in-hospital mortality among female ACS patients. Additionally, we have conducted a comprehensive feature importance analysis, highlighting the key contributing factors to this unfavorable outcome. Our study provides a proof of concept regarding the possible role of AI algorithms in reducing sex bias among females with ACS. By incorporating this model into the early stages of ACS management for female patients, we envision a potential pathway for addressing the disproportionate mortality rates experienced by this specific demographic with the aim of improving outcomes. Further prospective studies together with external validation are warranted to explore the practical application of this model in real-world healthcare settings, and to evaluate its potential role in combating sex biases in the management and outcomes of females with ACS.
Statements
Data availability statement
The datasets presented in this article are not readily available because data were generated at Shaare Zedek Medical Center. Derived data supporting the findings of this study are available from the corresponding author RL upon request. Requests to access the datasets should be directed to Ranel Loutati, ranellout@gmail.com.
Ethics statement
The studies involving humans were approved by Shaare Zedek Medical Center Institutional Review Board. The studies were conducted in accordance with the local legislation and institutional requirements. Written informed consent for participation was not required from the participants or the participants’ legal guardians/next of kin in accordance with the national legislation and institutional requirements.
Author contributions
RL: Conceptualization, Data curation, Formal Analysis, Investigation, Methodology, Software, Validation, Visualization, Writing – original draft, Writing – review & editing. NP: Writing – review & editing. DM: Writing – review & editing. TM: Writing – review & editing. LT: Writing – review & editing. IA: Writing – review & editing. RH: Writing – review & editing. MM: Writing – review & editing. NL: Writing – review & editing. MaS: Writing – review & editing. MA: Writing – review & editing. MoS: Writing – review & editing. MG: Resources, Supervision, Writing – review & editing. EA: Resources, Supervision, Writing – review & editing.
Funding
The author(s) declare that no financial support was received for the research, authorship, and/or publication of this article.
Conflict of interest
The authors declare that the research was conducted in the absence of any commercial or financial relationships that could be construed as a potential conflict of interest.
Publisher’s note
All claims expressed in this article are solely those of the authors and do not necessarily represent those of their affiliated organizations, or those of the publisher, the editors and the reviewers. Any product that may be evaluated in this article, or claim that may be made by its manufacturer, is not guaranteed or endorsed by the publisher.
References
1.
Timmis A Vadas P Townsend N Torbica A Katus H De Smedt D et al European society of cardiology: cardiovascular disease statistics 2021. Eur Heart J. (2022) 43(8):716–99. 10.1093/eurheartj/ehab892
2.
Wang F Yu Y Mubarik S Zhang Y Liu X Cheng Y et al Global burden of ischemic heart disease and attributable risk factors, 1990–2017: a secondary analysis based on the global burden of disease study 2017. Clin Epidemiol. (2021) 13:859–70. 10.2147/CLEP.S317787
3.
Virani SS Alonso A Aparicio HJ Benjamin EJ Bittencourt MS Callaway CW et al Heart disease and stroke statistics-2021 update: a report from the American heart association. Circulation. (2021) 143:e254–743. 10.1161/CIR.0000000000000950
4.
Bhatt DL Lopes RD Harrington RA . Diagnosis and treatment of acute coronary syndromes: a review. JAMA. (2022) 327(7):662–75. 10.1001/jama.2022.0358
5.
Haider A Bengs S Luu J Osto W Siller-Matula JM Muka T et al Sex and gender in cardiovascular medicine: presentation and outcomes of acute coronary syndrome. Eur Heart J. (2020) 41(13):1328–36. 10.1093/eurheartj/ehz898
6.
Hao Y Liu J Liu J Yang N Smith SC Jr Huo Y et al Sex differences in in-hospital management and outcomes of patients with acute coronary syndrome. Circulation. (2019) 139(15):1776–85. 10.1161/CIRCULATIONAHA.118.037655
7.
Appelman Y Van Rijn BB Ten Haaf ME Boersma E Peters SAE . Sex differences in cardiovascular risk factors and disease prevention. Atherosclerosis. (2015) 241(1):211–18. 10.1016/j.atherosclerosis.2015.01.027
8.
Tan YC Sinclair H Ghoora K Teoh X Mehran R Kunadian V . Gender differences in outcomes in patients with acute coronary syndrome in the current era: a review. Eur Heart J Acute Cardiovasc Care. (2016) 5(7):51–60. 10.1177/2048872615610886
9.
Shaw LJ Bugiardini R Merz CN . Women and ischemic heart disease: evolving knowledge. J Am Coll Cardiol. (2009) 54(17):1561–75. 10.1016/j.jacc.2009.04.098
10.
Dreyer RP Dharmarajan K Kennedy KF Jones PG Vaccarino V Murugiah K et al Sex differences in 1-year all-cause rehospitalization in patients after acute myocardial infarction: a prospective observational study. Circulation. (2017) 135:521–31. 10.1161/CIRCULATIONAHA.116.024993
11.
Zheng X Dreyer RP Hu S Spatz ES Masoudi FA Spertus JA et al China PEACE collaborative group. Age-specific gender differences in early mortality following ST-segment elevation myocardial infarction in China. Heart. (2015) 101:349–55. 10.1136/heartjnl-2014-306456
12.
Berg J Björck L Nielsen S Lappas G Rosengren A . Sex differences in survival after myocardial infarction in Sweden, 1987–2010. Heart. (2017) 103:1625–30. 10.1136/heartjnl-2016-310281
13.
Canto JG Shlipak MG Rogers WJ Malmgren JA Frederick PD Lambrew CT . Prevalence, clinical characteristics, and mortality among patients with myocardial infarction presenting without chest pain. JAMA. (2000) 283(24):3223–29. 10.1001/jama.283.24.3223
14.
Lawesson SS Alfredsson J Fredrikson M Swahn E . Time trends in STEMI—improved treatment and outcome but still a gender gap: a prospective observational cohort study from the SWEDEHEART register. BMJ Open. (2012) 2(2):e000726. 10.1136/bmjopen-2011-000726
15.
Bangalore S Fonarow GC Peterson ED Hellkamp AS Hernandez AF Laskey W et al Age and gender differences in quality of care and outcomes for patients with ST-segment elevation myocardial infarction. Am J Med. (2012) 125(10):1000–09. 10.1016/j.amjmed.2011.11.016
16.
Chen JH Asch SM . Machine learning and prediction in medicine—beyond the peak of inflated expectations. N Engl J Med. (2017) 376(26):2507–09. 10.1056/NEJMp1702071
17.
Miotto R Wang F Wang S Jiang X Dudley JT . Deep learning for healthcare: review, opportunities and challenges. Brief Bioinform. (2018) 19(6):1236–46. 10.1093/bib/bbx044
18.
Koulaouzidis G Jadczyk T Iakovidis DK Koulaouzidis A Bisnaire M Charisopoulou D . Artificial intelligence in cardiology—a narrative review of current status. J Clin Med. (2022) 11(13):3910. 10.3390/jcm11133910
19.
Karatzia L Aung N Aksentijevic D . Artificial intelligence in cardiology: hope for the future and power for the present. Front Cardiovasc Med. (2022) 9:945726. 10.3389/fcvm.2022.945726
20.
Byrne RA Rossello X Coughlan JJ Barbato E Berry C Chieffo A et al 2023 ESC guidelines for the management of acute coronary syndromes: developed by the task force on the management of acute coronary syndromes of the European society of cardiology (ESC). Eur Heart J. (2023) 44(38):3720–826. 10.1093/eurheartj/ehad191
21.
Lundberg S Lee S-I . A Unified Approach to Interpreting Model Predictions. arXiv:1705.07874 [cs, stat]. (2017).
22.
Mosca L Barrett-Connor E Wenger NK . Sex/gender differences in cardiovascular disease prevention: what a difference a decade makes. Circulation. (2011) 124(19):2145–54. 10.1161/CIRCULATIONAHA.110.968792
23.
Li R Shen L Ma W Yan B Chen W Zhu J et al Use of machine learning models to predict in-hospital mortality in patients with acute coronary syndrome. Clin Cardiol. (2023) 46(2):184–94. 10.1002/clc.23957
24.
Kasim S Malek S Song C Wan Ahmad WA Fong A Ibrahim KS et al In-hospital mortality risk stratification of Asian ACS patients with artificial intelligence algorithm. PLoS One. (2022) 17(12):e0278944. 10.1371/journal.pone.0278944
25.
Granger CB Goldberg RJ Dabbous O Pieper KS Eagle KA Cannon CP et al Predictors of hospital mortality in the global registry of acute coronary events. Arch Intern Med. (2003) 163(19):2345–53. 10.1001/archinte.163.19.2345
26.
Chan Pin Yin D Azzahhafi J James S . Risk assessment using risk scores in patients with acute coronary syndrome. J Clin Med. (2020) 9(9):3039. 10.3390/jcm9093039
27.
Morrow DA Antman EM Charlesworth A Cairns R Murphy SA de Lemos JA et al TIMI risk score for ST-elevation myocardial infarction: a convenient, bedside, clinical score for risk assessment at presentation: an intravenous nPA for treatment of infarcting myocardium early II trial substudy. Circulation. (2000) 102(17):2031–37. 10.1161/01.CIR.102.17.2031
28.
Boersma E Pieper KS Steyerberg EW Wilcox RG Chang WC Lee KL et al Predictors of outcome in patients with acute coronary syndromes without persistent ST-segment elevation. Results from an international trial of 9461 patients. The PURSUIT Investigators. Circulation. (2000) 101(22):2557–67. 10.1161/01.CIR.101.22.2557
29.
Wenzl FA Kraler S Ambler G Weston C Herzog SA Räber L et al Sex-specific evaluation and redevelopment of the GRACE score in non-ST-segment elevation acute coronary syndromes in populations from the UK and Switzerland: a multinational analysis with external cohort validation. Lancet. (2022) 400(10354):744–56. 10.1016/S0140-6736(22)01483-0
30.
Franco AT Corken A Ware J . Platelets at the interface of thrombosis, inflammation, and cancer. Blood. (2015) 126(5):582–88. 10.1182/blood-2014-08-531582
31.
Grove EL Hvas AM Kristensen SD . Immature platelets in patients with acute coronary syndromes. Thromb Haemostasis. (2009) 101(1):151–56. 10.1160/TH08-03-0186
32.
Byrne CE Fitzgerald A Cannon CP Fitzgerald DJ Shields DC . Elevated white cell count in acute coronary syndromes: relationship to variants in inflammatory and thrombotic genes. BMC Med Genet. (2004) 5(1):13. 10.1186/1471-2350-5-13
33.
Kyrle PA Eichinger S . D-dimer for long-term risk prediction in patients after acute coronary syndrome. Circulation. (2018) 138(7):724–26. 10.1161/CIRCULATIONAHA.118.033670
34.
Lamprou V Varvarousis D Polytarchou K Varvarousi G Xanthos T . The role of thyroid hormones in acute coronary syndromes: prognostic value of alterations in thyroid hormones. Clin Cardiol. (2017) 40(8):528–33. 10.1002/clc.22689
35.
Bicciré FG Pastori D Tanzilli A Pignatelli P Viceconte N Barilià F et al Low Serum albumin levels and in-hospital outcomes in patients with ST segment elevation myocardial infarction. Nutr Metab Cardiovasc Dis. (2021) 31(10):2904–11. 10.1016/j.numecd.2021.06.003
36.
Goldberger N Aburbeh M Haklai Z . Leading causes of death in Israel 2000–2019. Tel Aviv Isr Heal Inf Div Minist Heal. (2022).
Summary
Keywords
artificial intelligence, machine learning, ACS, sex disparities, in-hospital mortality
Citation
Loutati R, Perel N, Marmor D, Maller T, Taha L, Amsalem I, Hitter R, Mohammed M, Levi N, Shrem M, Amro M, Shuvy M, Glikson M and Asher E (2024) Artificial intelligence based prediction model of in-hospital mortality among females with acute coronary syndrome: for the Jerusalem Platelets Thrombosis and Intervention in Cardiology (JUPITER-12) Study Group. Front. Cardiovasc. Med. 11:1333252. doi: 10.3389/fcvm.2024.1333252
Received
04 November 2023
Accepted
21 February 2024
Published
04 March 2024
Volume
11 - 2024
Edited by
Hong Cheng, Capital Medical University, China
Reviewed by
Natallia Maroz-Vadalazhskaya, Belarusian State Medical University, Belarus
Jaroslaw Zalewski, Jagiellonian University Medical College, Poland
Updates
Copyright
© 2024 Loutati, Perel, Marmor, Maller, Taha, Amsalem, Hitter, Mohammed, Levi, Shrem, Amro, Shuvy, Glikson and Asher.
This is an open-access article distributed under the terms of the Creative Commons Attribution License (CC BY). The use, distribution or reproduction in other forums is permitted, provided the original author(s) and the copyright owner(s) are credited and that the original publication in this journal is cited, in accordance with accepted academic practice. No use, distribution or reproduction is permitted which does not comply with these terms.
* Correspondence: Ranel Loutati ranel.loutati@mail.huji.ac.il
Disclaimer
All claims expressed in this article are solely those of the authors and do not necessarily represent those of their affiliated organizations, or those of the publisher, the editors and the reviewers. Any product that may be evaluated in this article or claim that may be made by its manufacturer is not guaranteed or endorsed by the publisher.