Abstract
Background:
Hypertension is a major global risk factor for cardiovascular disease. According to the 2023 Global Hypertension Report, its prevalence among adults aged 30–79 years is 33%, closely mirrored in China at 31.6% (2023 Cardiovascular Health and Diseases in China Report). The etiology of hypertension is multifactorial, involving psychological stress (impacting neuroendocrine and inflammatory pathways) and abnormal lipid metabolism. However, the association between mental health and biomarkers in occupational groups, particularly oil workers, remains unclear.
Purpose:
This study using a cross-sectional design to deeply analyze the associations between mental health, physiologic health and hypertension, and to explore the influencing factors of hypertension. It aims to provide a scientific basis for the prevention and treatment of hypertension among oil workers, and also to offer theoretical support for further formulating effective measures to improve the physical and mental health levels of oil workers.
Materials and methods:
A cluster sampling method was used to recruit 6,083 active oil workers from the Occupational Health Examination Department of Karamay Central Hospital in Xinjiang, China, from September 2018 to September 2019. Physiologic health status was randomly assessed in 20% of the participants to analyze the dose-response relationship between mental health, physiologic health, and hypertension. Based on the restricted cubic spline model, we explored the dose-response relationship between biochemical indicators and hypertension under different levels of mental health.
Results:
The results showed that the prevalence of hypertension among the study population was 18.4%, with significant differences observed across various demographic factors (gender, age, education, marital status, monthly income, work experience, job type, professional title, shift work, cigarette smoking, and alcohol consumption; P < 0.05). There was also a statistical difference in the prevalence of hypertension among different mental health states (P < 0.05), with a higher prevalence (25.5%) among those with poor mental health. Triglycerides [TG] (OR: 2.11; 95% CI: 1.82–2.45), lactate dehydrogenase [LDH] (OR: 1.02; 95% CI: 1.01–1.02) and low-density lipoprotein-cholesterol [LDL-C] (OR: 1.95; 95% CI: 1.65–2.30) emerged as risk factors for hypertension. After adjusting for confounding factors, TG, LDH, and LDL-C remained significant risk factors, with TG abnormalities conferring a 1.71-fold higher risk of hypertension (OR: 1.71; 95% CI: 1.43–2.05), LDH abnormalities conferring a 1.01-fold higher risk (OR: 1.01; 95% CI: 1.01–1.02), and LDL abnormalities conferring a 1.32-fold higher risk (OR: 1.32; 95% CI: 1.06–1.64). In the group with poor mental health, before adjusting for confounders, elevated levels of TG (OR: 3.08; 95% CI: 1.92–4.96), LDH (OR: 1.02; 95% CI: 1.01–1.03), and LDL-C (OR: 2.26; 95%CI: 1.46–3.51) all increased the risk of hypertension. After adjustment, TG (OR: 4.17; 95% CI: 1.86–9.31) and LDH (OR: 1.02; 95% CI: 1.01–1.04) remained significant risk factors. A linear dose-response relationship was noted between TG and LDH levels, and hypertension risk (TG: P for trend < 0.001, P for non-linearity = 0.056; LDH: P for trend = 0.008, P for non-linearity = 0.114).
Conclusion:
In conclusion, a dose-response relationship existed between mental health, TG and LDH levels, and hypertension risk. Attention should be paid to the mental health of oil workers and effective measures should be taken to alleviate mental health issues. Regular monitoring of blood lipid levels is crucial to reduce the risk of hypertension.
1 Introduction
Hypertension, as the most prevalent cardiovascular disease, poses a significant risk for ischemic and hemorrhagic strokes and coronary artery disease (1). It is estimated that approximately 9.4 million deaths can be attributed to hypertension-related risk factors annually (1). According to the World Health Organization, the global population of individuals with hypertension (defined as a systolic blood pressure ≥140 mmHg, a diastolic blood pressure ≥90 mmHg, or individuals currently taking an antihypertensive medication) has doubled over the past 3 decades, rising from 650 million in 1990 to 1.3 billion in 2019. Among adults 30–79 years of age in 2019, there were approximately 99 million hypertensives in the Eastern Mediterranean region, 346 million in the Western Pacific, 106 million in Africa, 197 million in the Americas, 230 million in Europe, and 294 million in Southeast Asia. According to the China Cardiovascular Health and Disease Report 2023, the prevalence of hypertension among Chinese adults has reached 31.6%, affecting approximately 245 million individuals, while 43.1% of the population (estimated at 435 million) exhibit high-normal blood pressure. Hypertension remains the most prevalent chronic condition in Xinjiang, with the Chinese Hypertension Guidelines (2023 Revision) reporting a regional prevalence of 30.5%, significantly higher than the national average of 27.5%. Hypertension affects one-third of adults worldwide and is a common and life-threatening condition that can lead to strokes, myocardial infarctions, heart failure, kidney damage, and numerous other health issues (2). The epidemiology of hypertension is influenced by multiple determinants, encompassing both non-modifiable factors (e.g., age, genetic predisposition, and ethnicity) and modifiable risk factors (e.g., high-sodium diet, obesity, physical inactivity, tobacco use, excessive alcohol consumption, and psychological stress).
With the transformation of healthcare models, mental health has garnered increasing attention. It has been reported that approximately 450 million individuals worldwide have mental disorders, with at least one-fourth of households affected by psychological and behavioral disorders (3). The economic burden of mental disorders was approximately USD $2.5 trillion in 2010 and is projected to increase to USD $6 trillion by 2030, accounting for 3%–4% of the gross national product of developed countries (3). Currently, the potential link between mental health and cardiovascular diseases (CVDs) is primarily studied from a behavioral and biological mechanism perspective. Mental illnesses such as depression, bipolar disorder, and anxiety are associated with poor adherence to various healthy behaviors in daily life, including physical activity, cigarette smoking, and compliance with cardiovascular medications. These factors mediate the relationship between mental illness and adverse cardiovascular outcomes to some extent (4). With respect to biological mechanisms, growing evidence suggests that mental illnesses are associated with inflammation, predisposing individuals to autonomic nervous system dysfunction, impaired coronary flow reserve, and increased risk of myocardial ischemia. Furthermore, bidirectional influences and feedback loops may exist, linking behavioral and biological factors, thereby significantly elevating disease risk (5). Multiple studies have reported a connection between mental health and CVDs, yet consensus is elusive (6–8). A previous study has shown that mental health is closely related to increased blood pressure variability among young and middle-aged adults (9). An analysis of data from the Behavioral Risk Factor Surveillance System between 2017 and 2020 involving 593,616 young adults (18–49 years of age) showed that individuals with depression had a higher risk of cardiovascular diseases compared to individuals without depression (10). However, some studies have failed to detect a link between hypertension and mental illnesses, such as depression. Additionally, dyslipidemia is prevalent among patients with hypertension, diabetes, and metabolic syndrome (11), and elevated levels of serum total cholesterol (TC), low-density lipoprotein-cholesterol (LDL-C), and non-high-density lipoprotein-cholesterol (HDL-C) are associated with an increased risk of hypertension (12).
The oilfields in Xinjiang, China, are mostly located in the desolate Gobi Desert, where the summers are scorching hot and the winters are bitterly cold. Oil workers often work for >20 days in a row, far from their families and with no recreational activities. These unique working conditions pose significant challenges to the physical and mental health of oil workers. There are numerous reports on the relationship between mental health and hypertension among oil workers in Xinjiang but few studies have analyzed the interplay between physiologic health, mental health, and hypertension in this population (13–16). Therefore, we conducted a comprehensive survey of the physiologic and mental health status, and prevalence of hypertension among oil workers in Xinjiang. We further delved into the risk factors influencing hypertension and explored the dose-response relationship between biochemical indicators and hypertension as a function of mental health severity using a restricted cubic spline model. This study aimed to provide a scientific basis for preventing and treating hypertension among oil workers and the theoretical support for developing effective measures to improve overall physical and mental health.
2 Materials and methods
2.1 Participants
Using a cluster sampling method, 6500 on-duty oil workers in Xinjiang were recruited from the Occupational Health Examination Department of the Karamay Central Hospital in Xinjiang between September 2018 and September 2019 as the study participants. According to the Report on Cardiovascular Health and Diseases in China 2023, the prevalence of hypertension among Chinese adults is 31.6%. Based on this estimated prevalence (p = 31.6%), the required sample size was calculated using the following formula: , p = 31.6%, q = 68.4%, d = 0.1 × p = 0.0316, , , The minimum required sample size for this study was calculated to be N = 831 participants. Ultimately, the study successfully collected 6,083 valid questionnaires, achieving a response rate of 93.58%. The inclusion criteria were as follows: (1) age ≥18 years and work experience ≥1 year; and (2) no psychoactive medication use in the past year. The exclusion criteria were as follows: (1) a history of mental illness or family history of mental illness; and (2) unwillingness to participate in the survey. The study plan was approved by the Ethics Committee of Xinjiang Medical University, and all of the participants provided their voluntarily written informed consent before the investigation.
From a total of 6,083 study subjects collected, 1,122 had hypertension (non-hypertensive: n = 4,961, hypertensive: n = 1,122). Using the random number table method, 50% of the hypertensive patients (n = 561) were randomly selected as the case group. Subsequently, from the non-hypertensive subjects, individuals were randomly selected using the same method at a 1:1.5 ratio to form the control group (n = 841), to compare the physiological health status between hypertensive and non-hypertensive subjects (Case group: n = 561, Control group: n = 841). Inclusion Criteria: (1) Age ≥18 years and working tenure ≥1 year; (2) No use of psychotropic medications within the past year. Exclusion Criteria: (1) Personal or family history of mental illness; (2) Those who refused to participate in the survey. The diagnostic criteria for hypertension are detailed in Section 2.2.2 of the Methods. Based on physical examination items [Audiometry, Electrocardiogram (ECG), Chest x-ray, Abdominal ultrasonography] and biochemical indicators (Total Cholesterol, Triglycerides, High-Density Lipoprotein (HDL), Low-Density Lipoprotein (LDL), Total Bilirubin, Direct Bilirubin, Indirect Bilirubin, Alanine Aminotransferase (ALT), Aspartate Aminotransferase (AST), ALT/AST ratio, Lactate Dehydrogenase (LDH), Blood Urea Nitrogen (BUN), BUN/Creatinine ratio, Creatine Kinase (CK), Uric Acid, Total Protein, Albumin, Globulin, Albumin/Globulin ratio, Blood Glucose), subjects with incomplete physiological data were excluded. Consequently, a total of 1,096 subjects (Case group: n = 434, Control group: n = 662) met the requirements for the physiological health component of this study.
2.2 Methods
2.2.1 Sociodemographic characteristics
We administered a self-designed 《 Xinjiang Oilfield Workers Health Survey Questionnaire 》to assess participants’ health status. The questionnaire consisted of two main components: (1) Sociodemographic characteristics: including sex, age, educational level, marital status, monthly income, working years, type of work, professional title, and shift work; (2) Mental Health Status: using the Symptom Checklist-90 (SCL-90) to measure mental health status.
2.2.2 Mental health status
The Symptom Checklist 90 (SCL-90), developed by Derogatis in 1975 (17), was used to assess mental health. The Chinese version of the scale has been verified, with validity coefficients for each symptom ranging from 0.77–0.99 (18). The Chinese version of SCL-90 includes 10 factors (somatization, compulsion, interpersonal sensitivity, depression, anxiety, hostility, phobia, paranoia, psychoticism, and others), totaling 90 items. A 5-point scoring system was adopted, as follows: 1 = none; 2 = mild; 3 = moderate; 4 = severe; and 5 = very severe. The total and factor scores were utilized as indicators for evaluating the mental health status. Higher total and factor scores were associated with poorer mental health status. The criteria for determining mental disorders were as follows: total score ≥160 points; or a score >2 points for any factor.
2.2.3 Hypertension determination
2.2.3.1 Blood pressure measurement
The blood pressure of respondents was measured by professional medical staff from the Occupational Disease Physical Examination Department of the Central Hospital of Karamay City (Xinjiang, China) using a calibrated TM-2656VP electronic sphygmomanometer (A&D, Japan). The respondents were required to avoid consuming stimulating beverages for 30 min and rest quietly for 15–30 min in a quiet environment before blood pressure measurement. During the blood pressure measurement, a sitting position was assumed. The bare arm was inserted into the measuring band and the arm was kept at the same level as the heart with the palm facing upward. The blood pressure was measured two times and the average value was used. If the difference between the two measurements was >5 mmHg, the respondents rested for 5 min and the blood pressure was measured again. The average of the three measurements was taken as the final blood pressure.
2.2.3.2 Criteria for hypertension diagnosis
Hypertension was diagnosed according to the diagnostic criteria provided in the 2018 revised edition of Guidelines for the Prevention and Treatment of Primary Hypertension in China (19), as follows: hypertension, diastolic blood pressure ≥90 mmHg and/or systolic blood pressure ≥140 mmHg; and isolated systolic hypertension, diastolic blood pressure <90 mmHg and systolic blood pressure ≥140 mmHg; Individuals who were diagnosed with hypertension previously and the blood pressure is currently well-controlled by medication are still defined as having hypertension.
2.2.4 Determination of biochemical indicators
All research subjects had 5 ml of venous blood drawn and collected in an EDTA anticoagulant tube by professional medical staff in the fasting state in the morning. Biochemical indicator tests were conducted by the hospital Laboratory Department. The tested indicators included TG, TC, HDL-C, VLDL-C, LDH, FPG, TBIL, DBIL, IBIL, ALT, AST, BUN, creatine kinase (CK), S/L ratio, BUN/Cr, TP, ALB, G, and A/G ratio.
The normal ranges for the tested indicators in the serum are as follows, according to the Guidelines for the Prevention and Control of Dyslipidemia in Chinese Adults (20): TG:0.56–1.7 mmol/L; TC: 2.84–5.68 mmol/L; HDL-C:1.14–1.91 mmol/L; LDL-C:1.1–3.4 mmol/L; LDH:97–270 U/L; FPG: 3.89–6.1 mmol/L; TBIL:1.7–17.1 μmol/L; DBIL:0–6.0 μmol/L; IBIL:0.2–0.8 mg/L; ALT: 0–40 U/L; AST: 0–45 U/L; BUN: 2.5–7.1 mmol/L; CK: 0–200 U/L; S/L: 0.8–1.5; BUN/Cr:12–20:1; TP: 60–85 g/L; ALB: 35–51 g/L; G: 20–35 g/L; A/G: 1.5–2.5:1.
2.2.5 Measurement and calculation of BMI
Measurements were obtained from all research subjects in a physical examination room at the Medical Examination Center. The research subjects removed shoes, coats, bags, and other items, stood upright on both legs, and looked straight ahead while on an electronic height and weight scale. The body mass index (BMI) was calculated as follows: body weight (kg)/height² (m²). According to the Guidelines for the Prevention and Control of Overweight and Obesity in Chinese Adults (21), BMI categories are as follows: underweight, <18.5 kg/m²; normal weight, between 18.5 kg/m² and 24 kg/m²; overweight, between 24.0 kg/m² and 28.0 kg/m²; and obese, ≥28.0 kg/m².
2.2.6 Hearing test
Hearing was tested using an air conduction audiometer (AD226, Interacoustics A/S, Audiometer Alle 1,5500 Middelfart, DENMARK). The research subject entered the pure tone audiometry room, sat on a chair, and wore a blue headset on the left ear and a red headset on the right ear. Whenever the research subject heard a sound, regardless of the volume or which ear the sound was heard in, a button was pressed. Based on the principle of starting the test from the ear with better hearing, the tone began at 500 Hz and decreased by 10 dB until the research subject no longer responded. Then, the tone increased by 5 dB. Each frequency was measured three times. If the response occurred more than twice, the frequency was confirmed as the auditory threshold. Measurements were conducted at frequencies of 500, 1,000, 2,000, 3,000, 4,000, and 6,000 Hz, and the physician made a diagnosis based on the responses of the research subject.
2.2.7 Electrocardiogram measurement
A 12-lead electrocardiogram (Philips PageWriter TC30) was performed on all research subjects with relaxed limbs in a warm room. The research subject lay flat on the examination bed, the skin of the chest and limbs was exposed, and after disinfection with 75% alcohol, chest and limb leads were applied. The electrocardiogram results were recorded and a diagnosis was made.
2.2.8 Pulmonary examination
A Bright Speed Elite 16-slice spiral CT machine (GE, Boston, Massachusetts, USA) was used. The research subject stood at the designated position with the front of the chest closely attached to the cassette and hands spread apart under the guidance of the physician. The research subject inhaled and exhaled as instructed by the physician. The examination focused on lung, pleura, and heart lesions. The radiologist made a diagnosis.
2.2.9 Abdominal color Doppler ultrasonography
Abdominal color Doppler ultrasonography was performed by professional physicians in the Physical Examination Department using a Philips Affiniti 30 machine (Philips, Amsterdam, Netherlands). Prior to testing, the subjects were asked to fast and have a full bladder. The subjects lay flat on the examination bed, as instructed by the physician, relaxed the abdomen a B-ultrasound was performed, and a diagnosis was made. The examination mainly focused on the liver, gallbladder, spleen, and both kidneys.
2.3 Quality control
-
1.
Prior to the investigation, contact was made with the surveyed units or the supervisory departments of the surveyed units to explain the purpose, significance, content, and specific measures of the survey, and to seek close collaboration to minimize survey bias. With the consent of the surveyed units, a dedicated person from the surveyed units was assigned to coordinate the survey. Before the formal investigation, training was provided to the randomly selected subjects from each unit regarding the purpose and significance of the survey, specific measures, and relevant issues requiring attention.
-
2.
Surveyors were uniformly trained and the standards and filling instructions for each item of the questionnaire were specified. The survey language was standardized. Questionnaires were distributed on the day of the respondents’ physical examination. The surveyors clarified the purpose and significance of the survey and after obtaining informed consent from the respondents, the questionnaires were distributed. The completed questionnaires were collected on-site.
-
3.
Immediately after the questionnaires were collected, the surveyors organized a review of the data for that day. The surveyors were uniformly numbered and corresponding records were made. Incomplete and poor-quality questionnaires were eliminated. Data were entered into the Epidata database using a double-entry system and 20% of the questionnaires were randomly selected for verification. Only the data from the last collection of the same survey were entered into the database.
2.4 Statistical analysis
The data were input into the Epidata 3.0 database. Statistical analysis was performed using SPSS 22.0 software. Quantitative data conforming to a normal distribution and homogeneity of variance were described by appropriate measures. A two independent samples t-test was used for comparing the means of two groups. One-way ANOVA was utilized for comparing the means of three or more groups. Data not obeying a normal distribution were statistically described by the median and interquartile range, and a rank-sum test or ANOVA was used for statistical analysis. Categorical data were described by frequency and constituent ratio, and the chi-square test was used for comparing rates. If the theoretical frequency was <5, Fisher's exact probability method was used. Variables with statistical significance in univariate analysis were incorporated into a binary logistic regression model to identify independent risk factors for hypertension. The dose-response relationship between biochemical indicators and hypertension was analyzed using a restricted cubic spline combined with a logistic regression analysis model. The RCS analysis was conducted using the rms package in R language (version 4.3.2), with a restricted cubic spline curve (RCS) analysis performed using five knots (the 5th, 35th, 50th, 65th, and 95th percentiles). The significance level was set at α = 0.05.
3 Results
3.1 Basic situation
Among the 6,083 research subjects in this survey, the prevalence of hypertension was 18.4%. The study population comprised 3,956 males and 2,127 females, with ages ranging from 19 to 60 years (41.49 ± 8.40). There were statistically significant differences in the prevalence of hypertension based on gender, age, level of education, marital status, monthly income, years of employment, job type, professional title, shift worked, cigarette smoking, and alcohol consumption (P < 0.05) Table 1. The demographic characteristics of cases and controls in the subset population are summarized in Table 2.
Table 1
| Variables | Group | n | Non-hypertensive group | Hypertension group | χ 2 | P |
|---|---|---|---|---|---|---|
| N (%) | N (%) | |||||
| Sex | Male | 3,956 | 3,031 (76.6) | 925 (23.4) | 183.345 | <0.001 |
| Female | 2,127 | 1,930 (90.7) | 197 (9.3) | |||
| Age group, years | <30 | 822 | 781 (95.0) | 41 (5.0) | 392.731 | <0.001 |
| 30- | 2,602 | 2,302 (88.5) | 300 (11.5) | |||
| ≥45 | 2,659 | 1,878 (70.6) | 781 (29.4) | |||
| Educational level | Below junior college | 2,507 | 1,847 (73.7) | 660 (26.3) | 176.1 | <0.001 |
| Junior college or above | 3,576 | 3,114 (87.1) | 462 (12.9) | |||
| Marital status | Single | 1,070 | 913 (85.3) | 157 (14.7) | 12.28 | <0.001 |
| Married | 5,013 | 4,048 (80.8) | 965 (19.2) | |||
| Monthly income, CNY/Yuan | <5,000 | 394 | 305 (77.4) | 89 (22.6) | 7.544 | 0.023 |
| 5,000- | 5,231 | 4,268 (81.6) | 963 (18.4) | |||
| ≥8,000 | 458 | 388 (84.7) | 70 (15.3) | |||
| Working years | <10 | 1,652 | 1,556 (94.2) | 96 (5.8) | 465.201 | <0.001 |
| 10∼ | 2,051 | 1,769 (86.3) | 282 (13.7) | |||
| ≥20 | 2,380 | 1,636 (68.7) | 744 (31.3) | |||
| Type of work | Underground work | 654 | 531 (81.2) | 123 (18.8) | 35.22 | <0.001 |
| logging | 500 | 363 (72.6) | 137 (27.4) | |||
| Oil transportation | 1,540 | 1,287 (83.6) | 253 (16.4) | |||
| Extract oil | 2,878 | 2,345 (81.5) | 533 (18.5) | |||
| Refiner | 511 | 435 (85.1) | 76 (14.9) | |||
| Professional title | none | 1,296 | 1,054 (81.3) | 242 (18.7) | 64.771 | <0.001 |
| Junior title | 707 | 631 (89.3) | 76 (10.7) | |||
| Intermediate title | 1,439 | 1,223 (85.0) | 216 (15.0) | |||
| Senior title | 2,641 | 2,053 (77.7) | 588 (22.3) | |||
| Shift | Fixed day shift | 2,130 | 1,783 (83.7) | 347 (16.3) | 10.107 | 0.001 |
| shift | 3,953 | 3,178 (80.4) | 775 (19.6) | |||
| BMI | <18.5 | 123 | 113 (91.9) | 10 (8.1) | 419.704 | <0.001 |
| 18.5–23.9 | 2,439 | 2,219 (91.0) | 220 (9.0) | |||
| 24.0–27.9 | 2,417 | 1,938 (80.2) | 479 (19.8) | |||
| ≥28.0 | 1,104 | 691 (62.6) | 413(37.4) | |||
| Total | 6,083 | 4,961 (81.6) | 1,122 (18.4) |
Comparison of hypertension prevalence among petroleum workers with different demographic characteristics.
Table 2
| Variables | Group | n | Non-hypertensive group | Hypertension group | χ 2 | P |
|---|---|---|---|---|---|---|
| N (%) | N (%) | |||||
| Sex | Male | 580 | 303 (52.2) | 277 (47.8) | 34.297 | <0.001 |
| Female | 516 | 359 (69.6) | 157 (30.4) | |||
| Age group, years | <30 | 135 | 96 (71.1) | 39 (28.9) | 14.068 | 0.001 |
| 30- | 471 | 297 (63.1) | 174 (36.9) | |||
| ≥45 | 490 | 269 (54.9) | 221 (45.1) | |||
| Educational level | Below junior college | 458 | 269 (58.7) | 189 (41.3) | 0.915 | 0.339 |
| Junior college or above | 638 | 393 (61.6) | 245 (38.2) | |||
| Marital status | Single | 192 | 125 (65.1) | 67 (34.9) | 2.152 | 0.142 |
| Married | 904 | 537 (59.4) | 367 (40.6) | |||
| Monthly income CNY/Yuan | <5,000 | 288 | 186 (64.6) | 102 (35.4) | 3.279 | 0.194 |
| 5,000- | 675 | 401 (59.4) | 274 (40.6) | |||
| ≥8,000 | 133 | 75 (56.4) | 58 (43.6) | |||
| Working years | <10 | 265 | 164 (61.9) | 101 (38.1) | 22.235 | <0.001 |
| 10∼ | 475 | 252 (53.1) | 223 (46.9) | |||
| ≥20 | 356 | 246 (69.1) | 110 (30.9) | |||
| Type of work | Underground work | 125 | 70 (56.0) | 55 (44.0) | 62.088 | <0.001 |
| logging | 103 | 82 (79.6) | 21 (20.4) | |||
| Oil transportation | 501 | 284 (56.7) | 217 (43.3) | |||
| Extract oil | 223 | 167 (74.9) | 56 (25.1) | |||
| Refiner | 144 | 59 (41.0) | 85 (59.0) | |||
| Professional title | None | 198 | 125 (63.1) | 73 (36.9) | 14.079 | 0.003 |
| Junior title | 357 | 213 (59.7) | 144 (40.3) | |||
| Intermediate title | 331 | 178 (53.8) | 153 (46.2) | |||
| Senior title | 210 | 146 (69.5) | 64 (30.5) | |||
| Shift | Fixed day shift | 372 | 252 (67.7) | 120 (32.3) | 12.686 | <0.001 |
| shift | 724 | 410 (56.6) | 314 (43.4) | |||
| BMI | <18.5 | 30 | 23 (76.7) | 7 (23.3) | 116.028 | <0.001 |
| 18.5–23.9 | 469 | 354 (75.5) | 115 (24.5) | |||
| 24.0–27.9 | 387 | 215 (55.6) | 172 (44.4) | |||
| ≥28.0 | 210 | 70 (33.3) | 140 (66.7) | |||
| Total | 1,096 | 662 (60.40) | 434 (39.60) |
Comparison of hypertension prevalence among petroleum workers with different demographic characteristics(subset).
3.2 Comparison of SCL-90 scores in hypertensive patients
There was a statistically significant difference in the total SCL-90 score and the factor scores between patients with and without hypertension (P < 0.05). The SCL-90 and 10 factor scores in the hypertensive group were higher than the non-hypertensive group. The total SCL-90 score in the hypertensive group (161.17 ± 43.22) was higher than the non-hypertensive group (137.09 ± 40.07) Table 3.
Table 3
| Variables | Non-hypertensive group (n = 4,961) | Hypertensive group (n = 1,122) | t | P |
|---|---|---|---|---|
| SCL-90 total score | 137.09 ± 40.07 | 161.17 ± 43.22 | −17.077 | <0.001 |
| Somatization | 1.52 ± 0.50 | 1.83 ± 0.56 | −17.044 | <0.001 |
| Compulsive symptoms | 1.39 ± 0.47 | 1.63 ± 0.52 | −14.445 | <0.001 |
| Interpersonal sensitivity | 1.47 ± 0.49 | 1.72 ± 0.52 | −14.532 | <0.001 |
| Depression | 1.88 ± 0.49 | 2.14 ± 0.51 | −15.390 | <0.001 |
| Anxiety | 1.83 ± 0.46 | 2.06 ± 0.48 | −14.646 | <0.001 |
| Hostility | 1.25 ± 0.44 | 1.61 ± 0.48 | −23.189 | <0.001 |
| Fear | 1.29 ± 0.47 | 1.61 ± 0.53 | −18.808 | <0.001 |
| Paranoia | 1.53 ± 0.48 | 1.70 ± 0.48 | −10.811 | <0.001 |
| Psychosis | 1.42 ± 0.46 | 1.66 ± 0.50 | −14.689 | <0.001 |
| Another factors | 1.28 ± 0.47 | 1.61 ± 0.50 | −19.623 | <0.001 |
Comparison of SCL-90 scores between hypertensive and non-hypertensive patients.
3.3 Comparison of the prevalence of hypertension as a function of mental health status
The survey results demonstrated that 35.44% (2,157/6,083) of oilfield workers screened positive for mental disorders. There was a statistically significant difference in the prevalence of hypertension in research subjects with different mental health conditions (P < 0.05). In the negative mental health symptom group, there were 3,354 non-hypertensive individuals (85.4%) and 573 hypertensive individuals (14.6%). In the mental disorder group, there were 1,607 non-hypertensive individuals (74.5%) and 549 hypertensive individuals (25.5%) Table 4. Hypertension prevalence varied significantly by mental health level in the subset Table 5.
Table 4
| Variables | n | Non-hypertensive group n (%) | Hypertensive group n (%) | χ 2 | P |
|---|---|---|---|---|---|
| Mental health | 3,927 | 3,354 (85.4) | 573 (14.6) | 109.377 | <0.001 |
| Mental disorder | 2,156 | 1,607 (74.5) | 549 (25.5) |
Comparison of the prevalence of hypertension under different mental health levels.
Table 5
| Variables | n | Non-hypertensive group n (%) | Hypertensive group n (%) | χ 2 | P |
|---|---|---|---|---|---|
| Mental health | 895 | 591 (66.0) | 304 (34.0) | 64.721 | <0.001 |
| Mental disorder | 201 | 71 (35.3) | 130 (64.7) |
Comparison of the prevalence of hypertension under different mental health levels (subset).
3.4 Comparison of physiologic indicators between hypertensive and non-hypertensive patients
Statistically significant differences (P < 0.05) were detected with respect to the physiologic indicators between the hypertensive and non-hypertensive groups, except for TBIL, DBIL, IBIL, BUN/Cr, TP, ALB, G, and the A/G ratio. Specifically, in the hypertensive group the following indicators were all higher than the non-hypertensive group: TG, 1.74 (1.12–2.65); TC, 5.03 (4.48–5.74); LDL-C, 3.1 (2.62–3.65); LDH, 181.41 (162.18–209.85); FPG, 5.02 (4.73–5.61), ALT, 23 (16.1–35.26); AST, 19.91 (16.72–25.35); BUN, 5.01 (4.2–5.82); and CPK, 96 (73.7–133.61). The following indicators were lower in the hypertensive group than the non-hypertensive group: HDL-C, 1.22 (1.02–1.42); and the S/L ratio, 0.87 (0.68–1.11) Table 6.
Table 6
| Variables | Non-hypertensive group (n = 662) | Hypertensive group (n = 434) | P | |
|---|---|---|---|---|
| TG [M(P25, P75)] | 1.08 (0.73,1.58) | 1.74 (1.12,2.65) | 12.505 | <0.001 |
| TC [M(P25, P75)] | 4.64 (4.1,5.26) | 5.03 (4.48,5.74) | 7.321 | <0.001 |
| HDL-C [M(P25, P75)] | 1.37 (1.17,1.6) | 1.22 (1.02,1.42) | −7.726 | <0.001 |
| VLDL-C [M(P25, P75)] | 2.7 (2.27,3.25) | 3.1 (2.62,3.65) | 8.262 | <0.001 |
| LDH [M(P25, P75)] | 169.3 (153,187) | 181.41 (162.18,209.85) | 7.065 | <0.001 |
| FPG [M(P25, P75)] | 4.86 (4.59,5.21) | 5.02 (4.73,5.61) | 5.317 | <0.001 |
| TBIL [M(P25, P75)] | 11.7 (8.6,16) | 11.82 (9.38,16.22) | 0.887 | 0.375 |
| DBIL [M(P25, P75)] | 2.04 (1.59,2.75) | 2.1 (1.52,2.75) | 0.248 | 0.804 |
| IBIL [M(P25, P75)] | 9.57 (6.92,13.28) | 9.7 (7.61,13.51) | 0.77 | 0.441 |
| ALT [M(P25, P75)] | 17.8 (12.6,26.88) | 23 (16.1,35.26) | 6.964 | <0.001 |
| AST [M(P25, P75)] | 18.5 (15.58,22.6) | 19.91 (16.72,25.35) | 4.974 | <0.001 |
| BUN [M(P25, P75)] | 4.62 (3.92,5.55) | 5.01 (4.2,5.82) | 3.947 | <0.001 |
| CK [M(P25, P75)] | 81.97 (62.15,116) | 96 (73.7,133.61) | 5.088 | <0.001 |
| S/L [M(P25, P75)] | 1.03 (0.78,1.33) | 0.87 (0.68,1.11) | −6.465 | <0.001 |
| BUN/Cr [M(P25, P75)] | 0.06 (0.05,0.07) | 0.06 (0.05,0.07) | 0.509 | 0.611 |
| TP | 75.19 ± 3.82 | 75.58 ± 4.14 | −1.613 | 0.107 |
| ALB | 46.36 ± 2.60 | 46.40 ± 2.73 | −0.227 | 0.820 |
| G[M(P25, P75)] | 28.6 (26.47,31.1) | 29.1 (26.61,31.3) | 1.361 | 0.174 |
| A/G[M(P25, P75)] | 1.61 (1.46,1.77) | 1.61 (1.46,1.77) | −0.807 | 0.420 |
Analysis of the physical health status of hypertensive and non-hypertensive patients among Xinjiang oil workers.
3.5 Distribution of physiologic abnormalities in hypertensive and non-hypertensive patients
There was a statistically significant difference in the distribution of abnormal hearing, and abdominal ultrasound findings between hypertensive and non-hypertensive patients (P < 0.05). Among non-hypertensive patients, the proportions of underweight, normal weight, overweight, and obese subjects were 3.5%, 53.5%, 32.5%, and 10.6% respectively. The proportion of individuals with hearing abnormalities in the non-hypertensive group was lower (25.4%) than the hypertensive group (32.5%). The proportion of individuals with abnormal abdominal ultrasound findings in the hypertensive group was higher (80.6%) than the non-hypertensive group (70.1%) Table 7.
Table 7
| Variables | Group | Non-hypertensive group (n = 662) | hypertensive group (n = 434) | P | |
|---|---|---|---|---|---|
| Hearing | Normal | 494 (74.6) | 293 (67.5) | 6.547 | 0.011 |
| Abnormal | 168 (25.4) | 141 (32.5) | |||
| Chest radiograph | Normal | 593 (89.6) | 388 (89.4) | 0.009 | 0.926 |
| Abnormal | 69 (10.4) | 46 (10.6) | |||
| Electrocardiogram | Normal | 535 (80.8) | 339 (78.1) | 1.188 | 0.276 |
| Abnormal | 127 (19.2) | 95 (21.9) | |||
| Lung function | Normal | 630 (95.2) | 415 (95.6) | 0.123 | 0.726 |
| Abnormal | 32 (4.8) | 19 (4.4) | |||
| Abdominal ultrasound | Normal | 198 (29.9) | 84 (19.4) | 15.281 | <0.001 |
| Abnormal | 464 (70.1) | 350 (80.6) |
Distribution of abnormal physiologic health in hypertensive and non-hypertensive workers in the Xinjiang oilfield.
3.6 Multivariate analysis of risk factors for hypertension
The variables that were significant in the univariate analysis were introduced into the equation for binary logistic regression analysis. The subsample analysis indicated that TG (OR: 2.11; 95% CI: 1.82–2.45), LDH (OR: 1.02; 95% CI: 1.01–1.02), and LDL-C (OR: 1.95; 95% CI: 1.65–2.30) were risk factors for hypertension. After correcting for confounding factors, TG, LDH, and LDL-C remained risk factors for hypertension. Specifically, the risk of developing hypertension for subjects with an abnormal TG, LDH, and LDL-C level was 1.71 (OR: 1.71; 95% CI: 1.43–2.05), 1.01 (OR: 1.01, 95% CI: 1.01–1.02), and 1.32(OR:1.32, 95% CI: 1.06–1.64) that of subjects with a normal TG, LDH, and LDL-C level, respectively Table 8.
Table 8
| Variables | Model 1 | P | Model 2 | P |
|---|---|---|---|---|
| OR (95%CI) | OR (95%CI) | |||
| TG | 2.11 (1.82–2.45) | <0.001 | 1.71 (1.43–2.05) | <0.001 |
| LDH | 1.02 (1.01–1.02) | <0.001 | 1.01 (1.01–1.02) | <0.001 |
| LDL-C | 1.95 (1.65–2.30) | <0.001 | 1.32 (1.06–1.64) | <0.050 |
Logistic regression analysis of influencing factors of hypertension.
Model 1 did not adjust for confounding factors. Model 2 for TG was adjusted for sex, age, working years, type of work, professional title, shift, BMI, Mental health, TC, HDL-C, VLDL-C, LDH, FPG, ALT, AST, BUN, CK, S/L, hearing, abdominal ultrasound. Model 2 for LDH was adjusted for, sex, age, working years, type of work, professional title, shift, BMI, mental health, TG, TC, HDL-C, VLDL-C, FPG, ALT, AST, BUN, CK, S/L, hearing, abdominal ultrasound. Model 2 for LDL-C was adjusted for sex, age, working years, type of work, professional title, Shift, BMI, mental health, TG, TC, HDL-C, LDH, FPG, ALT, AST, BUN, CK, S/L, hearing, abdominal ultrasound.
3.7 Risk of hypertension associated with TG, LDH, and LDL indices for different mental health states
The results of the stratified analysis based on mental health symptoms revealed that in the negative mental health symptom group, both before and after adjusting for confounding factors, the TG (OR before adjustment: 2.00; 95% CI before adjustment: 1.70–2.33; OR after adjustment: 1.56, 95% CI after adjustment: 1.32–1.85), LDH (OR before adjustment: 1.02; 95% CI before adjustment: 1.01–1.02; OR after adjustment: 1.01, 95% CI after adjustment: 1.01–1.02), and LDL-C level (OR before adjustment: 1.90, 95% CI before adjustment: 1.58–2.29; OR after adjustment: 1.35, 95% CI after adjustment: 1.08–1.69) were risk factors for hypertension. In the positive mental health symptom group, elevated levels of TG (OR: 3.08, 95% CI: 1.92–4.96), LDH (OR: 1.02, 95% CI: 1.01–1.03), and LDL-C (OR: 2.26, 95% CI: 1.46–3.51) increased the risk of hypertension before adjusting for confounding factors. TG (OR: 4.17, 95% CI: 1.86–9.31) and LDH (OR: 1.02, 95% CI: 1.01–1.04) remained as risk factors for hypertension after adjusting for confounding factors Table 9.
Table 9
| Variables | Mental health | Mental disorders | ||||||
|---|---|---|---|---|---|---|---|---|
| Model 1 | P | Model 2 | P | Model 1 | P | Model 2 | P | |
| OR (95%CI) | OR (95%CI) | OR (95%CI) | OR (95%CI) | |||||
| TG | 2.00 (1.70–2.33) | <0.001 | 1.56 (1.32–1.85) | <0.001 | 3.08 (1.92–4.96) | <0.001 | 4.17 (1.86–9.31) | <0.001 |
| LDH | 1.02 (1.01–1.02) | <0.001 | 1.01 (1.01–1.02) | <0.001 | 1.02 (1.01–1.03) | 0.028 | 1.02 (1.01–1.04) | 0.017 |
| LDL-C | 1.90 (1.58–2.29) | <0.001 | 1.35 (1.08–1.69) | 0.008 | 2.26 (1.46–3.51) | <0.001 | 1.28 (0.62–2.63) | 0.507 |
Logistic regression analysis of the association between TG, LDH, LDL-C indices and hypertension under different mental health states.
Model 1 did not adjust for confounding factors. Model 2 for TG was adjusted for sex, age, working years, type of work, professional title, shift, BMI,TC,HDL-C,VLDL-C, LDH, FPG, ALT, AST, BUN, CK,S/L, hearing, abdominal ultrasound. Model 2 for LDH was adjusted for, sex, age, working years, type of work, professional title, shift, BMI, TG, TC, HDL-C, VLDL-C, FPG, ALT, AST, BUN, CK, S/L, hearing, abdominal ultrasound. Model 2 for LDL-C was adjusted for sex, age, working years, type of work, professional title, shift, BMI, TG, TC, HDL-C, LDH, FPG, ALT, AST, BUN, CK, S/L, hearing, abdominal ultrasound.
3.8 Dose-response relationship between TG, LDH, and LDL-C indices of oil workers and the risk of hypertension
After adjusting for relevant confounding factors, a non-linear dose-response relationship existed between the TG index and risk of hypertension (P for overall trend <0.001, P for non-linearity <0.05). A linear dose-response relationship was noted between the LDH and LDL indices and the risk of hypertension (LDH: P for overall trend <.001, P for non-linearity = 0.230; LDL: P for overall trend < 0.05, P for non-linearity = 0.309) Figure 1.
Figure 1
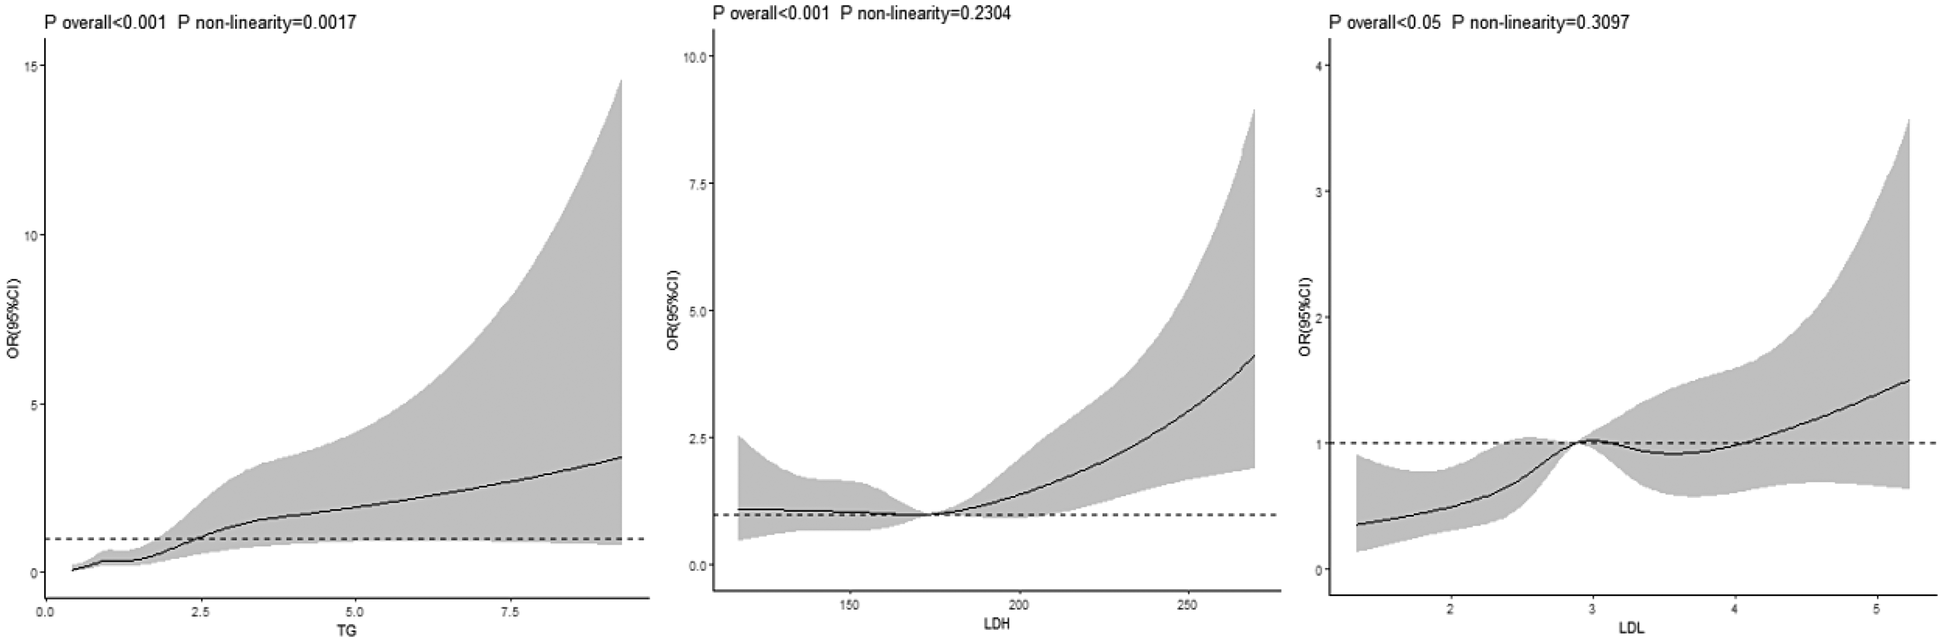
Dose-response relationship between TG, LDH, LDL index and risk of hypertension in petroleum workers.
3.9 Dose-response relationship between TG, LDH, and LDL-C indices and the risk of hypertension under different mental health states
In the group with negative psychological symptoms, a linear dose-response relationship existed between the TG index and the risk of hypertension (P for overall trend <0.001, P for non-linearity = 0.056). No dose-response relationship was observed between the LDH and LDL-C indices and the risk of hypertension (LDH: P for overall trend >0.05, P for non-linearity = .807; LDL-C: P for overall trend >0.05, P for non-linearity = 0.740) Figure 2. In the group with positive psychological symptoms, there were linear dose-response relationships between the TG and LDH indices and the risk of hypertension (TG: P for overall trend <0.001, P for non-linearity = 0.056; LDH: P for overall trend = 0.008, P for non-linearity = 0.114) Figure 3.
Figure 2
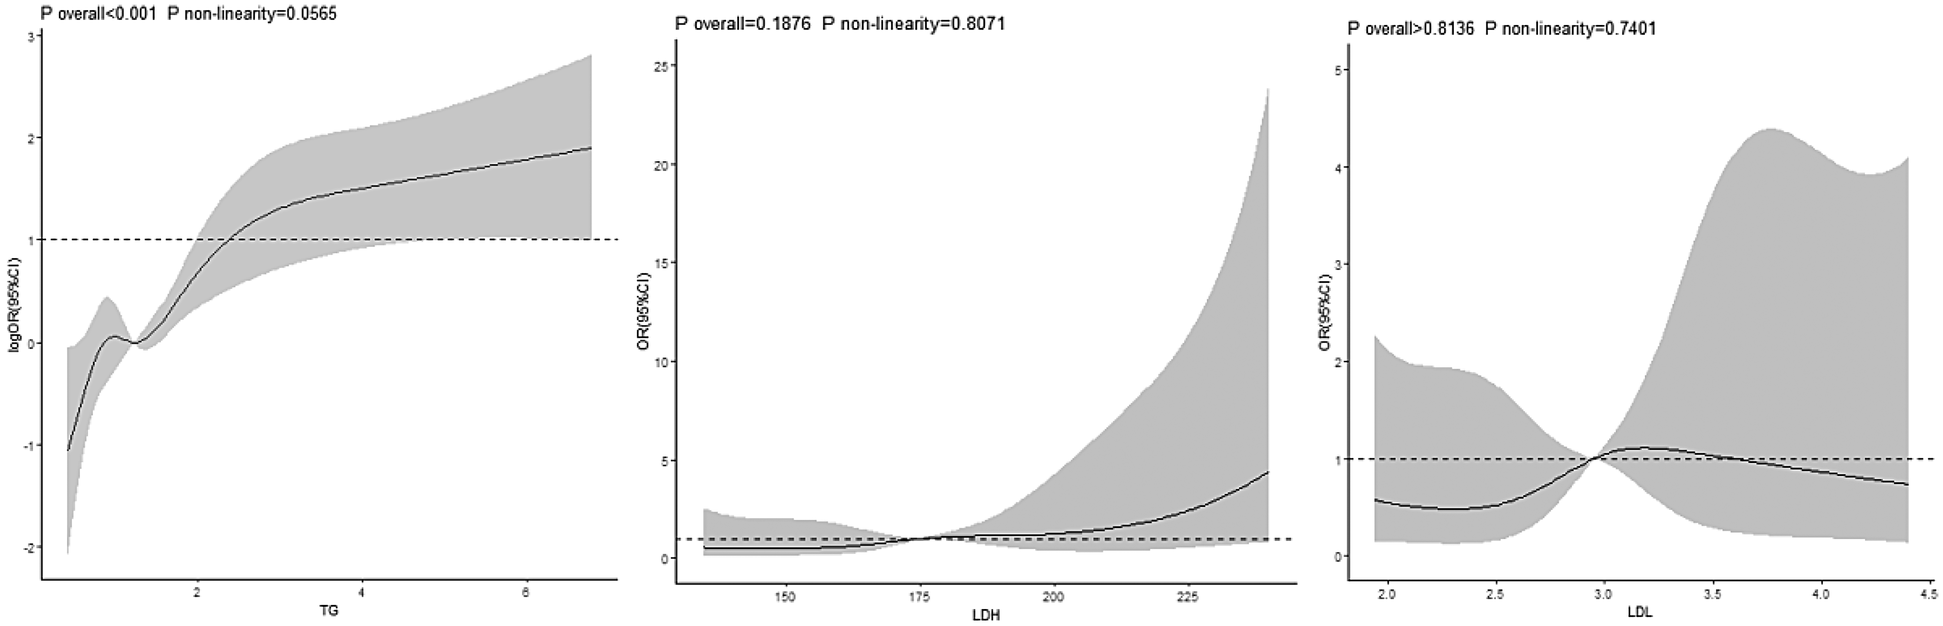
Dose-response relationship between TG, LDH, LDL and hypertension in negative psychological symptoms group.
Figure 3
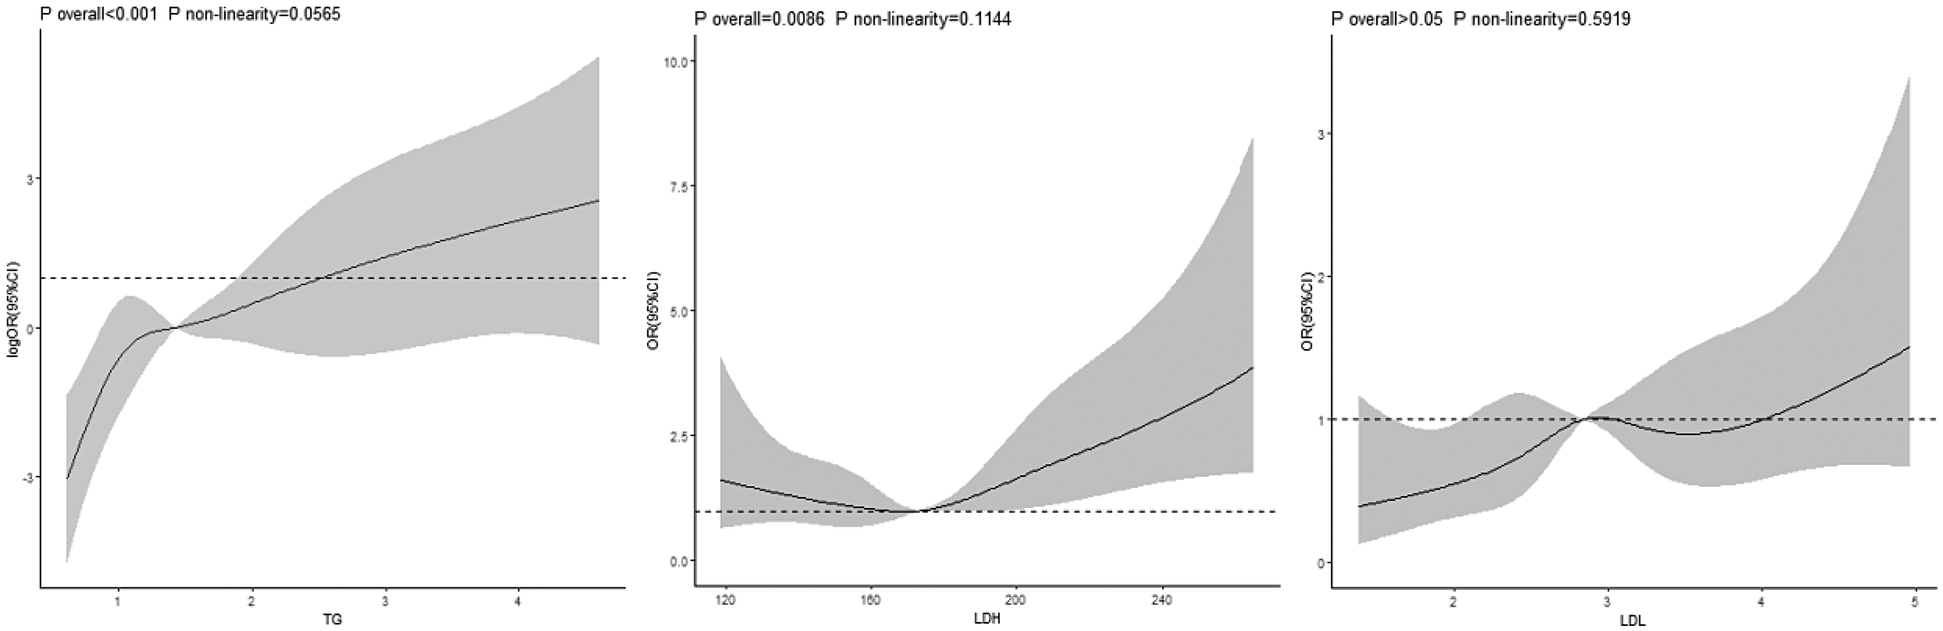
Dose-response relationship between TG, LDH, LDL and hypertension in positive psychological symptoms group.
4 Discussion
Hypertension has been declared a global public health crisis by the World Health Organization (WHO) because of its high prevalence: it affects >1 billion people worldwide and directly causes >10 million deaths each year (22). Consequently, many scientists have focused their efforts on hypertension research in various directions. Studies have indicated that the risk factors for hypertension include age, gender, lifestyle, obesity, and immunity (23). Our study identified a hypertension prevalence of 18.4% among oil workers, significantly lower than the national prevalence of 27.5% reported in the 2023 Chinese hypertension guidelines for adults aged ≥18 years, yet comparable to earlier estimates in this occupational group (24–26). The results of this study indicate that the prevalence of hypertension among male oil workers is higher than that among females, which is inconsistent with the findings of Yang et al. (25) in 2021 but aligns with the conclusions of Zhang et al. (27). Additionally, the 2018 China Chronic Disease and Risk Factors Surveillance (CCDRFS) survey also revealed a higher prevalence of hypertension in males compared to females. Furthermore, previous study have found that the risk of hypertension increases with higher BMI, which is consistent with the conclusions of this study (25). The significantly lower prevalence of hypertension among oil workers compared to the national adult level is primarily due to the fact that the oil industry typically sets medical examination thresholds for blood pressure, cardiopulmonary function, etc. during recruitment, eliminating those with existing hypertension or cardiovascular diseases, resulting in on-the-job workers having a baseline health level superior to that of the general population. Meanwhile, as types of work such as oil workers’ drilling and equipment maintenance require continuous physical labor (with an average daily step count of over 15,000 steps), this helps maintain a body weight/BMI lower than that of sedentary populations (such as urban white-collar workers). In addition, long-term physical labor increases skeletal muscle mass and improves insulin sensitivity, indirectly reducing the risk of metabolic syndrome (one of the core mechanisms of hypertension).
The results of this study indicate that the positive detection rate of mental health symptoms among oil workers is 35.44%, which is lower than the 48.5% prevalence of psychological disorders reported by Li (28) et al. in 2022. This suggests that increased awareness of mental health issues among workers may lead to earlier adoption of self-regulation strategies (such as exercise and social activities) or proactive help-seeking behaviors, thereby preventing the exacerbation of problems. However, due to their unique occupational environment (harsh natural conditions, high-risk operations, shift work, and circadian rhythm disorders) and job characteristics (long-term absence from home with limited social interaction, work-family conflict, and scarcity of cultural and recreational activities), the detection rate of psychological disorders among oil workers remains higher than that of general occupational populations. The results of this study indicate that the prevalence of hypertension is higher in the group with positive mental health symptoms. Research has demonstrated that there is an association between mental health and hypertension; specifically, anxiety disorders and depression are related to hypertension and mental illnesses are associated with increased blood pressure variability in young and middle-aged individuals (29). Hypertension and affective disorders, such as depression, frequently co-occur and it has also been shown that affective disorders are risk factors for many cardiovascular diseases (9). It has been reported that patients with affective disorders have an increased risk of hypertension and CVD risk factors, including hypertension, have also been shown to cause depressive symptoms, such as aging through microvascular brain damage (30). Kwapong et al. (10) consider depression as a non-traditional risk factor for CVDs. The incidence of CVDs in patients with depression was higher than non-depressed patients (OR: 2.32; 95% CI: 2.13–2.51) based on data involving 593,616 young people (18–49 years of age) monitored by the Behavioral Risk Factor Surveillance System from 2017 to 2020. Depression and poor mental health are associated with premature CVDs in young people and the two interact. Maintaining good mental health may help reduce the risk of cardiovascular diseases and improve the problem of poor cardiovascular health in young people. Ang et al. (31) showed that hypertension may be a contributing factor for mental illnesses. Compared to individuals who received hypertension screening and had controlled blood pressure, individuals who did not undergo hypertension screening and did not control blood pressure had a higher risk of anxiety and depression. Respondents who did not take hypertension medications had a lower probability of developing anxiety and depression compared to respondents who took hypertension medications. There is an association between different degrees of hypertension and mental illnesses. There is also evidence suggesting a bidirectional relationship between depression and hypertension, which leads to a reduced quality of life, lower treatment adherence rates, and increased mortality in older adult patients with hypertension (32). Additionally, a non-randomized study indicates that hypertensive patients with depressive symptoms require more antihypertensive drugs to achieve good blood pressure control.
The results of this study indicated that the TG, TC, and LDL-C levels in hypertensive patients are higher than non-hypertensive individuals, while the HDL-C level is lower than non-hypertensive individuals. There were differences in the abnormal incidence of TG, TC, and LDL-C levels between the two groups. Previous studies have reported an interaction between blood lipids and blood pressure, which may be the basis of the common pathophysiologic mechanisms of dyslipidemia and hypertension, such as endothelial dysfunction and reduced arterial elasticity (33). Studies have shown that dyslipidemia is common in patients with hypertension, diabetes, and metabolic syndrome (11). Elevated serum TC, LDL-C, and non-HDL-C levels are all associated with an increased risk of hypertension (12). A study including 403,335 participants from the UK Biobank determined the association between the triglyceride-glucose (TyG) index and the TG-to-HDL-C (TG/HDL-C) ratio, and CVD in the European population. The multivariable-adjusted hazard ratios for total CVD in higher quartiles vs. the lowest quartiles were 1.05, 1.05, and 1.19, respectively, for the TyG index, and 1.07, 1.13, and 1.29, respectively, for the TG/HDL-C ratio. There were significant trends toward an increasing risk of CVD across the TyG index and TG/HDL-C ratio quartiles. Dyslipidemia, type 2 diabetes, and hypertension accounted for 45.8%, 27.0%, and 15.0% of the TyG index association with CVD, respectively, and 40.0%, 11.8%, and 13.3% of the TG/HDL-C ratio association with CVD, respectively, in mediation analyses (34). Furthermore, a population cohort study in middle-aged men without baseline hypertension in Finland revealed that for each standard deviation increase in triglyceride (TG) concentration, the risk of new-onset hypertension increased by 1.6-fold (95% CI: 1.2–2.3), while the HDL-C concentration (OR: 0.7, 95% CI: 0.5–0.9) appeared to have a protective effect (35). Currently, various pathophysiologic mechanisms have been proposed to explain the association between the risk of new-onset hypertension and lipid levels. Dyslipidemia can modify the permeability of cell membranes and induce renal microvascular injury, thereby leading to hypertension. Studies have indicated that patients with dyslipidemia have deficient nitric oxide bioactivity, resulting in reduced vasodilatory capacity and elevated blood pressure (36). Additionally, atherosclerotic lesions caused by endothelial dysfunction are associated with increased arterial stiffness and decreased arterial compliance, thereby contributing to hypertension (37). Some researchers have speculated that hypertriglyceridemia may compromise vascular dilation mechanisms, thereby increasing vascular resistance and resulting in elevated blood pressure. High TG levels lead to the formation of small, dense LDL-C particles, which are particularly prone to oxidation and form oxidized small, dense LDL-C particles. These oxidized small, dense LDL-C particles have been shown to induce endothelial dysfunction by attenuating endothelial nitric oxide synthesis activity (38). Hence, hypertriglyceridemia may impair vascular dilation mechanisms independently of LDL damage. Moreover, lipolysis of TG in adipose tissue has been shown to lead to the production of non-esterified fatty acids, which have been shown to disrupt endothelial function by inhibiting endothelium-dependent hyperpolarization, a potent vasodilator in small resistance arteries in rats and humans (39). Stratified analysis was performed to further investigate the association between blood lipids and hypertension in the mental health symptom-negative and positive groups. The study found that regardless of mental health status, elevated LDH levels are associated with an increased risk of hypertension. As a sensitive marker of cellular damage and hypoxia, elevated LDH may lead to vascular endothelial injury or metabolic disturbances, thereby contributing to a higher risk of hypertension. This conclusion has also been confirmed by study from other scholar (40).
The study found that in the mental health symptom-negative group, elevated LDL was associated with a higher risk of hypertension. However, in the mental health symptom-positive group, adjusted LDL showed no significant association with hypertension, suggesting that mental health status may act as an effect modifier influencing the relationship between LDL and hypertension. In individuals with positive mental health symptoms, chronic psychological stress may activate the hypothalamic-pituitary-adrenal (HPA) axis and sympathetic nervous system, promoting inflammatory responses and insulin resistance, thereby exacerbating metabolic disorders. These pathophysiological changes may partially or completely mask the hypertension-inducing effects of LDL itself, leading to a weakened or even eliminated independent effect of LDL after adjusting for confounders. Additionally, mental health problems may be accompanied by unhealthy behaviors (e.g., irregular diet, lack of physical activity), further confounding the relationship between LDL and hypertension. Clinical implications: Future hypertension risk assessment and intervention strategies should incorporate mental health status, particularly in patients with metabolic abnormalities, requiring comprehensive management of psychological and physiological risk factors. Further research with a larger sample size is needed to examine the interaction between LDL and mental health and clarify the underlying mechanisms.
The results of this study indicate that in the group with positive psychological symptoms, there exists a linear dose-response relationship between TG, the LDH index, and the risk of hypertension (41–43). Previous study have demonstrated that stressful emotions may cause alterations in blood pressure, cholesterol and TG levels, hematocrit, fibrinogen level, and blood fluidity (42). Stress may result in abnormal activation of the sympathetic nervous system, thereby triggering a hormonal cascade that interferes with blood pressure, and increased coagulation and platelet activity. These factors can serve as “triggers” for the occurrence of cerebrovascular events. Epidemiologic studies have repeatedly investigated the association between anxiety, depression, and hypertension, and have found that depression is an important and independent risk factor for hypertension, particularly more pronounced among young individuals (44–46). Depression can reduce heart rate variability and an excessively low heart rate indicates a greater risk of death due to CVDs (44–46). Similarly, poor mental health status may exacerbate inflammatory responses or elevate blood cortisol levels (47).
5 Conclusion
This study showed that in addition to demographic characteristics, positive mental health symptoms and abnormal TG and LDL-C levels increase the risk of hypertension in oil workers. The analysis revealed that there is a non-linear dose-response relationship between the TG index and the risk of hypertension, and a linear dose-response relationship between the LDH and LDL-C indices and the risk of hypertension. Furthermore, in the group with positive psychological symptoms, there was also a linear dose-response relationship between the TG and LDH indices and the risk of hypertension. Limitations:The shortcomings of this study were as follows. First, this was a cross-sectional study, making it challenging to infer causal relationships. Second, as a special occupational group, oil workers have a higher incidence of mental health issues compared to the general working population. The results await further validation in more occupational groups. In this study only the SCL-90 measurement tool was used for measurement of mental health levels, which can merely reflect the overall mental health status. In future research, other measurement tools will be used to measure specific mental health indicators, such as anxiety, depression, and emotional disorders, and to further analyze their potential correlations. Finally, while this study diagnosed hypertension based on two to three blood pressure measurements during a single examination—a conventional approach in epidemiological surveys—this methodology differs from clinical diagnostic standards. Future studies should adopt more rigorous clinical protocols to enhance the reliability of findings.
Statements
Data availability statement
The raw data supporting the conclusions of this article will be made available by the authors, without undue reservation.
Author contributions
ZS: Conceptualization, Formal analysis, Investigation, Methodology, Validation, Writing – original draft. XM: Conceptualization, Data curation, Formal analysis, Investigation, Methodology, Writing – review & editing. XL: Conceptualization, Formal analysis, Investigation, Methodology, Writing – review & editing. JL: Conceptualization, Data curation, Formal analysis, Funding acquisition, Supervision, Writing – review & editing.
Funding
The author(s) declare that financial support was received for the research and/or publication of this article. This work was funded by the The 14-th Five-Year Plan Distinctive Program of Public Health and Preventive Medicine in Higher Education Institutions of Xinjiang Uygur Autonomous Region and the National Natural Science Foundation of China (grant number: 81460489). The second batch of “Tianchi Talents” Program in Xinjiang Uygur Autonomous Region in 2023.
Conflict of interest
The authors declare that the research was conducted in the absence of any commercial or financial relationships that could be construed as a potential conflict of interest.
Generative AI statement
The author(s) declare that no Generative AI was used in the creation of this manuscript.
Any alternative text (alt text) provided alongside figures in this article has been generated by Frontiers with the support of artificial intelligence and reasonable efforts have been made to ensure accuracy, including review by the authors wherever possible. If you identify any issue please contact us.
Publisher’s note
All claims expressed in this article are solely those of the authors and do not necessarily represent those of their affiliated organizations, or those of the publisher, the editors and the reviewers. Any product that may be evaluated in this article, or claim that may be made by its manufacturer, is not guaranteed or endorsed by the publisher.
References
1.
Ajayi S Adebiyi A Kadiri S . Increased urinary sodium excretion is associated with systolic blood pressure in first degree relatives of hypertensive patients in Ibadan, southwestern Nigeria. Pan Afr Med J. ((2018)) 31:168. 10.11604/pamj.2018.31.168.16611
2.
World Health Organization. Global Report on Hypertension: The Race Against a Silent Killer. Geneva: World Health Organization, 2023. Available online at:https://www.who.int/publications/i/item/9789240081062
3.
Ge D Zhang X Guo X Chu J Sun L Zhou C . Suicidal ideation among the hypertensive individuals in Shandong, China: a path analysis. BMC Psychiatry. (2019) 19(1):266. 10.1186/s12888-019-2256-7
4.
Goldfarb M De Hert M Detraux J Di Palo K Munir H Music S et al Severe mental illness and cardiovascular disease: JACC state-of-the-art review. J Am Coll Cardiol. (2022) 80(9):918–33. 10.1016/j.jacc.2022.06.017
5.
Rehm J Roerecke M . Cardiovascular effects of alcohol consumption. Trends Cardiovasc Med. (2017) 27(8):534–8. 10.1016/j.tcm.2017.06.002
6.
Kivimäki M Steptoe A . Effects of stress on the development and progression of cardiovascular disease. Nat Rev Cardiol. (2018) 15(4):215–29. 10.1038/nrcardio.2017.189
7.
Borgi M Biondi-Zoccai G Frati G Peruzzi M . Cardiovascular disease and mental health: a dangerous duo?Eur J Prev Cardiol. (2023) 30(15):1686–8. 10.1093/eurjpc/zwad199
8.
Saquib N Brunner R Desai M Kroenke C Martin LW Daviglus M et al Changes in physical and mental health are associated with cardiovascular disease incidence in postmenopausal women. Age Ageing. (2019) 48(3):448–53. 10.1093/ageing/afy213
9.
Schaare HL Blöchl M Kumral D Uhlig M Lemcke L Valk SL et al Associations between mental health, blood pressure and the development of hypertension. Nat Commun. (2023) 14(1):1953. 10.1038/s41467-023-37579-6
10.
Kwapong YA Boakye E Khan SS Honigberg MC Martin SS Oyeka CP et al Association of depression and poor mental health with cardiovascular disease and suboptimal cardiovascular health among young adults in the United States. J Am Heart Assoc. (2023) 12(3):e028332. 10.1161/JAHA.122.028332
11.
Srikanth S Deedwania P . Management of dyslipidemia in patients with hypertension, diabetes, and metabolic syndrome. Curr Hypertens Rep. (2016) 18(10):76. 10.1007/s11906-016-0683-0
12.
Otsuka T Takada H Nishiyama Y Kodani E Saiki Y Kato K et al Dyslipidemia and the risk of developing hypertension in a working-age male population. J Am Heart Assoc. (2016) 5(3):e003053. 10.1161/JAHA.115.003053
13.
Jiang T Wumaier G Li X Yang X Liu J . Research on the effects of occupational stress and the DRD2 gene on the psychological health of workers in the Xinjiang desert oil field. Front Psychiatry. (2021) 12:737228. 10.3389/fpsyt.2021.737228
14.
Yang F Qiu R Abudoubari S Tao N An H . Effect of interaction between occupational stress and polymorphisms of MTHFR gene and SELE gene on hypertension. PeerJ. (2022) 10:e12914. 10.7717/peerj.12914
15.
Li R Gao X Liu B Ge H Ning L Zhao J et al Prospective cohort study to elucidate the correlation between occupational stress and hypertension risk in oil workers from Kelamayi city in the Xinjiang Uygur autonomous region of China. Int J Environ Res Public Health. (2016) 14(1):1. 10.3390/ijerph14010001
16.
Tao N Ge H Wu W An H Liu J Xu X . Association of glucocorticoid receptor gene polymorphism and occupational stress with hypertension in desert petroleum workers in Xinjiang, China. BMC Med Genet. (2018) 19(1):213. 10.1186/s12881-018-0688-4
17.
Ma Y Fa B Yuan X Zhang Y Yu Z . STS-BN: an efficient Bayesian network method for detecting causal SNPs. Front Genet. (2022) 13:942464. 10.3389/fgene.2022.942464
18.
Liu Y Lam KF Wu JT Lam TT . Geographically weighted temporally correlated logistic regression model. Sci Rep. (2018) 8(1):1417. 10.1038/s41598-018-19772-6
19.
Writing Group of 2018 Chinese Guidelines for the Management of Hypertension, Chinese Hypertension League, Chinese Society of Cardiology, Chinese Medical Doctor Association Hypertension Committee, Hypertension Branch of China International Exchange and Promotive Association for Medical and Health Care, Hypertension Branch of Chinese Geriatric Medical Association. (2019) 24(01):24–56. (In Chinese)
20.
Zhu JR Gao RL Zhao SP Lu GP Zhao D Li JJ . Guidelines for prevention and treatment of dyslipidemia in adults in China (2016 revision). Chin J Circ. (2016) 31(10):937–53. (In Chinese)
21.
Chen C Lu FC . The guidelines for prevention and control of overweight and obesity in Chinese adults. Biomed Environ Sci. (2004) 17(Suppl):1–36.
22.
Adidja NM Agbor VN Aminde JA Ngwasiri CA Ngu KB Aminde LN . Non-adherence to antihypertensive pharmacotherapy in Buea, Cameroon: a cross-sectional community-based study. BMC Cardiovasc Disord. (2018) 18(1):150. 10.1186/s12872-018-0888-z
23.
Péterfi O Boda F Szabó Z Ferencz E Bába L . Hypotensive snake venom components—a mini-review. Molecules. (2019) 24(15):2778. 10.3390/molecules24152778
24.
Yang F Zhang Y Qiu R Tao N . Relationship between sleep disorders and hypertension in oil workers in Karamay. J Health Res. (2021) 50(4):586–92. 10.19813/j.cnki.weishengyanjiu.2021.04.009 (in Chinese)
25.
Yang F Zhang Y Qiu RY Tao N . The combined effects of sleep status and occupational stress on hypertension prevalence among oil workers. Chin J Occup Med. (2021) 48(04):386–91 (In Chinese).
26.
Muheyati G Yujie M . Tao ning.relationship between blood lipid levels and hypertension in Xinjiang oil workers based on restricted cubic spline model. Chin J Dis Cont Prev. (2023) 27(04):392–8. 10.16462/j.cnki.zhjbkz.2023.04.004 (In Chinese)
27.
Zhang LY . Epidemiological status and Risk Factors of Hypertension among Occupational Population in a Petroleum Company. Tangshan: North China University of Science and Technology (2020).
28.
Li X Xue Q Yi X Liu J . The interaction of occupational stress, mental health, and cytokine levels on sleep in Xinjiang oil workers: a cross-sectional study. Front Psychiatry. (2022) 13:924471. 10.3389/fpsyt.2022.924471
29.
Cohen BE Edmondson D Kronish IM . State of the art review: depression, stress, anxiety, and cardiovascular disease. Am J Hypertens. (2015) 28(11):1295–302. 10.1093/ajh/hpv047
30.
Zhang F Baranova A Zhou C Cao H Chen J Zhang X et al Causal influences of neuroticism on mental health and cardiovascular disease. Hum Genet. (2021) 140(9):1267–81. 10.1007/s00439-021-02288-x
31.
Ang CW Tan MM Bärnighausen T Reininghaus U Reidpath D Su TT . Mental distress along the cascade of care in managing hypertension. Sci Rep. (2022) 12(1):15910. 10.1038/s41598-022-20020-1
32.
Zhang Y Chen Y Ma L . Depression and cardiovascular disease in elderly: current understanding. J Clin Neurosc. (2018) 47:1–5. 10.1016/j.jocn.2017.09.022
33.
Bell K Hayen A McGeechan K Neal B Irwig L . Effects of additional blood pressure and lipid measurements on the prediction of cardiovascular risk. Eur J Prev Cardiol. (2012) 19(6):1474–85. 10.1177/1741826711424494
34.
Che B Zhong C Zhang R Pu L Zhao T Zhang Y et al Triglyceride-glucose index and triglyceride to high-density lipoprotein cholesterol ratio as potential cardiovascular disease risk factors: an analysis of UK biobank data. Cardiovasc Diabetol. (2023) 22(1):34. 10.1186/s12933-023-01762-2
35.
Bibiloni MM Salas R Pons A Tur JA . Prevalence of dyslipidaemia and associated risk factors among Balearic islands adolescents, a Mediterranean region. Eur J Clin Nutr. (2015) 69(6):722–8. 10.1038/ejcn.2014.236
36.
Chen JX Li R Geng T Wang Y Lu Q Tu ZZ et al Differences in HDL-related mortality risk between individuals with and without hypertension: a prospective cohort study in UK biobank. Eur J Prev Cardiol. (2023) 30(10):951–9. 10.1093/eurjpc/zwad053
37.
Dąbrowska E Narkiewicz K . Hypertension and dyslipidemia: the two partners in endothelium-related crime. Curr Atheroscler Rep. (2023) 25(9):605–12. 10.1007/s11883-023-01132-z
38.
Xi Y Niu L Cao N Bao H Xu X Zhu H et al Prevalence of dyslipidemia and associated risk factors among adults aged ≥35 years in northern China: a cross-sectional study. BMC Public Health. (2020) 20(1):1068. 10.1186/s12889-020-09172-9
39.
Xie H Zhuang Q Mu J Sun J Wei P Zhao X et al The relationship between lipid risk score and new-onset hypertension in a prospective cohort study. Front Endocrinol (Lausanne). (2022) 13:916951. 10.3389/fendo.2022.916951
40.
Sha S Liu M Sun M Xiao L Chang Q Chen Y et al Abnormal myocardial enzymes in the prediction of mortality and hypertension in COVID-19 patients: a retrospective study. Aging (Albany NY). (2022) 14(21):8585–94. 10.18632/aging.204362
41.
Ungvari Z Toth P Tarantini S Prodan CI Sorond F Merkely B et al Hypertension-induced cognitive impairment: from pathophysiology to public health. Nat Rev Nephrol. (2021) 17(10):639–54. 10.1038/s41581-021-00430-6
42.
Fontes MAP Marins FR Patel TA de Paula CA Dos Santos Machado LR de Sousa Lima ÉB et al Neurogenic background for emotional stress-associated hypertension. Curr Hypertens Rep. (2023) 25(7):107–16. 10.1007/s11906-023-01235-7
43.
Ferreira NS Tostes RC Paradis P Schiffrin EL . Aldosterone, inflammation, immune system, and hypertension. Am J Hypertens. (2021) 34(1):15–27. 10.1093/ajh/hpaa137
44.
Nemcsik-Bencze Z Kőrösi B Gyöngyösi H Batta D László A Torzsa P et al Depression and anxiety in different hypertension phenotypes: a cross-sectional study. Ann Gen Psychiatry. (2022) 21(1):23. 10.1186/s12991-022-00400-7
45.
Sensoy B Gunes A Ari S . Anxiety and depression levels in COVID-19 disease and their relation to hypertension. Clin Exp Hypertens. (2021) 43(3):237–41. 10.1080/10641963.2020.1847132
46.
Shah RM Doshi S Shah S Patel S Li A Diamond JA . Impacts of anxiety and depression on clinical hypertension in low-income US adults. High Blood Press Cardiovasc Prev. (2023) 30(4):337–42. 10.1007/s40292-023-00584-3
47.
Meng L Bai X Zheng Y Chen D Zheng Y . Altered expression of norepinephrine transporter participate in hypertension and depression through regulated TNF-α and IL-6. Clin Exp Hypertens. (2020) 42(2):181–9. 10.1080/10641963.2019.1601205
Summary
Keywords
hypertension, mental health, physiologic health, oil workers, TG
Citation
Song Z, Ma X, Li X and Liu J (2025) Cross-sectional study on the relationship between physiologic and mental health status and hypertension risk among oil workers in Xinjiang. Front. Cardiovasc. Med. 12:1503662. doi: 10.3389/fcvm.2025.1503662
Received
22 November 2024
Accepted
15 August 2025
Published
26 September 2025
Volume
12 - 2025
Edited by
Ivan Cavero-Redondo, Universidad de Castilla-La Mancha, Spain
Reviewed by
Ting Zhang, Shanwei Public Health Center, China
Rodrigue Khonde, Kinshasa School of Public Health, Democratic Republic of Congo
Updates
Copyright
© 2025 Song, Ma, Li and Liu.
This is an open-access article distributed under the terms of the Creative Commons Attribution License (CC BY). The use, distribution or reproduction in other forums is permitted, provided the original author(s) and the copyright owner(s) are credited and that the original publication in this journal is cited, in accordance with accepted academic practice. No use, distribution or reproduction is permitted which does not comply with these terms.
* Correspondence: Jiwen Liu liujiwen123123@126.com
†These authors have contributed equally to this work
Disclaimer
All claims expressed in this article are solely those of the authors and do not necessarily represent those of their affiliated organizations, or those of the publisher, the editors and the reviewers. Any product that may be evaluated in this article or claim that may be made by its manufacturer is not guaranteed or endorsed by the publisher.