 Yuqiao Chen
 Jun Zhuang1,†
- 1Department of Cardiology, Changzhou Hospital of Traditional Chinese Medicine, Changzhou, Jiangsu, China
- 2Department of Cardiology, Anhui No.2 Provincial People’s Hospital, Hefei, Anhui, China
- 3Department of Echocardiography and Cardiology, The Third Affiliated Hospital of Soochow University, Changzhou, Jiangsu, China
Background: Pulmonary vein isolation (PVI) remains the cornerstone of catheter ablation in paroxysmal atrial fibrillation (PAF). However, the recurrence of AF after PVI needs further investigation. The left atrial posterior wall (LAPW) is embryologically related to the pulmonary vein and plays an important role in the initiation and maintenance of AF. This study aims to explore the relationship between the 3D electroanatomical mapping parameters of the LAPW and recurrence in patients with PAF.
Methods: A retrospective analysis was conducted on patients with PAF who underwent PVI. Both clinical and procedural characteristics from the enrolled subjects were collected before PVI. 3D electroanatomical mapping anatomical and electrical parameters were measured and calculated in the CARTO system. Intergroup comparisons and multivariate logistic regression analysis were performed to demonstrate the relationship between the parameters of LAPW and AF recurrence. A combined prediction model for AF recurrence was constructed in this study.
Results: A total of 120 patients were included in the final analysis. Among procedural characteristics, compared with Group 1 (no recurrence), there was a significantly larger posterior wall surface area (PWSA) (p = 0.013) and a percentage of very low-voltage area (PVLVA) (p < 0.001) in Group 2 (recurrence). Further analysis revealed that there was a significant difference between the two groups in terms of the distribution of VLVA (p = 0.026). Subsequently, in a multivariate logistic regression analysis, both PWSA and PVLVA were found to be independent risk factors for AF recurrence [odds ratio (OR): 1.457, 95% confidence interval (CI): 1.037–2.049, p = 0.030; OR: 1.059, 95% CI: 1.013–1.107, p = 0.012, respectively]. Finally, a prediction model that combined the PWSA with the PVLVA for AF recurrence was constructed to draw the receiver operating characteristic curve. The area under the curve of this model was 0.900 (0.827–0.973) (p < 0.001). The result, evaluated by using the Hosmer–Lemeshow goodness-of-fit test, showed that χ2 = 4.643 (p = 0.796).
Conclusions: This study demonstrates that both PWSA and PVLVA were independent risk factors for AF recurrence. Moreover, we proposed a model that combined the PWSA with the PVLVA to predict the recurrence of AF, which may provide an approach for screening patients with PAF who may require attention for the LAPW.
Introduction
Atrial fibrillation (AF) is an arrhythmia with increasing global incidence and prevalence (1, 2). AF is associated with serious adverse events and increased mortality (3–5). More and more evidence has shown that catheter ablation is an important approach for rhythm control in patients with paroxysmal AF (PAF) (6, 7), which also leads to a lower risk of adverse cardiovascular outcomes (8) and improvement in quality of life (9). Nowadays, pulmonary vein isolation (PVI) remains the cornerstone of catheter ablation in AF (7, 10). However, AF recurrence after catheter ablation remains a clinical concern (11, 12), which eventuates excess suffering in, and economic burden on, patients (13).
The left atrial (LA) posterior wall (PW) has been shown to contribute to the initiation and maintenance of AF (14, 15). As a consequence, ablation in the LAPW has evolved as a strategy in surgery (16). Notably, the LAPW and the esophagus are adjacent anatomically (16). This may be the leading lesion to the esophagus when catheter ablation, especially radiofrequency ablation (RFA), is performed in the LAPW. Disastrous consequences may occur when LA-esophageal fistula forms (17). Accordingly, the option of PW isolation should be exercised with caution (18).
Presently, research studies on LAPW ablation mostly focus on non-PAF (19, 20), but still traces of recurrence can be found in patients with PAF due to the triggering and maintenance mechanisms associated with the PW (21). It is worth studying how to identify these patients.
Currently, wide antral circumferential ablation of PVI is considered to be an effective measure to reduce AF recurrence (22), as the myocardium in the expansive area is thicker, resulting in a decrease in the first-pass isolation rate and an increase in the number of gaps (23). These are likely followed by a prolongation of operation time and an increase in complication rates. There is no unified standard ablation strategy for determining power, pressure, and duration time for PVI when targeted in the LAPW. The selection of a different ablation index (AI) would vary according to the degree of pain experienced by patients and concerns for the occurrence of LA-esophageal fistula. Hence, it is worth considering which patient is more suitable for wide antral ablation and for selecting an increased AI in the LAPW.
A three-dimensional (3D) electroanatomical model reconstructed by the CARTO-3 mapping system (version 6.0, Biosense Webster, Inc.) with non-fluoroscopy displays a very realistic model (24), which is in excellent concordance with CT (25). The area and the voltage of the LAPW can be determined in the CARTO system. This study aims to detect the relationship between the parameters of the LAPW in the 3D electroanatomical map and recurrence in patients with PAF.
Methods
Research subjects
A single-center, retrospective cohort method was performed in this study. Patients with PAF admitted to the Changzhou Hospital of Traditional Chinese Medicine from January 2021 to August 2023 and scheduled to undergo RFA were enrolled in this research. Inclusion criteria were as follows: (1) older than 18 years old; (2) diagnosis of PAF (defined as a sustained episode lasting <7 days or chemical and/or electrical cardioversion <7 days); (3) sinus rhythm when mapping; (4) patients who had received PVI alone; (5) complete basic information, procedure, and follow-up data. Exclusion criteria included: (1) severe organic heart disease (such as severe mitral regurgitation or stenosis, severe aortic regurgitation or stenosis, hypertrophic obstructive cardiomyopathy, etc.); (2) history of previous cardiac surgery; (3) patients with incomplete clinical and follow-up data. This study adhered to the Helsinki Declaration and received approval from the Scientific Ethics Committee of Changzhou Hospital of Traditional Chinese Medicine (2023-LL-017l); it was already registered in the Chinese Clinical Trial Registry (ChiCTR2300079137).
Catheter ablation
Catheter ablation was carried out in the CARTO system. All procedures were performed without interruption of anticoagulant therapy and off antiarrhythmic medications. The high-density multielectrode mapping catheter [PentaRay (Biosense Webster, Inc.)] and irrigated contact force sensing ablation catheter [Thermocool SmartTouch ST or STSF (Biosense Webster, Inc.)] were introduced into the left atrium with transseptal puncture.
PentaRay reconstructed the electroanatomical map of the left atrium, including the main part of the left atrium, the left atrial appendage (LAA), and the pulmonary veins (PVs) after excluding the inspiratory phase through fast anatomical mapping (FAM). Then, ST or STSF examined the true boundary of the map further through contact force. Thus, a more realistic LA model could be revealed.
Ablation was performed with ST or STSF at a power of 35 W. The discharge time was determined according to the AI at each tag, with an intertag distance ≤6 mm. A target AI of 480–530 for the roof, anterior, and ridge; 420–450 for the inferior; and 360–380 for the posterior were recommended. PVI was defined by PV entrance and exit block.
Clinical baseline indicators
Clinical baseline indicators of patients were collected, including gender, age, body mass index (BMI), duration of AF, CHA2DS2-VASc score, and medical history [including heart failure (HF), hypertension, diabetes mellitus (DM), and stroke or transient ischemic attack (TIA)].
Laboratory indicators [including urea nitrogen, creatinine, and N-terminal precursor protein brain natriuretic peptide (NT-proBNP)], and echocardiographic indicators [including the left atrial diameter (LAD), left ventricular end-diastolic diameter (LVEDD), left ventricular end-systolic diameter (LVESD), and left ventricular ejection fraction (LVEF)] were collected.
Acquisition of anatomical and electrical parameters in the electroanatomical map
Anatomical and electrical parameters were measured in the 3D electroanatomical map of the CARTO system. All parameters were obtained from the maps before ablation.
Because of the embryonic homology between the PW and the PVs, the area of the PV ostia was also measured in this study. A new map was saved (Map 1) after obtaining the initial map. In Map 1, we drew a short line along the axial direction of PVs from the superior, inferior, anterior, and posterior orientation to assist us in the next step (Figure 1). Then, we utilized the function of “clipping pane” to make a vertical section at the PV ostia [the right superior pulmonary vein (RSPV), the right inferior pulmonary vein (RIPV), the left superior pulmonary vein (LSPV), and the left inferior pulmonary vein (LIPV), respectively]. The measurement would be merged in the common pulmonary vein, and the accessory pulmonary vein was also measured if it resembled the main bifurcation. Subsequently, the diameters of the long axis (a) and the short axis (b) of each PV were measured separately (Figure 1). According to the calculation formula ellipse area = π × (a/2) × (b/2), the PV ostia area was obtained. The total area of the right PV (RPV) and left PV (LPV) was added up by each bifurcation. All parameters were measured independently by two researchers and an interobserver agreement was reached.
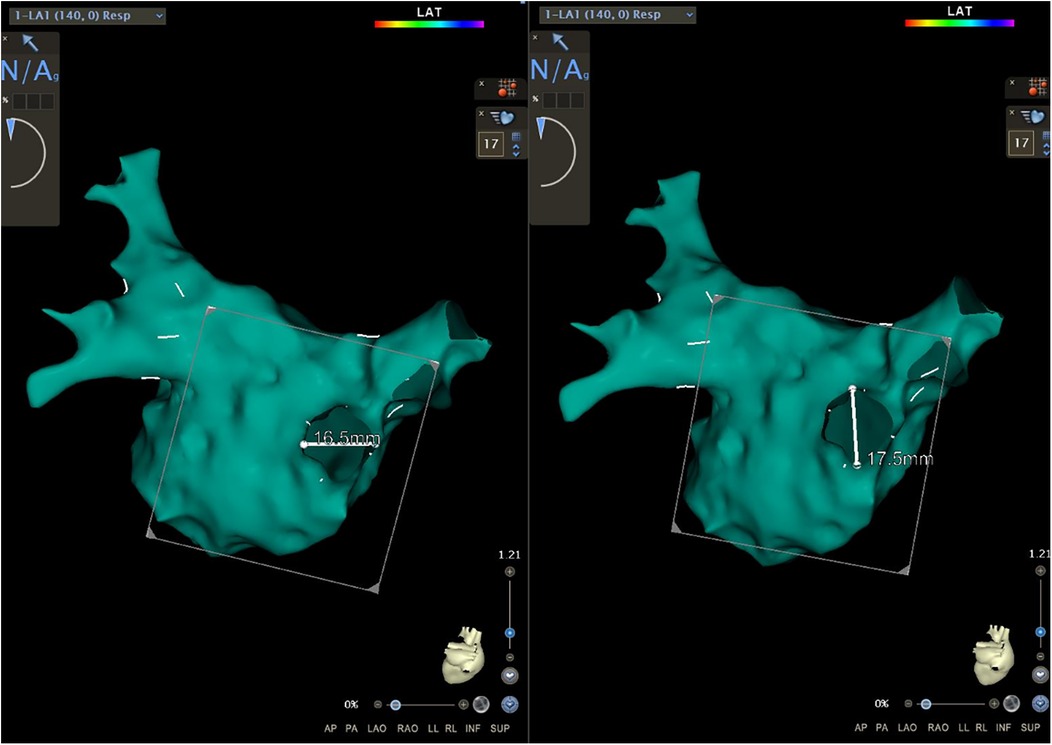
Figure 1. The function of the “clipping pane” was used to measure the diameters of the long axis and the short axis of each PV separately. RSPV, right superior pulmonary vein; RIPV, right inferior pulmonary vein; LSPV, left superior pulmonary vein; LIPV, left inferior pulmonary vein.
A map was saved again (Map 2) after completing this step. In Map 2, we drew another short line at the roof and the bottom of the PW. The inferior line was defined as a line located at the lowest margin between the RIPV and the LIPV in the posterior view (Figure 2a). The superior line was defined as a line that connected the middle of the LSPV and RSPV ostia in the superior view (SUP) (Figure 2b). The PW surface area (PWSA) was composed of the area delineated by the superior and inferior line and 0.5–1 cm outside the PV ostia. Then, the function of “area measurement” was used to measure and calculate the area (Figure 3).
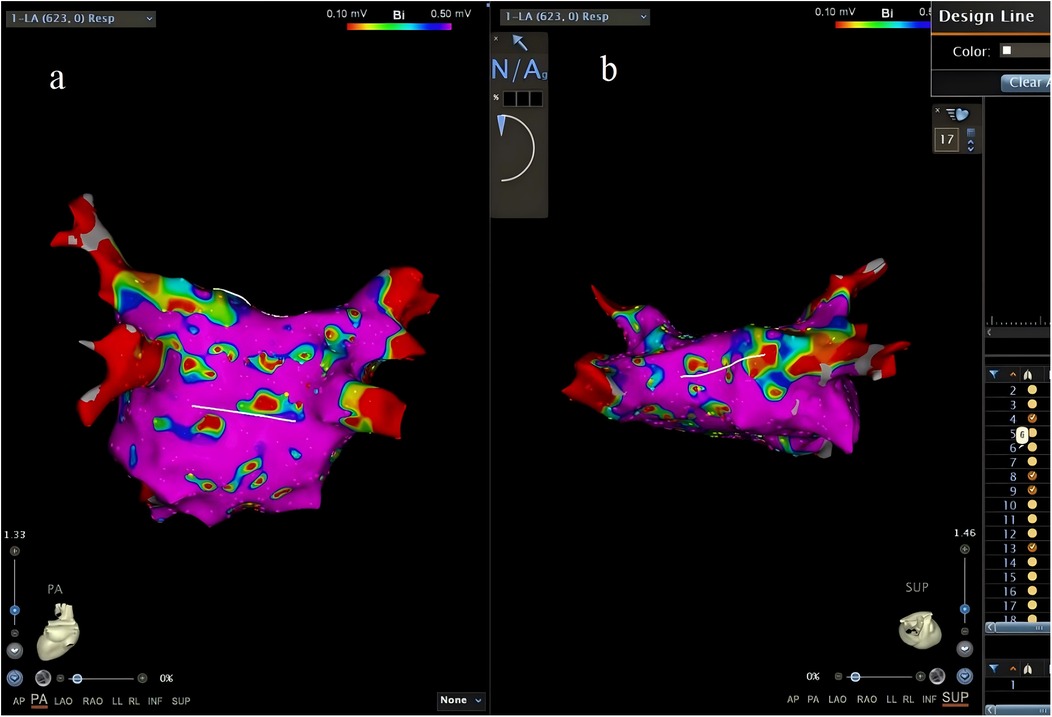
Figure 2. The inferior line (a) and the superior line (b) were drawn.
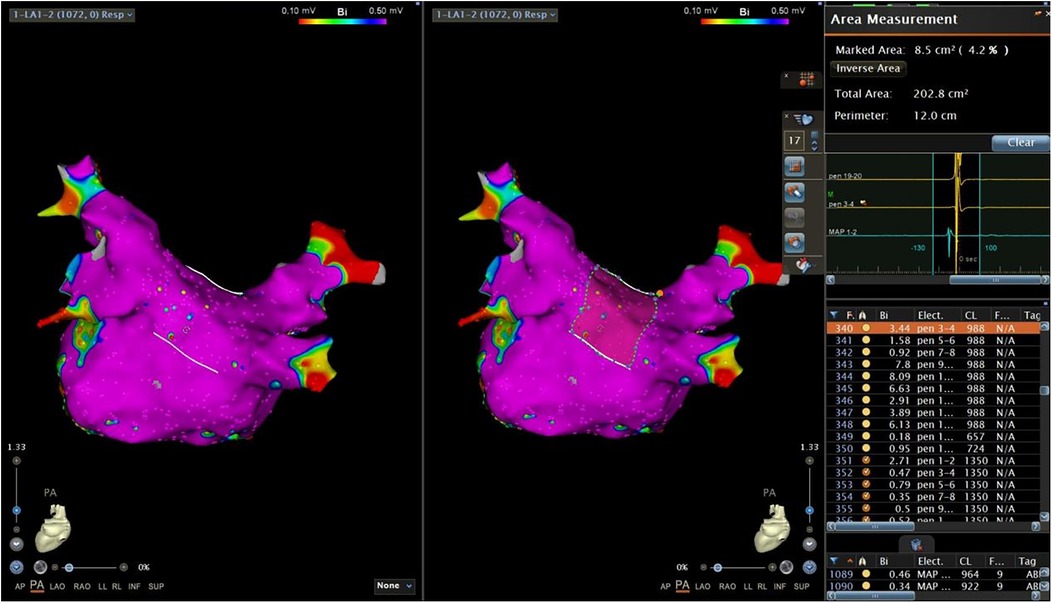
Figure 3. The function of “area measurement” was used to measure and calculate the PWSA. PWSA, posterior wall surface area.
The next step was to copy activation mapping points in the PW area to another map (Map 3) (Figure 4). In Map 3, after switching the bipolar map, we sorted all copied points by voltage (Figure 5). A very low-voltage area (VLVA) in the electrogram was defined as an amplitude of ≤0.1 mV. We subsequently counted the points with voltage ≤0.1 mV and calculated the percentage of the VLVA (PVLVA) in the LAPW (Figure 5)
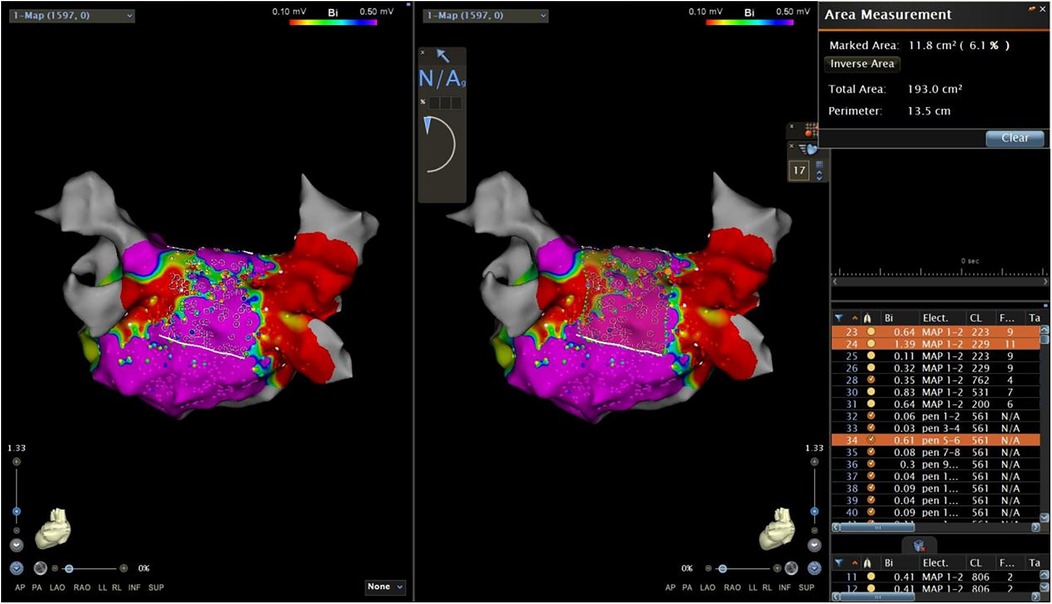
Figure 4. Copied activation mapping points in the PW area. PW, posterior wall.
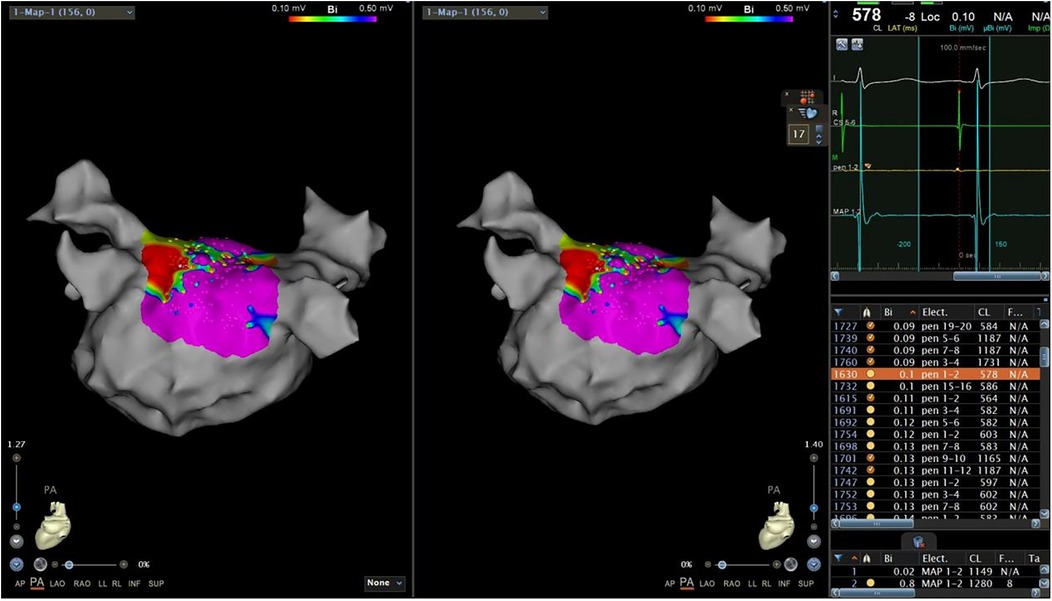
Figure 5. Copied points to another map and sorted all copied points by voltage.
In this study, we divided the distribution of the VLVA in the LAPW into two parts, namely, the connection of PVs and the LAPW (PV ostium in the PW) and the intra-atrial region in the PW (Figures 6a,b).
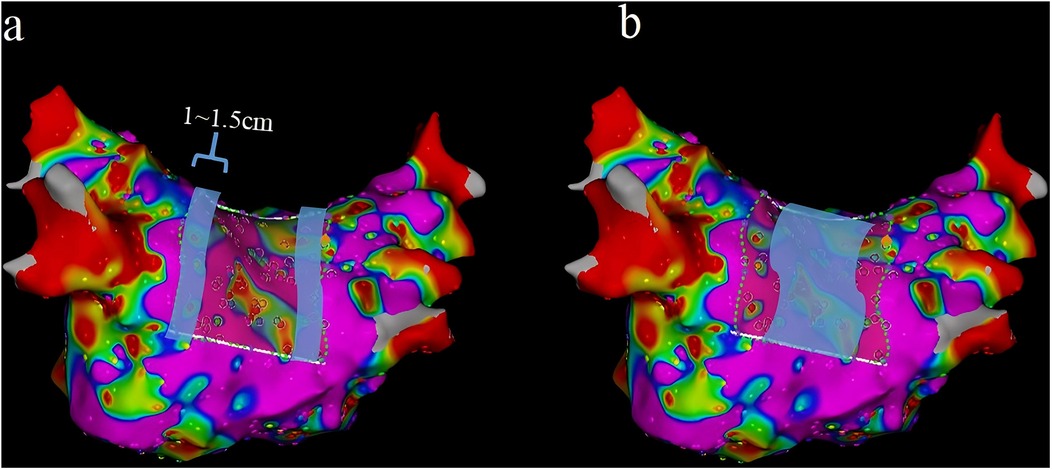
Figure 6. Two parts of the LAPW: PV ostium in the PW (the width was 1–1.5 cm) (a) and the intra-atrial region in the PW (b) LAPW, left atrial posterior wall; PV pulmonary veins.
Follow-up
Procedural success was defined as freedom from recurrent atrial arrhythmias lasting longer than 30 s after an initial 3-month blanking period. Recurrent arrhythmias were classified as being AF, atrial tachycardia, or both. Patients underwent a clinical review and 24 h Holter monitoring at 3, 6, and 12 months.
Statistical analysis
Statistical analysis was performed using SPSS Statistics Software version 26 (IBM, Inc.). Measurement data that followed a normal distribution pattern are expressed as mean ± standard deviation (x ± s). In cases where these data had a mildly skewed distribution, the median was used. Either an independent sample t-test or the Kruskal–Wallis test was performed in intergroup comparisons. Counting data were presented as a percentage, and intergroup comparisons were conducted using the chi-square test or Fisher's precision probability test. A univariate logistic regression analysis assessed the association of different factors and AF recurrence. After collinearity analysis (tolerance <0.1 or variance inflation factor >10 meant multicollinearity between variables), a multivariate logistic regression analysis was employed to evaluate which factor was an independent risk factor for AF recurrence. A p-value <0.05 was considered statistically significant. If a covariate that changed the estimates of AF recurrence had a significant association (p < 0.10) in the univariate logistic regression analysis, it would be included as a potential confounding factor in the multivariate logistic regression analysis. A receiver operating characteristic (ROC) curve was used to construct the combined prediction model for AF recurrence. If the area under the curve (AUC) was greater than 0.75, it indicated better predictive ability. A Hosmer–Lemeshow goodness-of-fit test was performed to evaluate the calibration ability of the prediction model, and a p-value >0.05 was considered a good fit of the model.
Results
Baseline characteristics
According to the inclusion and exclusion criteria, a total of 128 patients were enrolled in this study. Of the initial participants, eight were excluded from the final analysis (including six incomplete data and two lost to follow-up) (Figure 7). Consequently, the baseline characteristics of 120 patients are presented in Table 1. According to the occurrence or non-occurrence of recurrent arrhythmias, these patients were divided into Group 1 (no recurrence) and Group 2 (recurrence). Group 1 comprised 49 males and 60 females, averaging 67.66 ± 12.60 years. Group 2 was composed of four males and seven females, averaging 67.18 ± 13.23 years. There was no significant difference between the two groups in terms of gender, age, BMI, duration of AF, CHA2DS2-VASc score, history of hypertension, DM and stroke, or TIA, except for a history of HF (p = 0.028). There was also no statistical difference in terms of urea nitrogen, creatinine, NT-proBNP, LAD, LVEDD, LVESD, and LVEF (Table 1).
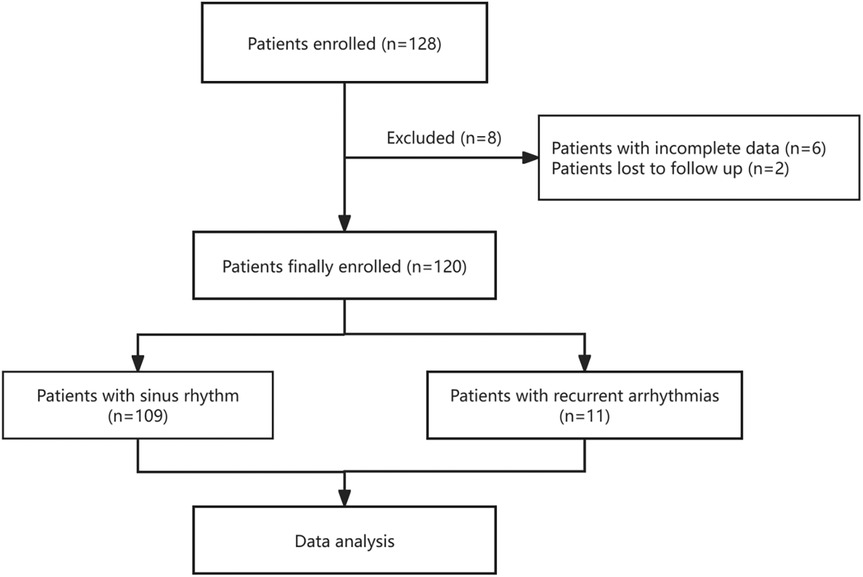
Figure 7. Flowchart of the study.
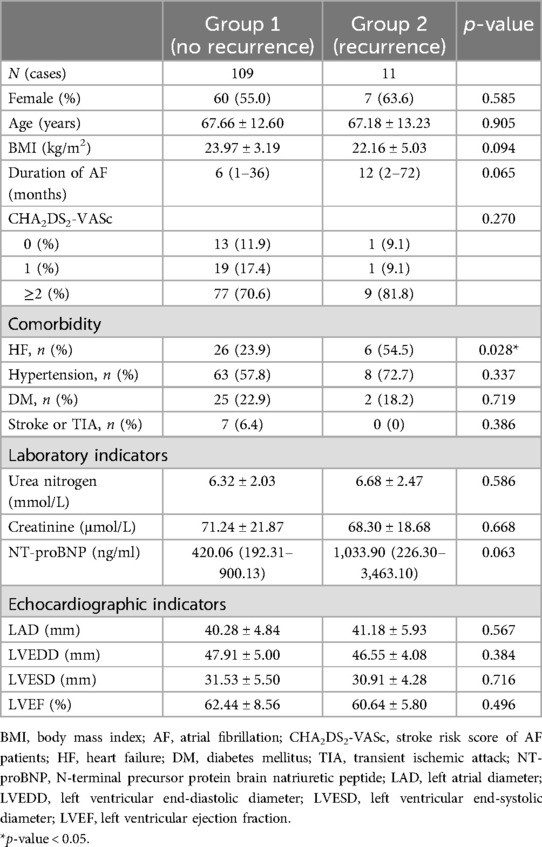
Table 1. Baseline characteristics.
Procedural characteristics
Procedural characteristics are presented in Table 2. The areas of the PV ostia (RPV and LPV, respectively) and the PWSA and the PVLVA were measured and calculated. The complications were recorded. Among the procedural characteristics, patients in Group 2 were found to have a significantly larger PWSA (p = 0.013) and PVLVA (p < 0.001) (Table 2).
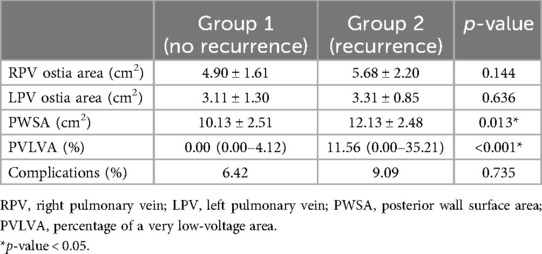
Table 2. Procedural characteristics.
Analysis of the distribution of the VLVA
In patients with the VLVA in the LAPW, the proportions of distribution of the VLVA in the PV ostium in the PW, the intra-atrial region in the PW, and the mixed areas (contained both) were 60.0%, 20.0%, and 20.0%, respectively, in Group 1 and 12.5%, 12.5%, and 75.0%, respectively, in Group 2 (p = 0.026) (Table 3).
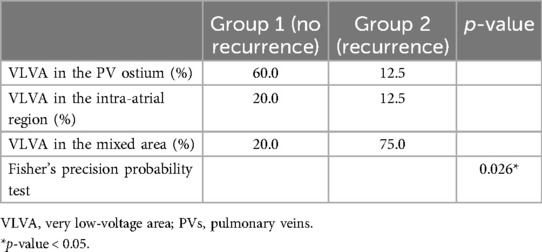
Table 3. Analysis of the distribution of the VLVA.
Univariate logistic regression analysis of the baseline and procedural characteristics with AF recurrence
AF recurrence was used as the dependent variable and baseline and procedural characteristics as independent variables. A univariate logistic regression analysis was performed to identify the potential factors associated with AF recurrence. The result showed that the BMI [odds ratio (OR): 0.839, 95% confidence interval (CI): 0.682–1.032, p = 0.096], HF (OR: 3.831, 95% CI: 1.080–13.585, p = 0.038), PWSA (OR: 1.369, 95% CI: 1.056–1.775, p = 0.018), and PVLVA (OR: 1.064, 95% CI: 1.025–1.103, p = 0.001) were potential factors related to AF recurrence (p < 0.10) (Table 4).
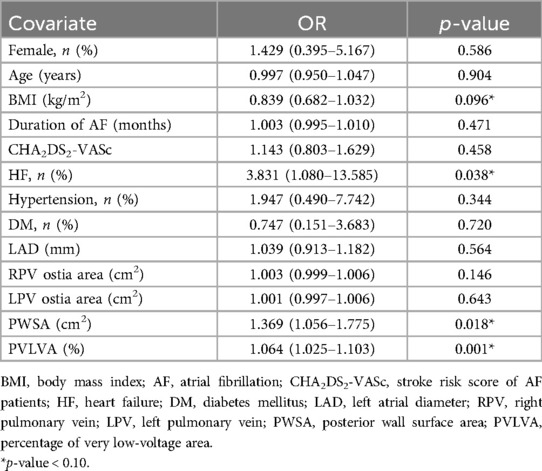
Table 4. Univariate logistic regression analysis of baseline and procedural characteristics with AF recurrence.
Multivariate logistic regression analysis of potential factors on AF recurrence
Although the p-value of the LAD was >0.10 in the univariate logistic regression analysis, it was a common influencing clinical factor, which was also included in the multivariate logistic regression analysis. The collinearity analysis of the BMI, HF, LAD, PWSA, and PVLVA were performed at first. The results showed that there was no linear relationship between these variables (Table 5). Then, a multivariate logistic regression analysis of potential factors demonstrated that both the PWSA and the PVLVA were independent risk factors for AF recurrence (OR: 1.457, 95% CI: 1.037–2.049, p = 0.030; OR: 1.059, 95% CI: 1.013–1.107, p = 0.012, respectively) (Table 6).

Table 5. Collinearity analysis.
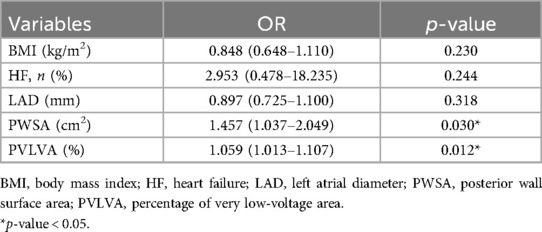
Table 6. Multivariate logistic regression analysis of potential factors for AF recurrence.
ROC curve and curve fitting
According to the logistic regression analysis of this study, the HF, LAD, PWSA, and PVLVA were included to construct the combined prediction model for AF recurrence and to draw the ROC curve (Figure 8). The equation was Logit (P) = −0.057 + 1.296 × HF − 0.175 × LAD + 0.342 × PWSA + 0.066 × PVLVA. The finding revealed that the AUC of this model was 0.900 (0.827–0.973) (p < 0.001) (Figure 8). The Hosmer–Lemeshow goodness-of-fit test was performed to evaluate the calibration ability of the prediction model (Figure 9). The result suggested that there was no statistical difference between the predicted value of the model and the observed value (χ2 = 4.643, p = 0.796).
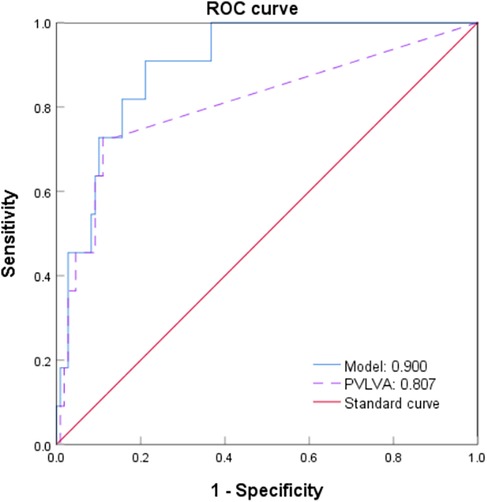
Figure 8. ROC curve of a combined model for predicting AF recurrence. ROC, receiver operating characteristic; AF, atrial fibrillation.
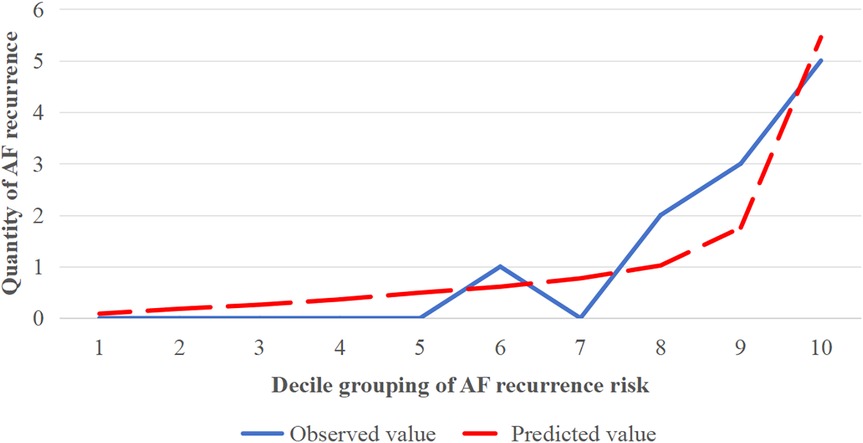
Figure 9. Hosmer–Lemeshow goodness-of-fit test (curve fitting).
Discussion
The main findings of this study revealed that for patients with PAF who underwent PVI potential risk factors for AF recurrence could be discovered through the 3D electroanatomical map in the CARTO system. The area of the LAPW and the PVLVA may be associated with PAF recurrence.
Spontaneous trigger activity and rotors in the LAPW have been reported previously (26). In structurally normal hearts, focal discharges from the PVs and the LAPW are important initiating factors of AF (27). Recurrent PAF after one year is partly due to LAPW triggers (28). For patients with PAF who underwent PVI alone, the recurrence was observed to involve the reentry of PVs and non-PV triggers. The recovery of PV ostium potential in the PW and other triggers within the intra-atrial region in the PW that were not ablated are recurrent factors associated with the LAPW. This may be elucidated from an anatomical standpoint. The LAPW is embryologically related to the PV (29). There is some interplay between the PVs and the LAPW musculature (30), resulting in conduction delay histopathologically and functionally (31). Non-contact mapping has also demonstrated significant conduction abnormalities in the LAPW in patients with PAF during sinus rhythm (32). Consequently, a part of recurrent foci of patients with PAF are derived from the LAPW, which is supported by numerous anatomical and electrical foundations.
Currently, research on LAPW triggers is primarily focused on non-PAF, with the most common intervention method being PW isolation (such as endocardial box isolation) (18, 19). There are only a few studies focusing on the PW in PAF. In this study, we measured the PWSA and the VLVA of patients with PAF before PVI in the CARTO system. The result demonstrated that there was a wider PWSA (p = 0.013) in recurrent patients. The PWSA was an independent risk factor for AF recurrence (OR: 1.457, 95% CI: 1.037–2.049, p = 0.030). However, there was no significant difference between the two groups in the LAD and the area of PV ostia. The lack of significant differences in LA size and AF burden among these patients may account for these results. In addition, the mild degree of LA structural remodeling may contribute to the outcomes. This indicated that the increase in the PWSA may not be due to the overall expansion of the left atrium. As AF persists and progresses, there would be a gradual expansion in both LA volume and PV opening area. The larger the LAPW, the broader the range of heterogeneity that can potentially occur, thereby increasing the likelihood of triggering foci in the PW.
The magnitude and conduction time of the electrical potential serve as indicators for cardiomyocyte health (33). Atrial fibrosis can impact the extracellular matrix, thereby influencing both electrical and mechanical functioning of the LA (34). The extent of atrial fibrosis is closely linked to AF recurrence (35, 36). Low-voltage or non-voltage electrograms and slow conduction are often considered manifestations of scar tissue or fibrosis (33, 37). The normal range of bipolar voltage of the LA is usually 0.3–1.0 mV (38). The region where a voltage <0.5 mV is typically considered is the low-voltage zone (39). Therefore, we defined the region with amplitude ≤0.1 mV as the VLVA in this study. The result showed that the recurrence group had a greater range of VLVA (p < 0.001). The PVLVA was also an independent risk factor for AF recurrence (OR: 1.059, 95% CI: 1.013–1.107, p = 0.012). Compared with Group 1, the VLVA of Group 2 exhibited a more extensive distribution, primarily within the mixed area (p = 0.026). This observation may suggest an increased presence of potential triggering foci in the PW or a greater complexity in heterogeneity at the junction between the PW and the PVs in these patients. The complexity may also include a significant anisotropy of crista terminalis and the subendocardial fiber around the septopulmonary bundle (30, 32). Anatomically, certain patients exhibit a layer of adipose tissue that separates the septopulmonary bundle from the atrial myocardium, which impedes the penetration of radiofrequency energy. Consequently, this barrier allows for the persistence of epicardial conduction through the septopulmonary bundle, preventing the achievement of a true conduction block, which related to AF recurrences (40). Because of the early stage of AF, most patients with PAF exhibit a relatively healthy myocardium, with fewer conduction abnormalities or low-voltage areas. This underscores the significance of early detection of abnormal myocardial electrical activity.
Although there are many prediction models, the accuracy of predicting the recurrence of AF was not high enough (41). These prediction models predominantly include variables such as age, BMI, category of AF, LAD, LVEF, current smoking habits, and estimated glomerular filtration rate. The majority of these models have an AUC below 0.75. One potential explanation for this could be that these variables are almost entirely derived from non-invasive evaluations of the patient, with limited data on the electrical and anatomical characteristics of the patient's atria, which are frequently associated with AF recurrence. In this study, the prediction model that the PWSA combined with the PVLVA for AF recurrence was constructed by potential clinical factors and prior analysis. The AUC of the model achieved a moderate efficacy of 0.900 (0.827–0.973) (p < 0.001) in predicting AF recurrence after RFA, which was verified by using the Hosmer–Lemeshow goodness-of-fit test (p > 0.05). The advantage of this predictive model lay in its specific focus on the LAPW, encompassing both PV ostium in the PW and the intra-atrial region in the PW, while simultaneously considering the area of the PW and the degree and distribution of abnormal conduction.
At present, ongoing efforts are focused on achieving permanent PVI by techniques during an initial RFA (42). However, given the anatomical and electrophysiological significance of the LAPW, as well as the potential complications associated with inappropriate ablation, determining the optimal ablation depth for this region during PVI is a question worthy of careful consideration. The latest study indicated that during ablation in the LAPW, selecting the strategy of 50 W/>10–15 s, as opposed to 40 W/10–15 s and 90 W/4 s, facilitated a more effective transmural lesion and resulted in a more durable block (43). Furthermore, for patients with PAF exhibiting an abnormal PW matrix, selecting ablation strategies for other regions of the PW beyond PVI also warrants further investigation.
Limitations
There were several limitations in this study. First of all, this study was a single-center, retrospective cohort study, with a relatively small sample size. Second, there was still a possibility of residual confounding factors in the multivariate logistic regression model. Moreover, although activation mapping points were considered as uniformly as possible on the map, it still could not completely represent the real situation of voltage distribution. Finally, the mechanism between the PWSA and the PVLVA with AF recurrence is currently unknown. Therefore, more research is needed to clarify the specific pathophysiological mechanism.
Conclusions
In summary, this study provided a method for predicting recurrence in patients with PAF, utilizing parameters related to the LAPW based on the CARTO system, prior to undergoing PVI. The analysis demonstrated that both PWSA and PVLVA were independent risk factors for AF recurrence. Moreover, we proposed a model that combined the PWSA with the PVLVA to predict the recurrence of AF, which may provide an approach for screening PAF patients who may require attention for the LAPW.
Data availability statement
The raw data supporting the conclusions of this article will be made available by the authors, without undue reservation.
Ethics statement
The studies involving humans were approved by the Scientific Ethics Committee of the Changzhou Hospital of Traditional Chinese Medicine. The studies were conducted in accordance with the local legislation and institutional requirements. The participants provided their written informed consent to participate in this study.
Author contributions
YC: Conceptualization, Data curation, Formal Analysis, Writing – original draft, Writing – review & editing. JZ: Conceptualization, Data curation, Formal Analysis, Writing – original draft, Writing – review & editing. XL: Data curation, Formal Analysis, Writing – original draft. CZ: Data curation, Formal Analysis, Investigation, Writing – original draft. XC: Conceptualization, Formal Analysis, Investigation, Writing – original draft. ZX: Conceptualization, Formal Analysis, Investigation, Writing – original draft, Writing – review & editing. XF: Conceptualization, Formal Analysis, Investigation, Writing – original draft, Writing – review & editing.
Funding
The author(s) declare that no financial support was received for the research, authorship, and/or publication of this article.
Conflict of interest
The authors declare that the research was conducted in the absence of any commercial or financial relationships that could be construed as a potential conflict of interest.
Generative AI statement
The author(s) declare that no Generative AI was used in the creation of this manuscript.
Publisher's note
All claims expressed in this article are solely those of the authors and do not necessarily represent those of their affiliated organizations, or those of the publisher, the editors and the reviewers. Any product that may be evaluated in this article, or claim that may be made by its manufacturer, is not guaranteed or endorsed by the publisher.
References
1. Schnabel RB, Yin X, Gona P, Larson MG, Beiser AS, McManus DD, et al. 50 year trends in atrial fibrillation prevalence, incidence, risk factors, and mortality in the Framingham heart study: a cohort study. Lancet. (2015) 386(9989):154–62. doi: 10.1016/S0140-6736(14)61774-8
2. Tsao CW, Aday AW, Almarzooq ZI, Anderson CAM, Arora P, Avery CL, et al. Heart disease and stroke statistics—2023 update: a report from the American Heart Association. Circulation. (2023) 147(8):e93–621. doi: 10.1161/CIR.0000000000001123
3. Bassand JP, Accetta G, Al Mahmeed W, Corbalan R, Eikelboom J, Fitzmaurice DA, et al. Risk factors for death, stroke, and bleeding in 28,628 patients from the GARFIELD-AF registry: rationale for comprehensive management of atrial fibrillation. PLoS One. (2018) 13(1):e0191592. doi: 10.1371/journal.pone.0191592
4. Ruddox V, Sandven I, Munkhaugen J, Skattebu J, Edvardsen T, Otterstad JE. Atrial fibrillation and the risk for myocardial infarction, all-cause mortality and heart failure: a systematic review and meta-analysis. Eur J Prev Cardiol. (2017) 24(14):1555–66. doi: 10.1177/2047487317715769
5. Dai H, Zhang Q, Much AA, Maor E, Segev A, Beinart R, et al. Global, regional, and national prevalence, incidence, mortality, and risk factors for atrial fibrillation, 1990–2017: results from the global burden of disease study 2017. Eur Heart J Qual Care Clin Outcomes. (2021) 7(6):574–82. doi: 10.1093/ehjqcco/qcaa061
6. Cosedis Nielsen J, Johannessen A, Raatikainen P, Hindricks G, Walfridsson H, Kongstad O, et al. Radiofrequency ablation as initial therapy in paroxysmal atrial fibrillation. N Engl J Med. (2012) 367(17):1587–95. doi: 10.1056/NEJMoa1113566
7. Morillo CA, Verma A, Connolly SJ, Kuck KH, Nair GM, Champagne J, et al. Radiofrequency ablation vs antiarrhythmic drugs as first-line treatment of paroxysmal atrial fibrillation (RAAFT-2). JAMA. (2014) 311(7):692–700. doi: 10.1001/jama.2014.467
8. Kirchhof P, Camm AJ, Goette A, Brandes A, Eckardt L, Elvan A, et al. Early rhythm-control therapy in patients with atrial fibrillation. N Engl J Med. (2020) 383(14):1305–16. doi: 10.1056/NEJMoa2019422
9. Blomström-Lundqvist C, Gizurarson S, Schwieler J, Jensen SM, Bergfeldt L, Kennebäck G, et al. Effect of catheter ablation vs antiarrhythmic medication on quality of life in patients with atrial fibrillation. JAMA. (2019) 321(11):1059–68. doi: 10.1001/jama.2019.0335
10. Wilber DJ, Pappone C, Neuzil P, De Paola A, Marchlinski F, Natale A, et al. Comparison of antiarrhythmic drug therapy and radiofrequency catheter ablation in patients with paroxysmal atrial fibrillation. JAMA. (2010) 303(4):333–40. doi: 10.1001/jama.2009.2029
11. Winkle RA, Mead RH, Engel G, Salcedo J, Brodt C, Barberini P, et al. Very long term outcomes of atrial fibrillation ablation. Heart Rhythm. (2023) 20(5):680–8. doi: 10.1016/j.hrthm.2023.02.002
12. Buist TJ, Adiyaman A, Smit JJJ, Ramdat Misier AR, Elvan A. Arrhythmia-free survival and pulmonary vein reconnection patterns after second-generation cryoballoon and contact-force radiofrequency pulmonary vein isolation. Clin Res Cardiol. (2018) 107(6):498–506. doi: 10.1007/s00392-018-1211-9
13. Elliott AD, Verdicchio CV, Mahajan R, Middeldorp ME, Gallagher C, Mishima RS, et al. An exercise and physical activity program in patients with atrial fibrillation. JACC Clin Electrophysiol. (2023) 9(4):455–65. doi: 10.1016/j.jacep.2022.12.002
14. Haïssaguerre M, Jaïs P, Shah DC, Takahashi A, Hocini M, Quiniou G, et al. Spontaneous initiation of atrial fibrillation by ectopic beats originating in the pulmonary veins. Engl J Med. (1998) 339(10):659–66. doi: 10.1056/NEJM199809033391003
15. Bai R, Di Biase L, Mohanty P, Trivedi C, Dello Russo A, Themistoclakis S, et al. Proven isolation of the pulmonary vein antrum with or without left atrial posterior wall isolation in patients with persistent atrial fibrillation. Heart Rhythm. (2016) 13(1):132–40. doi: 10.1016/j.hrthm.2015.08.019
16. Sugumar H, Thomas SP, Prabhu S, Voskoboinik A, Kistler PM. How to perform posterior wall isolation in catheter ablation for atrial fibrillation. J Cardiovasc Electrophysiol. (2018) 29(2):345–52. doi: 10.1111/jce.13397
17. Zellerhoff S, Ullerich H, Lenze F, Meister T, Wasmer K, Mönnig G, et al. Damage to the esophagus after atrial fibrillation ablation. Circ Arrhythm Electrophysiol. (2010) 3(2):155–9. doi: 10.1161/CIRCEP.109.915918
18. Clarke JRD, Piccini JP, Friedman DJ. The role of posterior wall isolation in catheter ablation of persistent atrial fibrillation. J Cardiovasc Electrophysiol. (2021) 32(9):2567–76. doi: 10.1111/jce.15164
19. McLellan AJA, Prabhu S, Voskoboinik A, Wong MCG, Walters TE, Pathik B, et al. Isolation of the posterior left atrium for patients with persistent atrial fibrillation: routine adenosine challenge for dormant posterior left atrial conduction improves long-term outcome. Europace. (2017) 19(12):1958–66. doi: 10.1093/europace/euw231
20. Chieng D, Sugumar H, Ling LH, Segan L, Azzopardi S, Prabhu S, et al. Catheter ablation for persistent atrial fibrillation: a multicenter randomized trial of pulmonary vein isolation (PVI) versus PVI with posterior left atrial wall isolation (PWI)—the CAPLA study. Am Heart J. (2022) 243:210–20. doi: 10.1016/j.ahj.2021.09.015
21. Jankelson L, Garber L, Shulman E, Cohen RB, Peterson C, Wadhwani L, et al. Outcomes of posterior wall isolation with pulmonary vein isolation for paroxysmal atrial fibrillation. J Cardiovasc Electrophysiol. (2022) 33(2):209–17. doi: 10.1111/jce.15325
22. Martins RP, Galand V, Behar N, Daubert JC, Mabo P, Leclercq C, et al. Localization of residual conduction gaps after wide antral circumferential ablation of pulmonary veins. JACC Clin Electrophysiol. (2019) 5(7):753–65. doi: 10.1016/j.jacep.2019.05.019
23. Bacquelin R, Martins RP, Behar N, Galand V, Polin B, Lacaze J, et al. A novel method for localization and ablation of conduction gaps after wide antral circumferential ablation of pulmonary veins. Arch Cardiovasc Dis. (2018) 111(5):340–8. doi: 10.1016/j.acvd.2017.07.002
24. Beinart R, Kabra R, Heist KE, Blendea D, Barrett CD, Danik SB, et al. Respiratory compensation improves the accuracy of electroanatomic mapping of the left atrium and pulmonary veins during atrial fibrillation ablation. J Interv Card Electrophysiol. (2011) 32(2):105–10. doi: 10.1007/s10840-011-9583-z
25. Piorkowski C, Hindricks G, Schreiber D, Tanner H, Weise W, Koch A, et al. Electroanatomic reconstruction of the left atrium, pulmonary veins, and esophagus compared with the “true anatomy” on multislice computed tomography in patients undergoing catheter ablation of atrial fibrillation. Heart Rhythm. (2006) 3(3):317–27. doi: 10.1016/j.hrthm.2005.11.027
26. Jalife J. Rotors and spiral waves in atrial fibrillation. J Cardiovasc Electrophysiol. (2003) 14(7):776–80. doi: 10.1046/j.1540-8167.2003.03136.x
27. Higa S, Lo LW, Chen SA. Catheter ablation of paroxysmal atrial fibrillation originating from non-pulmonary vein areas. Arrhythm Electrophysiol Rev. (2018) 7(4):273–81. doi: 10.15420/aer.2018.50.3
28. Miyazaki S, Kuwahara T, Kobori A, Takahashi Y, Takei A, Sato A, et al. Long-term clinical outcome of extensive pulmonary vein isolation-based catheter ablation therapy in patients with paroxysmal and persistent atrial fibrillation. Heart. (2011) 97(8):668–73. doi: 10.1136/hrt.2009.186874
29. Ho SY, Cabrera JA, Sanchez-Quintana D. Left atrial anatomy revisited. Circ Arrhythm Electrophysiol. (2012) 5(1):220–8. doi: 10.1161/CIRCEP.111.962720
30. Roberts-Thomson KC, Stevenson IH, Kistler PM, Haqqani HM, Goldblatt JC, Sanders P, et al. Anatomically determined functional conduction delay in the posterior left atrium. J Am Coll Cardiol. (2008) 51(8):856–62. doi: 10.1016/j.jacc.2007.11.037
31. Todd DM, Skanes AC, Guiraudon G, Guiraudon C, Krahn AD, Yee R, et al. Role of the posterior left atrium and pulmonary veins in human lone atrial fibrillation. Circulation. (2003) 108(25):3108–14. doi: 10.1161/01.CIR.0000104567.72914.BF
32. Markides V, Schilling RJ, Ho SY, Chow AW, Davies DW, Peters NS. Characterization of left atrial activation in the intact human heart. Circulation. (2003) 107(5):733–9. doi: 10.1161/01.CIR.0000048140.31785.02
33. Wesselink R, Neefs J, van den Berg NWE, Meulendijks ER, Terpstra MM, Kawasaki M, et al. Does left atrial epicardial conduction time reflect atrial fibrosis and the risk of atrial fibrillation recurrence after thoracoscopic ablation? post hoc analysis of the AFACT trial. BMJ Open. (2022) 12(3):e056829. doi: 10.1136/bmjopen-2021-056829
34. Allessie MA, de Groot NM, Houben RP, Schotten U, Boersma E, Smeets JL, et al. Electropathological substrate of long-standing persistent atrial fibrillation in patients with structural heart disease. Circ Arrhythm Electrophysiol. (2010) 3(6):606–15. doi: 10.1161/CIRCEP.109.910125
35. Moteleb AMAE, Zarif JK, Ali AN. Incidence of atrial fibrosis in non-valvular atrial fibrillation patients and its impact on recurrence after pulmonary vein antral isolation. J Atr Fibrillation. (2018) 11(1):1773. doi: 10.4022/jafib.1773
36. Marrouche NF, Wilber D, Hindricks G, Jais P, Akoum N, Marchlinski F, et al. Association of atrial tissue fibrosis identified by delayed enhancement MRI and atrial fibrillation catheter ablation. Jama. (2014) 311(5):498–506. doi: 10.1001/jama.2014.3
37. Nattel S. Molecular and cellular mechanisms of atrial fibrosis in atrial fibrillation. JACC Clin Electrophysiol. (2017) 3(5):425–35. doi: 10.1016/j.jacep.2017.03.002
38. Chauvel R, Derval N, Duchateau J, Denis A, Tixier R, Welte N, et al. Persistent atrial fibrillation ablation in cardiac laminopathy: electrophysiological findings and clinical outcomes. Heart Rhythm. (2021) 18(7):1115–21. doi: 10.1016/j.hrthm.2021.03.040
39. Cutler MJ, Johnson J, Abozguia K, Rowan S, Lewis W, Costantini O, et al. Impact of voltage mapping to guide whether to perform ablation of the posterior wall in patients with persistent atrial fibrillation. J Cardiovasc Electrophysiol. (2016) 27(1):13–21. doi: 10.1111/jce.12830
40. Pambrun T, Duchateau J, Delgove A, Denis A, Constantin M, Ramirez FD, et al. Epicardial course of the septopulmonary bundle: anatomical considerations and clinical implications for roof line completion. Heart Rhythm. (2021) 18(3):349–57. doi: 10.1016/j.hrthm.2020.11.008
41. Kosich F, Schumacher K, Potpara T, Lip GY, Hindricks G, Kornej J. Clinical scores used for the prediction of negative events in patients undergoing catheter ablation for atrial fibrillation. Clin Cardiol. (2019) 42(2):320–9. doi: 10.1002/clc.23139
42. Macle L, Khairy P, Weerasooriya R, Novak P, Verma A, Willems S, et al. Adenosine-guided pulmonary vein isolation for the treatment of paroxysmal atrial fibrillation: an international, multicentre, randomised superiority trial. Lancet. (2015) 386(9994):672–9. doi: 10.1016/S0140-6736(15)60026-5
Keywords: paroxysmal atrial fibrillation, left atrial posterior wall, 3D electroanatomical map, pulmonary vein isolation, recurrence
Citation: Chen Y, Zhuang J, Li X, Zhang C, Cao X, Xu Z and Feng X (2025) The relationship between the 3D electroanatomical mapping parameters of the left atrial posterior wall and the recurrence of paroxysmal atrial fibrillation. Front. Cardiovasc. Med. 12:1522807. doi: 10.3389/fcvm.2025.1522807
Received: 5 November 2024; Accepted: 27 January 2025;
Published: 14 February 2025.
Edited by:
Laura Vitali Serdoz, Klinikum Fuerth, GermanyReviewed by:
Mark Gallagher, St George’s University Hospitals NHS Foundation Trust, United KingdomCarlo Lavalle, Sapienza University of Rome, Italy
Copyright: © 2025 Chen, Zhuang, Li, Zhang, Cao, Xu and Feng. This is an open-access article distributed under the terms of the Creative Commons Attribution License (CC BY). The use, distribution or reproduction in other forums is permitted, provided the original author(s) and the copyright owner(s) are credited and that the original publication in this journal is cited, in accordance with accepted academic practice. No use, distribution or reproduction is permitted which does not comply with these terms.
*Correspondence: Zhiwei Xu, MTE3MzQ2NzIxQHFxLmNvbQ==; Xiu Feng, c2hvd19jbGFuY3lAZm94bWFpbC5jb20=
†These authors share first authorship