Abstract
Objective:
Cardiovascular-kidney-metabolic (CKM) syndrome represents a critical intersection of cardiovascular, renal, and metabolic disorders, emphasizing the importance of early risk stratification and intervention. The triglyceride-glucose (TyG) index, a surrogate marker of insulin resistance, has shown promise in predicting cardiometabolic risk. However, its association with hyperuricemia in early-stage CKM syndrome remains uncertain.
Methods:
This study analyzed data from 14,716 adult participants in the NHANES 2005–2018 dataset. A complex survey weight design and multiple imputation techniques were utilized to address missing data. The relationship between the TyG index and hyperuricemia was examined using generalized additive models and piecewise regression, with multivariable logistic regression adjusting for 14 potential confounders.
Results:
The TyG index demonstrated a significant positive association with hyperuricemia. Each unit increase in the TyG index was associated with a 62% higher risk of hyperuricemia (OR = 1.62, 95% CI: 1.45–1.81). A non-linear relationship was identified, with an inflection point at a TyG index of 9.50. Below this threshold, higher TyG index values were significantly associated with increased odds of hyperuricemia (OR = 2.18, 95% CI: 1.82–2.61), while above the threshold, the association became non-significant (OR = 0.79, 95% CI: 0.57–1.10). Subgroup analyses confirmed consistent associations across various demographic and clinical characteristics.
Conclusions:
The TyG index may serve as a valuable biomarker for identifying hyperuricemia risk in individuals with early-stage CKM syndrome, offering potential utility in clinical and public health settings. Further longitudinal studies are warranted to confirm these findings and assess the impact of TyG index-guided interventions on CKM syndrome progression.
1 Introduction
Cardiovascular-kidney-metabolic (CKM) syndrome reflects the complex interplay of cardiovascular, renal, and metabolic disorders, which often coexist and amplify each other's clinical burden. The increasing prevalence of CKM syndrome worldwide has underscored the need for early identification of risk factors and targeted interventions to curb its progression (1). Among the various metabolic abnormalities associated with CKM syndrome, hyperuricemia—a condition characterized by elevated serum uric acid levels—has garnered attention for its role in exacerbating cardiovascular and renal dysfunction (2–4). The relationship between hyperuricemia and insulin resistance (IR) is well-documented, with emerging evidence suggesting that hyperuricemia may both result from and contribute to metabolic derangements (5, 6). However, the mechanisms linking these conditions remain incompletely understood, particularly in the context of early-stage CKM syndrome.
The triglyceride-glucose (TyG) index, a reliable surrogate marker of IR (7), has gained traction in recent years for its predictive value in cardiometabolic disorders (8, 9). Studies have shown that higher TyG index values are associated with an increased risk of type 2 diabetes, hypertension, and cardiovascular diseases (10–12). However, while its utility in assessing cardiometabolic risk has been established, limited research has explored the relationship between the TyG index and hyperuricemia, particularly in populations with CKM syndrome. Investigating this relationship could offer valuable insights into the role of IR in CKM-related metabolic disturbances and inform early intervention strategies.
In this study, we focus on individuals in the early stages of CKM syndrome to evaluate the relationship between the TyG index and hyperuricemia. By utilizing data from the National Health and Nutrition Examination Survey (NHANES) 2005–2018 and employing advanced statistical techniques, we aim to identify non-linear associations and thresholds for hyperuricemia risk. This study is unique in targeting an underexplored population—those in the early stages of CKM syndrome—and provides evidence for the TyG index as a practical biomarker for early intervention. These findings contribute to the growing need for proactive approaches in CKM syndrome management, focusing on risk prediction and prevention during its earliest phases.
2 Methods
2.1 Study population
This cross-sectional study utilized data from the NHANES 2005–2018. NHANES employs a complex, multistage probability sampling design to collect nationally representative data through standardized questionnaires, physical examinations, and laboratory tests. From the NHANES 2005–2018 population, we excluded participants aged <20 years, pregnant women, individuals with undetermined CKM syndrome status due to incomplete data for key staging variables [missing measurements for body mass index (BMI), waist circumference, blood pressure, glucose parameters, lipid profiles, kidney function, or cardiovascular disease history], those with missing data for TyG index calculation (fasting triglycerides and glucose) or serum uric acid measurements, and participants with stage 4 CKM syndrome, as our study focused specifically on early-stage disease progression and intervention opportunities. The final analytic sample comprised adults with early-stage (0–3) CKM syndrome.
2.2 Definition of CKM syndrome early-stage
The staging of CKM Syndrome was comprehensively delineated according to the 2023 American Heart Association Presidential Advisory Statement (1, 13). Our study concentrated on early-stage CKM syndrome (stages 0–3): Stage 0 indicates the absence of CKM risk factors; Stage 1 is characterized by excess or dysfunctional adiposity; Stage 2 encompasses metabolic risk factors or chronic kidney disease (CKD); Stage 3 includes subclinical cardiovascular disease. Within this classification, very high-risk kidney disease (stages G4 or G5) and high cardiovascular disease risk predicted by the Framingham risk score were considered equivalent markers of subclinical cardiovascular pathology. Kidney function was estimated using the CKD-EPI equation to calculate glomerular filtration rate (eGFR) and staged according to Kidney Disease Improving Global Outcomes (KDIGO) guidelines. Given the research's focus on early disease progression, participants with established cardiovascular disease, end-stage kidney disease, or advanced metabolic complications (Stage 4) were excluded.
2.3 Exposure variable
The TyG index was calculated as ln[fasting triglycerides (mg/dl) × fasting glucose (mg/dl)/2] (14). Blood samples were collected after 8–12 h of fasting at NHANES mobile examination centers. Serum triglycerides were measured using enzymatic methods (GPO-PAP method, Roche Diagnostics), and glucose was measured using hexokinase method (Roche/Hitachi Cobas C311). The TyG index was analyzed both as a continuous variable and as a categorical variable divided into quartiles (Q1: 5.65–8.16, Q2: 8.16–8.58, Q3: 8.58–9.03, Q4: 9.03–12.84).
2.4 Outcome variable
Hyperuricemia was defined as serum uric acid ≥7.0 mg/dl in males or ≥6.0 mg/dl in females (15). Serum uric acid was measured using uricase-peroxidase method (Beckman Coulter UniCel DxC 800 Synchron) under standardized conditions. All samples were processed within 24 h of collection. Laboratory personnel were blinded to participants' exposure status to minimize measurement bias.
2.5 Covariates
Covariates included age (continuous, in years), sex (male or female), race/ethnicity (Non-Hispanic White, Non-Hispanic Black, Mexican American, and Other races), poverty-income ratio (PIR) (categorized as low [<1.3], medium [1.3–3.5], and high [>3.5]), education level (less than high school, high school graduate, and more than high school), physical activity (METs/week, categorized as low [<600], moderate [600–1199], and vigorous [≥1200]), smoking status (never [<100 cigarettes lifetime], former [>100 cigarettes but stopped], current [>100 cigarettes and still smoking]), drinking status (heavy [≥3 drinks/day for women, ≥4 for men, or ≥5 binge drinking days/month], moderate [≥2 drinks/day for women, ≥3 for men, or twice monthly binge drinking], mild [all other cases]), BMI (continuous, in kg/m2), eGFR (continuous, in ml/min/1.73 m2, calculated using CKD-EPI equation), glucose metabolism state (normoglycemia, prediabetes, diabetes), hypertension (yes/no), hyperlipidemia (yes/no), and healthy eating index (HEI)-2015 score, range 0–100) (16, 17).
2.6 Statistical analysis
Baseline characteristics of participants across quartiles of the TyG were summarized using descriptive statistical methods. Continuous variables were presented as survey-weighted mean values with 95% confidence intervals, and categorical variables were presented as survey-weighted percentage proportions with 95% confidence intervals. Between-group differences were assessed using survey-weighted linear regression analysis for continuous variables and survey-weighted chi-square statistical tests for categorical variables.
Missing data in covariates were handled using Multiple Imputation by Chained Equations (MICE) to reduce bias and enhance analytical robustness. The imputation model incorporated all relevant predictors and outcome variables to preserve relationships between variables. Predictive mean matching (PMM) was used for continuous variables, logistic regression for binary variables, and multinomial regression for categorical variables, with 5 iterations to ensure convergence.
The association between the TyG index and hyperuricemia was examined using a three-step analytical approach. First, survey-weighted logistic regression models were constructed to evaluate the relationship. Three models were developed: Model 1, unadjusted; Model 2, adjusted for age, sex, and race/ethnicity; and Model 3, adjusted for a comprehensive set of covariates including age, sex, race/ethnicity, PIR, educational level, physical activity (METs/week), smoking status, drinking status, BMI, eGFR, glucose metabolism state, hypertension, hyperlipidemia, and HEI-2015. Second, generalized additive models and smooth curve fitting were employed to explore potential non-linear relationships between the TyG index and hyperuricemia. When non-linearity was identified, a recursive algorithm was used to calculate the inflection point, followed by the construction of survey-weighted piecewise logistic regression models for the segments on either side of the inflection point. The log-likelihood ratio test was applied to compare the standard logistic regression model with the piecewise model to determine the better fit. Finally, subgroup analyses were performed using survey-weighted stratified logistic regression models, stratified by variables such as age, sex, race, smoking status, alcohol consumption and eGFR. Continuous stratification variables were categorized based on clinically relevant cut-points before conducting interaction tests. Effect modification was assessed using likelihood ratio tests to evaluate interactions between variables and the TyG index.
For sensitivity analysis, we converted the TyG index into a categorical variable and calculated P for trend to verify the continuous variable analysis results and examine potential non-linearity. All analyses incorporated sampling weights, stratification, and cluster variables following NHANES analytical guidelines to account for the complex survey design and ensure nationally representative estimates. Statistical analyses were performed using R (version 4.2.2, http://www.R-project.org) and EmpowerStats (version 4.2, https://www.empowerstats.com). A two-sided P value <0.05 was considered statistically significant.
3 Results
3.1 Study sample selection
Among the 70,190 participants from the NHANES (2005–2018), a total of 14,716 participants were included in the final analysis after applying the exclusion criteria (Figure 1). The exclusion process sequentially removed participants who were under 20 years old (n = 30,441), pregnant (n = 2,711), unable to determine CKM syndrome status (n = 8,234), missing TyG index data (n = 2,229), and missing uric acid measurements (n = 45). Additionally, 1,996 individuals with CKM syndrome in stage 4 were excluded from the analysis.
Figure 1
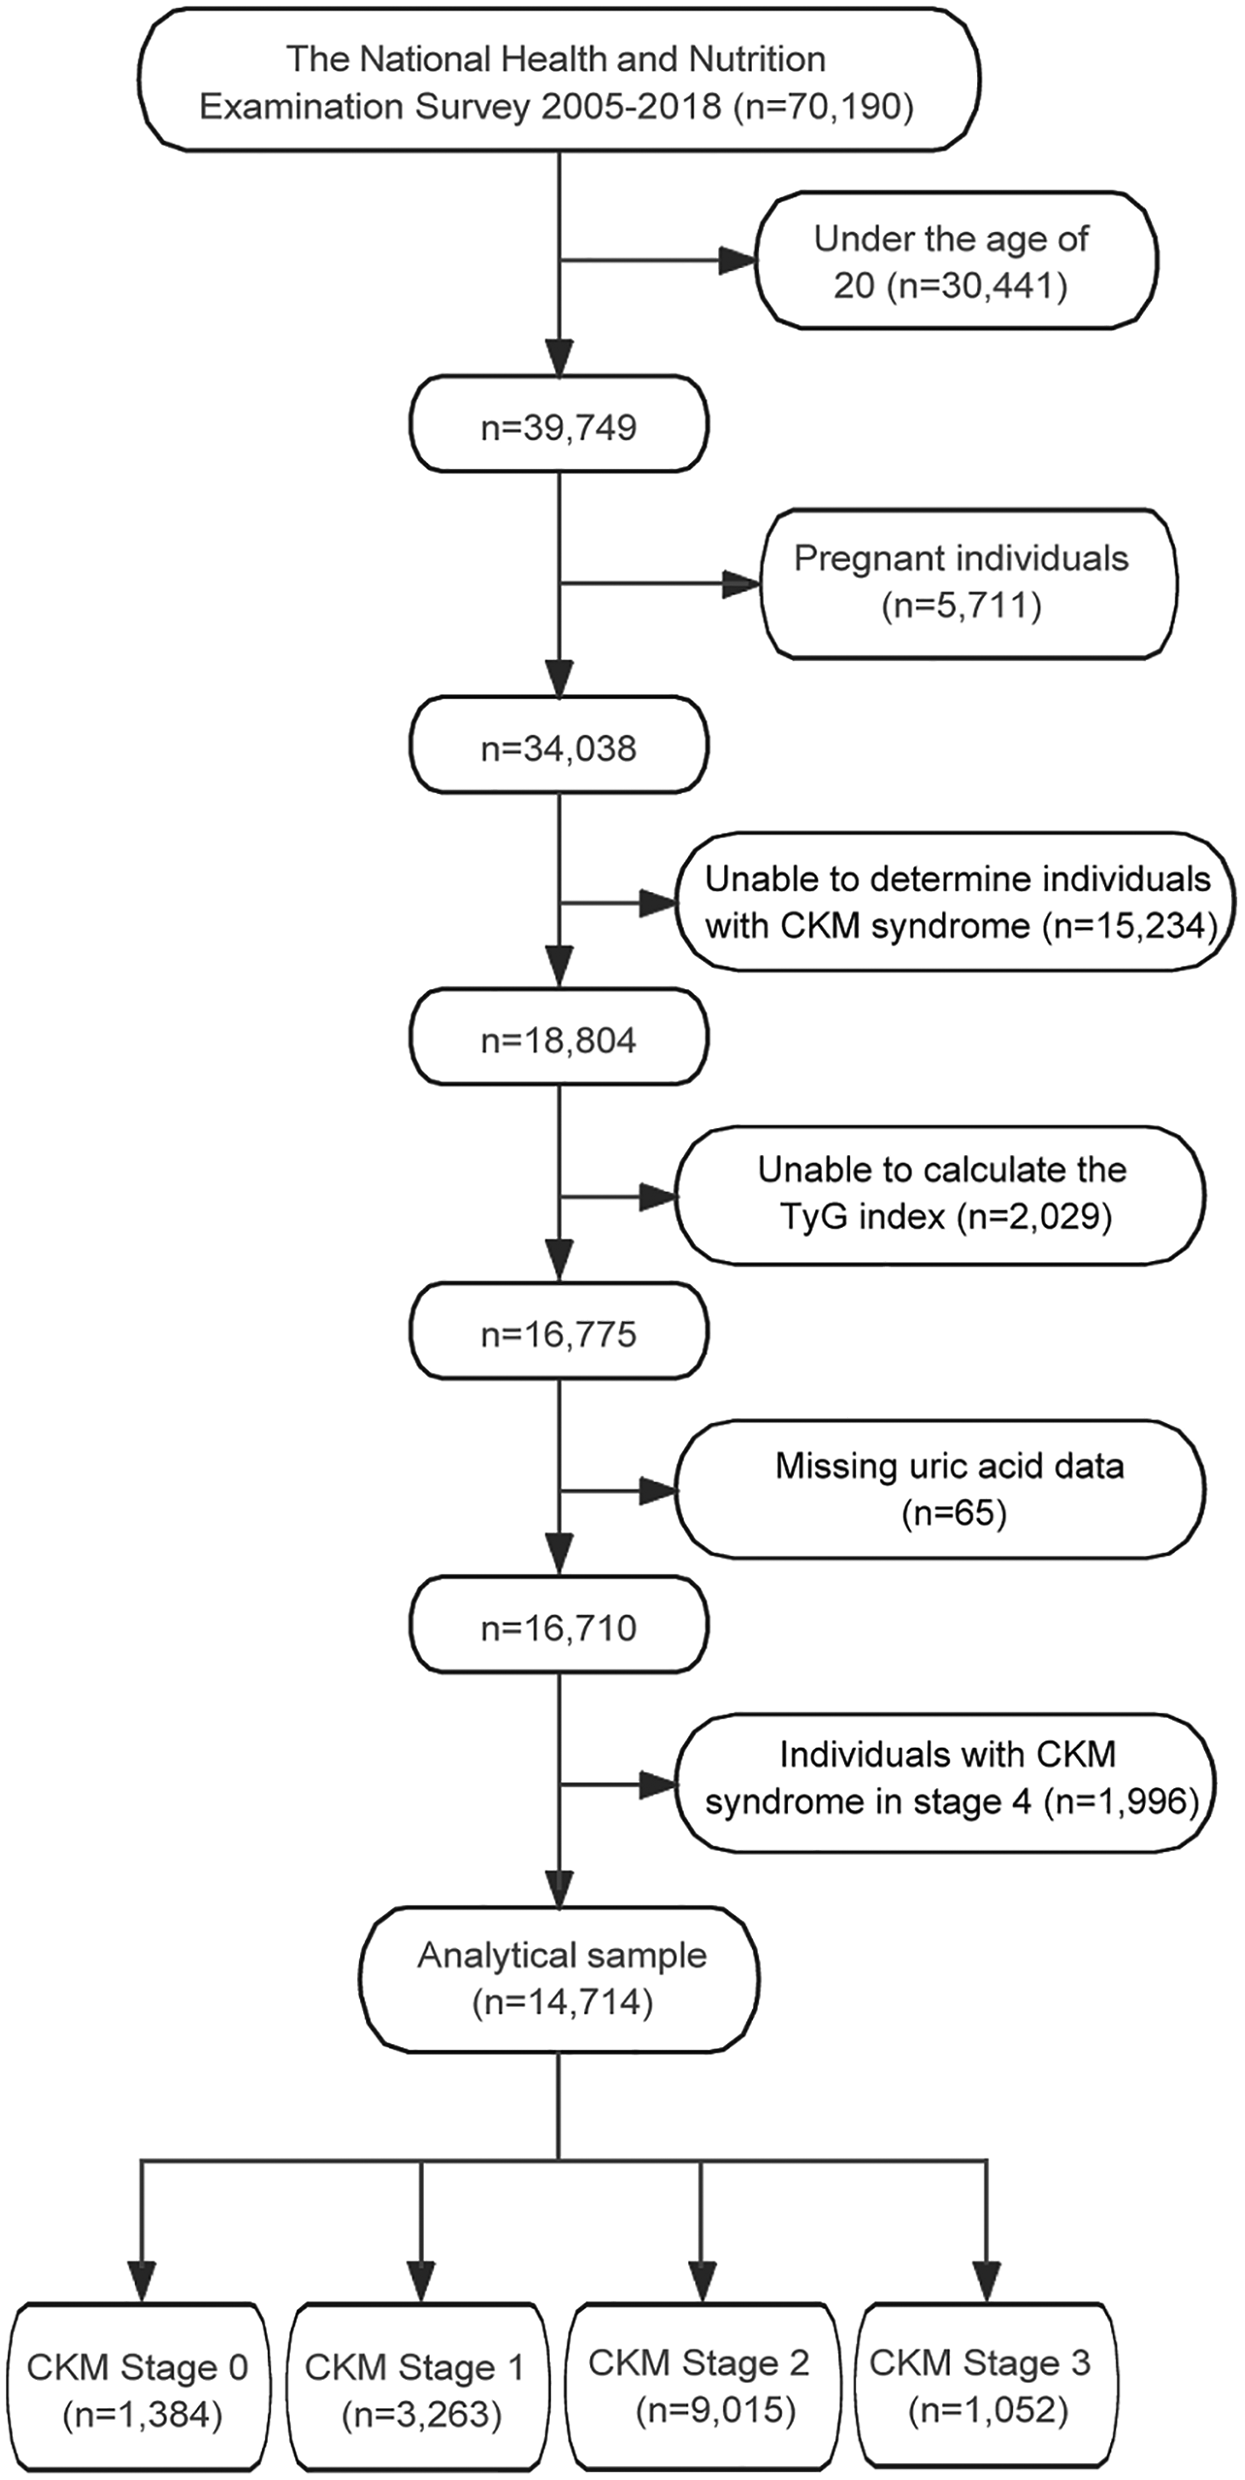
Flowchart of participant selection for the study. TyG, triglyceride-glucose; CKM, cardiovascular-kidney-metabolic.
CKM syndrome stage distribution among the final study population (n = 14,714) was as follows: Stage 0 (n = 1,384, 9.4%), Stage 1 (n = 3,263, 22.2%), Stage 2 (n = 9,015, 61.3%), and Stage 3 (n = 1,052, 7.1%). Detailed CKM staging criteria are provided in Supplementary Table S1.
3.2 Baseline demographic characteristics
The baseline characteristics of 14,714 participants stratified by TyG index quartiles demonstrated significant differences across multiple domains (Table 1). In terms of demographic characteristics, mean age progressively increased from 41.29 years in Q1 to 50.10 years in Q4 (P < 0.001). Male proportion showed an ascending trend from 38.21% to 57.97% across quartiles (P < 0.001). Racial distribution varied significantly (P < 0.001), with Non-Hispanic Whites maintaining relatively stable proportions (63.43% to 68.51%), while Non-Hispanic Blacks decreased (16.54% to 5.64%) and Mexican Americans increased (6.51% to 11.42%). Higher education levels decreased from 68.57% to 54.81% (P < 0.001), while poverty income ratio showed no significant differences across quartiles (P = 0.083).
Table 1
| Variables | TyG index quartiles | P-value | |||
|---|---|---|---|---|---|
| Q1 (5.65–8.16) n = 3,879 |
Q2 (8.16–8.58) n = 3,721 |
Q3 (8.58–9.03) n = 3,645 |
Q4 (9.03–12.84) n = 3,469 |
||
| Age (years) | 41.29 (40.43, 42.15) | 46.34 (45.59, 47.09) | 48.34 (47.55, 49.13) | 50.10 (49.44, 50.76) | <0.001 |
| Sex (%) | <0.001 | ||||
| Male | 38.21 (36.29, 40.17) | 47.68 (45.80, 49.57) | 52.26 (50.24, 54.28) | 57.97 (55.75, 60.15) | |
| Female | 61.79 (59.83, 63.71) | 52.32 (50.43, 54.20) | 47.74 (45.72, 49.76) | 42.03 (39.85, 44.25) | |
| Race/ethnicity (%) | <0.001 | ||||
| Non-Hispanic White | 63.43 (60.40, 66.35) | 68.29 (65.36, 71.09) | 67.77 (64.78, 70.63) | 68.51 (65.29, 71.56) | |
| Non-Hispanic Black | 16.54 (14.51, 18.79) | 10.91 (9.58, 12.40) | 7.64 (6.57, 8.87) | 5.64 (4.79, 6.64) | |
| Mexican American | 6.51 (5.32, 7.94) | 8.26 (6.90, 9.85) | 10.05 (8.54, 11.79) | 11.42 (9.78, 13.30) | |
| Others | 13.53 (11.75, 15.53) | 12.54 (11.05, 14.20) | 14.54 (13.02, 16.21) | 14.43 (12.38, 16.75) | |
| PIR (%) | 0.083 | ||||
| Low | 20.49 (18.58, 22.55) | 20.44 (18.73, 22.25) | 21.40 (19.37, 23.58) | 22.70 (20.81, 24.70) | |
| Medium | 35.52 (33.36, 37.73) | 35.06 (32.42, 37.78) | 37.66 (35.10, 40.29) | 37.08 (35.08, 39.11) | |
| High | 43.99 (41.28, 46.73) | 44.51 (41.10, 47.97) | 40.94 (38.12, 43.83) | 40.23 (37.73, 42.78) | |
| Education level (%) | <0.001 | ||||
| Less than high school | 11.37 (10.06, 12.84) | 14.70 (13.18, 16.36) | 18.18 (16.37, 20.14) | 19.88 (18.12, 21.77) | |
| High school | 20.06 (18.23, 22.02) | 23.27 (21.38, 25.28) | 23.47 (21.44, 25.63) | 25.31 (23.04, 27.72) | |
| More than high school | 68.57 (65.84, 71.18) | 62.03 (59.24, 64.73) | 58.35 (55.58, 61.07) | 54.81 (52.02, 57.58) | |
| METs/week (%) | <0.001 | ||||
| Low | 19.54 (17.91, 21.27) | 23.43 (21.81, 25.12) | 25.32 (23.55, 27.17) | 26.23 (24.50, 28.04) | |
| Moderate | 2.34 (1.80, 3.05) | 2.76 (2.09, 3.64) | 2.48 (1.96, 3.14) | 2.51 (1.89, 3.32) | |
| Vigorous | 78.12 (76.36, 79.78) | 73.81 (72.09, 75.46) | 72.20 (70.22, 74.09) | 71.26 (69.31, 73.13) | |
| Smoking (%) | <0.001 | ||||
| Never | 63.58 (61.16, 65.93) | 56.36 (53.75, 58.93) | 54.42 (52.08, 56.74) | 47.44 (45.13, 49.76) | |
| Former | 20.05 (18.07, 22.19) | 23.64 (21.39, 26.06) | 24.88 (22.88, 26.99) | 28.71 (26.51, 31.02) | |
| Now | 16.37 (14.90, 17.96) | 20.00 (17.92, 22.25) | 20.70 (18.89, 22.64) | 23.85 (21.95, 25.85) | |
| Drinking (%) | <0.001 | ||||
| Never | 11.89 (10.60, 13.32) | 10.72 (9.52, 12.05) | 10.27 (9.09, 11.58) | 11.59 (10.13, 13.24) | |
| Former | 9.07 (8.02, 10.25) | 11.23 (10.00, 12.59) | 13.20 (11.89, 14.62) | 15.69 (14.03, 17.50) | |
| Mild | 36.96 (34.41, 39.58) | 37.37 (35.05, 39.76) | 39.13 (36.98, 41.33) | 34.91 (32.42, 37.48) | |
| Moderate | 21.90 (20.18, 23.72) | 17.78 (16.06, 19.65) | 15.59 (13.92, 17.42) | 15.17 (13.50, 17.00) | |
| Heavy | 20.18 (18.70, 21.74) | 22.89 (21.09, 24.80) | 21.81 (19.93, 23.82) | 22.64 (20.65, 24.78) | |
| BMI (kg/m2) | 26.17 (25.85, 26.50) | 28.22 (27.91, 28.53) | 29.97 (29.66, 30.28) | 31.73 (31.37, 32.08) | <0.001 |
| Height (cm) | 168.18 (167.76, 168.60) | 169.13 (168.75, 169.51) | 168.84 (168.40, 169.29) | 169.64 (169.16, 170.11) | <0.001 |
| SBP (mmHg) | 115.49 (114.82, 116.16) | 119.81 (119.06, 120.56) | 122.06 (121.34, 122.79) | 126.28 (125.48, 127.08) | <0.001 |
| DBP (mmHg) | 67.73 (67.22, 68.25) | 69.62 (69.07, 70.17) | 71.04 (70.42, 71.67) | 73.17 (72.65, 73.70) | <0.001 |
| eGFR (ml/min/1.73 m2) | 101.88 (100.87, 102.90) | 96.06 (95.01, 97.11) | 94.34 (93.35, 95.33) | 93.21 (92.27, 94.16) | <0.001 |
| Glucose metabolism state (%) | <0.001 | ||||
| Normoglycemia | 88.08 (86.72, 89.33) | 77.27 (75.56, 78.88) | 63.50 (61.10, 65.84) | 41.27 (38.83, 43.75) | |
| Prediabetes | 8.52 (7.42, 9.77) | 15.39 (13.90, 17.00) | 22.30 (20.20, 24.56) | 24.59 (22.94, 26.31) | |
| Diabetes | 3.40 (2.77, 4.15) | 7.35 (6.46, 8.35) | 14.19 (12.80, 15.72) | 34.15 (31.96, 36.40) | |
| Hypertension (%) | <0.001 | ||||
| No | 79.63 (77.59, 81.53) | 68.46 (66.14, 70.70) | 60.31 (58.44, 62.16) | 49.59 (47.15, 52.03) | |
| Yes | 20.37 (18.47, 22.41) | 31.54 (29.30, 33.86) | 39.69 (37.84, 41.56) | 50.41 (47.97, 52.85) | |
| Hyperlipidemia (%) | <0.001 | ||||
| No | 61.37 (59.50, 63.21) | 35.49 (33.40, 37.65) | 18.07 (16.32, 19.96) | 1.72 (1.22, 2.41) | |
| Yes | 38.63 (36.79, 40.50) | 64.51 (62.35, 66.60) | 81.93 (80.04, 83.68) | 98.28 (97.59, 98.78) | |
| HEI-2015 | 53.16 (52.57, 53.75) | 51.96 (51.23, 52.70) | 50.98 (50.36, 51.61) | 50.83 (50.14, 51.51) | <0.001 |
| TyG index | 7.82 (7.81, 7.83) | 8.38 (8.38, 8.39) | 8.80 (8.79, 8.80) | 9.49 (9.47, 9.51) | <0.001 |
| Uric acid (mg/dl) | 4.88 (4.82, 4.93) | 5.33 (5.27, 5.39) | 5.68 (5.62, 5.74) | 6.00 (5.94, 6.06) | <0.001 |
| Hyperuricemia (%) | <0.001 | ||||
| No | 91.95 (90.55, 93.16) | 86.20 (84.50, 87.73) | 79.11 (77.28, 80.83) | 69.88 (67.73, 71.94) | |
| Yes | 8.05 (6.84, 9.45) | 13.80 (12.27, 15.50) | 20.89 (19.17, 22.72) | 30.12 (28.06, 32.27) | |
| CKM syndrome stage (%) | <0.001 | ||||
| 0 | 28.34 (26.46, 30.29) | 12.26 (10.74, 13.95) | 2.69 (2.13, 3.39) | 0.00 (0.00, 0.00) | |
| 1 | 36.82 (34.65, 39.04) | 38.83 (36.50, 41.22) | 16.68 (15.17, 18.30) | 0.00 (0.00, 0.00) | |
| 2 | 32.90 (30.75, 35.13) | 45.22 (42.70, 47.76) | 76.04 (74.26, 77.72) | 92.69 (91.67, 93.60) | |
| 3 | 1.94 (1.58, 2.36) | 3.69 (3.13, 4.36) | 4.60 (3.87, 5.46) | 7.31 (6.40, 8.33) | |
Weighted baseline characteristics of study participants according to TyG index quartiles.
For continuous variables, data are presented as survey-weighted means (95% CI), and P-values were calculated using survey-weighted linear regression (svyglm). For categorical variables, data are presented as survey-weighted percentages (95% CI), and P-values were calculated using the survey-weighted Chi-square test (svytable).
TyG, triglyceride-glucose; PIR, poverty income ratio; MET, metabolic equivalent; BMI, body mass index; SBP, systolic blood pressure; DBP, diastolic blood pressure; eGFR, estimated glomerular filtration rate; HEI, healthy eating index; CKM, cardiovascular-kidney-metabolic syndrome.
Lifestyle characteristics demonstrated significant variations across TyG quartiles. Physical activity patterns showed decreased vigorous activity (78.12% to 71.26%) and increased low-intensity activity (19.54% to 26.23%) (P < 0.001). The proportion of never-smokers decreased from 63.58% to 47.44%, while current smokers increased from 16.37% to 23.85% (P < 0.001). Among drinking patterns, former drinkers increased from 9.07% to 15.69%, while moderate drinkers decreased from 21.90% to 15.17% (P < 0.001).
Clinical parameters showed consistent trends of deterioration with increasing TyG index. BMI increased from 26.17 to 31.73 kg/m2 (P < 0.001), accompanied by elevated blood pressure (SBP: 115.49 to 126.28 mmHg; DBP: 67.73 to 73.17 mmHg; both P < 0.001). Kidney function, assessed by eGFR, declined from 101.88 to 93.21 ml/min/1.73 m2 (P < 0.001), while HEI-2015 scores decreased from 53.16 to 50.83 (P < 0.001).
Metabolic parameters demonstrated substantial deterioration across quartiles. The prevalence of normoglycemia decreased markedly from 88.08% to 41.27%, while diabetes increased from 3.40% to 34.15% (P < 0.001). Hypertension prevalence rose from 20.37% to 50.41%, and hyperlipidemia showed a dramatic increase from 38.63% to 98.28% (both P < 0.001). Mean TyG index progressed from 7.82 to 9.49 (P < 0.001). Serum uric acid levels increased from 4.88 to 6.00 mg/dl, with hyperuricemia prevalence rising from 8.05% to 30.12% (P < 0.001).
The distribution of CKM syndrome stages showed significant shifts across TyG quartiles (P < 0.001). Stage 0 decreased from 28.34% to 0% in Q4, while stage 2 became predominantly prevalent, increasing from 32.90% to 92.69%. Stage 3 showed a gradual rise from 1.94% to 7.31%, indicating a progressive worsening of cardiometabolic health with increasing TyG index.
3.3 Association between TyG index and hyperuricemia in early-stage CKM syndrome
In the weighted analysis examining the association between TyG index and hyperuricemia among participants with early-stage CKM syndrome, both continuous and categorical analyses revealed significant associations (Table 2). When analyzed as a continuous variable, each unit increase in TyG index was associated with 2.13-fold (95% CI: 1.96–2.31) increased odds of hyperuricemia in the unadjusted model, which remained largely unchanged after adjusting for demographic factors (OR = 2.11, 95% CI: 1.94–2.30) and was attenuated but remained significant after full adjustment for potential confounders (OR = 1.62, 95% CI: 1.45–1.81). In the quartile analysis, compared with the lowest TyG index quartile (Q1: 5.65–8.16), the fully adjusted odds ratios for hyperuricemia were 1.41 (95% CI: 1.11–1.80) for Q2 (8.16–8.58), 2.00 (95% CI: 1.58–2.55) for Q3 (8.58–9.03), and 2.91 (95% CI: 2.25–3.76) for Q4 (9.03–12.84), with significant trends across quartiles (P for trend <0.001) in all models.
Table 2
| TyG index | Model 1 | Model 2 | Model 3 |
|---|---|---|---|
| Continuous | 2.13 (1.96, 2.31) | 2.11 (1.94, 2.30) | 1.62 (1.45, 1.81) |
| Quartiles | |||
| Q1 (5.65–8.16) | Reference | Reference | Reference |
| Q2 (8.16–8.58) | 1.83 (1.46, 2.30) | 1.79 (1.42, 2.26) | 1.41 (1.11, 1.80) |
| Q3 (8.58–9.03) | 3.02 (2.46, 3.71) | 2.98 (2.41, 3.68) | 2.00 (1.58, 2.55) |
| Q4 (9.03–12.84) | 4.92 (4.06, 5.97) | 4.85 (3.96, 5.94) | 2.91 (2.25, 3.76) |
| P for trend | <0.001 | <0.001 | <0.001 |
Weighted analysis of the association between TyG index and hyperuricemia in a population with early-stage (stages 0–3) CKM syndrome.
Model 1: Non-adjusted.
Model 2: Adjusted for age, sex, and race/ethnicity.
Model 3: Adjusted for age, sex, race/ethnicity, PIR, educational level, METs/week, smoking, drinking, BMI, eGFR, glucose metabolism state, hypertension, hyperlipidemia, and HEI-2015.
TyG, triglyceride-glucose; CKM, cardiovascular-kidney-metabolic; PIR, poverty income ratio; MET, metabolic equivalent; BMI, body mass index; eGFR, estimated glomerular filtration rate; HEI, healthy eating index.
3.4 Threshold effect analysis of TyG index on hyperuricemia in early-stage CKM syndrome
Using GAM and smooth curve fitting, Figure 2 illustrated a nonlinear relationship between TyG index and hyperuricemia. The smooth curve demonstrated an initial positive association with increasing TyG index values, followed by a declining trend after reaching a peak at approximately TyG index of 9–10. This visual representation of the nonlinear pattern aligned with the threshold effect subsequently quantified by two-piecewise logistic regression analysis in Table 3.
Figure 2
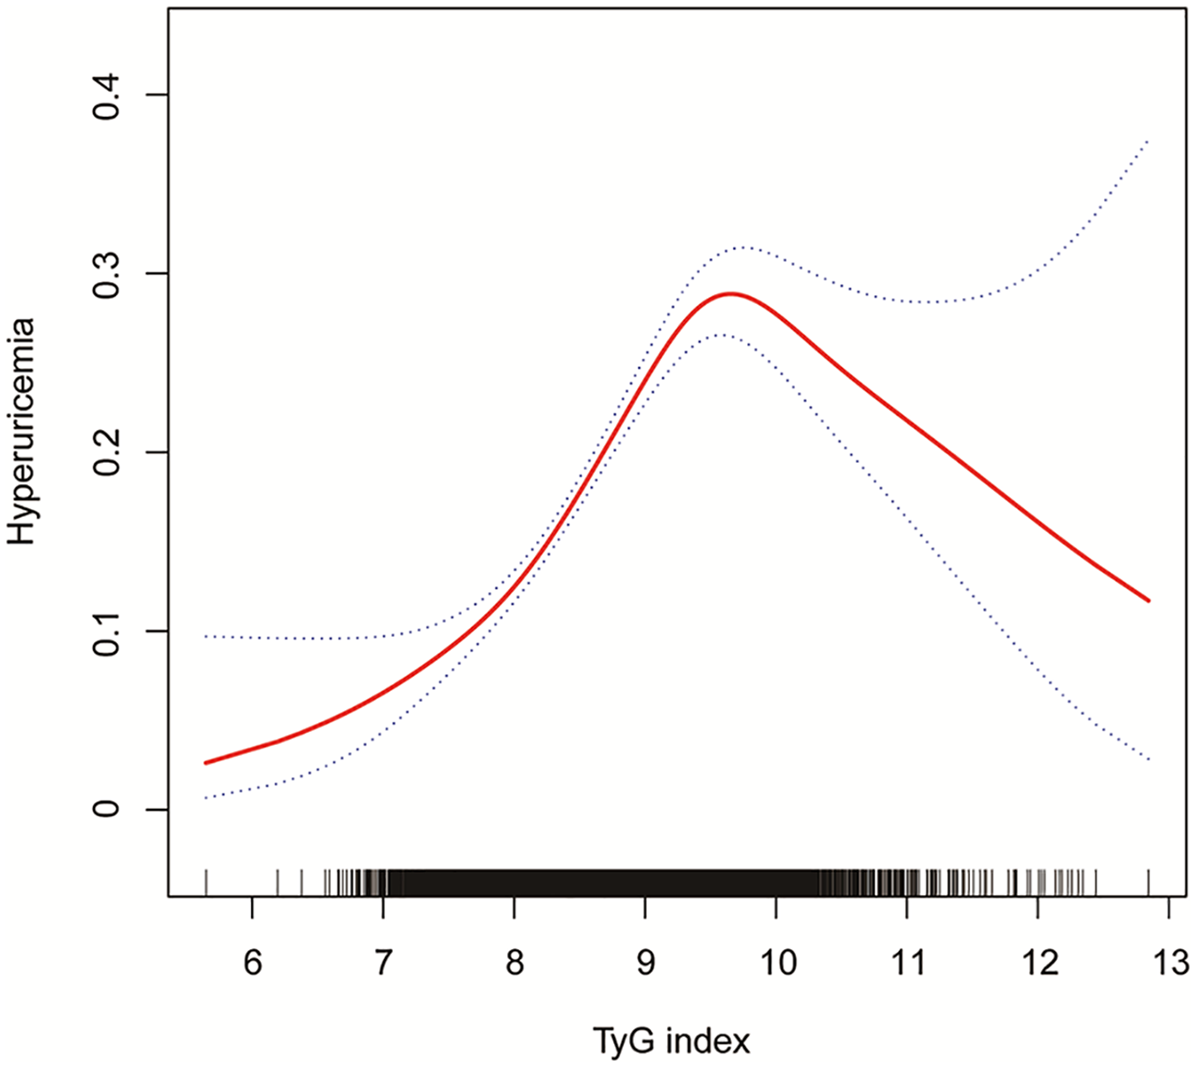
The association between TyG index and hyperuricemia in a population with early-stage (stages 0–3) CKM syndrome. Age, sex, race/ethnicity, PIR, educational level, METs/week, smoking, drinking, BMI, eGFR, glucose metabolism state, hypertension, hyperlipidemia, and HEI-2015 were adjusted. TyG, triglyceride-glucose; CKM, cardiovascular-kidney-metabolic; PIR, poverty income ratio; MET, metabolic equivalent; BMI, body mass index; eGFR, estimated glomerular filtration rate; HEI, healthy eating index.
Table 3
| TyG index | Adjusted ORa (95% CI) | P-value |
|---|---|---|
| Model I | ||
| Fitting by the standard linear model | 1.62 (1.45, 1.81) | <0.001 |
| Model II | ||
| Inflection point | 9.50 | |
| <9.50 | 2.18 (1.82, 2.61) | <0.001 |
| >9.50 | 0.79 (0.57, 1.10) | 0.164 |
| Log likelihood ratio | / | <0.001 |
Weighted two-piecewise logistic regression analysis of the association between TyG index and hyperuricemia in a population with early-stage (stages 0–3) CKM syndrome.
TyG, triglyceride-glucose; CKM, Cardiovascular-Kidney-Metabolic; OR, odds ratio; CI, confidence interval; PIR, poverty income ratio; MET, metabolic equivalent; BMI, body mass index; eGFR, estimated glomerular filtration rate; HEI, healthy eating index.
Adjusted for age, sex, race/ethnicity, PIR, educational level, METs/week, smoking, drinking, BMI, eGFR, glucose metabolism state, hypertension, hyperlipidemia, and HEI-2015.
Two-piecewise logistic regression analysis revealed a nonlinear relationship between TyG index and hyperuricemia in early-stage CKM syndrome (Table 3). While the standard linear model showed that each unit increase in TyG index was associated with 1.62-fold increased odds of hyperuricemia (95% CI: 1.45–1.81, P < 0.001), further threshold effect analysis identified an inflection point at TyG index of 9.50. Below this threshold, each unit increase in TyG index was associated with significantly higher odds of hyperuricemia (OR = 2.18, 95% CI: 1.82–2.61, P < 0.001). However, beyond the threshold of 9.50, this association was no longer significant (OR = 0.79, 95% CI: 0.57–1.10, P = 0.164). The log likelihood ratio test (P < 0.001) supported the superior fit of the two-piecewise model over the linear model, suggesting a threshold effect in the association between TyG index and hyperuricemia.
3.5 Stratified analysis of the association between TyG index and hyperuricemia in early-stage CKM syndrome
In the stratified logistic regression analyses (Figure 3), significant interaction effects were observed for sex, race/ethnicity, and smoking status (all P-interaction < 0.05), while age groups, drinking status, and eGFR showed no significant interaction effects. Notably, despite these interaction differences, all subgroup analyses demonstrated statistically significant positive associations (all P < 0.05, OR > 1.0), further validating the robust relationship between TyG index and hyperuricemia established in our primary analysis (Table 2).
Figure 3
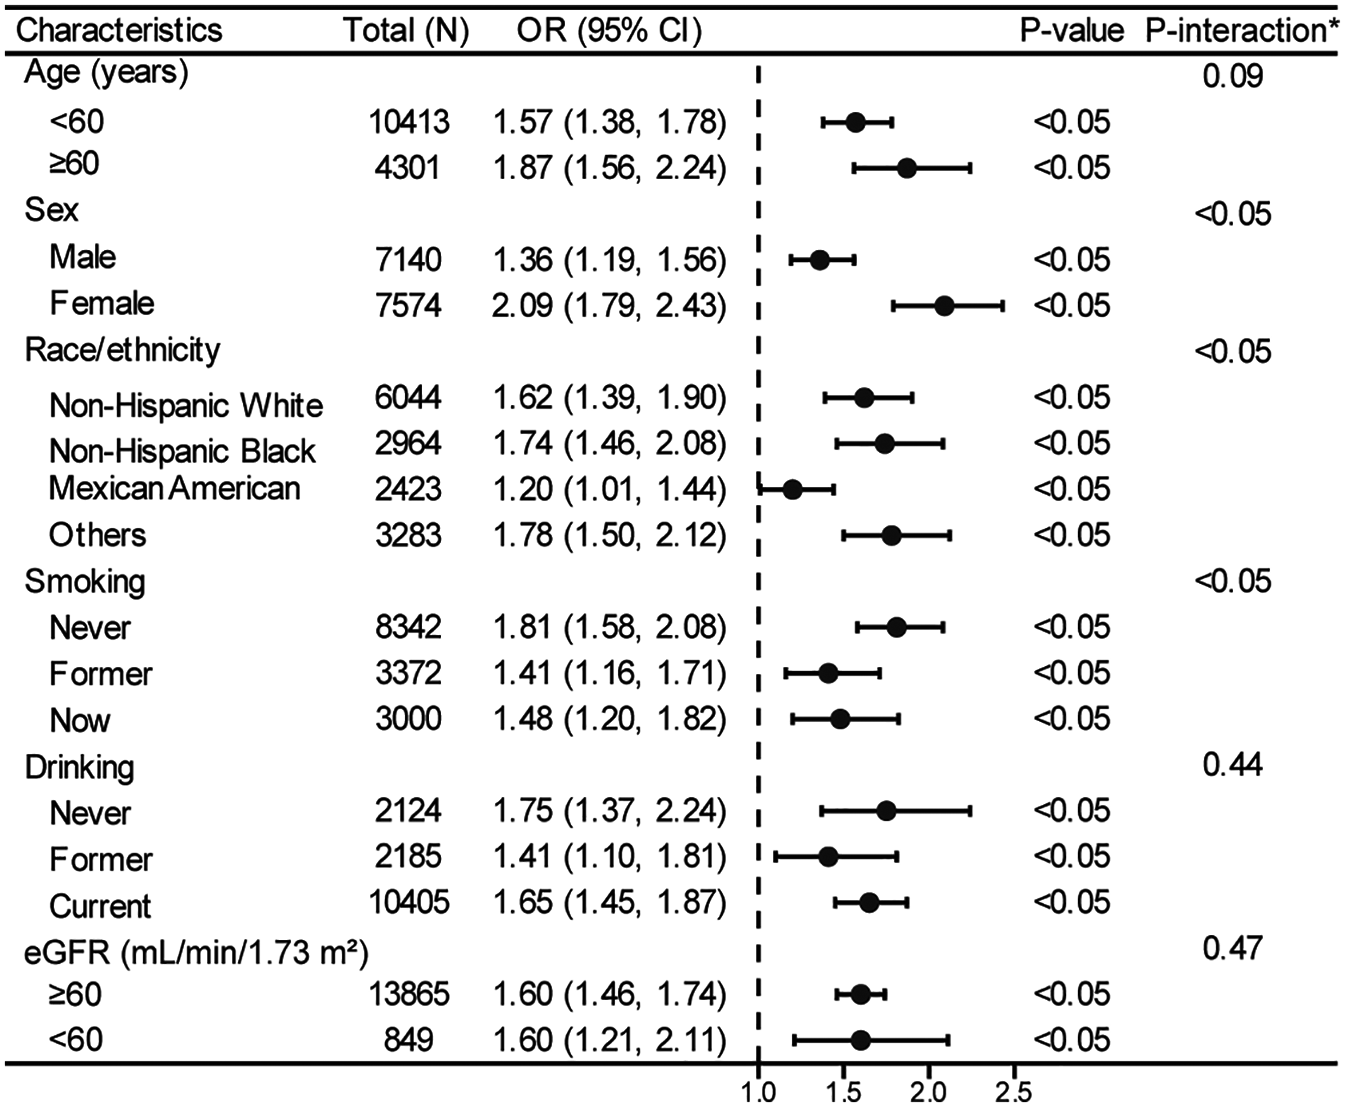
Stratified analyses between TyG index and hyperuricemia in a population with early-stage (stages 0–3) CKM syndrome. *Each stratification adjusted for all the factors (age, sex, race/ethnicity, PIR, educational level, METs/week, smoking, drinking, BMI, eGFR, glucose metabolism state, hypertension, hyperlipidemia, and HEI-2015) except the stratification factor itself. OR, odds ratio; CI, confidence interval; TyG, triglyceride-glucose; CKM, cardiovascular-kidney-metabolic; PIR, poverty income ratio; MET, metabolic equivalent; BMI, body mass index; eGFR, estimated glomerular filtration rate; HEI, healthy eating index.
Further stratified analyses using generalized additive models and smooth curve fitting (Figure 4) consistently revealed nonlinear relationships between TyG index and hyperuricemia across all subgroups. Although the specific patterns varied among different stratifications of age, sex, race/ethnicity, smoking status, drinking status and eGFR, the presence of nonlinearity remained evident throughout all analyses, providing additional support for the nonlinear association pattern identified in our main analysis (Figure 2).
Figure 4
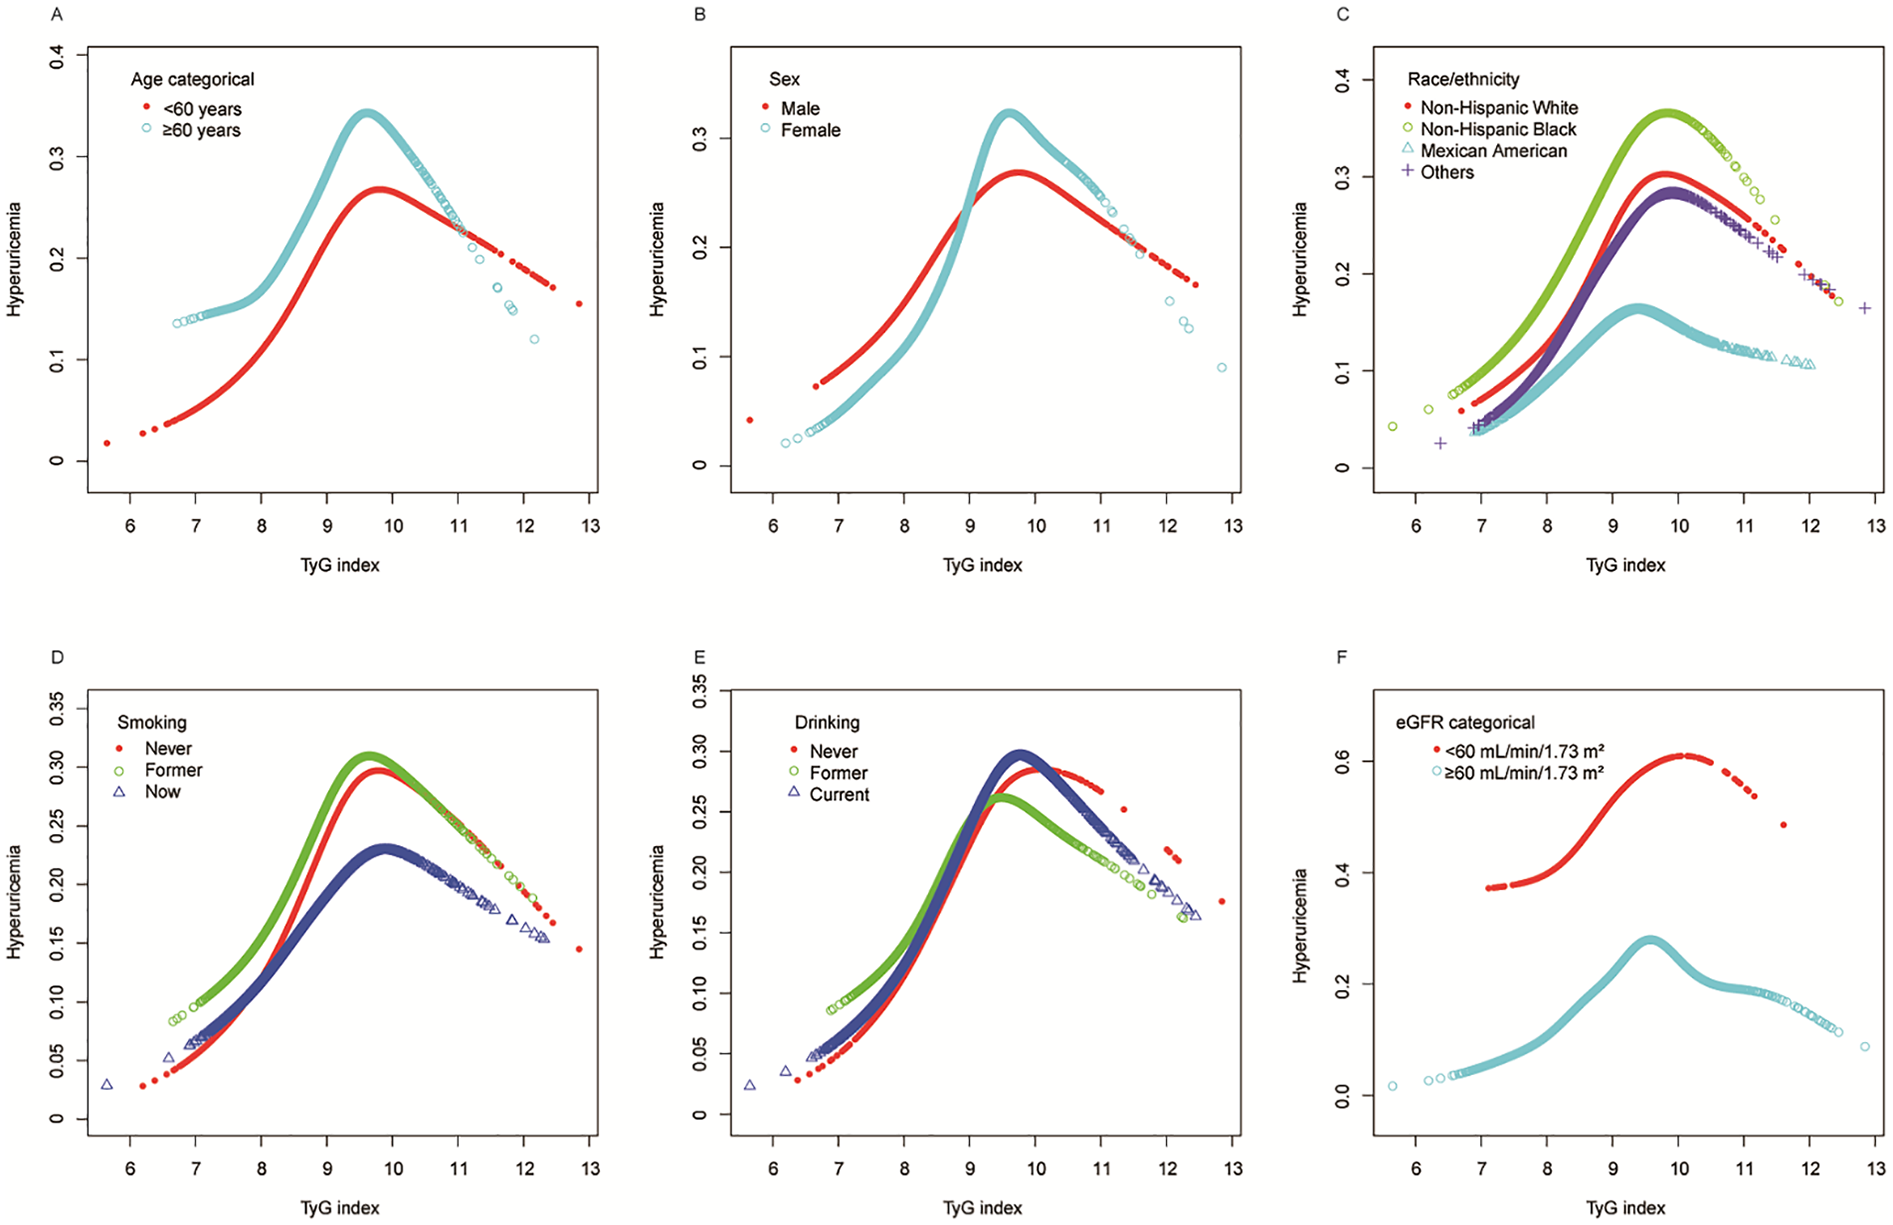
Stratified analyses (by (A) age; (B) sex; (C) race/ethnicity; (D) smoking; (E) drinking; (F) eGFR) between TyG index and hyperuricemia in a population with early-stage (stages 0–3) CKM syndrome using generalized additive model and smooth curve fittings. *Each generalized additive model and smooth curve fitting was adjusted for all factors, including age, sex, race/ethnicity, PIR, educational level, METs/week, smoking, drinking, BMI, eGFR, glucose metabolism state, hypertension, hyperlipidemia, and HEI-2015, except for the stratification factor itself. TyG, triglyceride-glucose; CKM, cardiovascular-kidney-metabolic; PIR, poverty income ratio; MET, metabolic equivalent; BMI, body mass index; eGFR, estimated glomerular filtration rate; HEI, healthy eating index.
4 Discussion
This study is the first to investigate the association between the TyG index and hyperuricemia in individuals with early-stage CKM syndrome. While previous studies have primarily focused on specific disease populations or high-risk groups, evidence from early-stage CKM syndrome population remains scarce. Using data from 14,716 participants with early-stage CKM syndrome in NHANES 2005–2018, with complex survey design methods, we ensured accurate and nationally representative estimates. After comprehensive adjustment for potential confounders, each unit increase in TyG index was associated with 62% higher odds of hyperuricemia (OR = 1.62, 95% CI: 1.45–1.81). Notably, generalized additive model analysis revealed a non-linear relationship with an inflection point at TyG index of 9.50: below this threshold, each unit increase in TyG index was associated with 118% higher odds of hyperuricemia (OR = 2.18, 95% CI: 1.82–2.61), while beyond this point, the association reversed to negative and became statistically non-significant (OR = 0.79, 95% CI: 0.57–1.10). These findings provide important implications for hyperuricemia risk assessment in early-stage CKM syndrome population.
The relationship between IR and hyperuricemia has garnered considerable attention in recent years. Studies have demonstrated that IR may influence uric acid metabolism and excretion through multiple mechanisms, thereby promoting the development of hyperuricemia. First, IR is closely associated with the renal handling of uric acid. Research indicates that IR leads to increased tubular reabsorption of uric acid, reducing its excretion and subsequently elevating serum uric acid levels (18). Furthermore, IR is also linked to reduced renal sodium excretion, which may further impact uric acid metabolism (19). Second, IR is intricately related to other components of metabolic syndrome, such as obesity and hypertension. Both obesity and hypertension are independent risk factors for hyperuricemia, and IR plays a pivotal role in the development and progression of these conditions (11, 20). Consequently, IR may indirectly contribute to hyperuricemia by influencing these metabolic disturbances. Although the hyperinsulinemic-euglycemic clamp (HEC) remains the gold standard for assessing IR, its technical complexity and high cost render it impractical for routine clinical use (21). The TyG index has emerged as a reliable surrogate marker for IR due to its simplicity, ease of calculation, and potential for widespread clinical application.
Consistent with the findings of this study, multiple research studies provide consistent evidence of a positive correlation between the TyG index and the risk of hyperuricemia. In a comprehensive analysis involving 30,453 individuals aged 50 and older, it was found that for each unit increase in the TyG index, the risk of hyperuricemia increased by 1.44 times in men and by 1.69 times in women, even after adjusting for confounding factors (22). Another study involving 14,286 American adults and 4,620 Chinese adults found that the TyG index, along with TyG-BMI, TyG-WHtR, and TyG-WC, was significantly associated with hyperuricemia, with predictive ability stronger in women than in men (23). Among adults with hypertension, the TyG index also demonstrated a linear positive correlation with hyperuricemia, with an odds ratio of 2.39 for hypertensive patients and 2.61 for non-hypertensive participants (24). A cross-sectional study of 42,387 Chinese adults showed that higher TyG levels were associated with an increased risk of hyperuricemia, with risk ratios exceeding those of its two gender components (25). Collectively, these findings suggest that the TyG index can serve as a valuable predictor of hyperuricemia risk across different demographic groups, highlighting the importance of monitoring IR in the prevention and management of hyperuricemia.
Our study identified a non-linear relationship between the TyG index and hyperuricemia in individuals with early-stage CKM syndrome, with a threshold effect observed at a TyG index of 9.50. Interestingly, another study reported a similar non-linear association in a general population, where the inflection point was found at 9.69 (26). These discrepant threshold values can be attributed to multiple factors: Firstly, the metabolic profiles of individuals in early-stage CKM syndrome may differ significantly from those in the general population. Specifically, CKM syndrome is characterized by heightened IR and other metabolic abnormalities that could fundamentally alter the TyG index's predictive capacity for hyperuricemia (27). Moreover, the presence of additional metabolic risk factors in the CKM syndrome population may further exacerbate the impact of the TyG index on hyperuricemia, consequently resulting in a lower threshold compared to the general population. In contrast, Wang et al. explored the nonlinear correlation between the TyG index and hyperuricemia in a hypertensive population using restricted cubic splines. Their results differed markedly, indicating no statistically significant nonlinear relationship between the two (p-nonlinear > 0.05) (24). Collectively, these findings highlight the complexity of interpreting the relationship between the TyG index and hyperuricemia. They underscore the critical importance of considering population-specific characteristics, suggesting that effective risk assessment and management may necessitate tailored approaches across different clinical contexts.
The nonlinear relationship observed between the TyG index and hyperuricemia in early-stage CKM syndrome patients can be attributed to several complex metabolic mechanisms involving threshold-dependent physiological adaptations and compensatory responses. The contrasting associations before and after the inflection point may be explained by the intricate interplay of IR, lipid metabolism, and uric acid regulation through distinct pathophysiological phases.
Prior to the 9.50 threshold, the positive correlation is mediated through multiple interconnected pathways (28–30). Insulin resistance progressively impairs renal uric acid handling by promoting hyperinsulinemia-induced reduction in uric acid clearance through enhanced tubular reabsorption (26, 31). Mechanistically, elevated insulin levels directly stimulate urate transporter 1 (URAT1) expression and suppress ATP-binding cassette subfamily G member 2 (ABCG2) activity, leading to enhanced uric acid reabsorption and reduced secretion in the proximal tubules (32). Furthermore, progressive insulin resistance is associated with accelerated purine synthesis through increased adenosine triphosphate breakdown during elevated triglyceride metabolism, directly contributing to enhanced uric acid production (26). The pro-inflammatory state and oxidative stress associated with increasing insulin resistance create a metabolic environment that promotes uric acid accumulation while simultaneously impairing renal excretory capacity (33, 34).
The critical inflection point at TyG index 9.50 represents a metabolic threshold where compensatory mechanisms begin to predominate over pathological processes. This threshold likely corresponds to a point where the body's adaptive responses to severe insulin resistance reach maximum capacity, triggering protective metabolic adjustments. At this stage, uric acid transitions from its pro-oxidant role to serving as a compensatory antioxidant mechanism against the excessive oxidative stress induced by severe insulin resistance (33). This phenomenon aligns with the concept of metabolic saturation effects, where compensatory mechanisms reach a plateau, thereby attenuating further increases in hyperuricemia risk despite continued insulin resistance progression.
Beyond the 9.50 threshold, several compensatory mechanisms may explain the paradoxical negative association (34–37). Advanced insulin resistance triggers pancreatic β-cell dysfunction, leading to reduced insulin secretion and consequently decreased insulin-mediated uric acid reabsorption (34). Additionally, the glucose-uric acid competitive inhibition mechanism becomes prominent when glucose levels exceed renal threshold, leading to competitive inhibition of uric acid reabsorption and increased uric acid excretion through glucosuria-mediated osmotic diuresis (35). The dual antioxidant-pro-oxidant nature of uric acid suggests that at extreme insulin resistance levels, uric acid may serve a protective role, with homeostatic mechanisms favoring its utilization as an antioxidant buffer against overwhelming oxidative stress (33). However, it is important to acknowledge that the specific mechanisms underlying the paradoxical negative association beyond the 9.50 threshold remain largely hypothetical and require further experimental validation. While the individual components of these proposed mechanisms (β-cell dysfunction, glucose-uric acid competitive inhibition, and uric acid's antioxidant properties) are well-established in the literature, their specific interplay and timing in relation to the observed threshold effect represent a working hypothesis that warrants dedicated mechanistic studies in early-stage CKM syndrome populations.
The identification of this specific threshold value (9.50) in early-stage CKM syndrome populations, compared to the higher threshold (9.69) observed in general populations, suggests that individuals with metabolic dysfunction experience metabolic decompensation at lower insulin resistance levels. This difference may reflect the heightened metabolic vulnerability of CKM syndrome patients, where the presence of additional cardiovascular and renal risk factors creates a lower tolerance threshold for insulin resistance-mediated metabolic disturbances (38, 39). The earlier onset of compensatory mechanisms in this population may represent an adaptive response to prevent further metabolic deterioration, highlighting the clinical significance of this threshold for risk stratification and intervention timing. Future research should focus on mechanistic studies to validate these proposed compensatory pathways and elucidate the precise biological basis for the observed threshold effect, particularly through longitudinal assessments of insulin sensitivity, uric acid metabolism, and renal function in CKM syndrome populations.
We conducted a stratified analysis to examine the differences in the TyG index and hyperuricemia across different subgroups in the early-stage CKM population. Interestingly, the subgroup analysis results based on the forest plot logistic regression showed that the positive correlation between the TyG index and hyperuricemia remained strong, regardless of age, gender, race, smoking, and alcohol consumption. This confirms the reliability and universality of our findings. The consistent association across different eGFR levels (≥60 and <60 ml/min/1.73 m2) with nearly identical effect sizes demonstrates the robustness of this relationship independent of baseline kidney function, which is particularly relevant given that renal insufficiency significantly affects uric acid metabolism. Simultaneously, the stratified analysis based on the generalized additive model and smooth curve fitting revealed a U-shaped nonlinear relationship within different subgroups, which further validates the stability of previous research results. Moreover, gender, race, and smoking appeared to influence the association between the TyG index and hyperuricemia in the early-stage CKM population (significant interaction P values), while age, drinking status, and eGFR showed no significant interaction effects. The observed interaction effects reflect complex biological mechanisms that warrant detailed mechanistic consideration. Sex-based differences in TyG-hyperuricemia associations are primarily mediated through estrogen's multifaceted metabolic effects. Estrogen enhances uric acid excretion by upregulating organic anion transporters (OAT1, OAT3) expression while downregulating URAT1 activity in renal tubules, promoting renal uric acid clearance (40). Simultaneously, estrogen improves insulin sensitivity through multiple pathways including enhanced GLUT4 translocation, improved mitochondrial biogenesis, and activation of PI3K/Akt signaling cascades (41). Additionally, estrogen's anti-inflammatory properties may attenuate the oxidative stress-mediated link between insulin resistance and hyperuricemia (42). Racial differences likely reflect genetic polymorphisms in key metabolic pathways, including variants in uric acid transporter genes (ABCG2, SLC2A9, SLC22A12) that show significant ethnic distribution differences, with Asian populations showing stronger associations for ABCG2 rs2231142 and different effect sizes for SLC2A9 variants compared to Caucasian populations (43). The smoking-related interactions may result from nicotine's complex effects on insulin sensitivity through increased IRS-1 Ser636 phosphorylation and inflammatory cascades that modify purine metabolism and renal uric acid handling (44).
These mechanistic insights have direct implications for developing individualized prevention strategies in early-stage CKM syndrome management. Sex-specific TyG index thresholds may optimize risk prediction, with potentially higher cut-points for premenopausal women due to estrogen's protective effects on both insulin sensitivity and uric acid excretion (45). Race-specific risk assessment models incorporating both TyG index values and genetic risk profiles could enhance prediction accuracy, particularly beneficial for populations with known genetic predispositions to hyperuricemia or insulin resistance (46). Given the synergistic metabolic effects observed, smoking cessation should be prioritized in CKM syndrome patients with elevated TyG index (47). Furthermore, lifestyle interventions could be tailored based on subgroup characteristics: dietary approaches emphasizing glycemic control may be particularly effective for individuals with genetic predispositions to insulin resistance, while structured exercise programs may show differential effectiveness across sex and ethnic groups (48). These personalized approaches represent a paradigm shift toward precision medicine in early-stage CKM syndrome prevention and management (49).
This study highlights the clinical potential of the TyG index as a simple, cost-effective biomarker for early detection of hyperuricemia in individuals with early-stage CKM syndrome. Unlike traditional markers, the TyG index integrates metabolic and insulin resistance parameters, offering a comprehensive risk assessment tool that could facilitate proactive screening and timely interventions. By identifying a threshold effect, our research provides novel insights that could refine risk stratification strategies, encouraging its inclusion in routine clinical practice and public health guidelines. Clinicians could use the TyG index to guide dietary, lifestyle, or pharmacological interventions targeting metabolic dysfunction and uric acid regulation. Future research should validate these findings in longitudinal studies, investigate underlying mechanisms, and assess the impact of TyG-index-based interventions on long-term outcomes, further solidifying its role in clinical and public health applications.
This study possesses several strengths that enhance its validity and significance. First, the use of a large, nationally representative sample from the NHANES database ensures broad generalizability and robust statistical power. Second, the study focused specifically on individuals with early-stage CKM syndrome, addressing a critical gap in current research by exploring metabolic and uric acid dynamics in this unique population. Third, standardized data collection methods, including biochemical measurements and comprehensive covariate assessments, minimize potential measurement biases and enhance data reliability. Fourth, advanced statistical methods, such as the application of smooth curve fitting and threshold analysis, allowed for the exploration of non-linear relationships and provided nuanced insights into the TyG index's role in predicting hyperuricemia. Finally, rigorous adjustment for a wide range of confounders ensured that the observed associations were as unbiased as possible. Together, these methodological strengths make our findings both credible and impactful, providing a valuable foundation for future research and clinical applications.
This study has several limitations that should be acknowledged. First, due to our inclusion and exclusion criteria, the findings may have limited generalizability. For instance, we excluded individuals under 20 years old, pregnant women, and those with advanced CKM syndrome (stage 4), which means our results cannot be directly applied to these groups. Second, while the NHANES database provides a large, nationally representative sample, the cross-sectional nature of this study restricts our ability to establish causal relationships between the TyG index and hyperuricemia. Third, despite adjusting for multiple confounders, unmeasured or residual confounding cannot be entirely ruled out, as certain factors influencing the relationship, such as genetic predisposition or environmental exposures, may not have been accounted for. Fourth, the study focused primarily on a U.S. population, and while it included diverse ethnic groups, caution is needed when extrapolating the findings to non-U.S. populations or other ethnic groups with distinct metabolic profiles. Finally, we utilized a single measurement of the TyG index and uric acid levels, which may not fully capture their variability over time. Addressing these limitations in future longitudinal and interventional studies could further strengthen the clinical implications of our findings.
5 Conclusion
This study is the first to systematically reveal the complex association between the TyG index and hyperuricemia in early-stage CKM syndrome populations. By analyzing 14,716 participants, we confirmed the TyG index as an effective indicator for hyperuricemia risk and uniquely identified its nonlinear relationship's critical inflection point. The results emphasize the significance of TyG index 9.50 as a key threshold for metabolic risk transformation, providing a novel perspective for clinical risk stratification. Future research should explore the physiological mechanisms underlying this nonlinear association, design prospective cohort studies to validate our findings, and develop more precise personalized risk prediction models. Large-scale, cross-ethnic, multi-center studies will help verify our conclusions and provide comprehensive evidence for precision medicine in early-stage CKM syndrome.
Statements
Data availability statement
The raw data supporting the conclusions of this article will be made available by the authors, without undue reservation.
Ethics statement
The studies involving humans were approved by the National Center for Health Statistics (NCHS) Ethics Review Board. The studies were conducted in accordance with the local legislation and institutional requirements. The participants provided their written informed consent to participate in this study.
Author contributions
XC: Formal analysis, Investigation, Methodology, Project administration, Software, Supervision, Validation, Visualization, Writing – original draft, Writing – review & editing. YL: Conceptualization, Data curation, Formal analysis, Funding acquisition, Investigation, Methodology, Project administration, Resources, Software, Supervision, Validation, Visualization, Writing – original draft, Writing – review & editing.
Funding
The author(s) declare that no financial support was received for the research and/or publication of this article.
Acknowledgments
We acknowledge the National Center for Health Statistics at the CDC, which was responsible for designing, collecting, and administering the NHANES data and making the data available for public use.
Conflict of interest
The authors declare that the research was conducted in the absence of any commercial or financial relationships that could be construed as a potential conflict of interest.
Generative AI statement
The author(s) declare that no Generative AI was used in the creation of this manuscript.
Any alternative text (alt text) provided alongside figures in this article has been generated by Frontiers with the support of artificial intelligence and reasonable efforts have been made to ensure accuracy, including review by the authors wherever possible. If you identify any issues, please contact us.
Publisher’s note
All claims expressed in this article are solely those of the authors and do not necessarily represent those of their affiliated organizations, or those of the publisher, the editors and the reviewers. Any product that may be evaluated in this article, or claim that may be made by its manufacturer, is not guaranteed or endorsed by the publisher.
Supplementary material
The Supplementary Material for this article can be found online at: https://www.frontiersin.org/articles/10.3389/fcvm.2025.1553957/full#supplementary-material
References
1.
Ndumele CE Rangaswami J Chow SL Neeland IJ Tuttle KR Khan SS et al Cardiovascular-kidney-metabolic health: a presidential advisory from the American heart association. Circulation. (2023) 148(20):1606–35. 10.1161/CIR.0000000000001184
2.
Hisatome I Li P Miake J Taufiq F Mahati E Maharani N et al Uric acid as a risk factor for chronic kidney disease and cardiovascular disease — Japanese guideline on the management of asymptomatic hyperuricemia. Circ J. (2021) 85(2):130–8. 10.1253/circj.CJ-20-0406
3.
Weaver DJ . Uric acid and progression of chronic kidney disease. Pediatr Nephrol. (2019) 34(5):801–9. 10.1007/s00467-018-3979-2
4.
Johnson RJ Bakris GL Borghi C Chonchol MB Feldman D Lanaspa MA et al Hyperuricemia, acute and chronic kidney disease, hypertension, and cardiovascular disease: report of a scientific workshop organized by the national kidney foundation. Am J Kidney Dis. (2018) 71(6):851–65. 10.1053/j.ajkd.2017.12.009
5.
Pang S Jiang Q Sun P Li Y Zhu Y Liu J et al Hyperuricemia prevalence and its association with metabolic disorders: a multicenter retrospective real-world study in China. Ann Transl Med. (2021) 9(20):1550–1550. 10.21037/atm-21-5052
6.
Ma L Wang J Ma L Ge Y Wang XM . The effect of lipid metabolism disorder on patients with hyperuricemia using Multi-Omics analysis. Sci Rep. (2023) 13(1):18211. 10.1038/s41598-023-45564-8
7.
Guerrero-Romero F Simental-Mendía LE González-Ortiz M Martínez-Abundis E Ramos-Zavala MG Hernández-González SO et al The product of triglycerides and glucose, a simple measure of insulin sensitivity. Comparison with the euglycemic-hyperinsulinemic clamp. J Clin Endocrinol Metab. (2010) 95(7):3347–51. 10.1210/jc.2010-0288
8.
Khalaji A Behnoush AH Khanmohammadi S Ghanbari Mardasi K Sharifkashani S Sahebkar A et al Triglyceride-glucose index and heart failure: a systematic review and meta-analysis. Cardiovasc Diabetol. (2023) 22(1):244. 10.1186/s12933-023-01973-7
9.
Xu Z Chen P Wang L Yan J Yan X Li D . Relationship between TyG index and the degree of coronary artery lesions in patients with H-type hypertension. Cardiovasc Diabetol. (2014) 23(1):23. 10.1186/s12933-023-02013-0
10.
Lee DY Lee ES Kim JH Park SE Park C-Y Oh K-W et al Predictive value of triglyceride glucose index for the risk of incident diabetes: a 4-year retrospective longitudinal study. PLoS One. (2016) 11(9):e0163465. 10.1371/journal.pone.0163465
11.
Wang Y Yang W Jiang X . Association between triglyceride-glucose index and hypertension: a meta-analysis. Front Cardiovasc Med. (2015) 8:644035. 10.3389/fcvm.2021.644035
12.
Li F Wang Y Shi B Sun S Wang S Pang S et al Association between the cumulative average triglyceride glucose-body mass index and cardiovascular disease incidence among the middle-aged and older population: a prospective nationwide cohort study in China. Cardiovasc Diabetol. (2024) 23(1):16. 10.1186/s12933-023-02114-w
13.
Ndumele CE Neeland IJ Tuttle KR Chow SL Mathew RO Khan SS et al A synopsis of the evidence for the science and clinical management of cardiovascular-kidney-metabolic (CKM) syndrome: a scientific statement from the American heart association. Circulation. (2023) 148(20):1636–64. 10.1161/CIR.0000000000001186
14.
Simental-Mendía LE Rodríguez-Morán M Guerrero-Romero F . The product of fasting glucose and triglycerides as surrogate for identifying insulin resistance in apparently healthy subjects. Metab Syndr Relat Disord. (2008) 6(4):299–304. 10.1089/met.2008.0034
15.
Wang H Qin S Li F Zhang H Zeng L . A cross-sectional study on the association between dietary inflammatory index and hyperuricemia based on NHANES 2005–2018. Front Nutr. (2023) 10:1218166. 10.3389/fnut.2023.1218166
16.
Levey AS Stevens LA Schmid CH Zhang Y Castro AF 3rd Feldman HI et al A new equation to estimate glomerular filtration rate. Ann Intern Med. (2009) 150(9):604–12. 10.7326/0003-4819-150-9-200905050-00006
17.
Krebs-Smith SM Pannucci TE Subar AF Kirkpatrick SI Lerman JL Tooze JA et al Update of the healthy eating index: hEI-2015. J Acad Nutr Diet. (2018) 118(9):1591–602. 10.1016/j.jand.2018.05.021
18.
Ghorbani Z Mirmohammadali SN Shoaibinobarian N Rosenkranz SK Arami S Hekmatdoost A et al Insulin resistance surrogate markers and risk of hyperuricemia among patients with and without coronary artery disease: a cross-sectional study. Front Nutr. (2023) 10:1048675. 10.3389/fnut.2023.1048675
19.
Oh SW Koo HS Han KH Han SY Chin HJ . Associations of sodium intake with obesity, metabolic disorder, and albuminuria according to age. PLoS One. (2017) 12(12):e0188770. 10.1371/journal.pone.0188770
20.
Kang Y-H Cho M-H Kim J-Y Kwon M-S Peak J-J Kang S-W et al Impaired macrophage autophagy induces systemic insulin resistance in obesity. Oncotarget. (2016) 7(24):35577–91. 10.18632/oncotarget.9590
21.
Wallace TM Matthews DR . The assessment of insulin resistance in man. Diabetic Med. (2002) 19(7):527–34. 10.1046/j.1464-5491.2002.00745.x
22.
He H Cheng Q Chen S Li Q Zhang J Shan G et al Triglyceride-glucose index and its additive interaction with ABCG2/SLC2A9 polygenic risk score on hyperuricemia in middle age and older adults: findings from the DLCC and BHMC study. Ann Med. (2024) 56(1):2434186. 10.1080/07853890.2024.2434186
23.
Gou R Dou D Tian M Chang X Zhao Y Meng X et al Association between triglyceride glucose index and hyperuricemia: a new evidence from China and the United States. Front Endocrinol. (2024) 15:1403858. 10.3389/fendo.2024.1403858
24.
Wang L Chao J Zhang N Wu Y Bao M Yan C et al A national study exploring the association between triglyceride-glucose index and risk of hyperuricemia events in adults with hypertension. Prev Med Rep. (2024) 43:102763. 10.1016/j.pmedr.2024.102763
25.
Gu Q Hu X Meng J Ge J Wang SJ Liu XZ . Associations of triglyceride-glucose index and its derivatives with hyperuricemia risk: a cohort study in Chinese general population. Int J Endocrinol. (2020) 2020:1–7. 10.1155/2020/3214716
26.
Qiu L Ren Y Li J Li M Li W Qin L et al Nonlinear association of triglyceride-glucose index with hyperuricemia in US adults: a cross-sectional study. Lipids Health Dis. (2024) 23(1):145. 10.1186/s12944-024-02146-5
27.
Li W Shen C Kong W Zhou X Fan H Zhang Y et al Association between the triglyceride glucose-body mass index and future cardiovascular disease risk in a population with cardiovascular-kidney-metabolic syndrome stage 0–3: a nationwide prospective cohort study. Cardiovasc Diabetol. (2024) 23(1):292. 10.1186/s12933-024-02352-6
28.
Seifi N Nosrati M Koochackpoor G Aghasizadeh M Bahari H Namdar HB et al The association between hyperuricemia and insulin resistance surrogates, dietary- and lifestyle insulin resistance indices in an Iranian population: MASHAD cohort study. Nutr J. (2024) 23(1):5. 10.1186/s12937-023-00904-2
29.
Dai Y Zhang Y Wang B Cao L Wang Z . The association between triglyceride glucose index and gout: a cross-sectional analysis based on NHANES 2007–2018. BMC Endocr Disord. (2024) 24(1):218. 10.1186/s12902-024-01747-6
30.
Lertsakulbunlue S Sangkool T Bhuriveth V Mungthin M Rangsin R Kantiwong A et al Associations of triglyceride-glucose index with hyperuricemia among Royal Thai Army personnel. BMC Endocr Disord. (2013) 24(1):17. 10.1186/s12902-024-01542-3
31.
Zhu Y Hu Y Huang T Zhang Y Li Z Luo C et al High uric acid directly inhibits insulin signalling and induces insulin resistance. Biochem Biophys Res Commun. (2014) 447(4):707–14. 10.1016/j.bbrc.2014.04.080
32.
Toyoki D Shibata S Kuribayashi-Okuma E Xu N Ishizawa K Hosoyamada M et al Insulin stimulates uric acid reabsorption via regulating urate transporter 1 and ATP-binding cassette subfamily G member 2. Am J Physiol Renal Physiol. (2017) 313(3):F826–34. 10.1152/ajprenal.00012.2017
33.
Maloberti A Tognola C Garofani I Algeri M Shkodra A Bellantonio V et al Uric acid and metabolic syndrome: importance of hyperuricemia cut-off. Int J Cardiol. (2024) 417:132527. 10.1016/j.ijcard.2024.132527
34.
Du L Zong Y Li H Wang Q Xie L Yang B et al Hyperuricemia and its related diseases: mechanisms and advances in therapy. Sig Transduct Target Ther. (2024) 9(1):212. 10.1038/s41392-024-01916-y
35.
Han R Zhang Y Jiang X . Relationship between four non-insulin-based indexes of insulin resistance and Serum uric acid in patients with type 2 diabetes: a cross-sectional study. DMSO. (2022) 15:1461–71. 10.2147/DMSO.S362248
36.
Wang C Liang K Zhang X Li C Yang W Ma Z et al Metabolic abnormalities, but not obesity, contribute to the mildly reduced eGFR in middle-aged and elderly Chinese. Int Urol Nephrol. (2014) 46(9):1793–9. 10.1007/s11255-014-0797-8
37.
Zhang T Gu Y Meng G Zhang Q Liu L Wu H et al Genetic risk, adherence to a healthy lifestyle, and hyperuricemia: the TCLSIH cohort study. Am J Med. (2023) 136(5):476–483.e5. 10.1016/j.amjmed.2023.01.004
38.
Lin JD Chiou WK Chang HY Liu FH Weng HF . Serum uric acid and leptin levels in metabolic syndrome: a quandary over the role of uric acid. Metab Clin Exp. (2007) 56(6):751–6. 10.1016/j.metabol.2007.01.006
39.
Spatola L Ferraro PM Gambaro G Badalamenti S Dauriz M . Metabolic syndrome and uric acid nephrolithiasis: insulin resistance in focus. Metab Clin Exp. (2018) 83:225–33. 10.1016/j.metabol.2018.02.008
40.
Li R Wu B Han M Li M Yang X Zhang J et al Uric acid metabolic disorders in pituitary-target gland axis. DMSO. (2024) 17:661–73. 10.2147/DMSO.S448547
41.
De Paoli M Zakharia A Werstuck GH . The role of estrogen in insulin resistance. Am J Pathol. (2021) 191(9):1490–8. 10.1016/j.ajpath.2021.05.011
42.
Ortiz-Huidobro RI Velasco M Larqué C Escalona R Hiriart M . Molecular insulin actions are sexually dimorphic in lipid metabolism. Front Endocrinol. (2021) 12:690484. 10.3389/fendo.2021.690484
43.
Lukkunaprasit T Rattanasiri S Turongkaravee S Suvannang N Ingsathit A Attia J et al The association between genetic polymorphisms in ABCG2 and SLC2A9 and urate: an updated systematic review and meta-analysis. BMC Med Genet. (2020) 21(1):210. 10.1186/s12881-020-01147-2
44.
Bajaj M . Nicotine and insulin resistance: when the smoke clears. Diabetes. (2012) 61(12):3078–80. 10.2337/db12-1100
45.
Chary S Amrein K Lasky-Su JA Dobnig H Christopher KB . Metabolomic differences between critically Ill women and men. Sci Rep. (2021) 11(1):3951. 10.1038/s41598-021-83602-5
46.
Tu H-P Chung C-M Min-Shan Ko A Lee S-S Lai H-M Lee C-H et al Additive composite ABCG2, SLC2A9 and SLC22A12 scores of high-risk alleles with alcohol use modulate gout risk. J Hum Genet. (2016) 61(9):803–10. 10.1038/jhg.2016.57
47.
Jang YS Nerobkova N Yun I Kim H Park EC . Association between smoking behavior and serum uric acid among the adults: findings from a national cross-sectional study. PLoS One. (2023) 18(5):e0285080. 10.1371/journal.pone.0285080
48.
De Toro-Martín J Arsenault B Després JP Vohl MC . Precision nutrition: a review of personalized nutritional approaches for the prevention and management of metabolic syndrome. Nutrients. (2017) 9(8):913. 10.3390/nu9080913
49.
Gharipour M Nezafati P Sadeghian L Eftekhari A Rothenberg I Jahanfar S . Precision medicine and metabolic syndrome. ARYA Atheroscler. (2022) 18(4):1–10. 10.22122/arya.2022.26215
Summary
Keywords
triglyceride-glucose index (TyG), hyperuricemia, cardiovascular-kidney-metabolic syndrome (CKM), threshold effect, United States
Citation
Chen X and Liang Y (2025) Nonlinear association between triglyceride-glucose index and risk of hyperuricemia in early-stage cardiovascular-kidney-metabolic syndrome: a cross-sectional study of United States population. Front. Cardiovasc. Med. 12:1553957. doi: 10.3389/fcvm.2025.1553957
Received
31 December 2024
Accepted
06 October 2025
Published
17 October 2025
Volume
12 - 2025
Edited by
Yashendra Sethi, PearResearch, India
Reviewed by
Pei Wang, University of Washington, United States
Feng Hu, Fujian Medical University, China
Updates
Copyright
© 2025 Chen and Liang.
This is an open-access article distributed under the terms of the Creative Commons Attribution License (CC BY). The use, distribution or reproduction in other forums is permitted, provided the original author(s) and the copyright owner(s) are credited and that the original publication in this journal is cited, in accordance with accepted academic practice. No use, distribution or reproduction is permitted which does not comply with these terms.
* Correspondence: Yan Liang 179050526@qq.com
Disclaimer
All claims expressed in this article are solely those of the authors and do not necessarily represent those of their affiliated organizations, or those of the publisher, the editors and the reviewers. Any product that may be evaluated in this article or claim that may be made by its manufacturer is not guaranteed or endorsed by the publisher.