Abstract
Aim:
To identify a new method to indicate when coronary computed tomography angiography (CCTA) in patients with calcified plaque can be accurate.
Methods:
Prospective analysis on 105 cases of coronary artery stenosis with calcified plaque underwent both CCTA and invasive coronary angiography (ICA). The Hounsfield unit (Hu) values of calcified plaque and adjacent blood were measured, and then the ratio (RHu) was subsequently calculated. The ICA data served as the gold standard for defining obstructive stenosis (≥ 50%) and were utilized to create a two-dimensional receiver operating characteristic (ROC) curve. The cut-off value was employed to categorize the CCTA data. Additionally, a Bland-Altman plot was used to analyze discrepancies in stenosis degree detection between CCTA and ICA. An in vitro experiment was designed to assess the practicability of RHu.
Results:
The RHu was correlated with the concordance of CCTA and ICA for stenosis evaluation (r = 0.509, p < 0.001). ROC analysis suggested a cut-off value of 0.36. The Bland-Altman plot indicated that stenosis evaluation by CCTA demonstrates good concordance when RHu exceeds 0.36; however, significant bias occurs when RHu is below 0.36 in comparison to ICA. In vitro experiments confirmed that the RHu parameter can be easily adjusted to enhance the accuracy of CCTA. In validation experiments, the RHu achieved a prediction accuracy of 74.0%.
Conclusion:
Our study suggests that the accuracy of detection of stenosis with CCTA in calcified vessels is related to the difference in Hu values between calcified plaques and blood.
1 Introduction
Coronary artery disease (CAD) is one of the leading causes of mortality worldwide (1). The pathological nature of CAD involves a progressive increase in coronary plaque size, which can potentially lead to plaque rupture and coronary artery thrombosis (2). Many studies have concluded that approximately 50%–70% of coronary artery plaques are calcified in populations that are either asymptomatic or suspected CAD (3–5). The gold standard for CAD diagnosis remains conventional invasive coronary angiography (ICA), however, its invasive nature and insensitivity to calcified plaques and small non-calcified plaques in the vessel wall limit its ability to detect stenosis among populations at low or intermediate risk for this condition, such as those with atherosclerotic disease (6). Multi-detector computed tomography (MDCT) is an emerging imaging modality for the first-line detection of CAD due to its fine spatial and temporal resolution. Furthermore, MDCT can non-invasively image both the lumen and wall of coronary artery vessels, distinguishing between calcified, non-calcified, and mixed plaques, as well as determining the degree of luminal stenosis (7–11).
Currently, one of the primary limitations of coronary computed tomography angiography (CCTA) is its inaccuracy in assessing calcified lesions (12–14). Beam-hardening and blooming artifacts have led to both overestimation and paradoxical underestimation of the severity degree of calcification-related stenosis (15). The beam-hardening effect arises from divergence absorption of low-energy photons as a monoenergetic beam passes through a given material (16). The resulting “filter” effect produce a higher distribution of high-energy (or “harder”) photons, which raises the average energy of the beam and leads to low-attenuation artifacts (17). The majority of false-positive results have been observed in highly calcified segments, primarily due to partial volume effects. To improve diagnostic precision of CCTA, a comprehensive understanding of the relationship between the intrinsic features of calcium plaques and the severity of coronary vessel lumen distortion is essential. Beam-hardening correction (BHC) algorithms, the most commonly used methods for correcting beam-hardening artifacts over the past few decades, have effectively calibrated these artifacts caused by tissues with substantial high-attenuation sources (e.g., bone) (18). Filtered back projection (FBP) algorithms can reduce blooming artifacts but often at the expense of image quality or by increasing radiation exposure through improved spatial resolution achieved via thinner collimated section widths, reconstruction thickness, and higher-resolution sharper reconstruction algorithms (19). Iterative reconstruction techniques can decouple spatial resolution and noise, offering a potential tool to reduce blooming artifacts. However, the effectiveness of iterative reconstruction largely depends on the image acquisition technique employed [e.g., prospective electrocardiographic (ECG) triggering vs. retrospective ECG gating] (20).
Few studies have explored the use of non-algorithmic methods to improve the accuracy of CCTA assessments of calcified lesions. Consequently, we designed this study to enhance clinical relevance, with a primary focus on exploring the relationship between the Hounsfield unit (Hu) values of calcified plaque and adjacent blood, as well as the accuracy of CCTA in assessing coronary lumen stenosis.
2 Methods
2.1 Patients
This prospective study was designed to evaluate the accuracy of CCTA for the detection of coronary calcification stenosis in symptomatic patients to aid in the clinical decision-making of ICA. The study comprised three components: an evaluation experiment, an in vitro experiment, and validation experiments. All patients had ICA scheduled based on the evaluation of cardiologists, with indications including suspected CAD manifesting as chest pain or abnormal or equivocal nuclear stress test results over a three-year period. Patients with soft plaque were excluded from this study. The total cohort was 143 patients, divided into the evaluation cohort (n = 105; 55 men, 50 women; mean age, 64.8 ± 9.36 years) and the validation cohort (n = 38; 28 men, 10 women; mean age, 68.1 ± 6.94 years), all having an Agatston score greater than 100. The study was approved by the institutional review board of our Medical University and was conducted in compliance with Health Insurance Portability and Accountability Act regulations. All participating patients provided informed consent for their involvement in the study, and all experimental protocols adhered to the Declaration of Helsinki.
2.2 CCTA acquisition
A non-contrast-enhanced calcium score scan (detector collimation = 64 × 1.5 mm, 120 kV, ECG gating, slice thickness = 3 mm, medium smooth kernel B35f) was performed for the Agatston Score calculations (21). Then, CCTA examinations were conducted on 256 MDCT units (iCT, Brilliance, Philips Healthcare) and postprocessed on workstations (Brilliance, Philips Healthcare). After the leads for the ECG recording were positioned and adequate peripheral venous access was established, the heart rate of the patient was monitored. Betaloc (25–50 mg) was administered intravenously to achieve a target heart rate of 70 beats per minute (bpm). An automated bolus-tracking scan was performed to initiate the CCTA sequence. Repetitive monitoring scans were conducted at a single slice level during respiration at 50 mA with a scan time duration of 0.35 s. The monitoring scans commenced after a delay of 6 s and were repeated every 1.5 s during quiet breathing. When the contrast enhancement threshold of 100 Hu was reached within the predefined slice (i.e., lumen of the descending aorta), the CCTA scans were initiated. Approximately 5 s after exceeding the threshold level, allowing time for repositioning the table and providing breathing instructions to the patient, the arterial phase scan was commenced. A contrast bolus of iohexol-350 (350 mg I/ml) was injected at a flow rate of 4–6 ml/s through an 18–20-gauge intravenous antecubital catheter by using a power injector (Ulrich, Germany). The total dose of iohexol-350 administered was approximately 0.8–1.0 ml/kg of body weight, which is well below the FDA-recommended dose for elderly patients with pre-existing renal disease.
The CCTA scan parameters were as follows: detector collimation of 1 × 128 × 0.625 mm; gantry rotation time of 270 ms; and a tube current-time product, ranging from 250 to 1,000 mAs per rotation. The tube potential was set at 120 kV for patients with a body mass index (BMI) of 25 kg/m2 or greater, while it was adjusted to 100 kV for patients with a BMI of less than 25 kg/m2. Data acquisition occurred in the craniocaudal direction, extending from above the origin of the coronary arteries to below the diaphragm dome. The effective radiation dose was calculated by multiplying the dose-length product by a chest-specific conversion coefficient (k = 0.014 mSv/Gy/cm).
The measurement steps for coronary artery stenosis were detailed in the supplementary materials and Figure S1. Based on the routine scanning practices of our department, we found that the difference in Hu values between blood and calcified plaques within a single voxel may be associated with the overestimation of coronal stenosis. Consequently, we assessed the ratio of the Hu value of blood to that of calcified plaque (RHu) and measured the degree of stenosis as observed on CCTA. We utilized mean HU values. Region of interest (ROIs) for plaque were placed entirely within the calcified component, ensuring that the high-contrast edge was avoided by an inward margin of at least 0.3–0.5 mm. Three small circular ROIs, each measuring between 0.5 and 1.0 mm², were analyzed across three consecutive slices, and the results were averaged. Blood ROIs were positioned in the central lumen of the same segment, or in the immediately proximal segment when necessary, maintaining a distance of at least 1 mm from the wall to prevent partial volume effects and blooming artifacts. These values were also averaged across three slices (Supplementary Figure S2). The ratio of Hu value between the blood and plaque (RHu) was calculated using the equation provided below.
2.3 Coronary angiography
ICA was performed using the standard Judkins method, and the images were reviewed by senior cardiologists (possessing over 10 years of experience). The coronary arteries were classified according to the American College of Cardiology and the American Heart Association (ACC/AHA) Classification system (22). There were no discrepancies among the interpretations made by the radiologists, radiographers, and cardiologists involved in the studies. Segments were categorized as either nonobstructive disease (characterized by luminal irregularities or < 50% diameter stenosis) or obstructive disease (≥ 50% diameter stenosis). A stenosis of fifty percent was established as the benchmark for determining the necessity of invasive treatments (23). The median interval between CCTA and ICA was 5 days [IQR (3–7)]. Specifically, 28% of patients underwent ICA within 3 days of CCTA, 50% within 4–7 days, and 22% within 8–14 days.
2.4 Data postprocessing
For the CCTA data, reconstructions and stenosis evaluations were conducted by two experienced radiologists, each possessing over 10 years of experience. This process involved vessel segmentation and tracking using the Comprehensive Cardiac Analysis software package, from Philips Healthcare for curved multiplanar reformation (MPR) image reconstruction, as well as straightening each vessel to obtain long-axis views. Then, we moved the mouse cursor along the entire length of the vessel to acquire cross-sectional images. Two radiographers, also with over 10 years of experience, performed the measurements independently, primarily based on the appearance of the arterial lesions in the cross-sectional views. The curved MPR images and straightened long-axis views served as primary references when the quality of the cross-sectional images was deemed too poor or suboptimal for measurement purposes. Additionally, one cardiologist, with more than 10 years of experience, reviewed ICA images to measure the stenosis diameters. The criterion for “obstructive” stenosis was defined as more than 50% of the lumen diameter being consistently occupied by calcified coronary artery plaque.
The degree of stenosis, expressed as a percentage of diameter, was evaluated using both CCTA and ICA. The severity of coronary stenosis was quantified by measuring the diameter at maximum stenosis and the reference diameter for all stenosis. The percentage of stenosis was calculated using the following formula (24):The difference between CCTA and ICA on stenosis evaluation was expressed as a ratio of the degree of stenosis.
For the validation experiment, we generated cumulative histograms for the RHu in patients whose coronary results were either consistent or inconsistent with ICA results, respectively. Additionally, the prediction accuracy of RHu in the validation cohort was determined using the specified formula (25):
2.5 In vitro experiment
In vitro experiments were introduced to testify whether the RHu parameter can effectively adjust to refine the accuracy of CCTA in measuring the degree of stenosis. The phantom for the in vitro experiment was designed to simulate the intussusception of two tubes with differing diameters. The inner tube, with a diameter of 2 mm, was filled with three different concentrations (i.e., 70 wt.%, 60 wt.%, 50 wt.%) of calcium solution, while the outer tuber with a diameter of 20 mm, was filled with a contrast medium (iohexol-350) dissolved in normal saline at three different dilution ratios to obtain varying CT numbers (i.e., 530 Hu, 360 Hu, 250 Hu).
2.6 Statistical analysis
The degree of stenosis was evaluated using both CCTA and ICA. Statistical analyses were conducted with SPSS statistical software (SPSS 12.0; SPSS, Chicago, IL). Lesions were classified as obstructive (≥ 50% luminal diameter narrowing) or nonobstructive (< 50% luminal diameter narrowing). ICA data served as the gold standard for true stenosis, facilitating the creation of two-dimensional receiver operating characteristic (ROC) curves. The Strandness criteria for ICA were employed in generating these ROC curves to categorize the CCTA data into binary outcomes (yes/no), allowing for the assessment of diagnostic accuracy regarding stenosis. P values less than 0.05 were deemed significant. Interobserver agreement for subjective image quality was quantified using intraclass correlation coefficient (ICC) statistics. Correlations were established using either Kendall's tau or Pearson correlation methods. The diagnostic accuracy for detecting severe stenosis (≥ 50%) was calculated with cardiac catheterization as the reference standard. A ROC curve analysis was performed to determine the cut-off ratio of the RHu between blood and plaque. A Bland-Altman plot was utilized to assess the agreement between CCTA and ICA across different RHu intervals. Additional model specifications and extended statistical methods for incremental analysis, including net reclassification index (NRI), integrated discrimination improvement (IDI), decision curve analysis (DCA), and calibration, were detailed in the supplementary materials.
3 Results
A total of 143 patients met the inclusion criteria, and both CCTA and ICA were successfully performed, yielding diagnostic-quality images. Patient demographics and CCTA characteristics are detailed in Table 1.
Table 1
| Parameters | Evaluation cohort (n = 105) | Validation cohort (n = 38) |
|---|---|---|
| Age(y) | 64.8 ± 9.36 | 68.1 ± 6.94 |
| Male to female ratio | 55: 50 | 28: 10 |
| Height (cm) | 161.4 ± 12.4 | 162.3 ± 11.8 |
| Weight (kg) | 63.6 ± 10.3 | 62.3 ± 9.71 |
| Body mass index (kg/m2) | 32.3 ± 6.1 | 31.7 ± 7.3 |
| Heart rate (beats per minute) | 72.3 ± 15.2 | 71.6 ± 18.2 |
| Agatston score | 729 ± 303 | 736 ± 451 |
| Tube current–time product (mAs) | 250–300 | 250–300 |
| Effective dose (mSv) | ||
| Retrospective ECG gated (n = 73) | 10.9 ± 5.2 | 11.7 ± 6.9 |
| Prospective ECG triggered (n = 70) | 3.2 ± 1.8 | 3.8 ± 2.1 |
| CT dose index volume (mGy) | 28.3 ± 17.5 | 30.7 ± 19.4 |
| Dose-length product (mGy·cm) | 451 ± 361 | 479 ± 392 |
| Pitch | 0.2 | 0.2 |
| No. of mixed plaques | 48 | 15 |
| No. of calcified plaques | 57 | 13 |
Patient demographics and scan parameters.
ECG, electrocardiographic; CT, computed tomography.
3.1 Relationship of the Hu value difference between blood and calcified plaque
The inter-reader agreement for RHu classification among radiologists and cardiologists was k = 0.83 and 0.85, respectively. The RHu demonstrated a strong correlation with the concordance of CCTA and ICA for stenosis evaluation (r = 0.509, p < 0.001, 95% CI). ROC curve analysis revealed a significant area under curve (AUC) for the Hu values ratio between the calcified plaque and blood, indicating its effectiveness in assessing the concordance of CCTA from ICA (Figure 1). The AUC and cut-off values were 0.789 and 0.36, respectively. The sensitivity and specificity were recorded at 86.13% and 82.14%, respectively, while the negative predictive value (NPV) and positive predictive value (PPV) were 79.8% and 87.8%, respectively. The NRI was 0.5, and the IDI was 0.248. The DCA (Supplementary Figure S3) demonstrated that the model incorporating RHu consistently provided a higher net benefit than CCTA alone across high threshold probabilities (> 90%). Calibration analysis (Supplementary Figure S4) revealed a good agreement between predicted and observed risks.
Figure 1
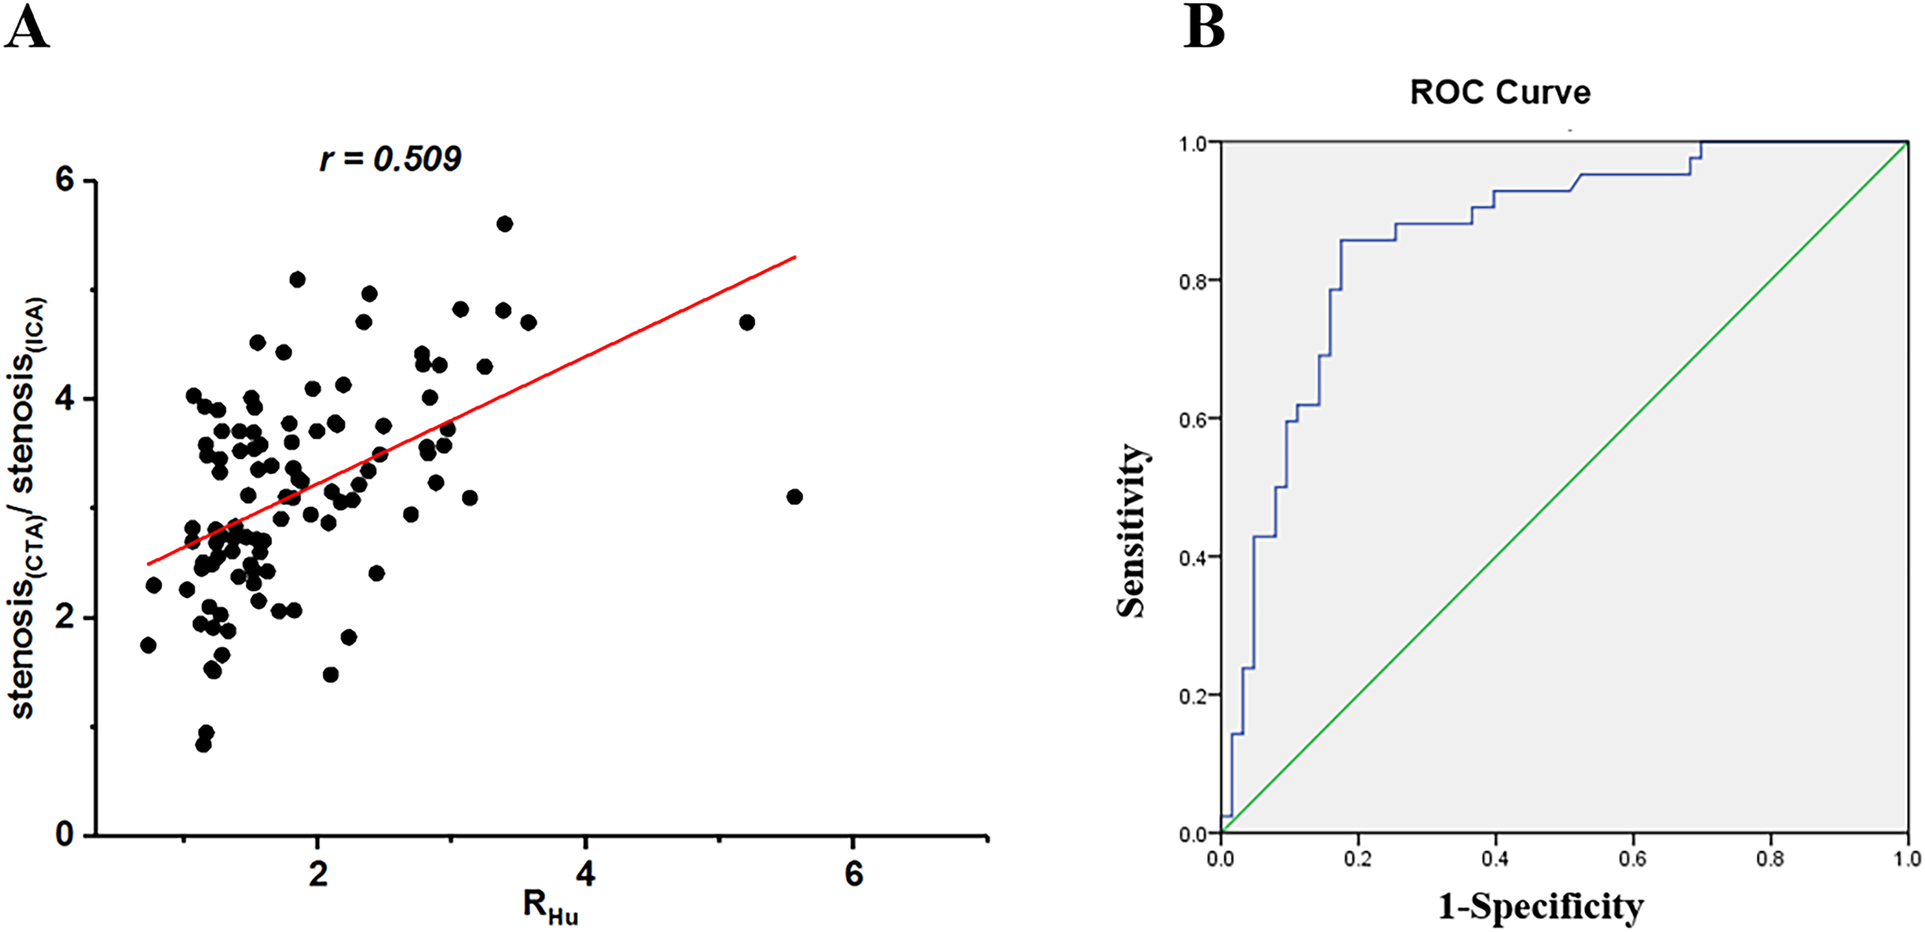
Scatterplots of relationship between ratio of stenosis assessed by coronary CTA versus ICA and Hu values between calcified plaque and blood (RHu) (A) ROC curve analysis was obtained to predictive value of RHu for coronary CTA to detect stenosis degree and determine the cutoff of ratio of RHu(B) CTA, computed tomography angiography; ICA, invasive coronary angiography; ROC, receiver operating characteristic; Hu, hounsfield units; RHu, ratio of HU values between calcified plaque and blood.
3.2 Diagnostic accuracy of CCTA in calcified plaques at RHu < 0.36 vs. RHu > 0.36
The diagnostic performance within calcified of CCTA vs. ICA cross sections is illustrated in Figure 2. The ratios of stenosis degree measured by CCTA compared to ICA were significantly different under the RHu > 0.36 condition vs. the RHu < 0.36 condition [1.37 [0.7–2.48] vs. 1.86 [1.07–5.56], p = 0.02]. The degree of stenosis measured by CCTA showed a stronger correlation (Kendall's tau = 0.512; 95% CI) with ICA in the RHu > 0.36 condition than in the RHu < 0.36 condition (Kendall's tau = 0.463; 95% CI). The Bland-Altman plot indicated that the stenosis evaluation by CCTA had good concordance under the RHu > 0.36 condition but exhibited significant bias under the RHu < 0.36 condition when compared to ICA.
Figure 2
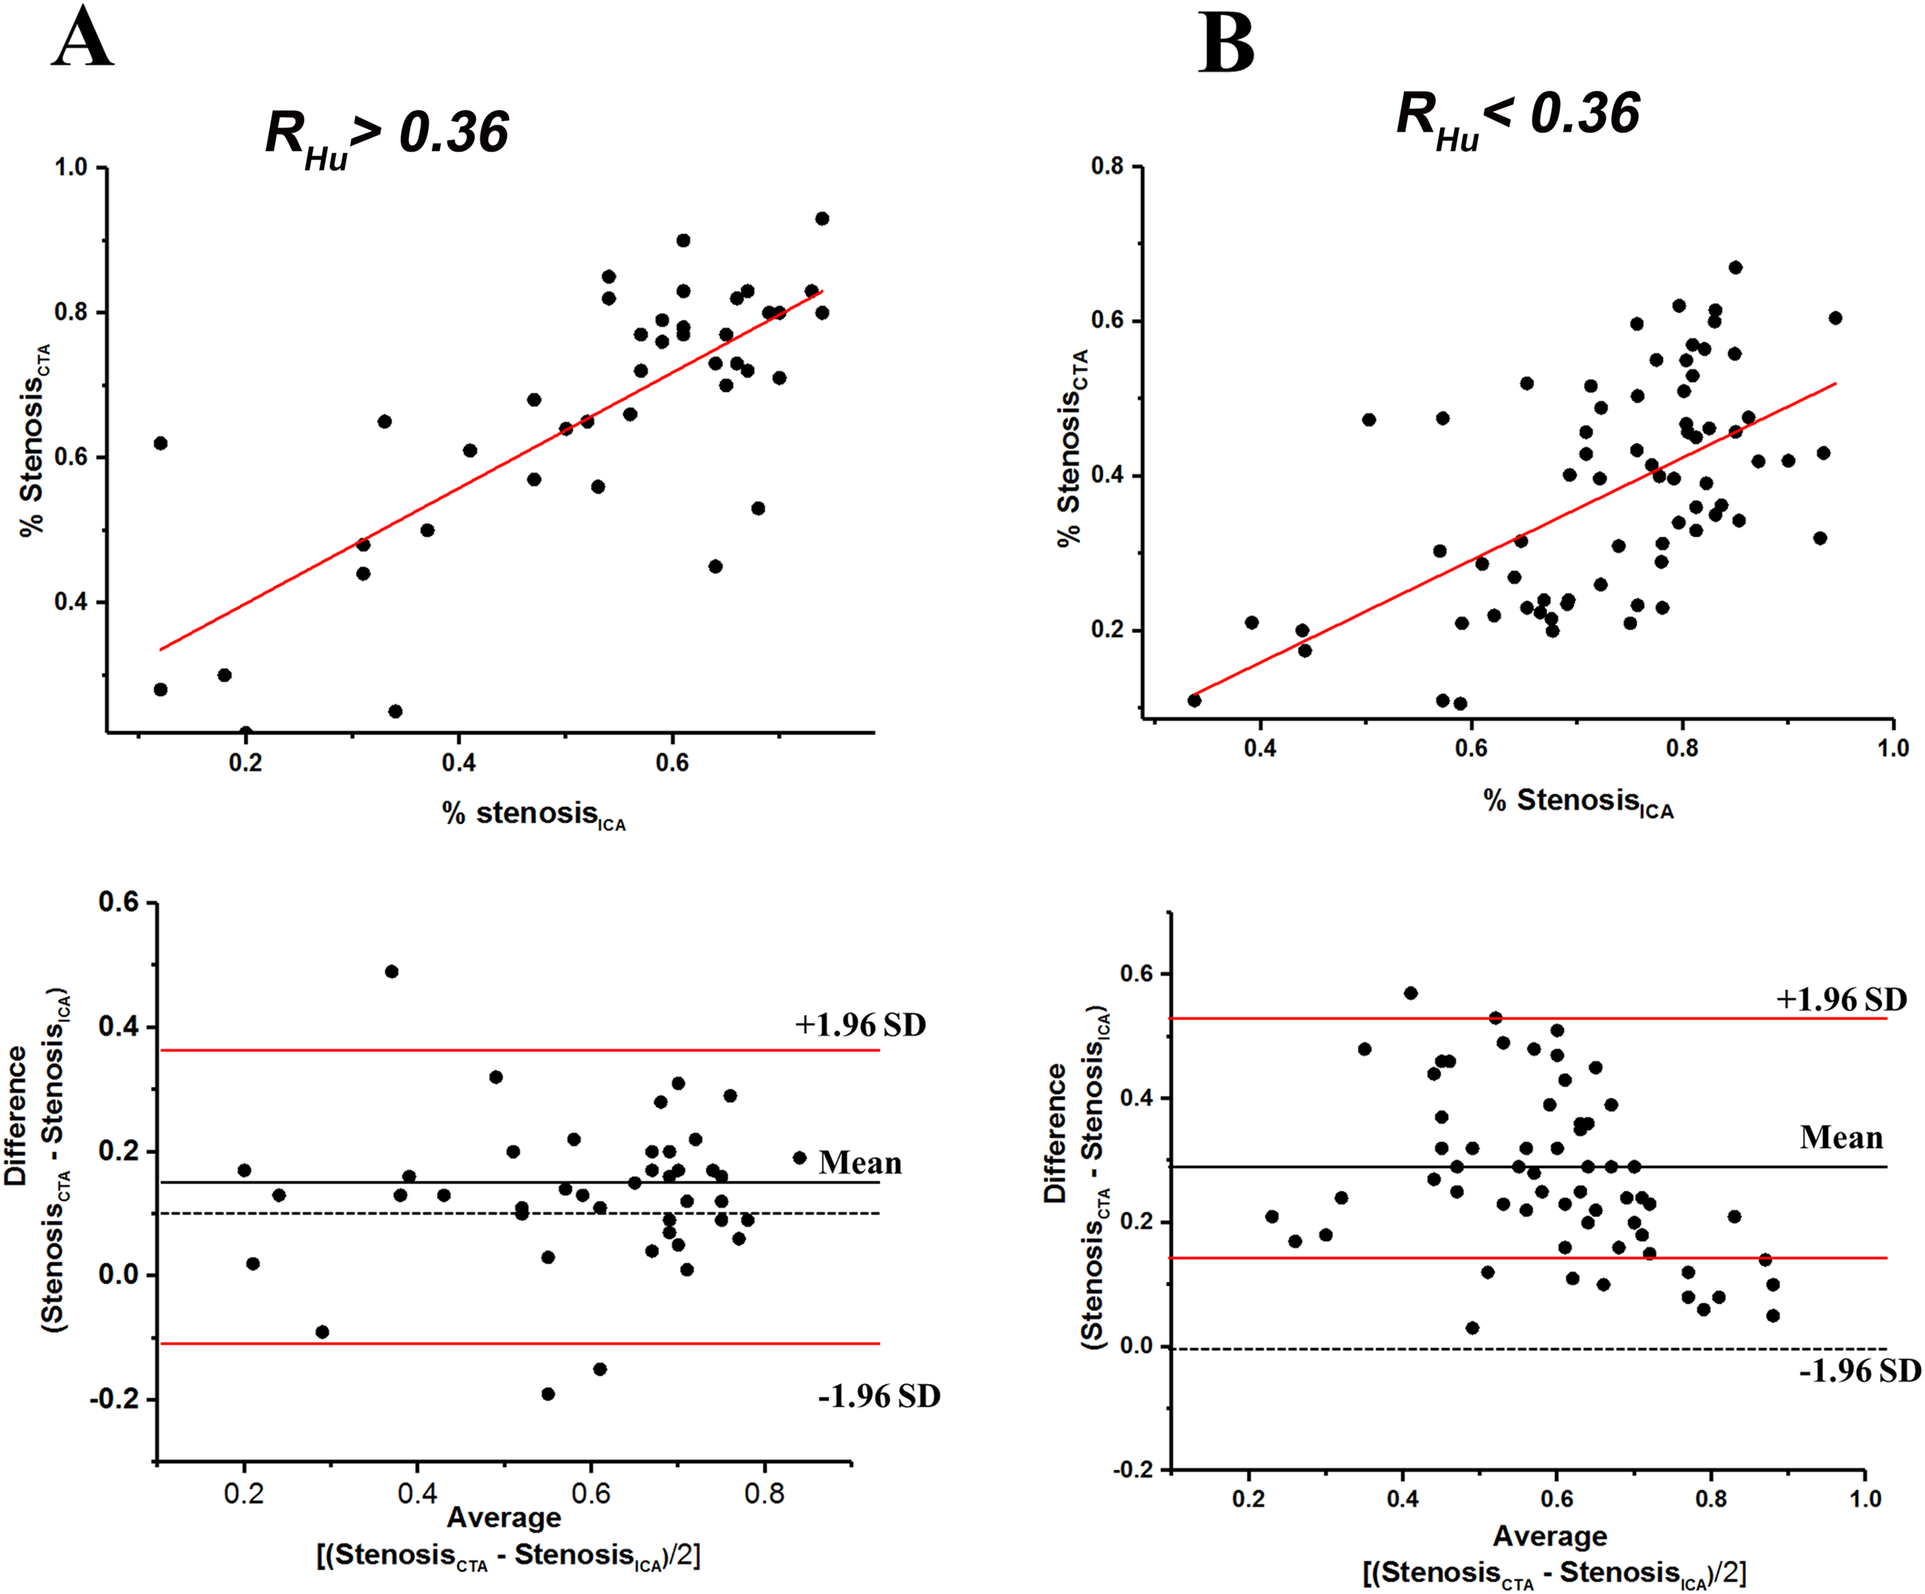
Scatterplots of relationship between stenosis degree (%) measured with coronary CTA and ICA, and bland-altman plots of relative (%) difference between stenosis degree (%) as assessed by coronary CTA versus ICA (reference) within RHu > 0.36 (A), and RHu < 0.36 (B) within the scatterplots the red lines represent fitted regression lines at scatterplots and represent 95% confidence intervals at bland-altman plots. CTA, computed tomography angiography; ICA, invasive coronary angiography; Hu, Hounsfield units; RHu, ratio of HU values between calcified plaque and blood; SD, standard deviation.
Figures 3,4 illustrate examples of calcified plaques as observed in CCTA alongside the corresponding ICA images for two distinct conditions. Specifically, Figures 3A,4A present curved MPR images of the left anterior descending (LAD) artery, which contains a large calcified plaque. Figures 3B,C,4B,C depict a straightened view of the lumen and cross-sectional images of the vessel at the site where the calcified plaque most significantly encroaches upon the lumen. Additionally, Figures 3D,4D display the corresponding ICA images, which indicate whether stenosis resulting from the calcified plaque in the LAD artery occurred.
Figure 3
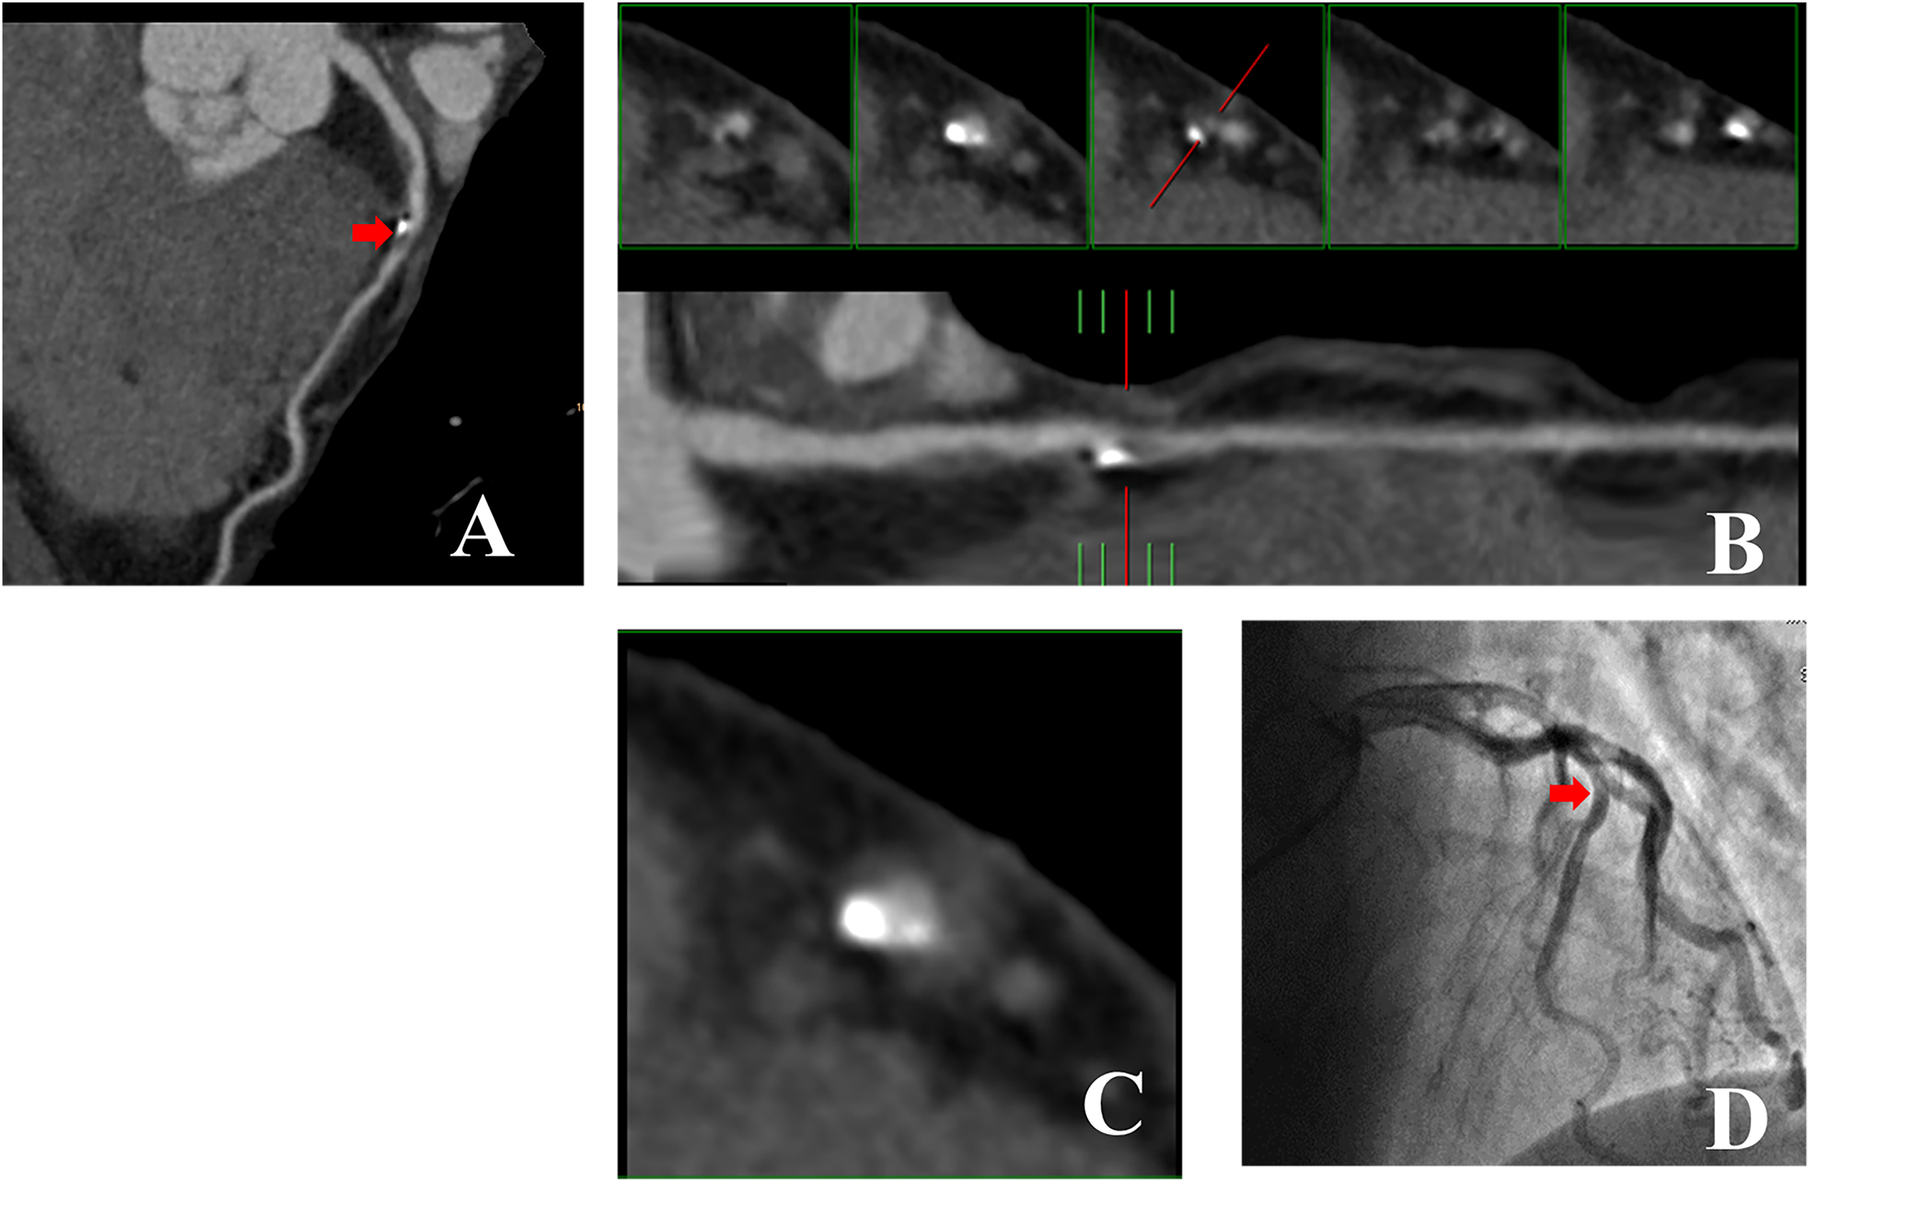
53-year-old man with RHu = 0.30 which CCTA images showed large calcified plaque in LAD artery was no corresponded to ICA. (A) Curved MPR image of LAD artery shows large calcified plaque proximally. (B) Straightened view of LAD artery lumen. The red line in lower panel indicate the cursor, which can be moved along length of vessel by mouse. The interval of the five small panels above was 2 mm. Middle of the panels shows cross section of vessel at location indicated by cursor. Left two small panels show cross sections proximal to cursor location, while two small panels to right show cross sections distal to it. Calcified plaque occupies entire central portion of lumen and was correctly interpreted to be stenosis lesion. (C) Enlarged view of middle small panel showed in (B). (D) ICA image of left coronary artery in right anterior oblique projection shows no obvious LAD artery stenosis at the position demarcated by cursor in (B,C). CCTA, coronary computed tomography angiography; ICA, invasive coronary angiography; RHu, ratio of HU values between calcified plaque and blood; MPR, curved multiplanar reformation; LAD, Left anterior descending.
Figure 4
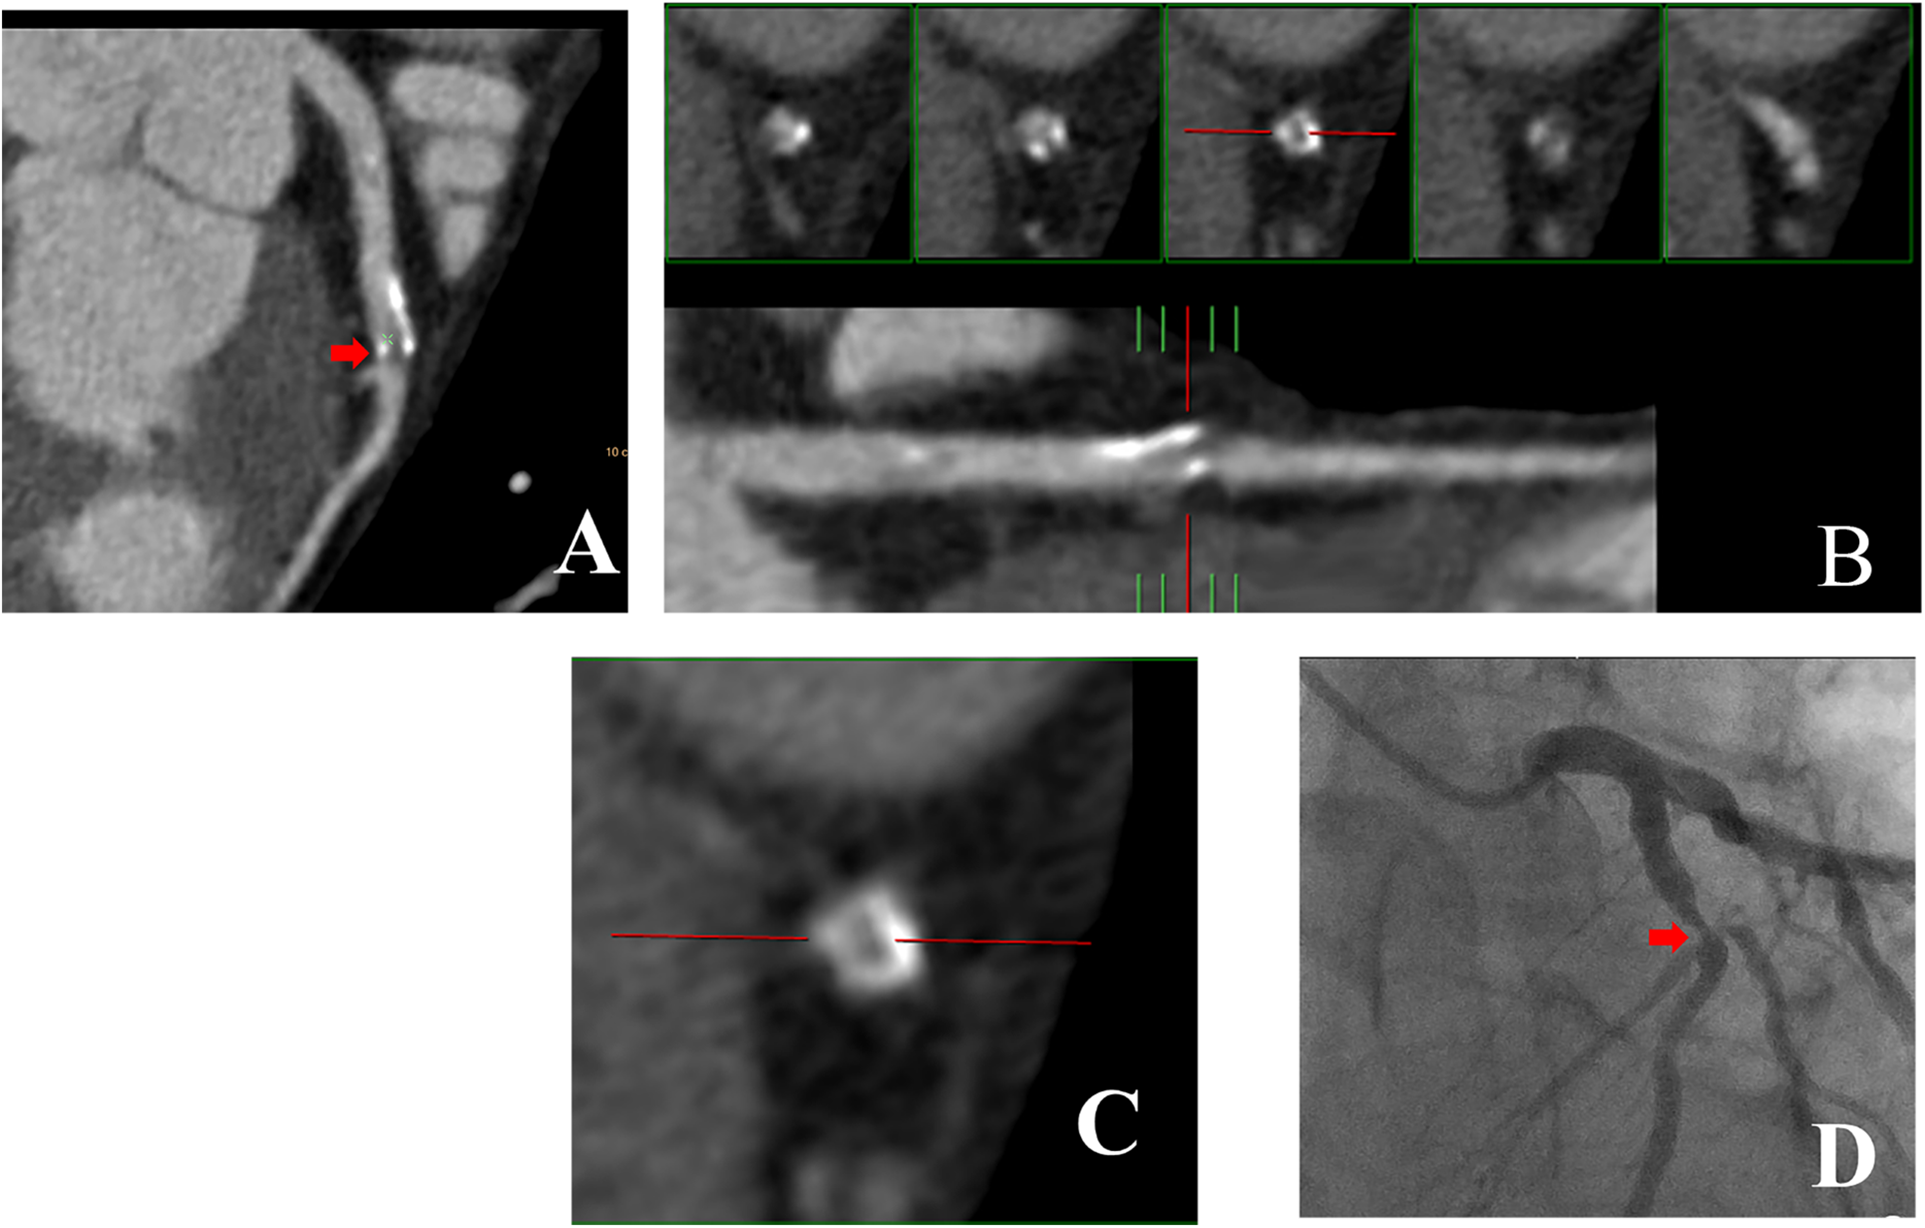
43-year-old man with RHu = 0.38 which CCTA images shown large calcified plaque in LAD artery was corresponded to ICA. (A) Curved MPR image of LAD artery shows large calcified plaque proximally. (B) Straightened view of LAD artery lumen. (C) Enlarged view of middle small panel shown in (B). (D) ICA image of coronary artery in right anterior oblique projection shows obvious LAD artery stenosis at the position demarcated by cursor in (B,C). CCTA, coronary computed tomography angiography; ICA, invasive coronary angiography; RHu, ratio of HU values between calcified plaque and blood; MPR, curved multiplanar reformation; LAD, Left anterior descending.
3.3 In vitro experiment
For the Hu values of the outer tube (“vessel”) and inner tube (“plaque”), we designed two experiments in which one CT number was fixed while the other was varied. In both experiments, the ratios increased, and the diameter measurement was closer to the true diameter (2 mm). In addition, the results also revealed that at a ratio exceeding 0.36, the diameter measurement was reliable (Supplementary Figure S5).
3.4 Validation experiment
The RHu demonstrated a prediction accuracy of 74.0% in the validation cohort. The PPV and NPV were 60.0% and 87.5%, respectively. The peak frequency occurred at RHu = 0.364 or RHu = 0.295 in the patients whose CCTA results were consistent or inconsistent with the ICA results, respectively (Supplementary Figure S6).
4 Discussion
Advances in CT technology, particularly in temporal and spatial resolution, have significantly enhanced the robustness and accuracy of CCTA for the non-invasive assessment of CAD. These enhancements are primarily attributed to reductions in image noise, improvements in diagnostic image quality, and minimized blooming artifacts. Numerous studies have compared the ability of CCTA in the evaluation of coronary artery stenosis caused by calcified plaques against coronary catheterization or intravascular ultrasound (IVUS) (14, 26, 27). Our study utilized a considerable sample size to suggest that assessing the difference in Hu values between blood and adjacent calcified plaques can effectively gauge the accuracy of CCTA for stenosis detection in patients with calcified coronary arteries.
Although single-energy computed tomography (SECT) is considered as the gold standard imaging modality for identifying calcification, the overlap of calcified plaque in radiodensities precludes accurate material composition assessment (28, 29). In general, if the SECT attenuation level of a lesion is below 100 Hu, it was considered as calcification (30). Numerous studies have identified that calcification is the major cause underlying the overestimation of luminal stenosis by CCTA and is the sole factor impacting the diagnostic accuracy of CCTA in comparison to ICA (13, 31). Blooming artifacts can exaggerate the size of calcified plaques and diminish the accuracy of the evaluation of the adjacent coronary artery lumen, resulting in an overestimation of lesion severity (32). Research has demonstrated that the implementation of environmental interventions, such as music and visual stimuli, in the waiting area for CCTA can effectively reduce anxiety and heart rate. This reduction may subsequently lead to a decrease in the use of radiation and beta-blockers, thereby indirectly enhancing image quality (33). Our studies suggest that under specific conditions, the degree of stenosis derived from CCTA can be reliable, thereby enhancing the efficiency of the CCTA process and simplifying the protocol by avoiding unnecessary complex algorithmic calculations.
The 2017 Clinical Guideline of National Institute for Health and Care Excellences (NICE) suggested that detection of large (≥ 50%) stenosis derived from non-invasive modalities was the reference standard of clinical decision-making for cardiac catheterization (34). In a multicenter trial, the NPV of CCTA for the detection of coronary diameter stenosis greater than 50% was 99% (35). In our study, we speculated that the RHu could serve as a predictive parameter to assess the accuracy of the CCTA in detecting ≥50% stenosis. In practice, we used the ICA results as the golden standard of stenosis detection, and categorize 50% stenosis as a threshold value in the two-dimensional ROC analysis of RHu. This conclusion is further supported by the AUC values (0.789). Additionally, Spearman's correlation coefficient for the percentage of diameter stenosis vs. RHu corroborates this finding. The increasing calcium burden is associated with reduced CCTA diagnostic accuracy, which is consistent with the findings of the cited 2024 study comparing CCTA and ICA (36). Our stratified results support this trend, indicating that when the Agatston scores ≥1,000, sensitivity reaches 100% while specificity drops to 52.9%. Notably, although specificity decreases slightly, the RHu retains its effective discriminatory capability.
The Hu scale in a voxel is proportional to the linear attenuation coefficient μ(E), which represents the rate of attenuation of a monoenergetic beam as it passes through a given material. This coefficient is influenced by the chemical composition, the photon energies interacting with the object, and the mass density of the material (37, 38). An increase in the iodine delivery rate (IDR), in conjunction with the x-ray tube voltage, will alter the Hu value of blood (39). Compelling evidence suggests that during the dynamics of cardiovascular contrast medium, increasing the IDR through faster injection flow rates and/or a higher iodine concentration in the contrast medium (CM) results in a diminished enhancement magnitude of blood, evidenced by a decrease in the Hu value (40). However, the reduction in Hu value associated with CM concentration has minimal impact on high-atomic-number materials (e.g., calcified plaque) (41). Therefore, it is feasible to adjust the Hu value by manipulating the IDR and/or utilizing higher concentrations or volumes of contrast media (39). Nevertheless, there is growing concern regarding increased radiation exposure in clinical practice, as it can elevate the renal burden, particularly in the elderly population and individuals with underlying diseases and risk factors. In the in vivo experiment conducted in our study, the radiation dose required to adjust the IDR to make RHu exceed 0.36 was <14 mSv, which does not exceed the recommended safety dose as outlined in the American College of Radiology (ACR) white paper on radiation dose in medicine (42). In a previous in-house study involving a sample size of 120,822, they found that the incidence of adverse drug reactions following non-ionic iodinated contrast media (NICM) delivery was extremely low in patients, irrespective of their underlying conditions (43). The total dose of iohexol-350 administered was approximately 0.8–1.0 ml/kg of body weight, which is well below the FDA-recommended dose for elderly patients with pre-existing renal disease. Furthermore, considering that this method may avoid unnecessary ICA examinations, the total radiation dose can be significantly reduced.
As a pilot study, our research is a single-center investigation focusing on a specific cohort. It is important to note that the difference in patient conditions and intrascanner variation in CT number measurements was not evaluated. Previous reports indicate that measured CT numbers exhibit variability among manufacturers (28). Another limitation of our study is the absence of an intrinsically different imaging modality (such as IVUS) as an external reference standard to validate our volumetric measurements of coronary artery calcifications. Given our retrospective design, invasive intravascular imaging was unavailable in most patients. We have added a prospective plan to compare RHu against IVUS/OCT-derived lumen area and calcium arc/length in future work. Additionally, the conduction of CTA without nitroglycerin, which is strongly recommended to enhance both image quality and diagnostic confidence, represents another limitation.
5 Conclusions
In summary, our study indicates that the Hu difference (RHu) between blood and calcified plaques is a significant factor influencing the detection of stenotic vessels with calcified plaques using CCTA, with a cutoff value of 0.36. The RHu analysis is expected to enhance the effectiveness of CCTA in supporting clinical decision-making for ICA in patients with CAD. We also plan to conduct follow-up multi-center studies to further validate our findings.
Statements
Data availability statement
The raw data supporting the conclusions of this article will be made available by the authors, without undue reservation.
Ethics statement
The studies involving humans were approved by The Ethics Committee of the Army Medical Center of the PLA (No. 2022-71). The studies were conducted in accordance with the local legislation and institutional requirements. The participants provided their written informed consent to participate in this study. Written informed consent was obtained from the individual(s) for the publication of any potentially identifiable images or data included in this article.
Author contributions
QR: Conceptualization, Formal analysis, Writing – original draft. DC: Methodology, Software, Writing – original draft. HZ: Data curation, Validation, Writing – review & editing. LZ: Formal analysis, Project administration, Writing – review & editing.
Funding
The author(s) declare that financial support was received for the research and/or publication of this article. This work was supported by the Fund of Chongqing Clinical Research Centre of Imaging and Nuclear Medicine (CSTC2015YFPT-gcjsyjzx0175).
Conflict of interest
The authors declare that the research was conducted in the absence of any commercial or financial relationships that could be construed as a potential conflict of interest.
Generative AI statement
The author(s) declare that no Generative AI was used in the creation of this manuscript.
Any alternative text (alt text) provided alongside figures in this article has been generated by Frontiers with the support of artificial intelligence and reasonable efforts have been made to ensure accuracy, including review by the authors wherever possible. If you identify any issue please contact us.
Publisher’s note
All claims expressed in this article are solely those of the authors and do not necessarily represent those of their affiliated organizations, or those of the publisher, the editors and the reviewers. Any product that may be evaluated in this article, or claim that may be made by its manufacturer, is not guaranteed or endorsed by the publisher.
Supplementary material
The Supplementary Material for this article can be found online at: https://www.frontiersin.org/articles/10.3389/fcvm.2025.1570517/full#supplementary-material
References
1.
Benjamin EJ Blaha MJ Chiuve SE Cushman M Das SR Deo R et al Heart disease and stroke statistics-2017 update: a report from the American Heart Association. Circulation. (2017) 135(10):e146–603. 10.1161/cir.0000000000000485
2.
Bentzon JF Otsuka F Virmani R Falk E . Mechanisms of plaque formation and rupture. Circ Res. (2014) 114(12):1852–66. 10.1161/circresaha.114.302721
3.
Ramakrishna G Breen JF Mulvagh SL McCully RB Pellikka PA . Relationship between coronary artery calcification detected by electron-beam computed tomography and abnormal stress echocardiography: association and prognostic implications. J Am Coll Cardiol. (2006) 48(10):2125–31. 10.1016/j.jacc.2006.04.105
4.
Møller PL Rohde PD Dahl JN Rasmussen LD Nissen L Schmidt SE et al Predicting the presence of coronary plaques featuring high-risk characteristics using polygenic risk scores and targeted proteomics in patients with suspected coronary artery disease. Genome Med. (2024) 16(1):40. 10.1186/s13073-024-01313-8
5.
Hollenberg EJ Lin F Blaha MJ Budoff MJ van den Hoogen IJ Gianni U et al Relationship between coronary artery calcium and atherosclerosis progression among patients with suspected coronary artery disease. JACC Cardiovasc Imaging. (2022) 15(6):1063–74. 10.1016/j.jcmg.2021.12.015
6.
Van Mieghem CAG . CT as gatekeeper of invasive coronary angiography in patients with suspected cad. Cardiovasc Diagn Ther. (2017) 7(2):189–95. 10.21037/cdt.2017.04.03
7.
Dewey M Zimmermann E Deissenrieder F Laule M Dübel HP Schlattmann P et al Noninvasive coronary angiography by 320-row computed tomography with lower radiation exposure and maintained diagnostic accuracy: comparison of results with cardiac catheterization in a head-to-head pilot investigation. Circulation. (2009) 120(10):867–75. 10.1161/circulationaha.109.859280
8.
Hoffmann U Nagurney JT Moselewski F Pena A Ferencik M Chae CU et al Coronary multidetector computed tomography in the assessment of patients with acute chest pain. Circulation. (2006) 114(21):2251–60. 10.1161/circulationaha.106.634808
9.
Leber AW Becker A Knez A von Ziegler F Sirol M Nikolaou K et al Accuracy of 64-slice computed tomography to classify and quantify plaque volumes in the proximal coronary system: a comparative study using intravascular ultrasound. J Am Coll Cardiol. (2006) 47(3):672–7. 10.1016/j.jacc.2005.10.058
10.
Ayad SW ElSharkawy EM ElTahan SM Sobhy MA Laymouna RH . The role of 64/128-slice multidetector computed tomography to assess the progression of coronary atherosclerosis. Clin Med Insights Cardiol. (2015) 9:47–52. 10.4137/cmc.S20606
11.
Cho I Chang HJ Ó Hartaigh B Shin S Sung JM Lin FY et al Incremental prognostic utility of coronary CT angiography for asymptomatic patients based upon extent and severity of coronary artery calcium: results from the COronary CT angiography evaluation for clinical outcomes international multicenter (CONFIRM) study. Eur Heart J. (2015) 36(8):501–8. 10.1093/eurheartj/ehu358
12.
Vavere AL Arbab-Zadeh A Rochitte CE Dewey M Niinuma H Gottlieb I et al Coronary artery stenoses: accuracy of 64-detector row CT angiography in segments with mild, moderate, or severe calcification–a subanalysis of the CORE-64 trial. Radiology. (2011) 261(1):100–8. 10.1148/radiol.11110537
13.
Hoffmann U Moselewski F Cury RC Ferencik M Jang IK Diaz LJ et al Predictive value of 16-slice multidetector spiral computed tomography to detect significant obstructive coronary artery disease in patients at high risk for coronary artery disease: patient-versus segment-based analysis. Circulation. (2004) 110(17):2638–43. 10.1161/01.Cir.0000145614.07427.9f
14.
Kruk M Noll D Achenbach S Mintz GS Pręgowski J Kaczmarska E et al Impact of coronary artery calcium characteristics on accuracy of CT angiography. JACC Cardiovasc Imaging. (2014) 7(1):49–58. 10.1016/j.jcmg.2013.07.013
15.
Zhang S Levin DC Halpern EJ Fischman D Savage M Walinsky P . Accuracy of MDCT in assessing the degree of stenosis caused by calcified coronary artery plaques. AJR Am J Roentgenol. (2008) 191(6):1676–83. 10.2214/ajr.07.4026
16.
Barrett JF Keat N . Artifacts in CT: recognition and avoidance. Radiographics. (2004) 24(6):1679–91. 10.1148/rg.246045065
17.
Park HS Chung YE Seo JK . Computed tomographic beam-hardening artefacts: mathematical characterization and analysis. Philos Trans A Math Phys Eng Sci. (2015) 373(2043):20140388. 10.1098/rsta.2014.0388
18.
Zheng M Wei M Wen D Zhao H Liu Y Li J et al Transluminal attenuation gradient in coronary computed tomography angiography for determining stenosis severity of calcified coronary artery: a primary study with dual-source CT. Eur Radiol. (2015) 25(5):1219–28. 10.1007/s00330-014-3519-9
19.
Renker M Nance JW Jr Schoepf UJ O'Brien TX Zwerner PL Meyer M et al Evaluation of heavily calcified vessels with coronary CT angiography: comparison of iterative and filtered back projection image reconstruction. Radiology. (2011) 260(2):390–9. 10.1148/radiol.11103574
20.
Thibault JB Sauer KD Bouman CA Hsieh J . A three-dimensional statistical approach to improved image quality for multislice helical CT. Med Phys. (2007) 34(11):4526–44. 10.1118/1.2789499
21.
Agatston AS Janowitz WR Hildner FJ Zusmer NR Viamonte M Jr Detrano R . Quantification of coronary artery calcium using ultrafast computed tomography. J Am Coll Cardiol. (1990) 15(4):827–32. 10.1016/0735-1097(90)90282-t
22.
Austen WG Edwards JE Frye RL Gensini GG Gott VL Griffith LS et al A reporting system on patients evaluated for coronary artery disease. Report of the ad hoc committee for grading of coronary artery disease, council on cardiovascular surgery, American Heart Association. Circulation. (1975) 51(4 Suppl):5–40. 10.1161/01.cir.51.4.5
23.
Barnett HJ Taylor DW Eliasziw M Fox AJ Ferguson GG Haynes RB et al Benefit of carotid endarterectomy in patients with symptomatic moderate or severe stenosis. North American symptomatic carotid endarterectomy trial collaborators. N Engl J Med. (1998) 339(20):1415–25. 10.1056/nejm199811123392002
24.
Pontone G Bertella E Mushtaq S Loguercio M Cortinovis S Baggiano A et al Coronary artery disease: diagnostic accuracy of CT coronary angiography–a comparison of high and standard spatial resolution scanning. Radiology. (2014) 271(3):688–94. 10.1148/radiol.13130909
25.
Baratloo A Hosseini M Negida A El Ashal G . Part 1: simple definition and calculation of accuracy, sensitivity and specificity. Emerg (Tehran). (2015) 3(2):48–9. 10.22037/emergency.v3i2.8154
26.
Hamon M Biondi-Zoccai GG Malagutti P Agostoni P Morello R Valgimigli M et al Diagnostic performance of multislice spiral computed tomography of coronary arteries as compared with conventional invasive coronary angiography: a meta-analysis. J Am Coll Cardiol. (2006) 48(9):1896–910. 10.1016/j.jacc.2006.08.028
27.
Fischer C Hulten E Belur P Smith R Voros S Villines TC . Coronary CT angiography versus intravascular ultrasound for estimation of coronary stenosis and atherosclerotic plaque burden: a meta-analysis. J Cardiovasc Comput Tomogr. (2013) 7(4):256–66. 10.1016/j.jcct.2013.08.006
28.
Cropp RJ Seslija P Tso D Thakur Y . Scanner and kVp dependence of measured CT numbers in the ACR CT phantom. J Appl Clin Med Phys. (2013) 14(6):4417. 10.1120/jacmp.v14i6.4417
29.
Nute JL Le Roux L Chandler AG Baladandayuthapani V Schellingerhout D Cody DD . Differentiation of low-attenuation intracranial hemorrhage and calcification using dual-energy computed tomography in a phantom system. Invest Radiol. (2015) 50(1):9–16. 10.1097/rli.0000000000000089
30.
Go JL Zee CS . Unique CT imaging advantages. Hemorrhage and calcification. Neuroimaging Clin N Am. (1998) 8(3):541–58.
31.
Brodoefel H Burgstahler C Tsiflikas I Reimann A Schroeder S Claussen CD et al Dual-source CT: effect of heart rate, heart rate variability, and calcification on image quality and diagnostic accuracy. Radiology. (2008) 247(2):346–55. 10.1148/radiol.2472070906
32.
Leber AW Knez A von Ziegler F Becker A Nikolaou K Paul S et al Quantification of obstructive and nonobstructive coronary lesions by 64-slice computed tomography: a comparative study with quantitative coronary angiography and intravascular ultrasound. J Am Coll Cardiol. (2005) 46(1):147–54. 10.1016/j.jacc.2005.03.071
33.
Tekinhatun M Alver KH Akbudak İ Turmak M Çavdar E Deniz MA . Influence of visual objects and music on anxiety levels and imaging process in patients undergoing coronary CT angiography. Eur Radiol. (2025) 35(10):6323–35. 10.1007/s00330-025-11614-0
34.
Moss AJ Williams MC Newby DE Nicol ED . The updated NICE guidelines: cardiac CT as the first-line test for coronary artery disease. Curr Cardiovasc Imaging Rep. (2017) 10(5):15. 10.1007/s12410-017-9412-6
35.
Budoff MJ Dowe D Jollis JG Gitter M Sutherland J Halamert E et al Diagnostic performance of 64-multidetector row coronary computed tomographic angiography for evaluation of coronary artery stenosis in individuals without known coronary artery disease: results from the prospective multicenter ACCURACY (assessment by coronary computed tomographic angiography of individuals undergoing invasive coronary angiography) trial. J Am Coll Cardiol. (2008) 52(21):1724–32. 10.1016/j.jacc.2008.07.031
36.
Tekinhatun M Akbudak İ Özbek M Turmak M . Comparison of coronary CT angiography and invasive coronary angiography results. Ir J Med Sci. (2024) 193(5):2239–48. 10.1007/s11845-024-03745-y
37.
Haghighi RR Chatterjee S Vyas A Kumar P Thulkar S . X-ray attenuation coefficient of mixtures: inputs for dual-energy CT. Med Phys. (2011) 38(10):5270–9. 10.1118/1.3626572
38.
McCollough CH Leng S Yu L Fletcher JG . Dual- and multi-energy CT: principles, technical approaches, and clinical applications. Radiology. (2015) 276(3):637–53. 10.1148/radiol.2015142631
39.
Faggioni L Gabelloni M . Iodine concentration and optimization in computed tomography angiography: current issues. Invest Radiol. (2016) 51(12):816–22. 10.1097/rli.0000000000000283
40.
Hu X Ma L Zhang J Li Z Shen Y Hu D . Use of pulmonary CT angiography with low tube voltage and low-iodine-concentration contrast agent to diagnose pulmonary embolism. Sci Rep. (2017) 7(1):12741. 10.1038/s41598-017-13077-w
41.
Kawahara D Ozawa S Yokomachi K Tanaka S Higaki T Fujioka C et al Accuracy of the raw-data-based effective atomic numbers and monochromatic CT numbers for contrast medium with a dual-energy CT technique. Br J Radiol. (2018) 91(1082):20170524. 10.1259/bjr.20170524
42.
Amis ES J Butler PF . ACR white paper on radiation dose in medicine: three years later. J Am Coll Radiol. (2010) 7(11):865–70. 10.1016/j.jacr.2010.04.006
43.
Li X Liu H Zhao L Liu J Cai L Liu L et al Clinical observation of adverse drug reactions to non-ionic iodinated contrast media in population with underlying diseases and risk factors. Br J Radiol. (2017) 90(1070):20160729. 10.1259/bjr.20160729
Summary
Keywords
computed tomography angiography, invasive coronary angiography, calcified plaque, coronary artery disease, coronary stenosis
Citation
Ran Q, Chen D, Zhang H and Zhang L (2025) When can coronary computed tomography angiography in patients with calcified plaque be accurate?. Front. Cardiovasc. Med. 12:1570517. doi: 10.3389/fcvm.2025.1570517
Received
03 February 2025
Accepted
03 September 2025
Published
22 September 2025
Volume
12 - 2025
Edited by
Joshua D. Hutcheson, Florida International University, United States
Reviewed by
Akhmetzhan Galimzhanov, Semey State Medical University, Kazakhstan
Muhammed Tekinhatun, Dicle University, Türkiye
Updates
Copyright
© 2025 Ran, Chen, Zhang and Zhang.
This is an open-access article distributed under the terms of the Creative Commons Attribution License (CC BY). The use, distribution or reproduction in other forums is permitted, provided the original author(s) and the copyright owner(s) are credited and that the original publication in this journal is cited, in accordance with accepted academic practice. No use, distribution or reproduction is permitted which does not comply with these terms.
* Correspondence: Huiru Zhang zhanghuiru@tmmu.edu.cn Letian Zhang zletian1982@tmmu.edu.cn
†These authors have contributed equally to this work
Disclaimer
All claims expressed in this article are solely those of the authors and do not necessarily represent those of their affiliated organizations, or those of the publisher, the editors and the reviewers. Any product that may be evaluated in this article or claim that may be made by its manufacturer is not guaranteed or endorsed by the publisher.