Abstract
Introduction:
The roles of residual cholesterol (RC), red cell distribution width (RDW), and body mass index (BMI) in premature acute coronary syndrome (ACS) remain underexplored.
Aim:
This study aimed to investigate the significance of RC, RDW, and BMI in the diagnosis of premature ACS.
Methods:
A retrospective analysis was conducted on 418 ACS patients at Binzhou Medical University Hospital, categorized into early-onset and late-onset groups. Spearman correlation and multivariate logistic regression were used to evaluate associations. Receiver operating characteristic (ROC) curves assessed the diagnostic performance of RC, RDW, BMI, and their combination.
Results:
RC and BMI were positively correlated with premature ACS, while RDW was negatively correlated. All three were identified as independent risk factors. A nomogram model highlighted RC as the strongest predictor. The combined model significantly improved diagnostic accuracy, achieving an area under the curve (AUC) of 0.941.
Conclusion:
RC, RDW, and BMI are independently associated with premature ACS, potentially reflecting inflammatory and metabolic mechanisms. Their combined use enhances diagnostic precision and may support early risk stratification in clinical practice.
Introduction
Acute coronary syndrome (ACS) encompasses a group of clinical conditions caused by acute myocardial ischemia, including ST-segment elevation myocardial infarction (STEMI), non-ST-segment elevation myocardial infarction (NSTEMI), and unstable angina (UA). The underlying pathology typically involves atherosclerotic plaque rupture, erosion, or dissolution, followed by acute coronary thrombosis formation (1, 2). ACS is frequently the initial manifestation of cardiovascular disease and remains a leading cause of mortality among cardiovascular patients, posing a serious threat to public health (3). While the pathogenesis of ACS is multifactorial, key contributors include inflammation, dyslipidemia, and oxidative stress (4). Currently, early recognition and risk prediction of ACS rely on traditional clinical tools such as electrocardiography, serum biomarkers, and coronary imaging. However, these methods often lack sensitivity and specificity in diagnosing premature ACS, presenting a critical clinical challenge.
In recent studies, residual cholesterol (RC), red blood cell distribution width (RDW), and body mass index (BMI) have emerged as important cardiovascular biomarkers, each playing a distinct role in the pathophysiology of ACS (5–7). RC, representing cholesterol content in very-low-density and intermediate-density lipoproteins (VLDL and IDL), remains elevated despite controlled low-density lipoprotein cholesterol (LDL-C) levels. It is relevant in both fasting and non-fasting states and plays a critical role in atherosclerotic cardiovascular disease progression (8, 9). Elevated RC is known to induce chronic low-grade inflammation and is considered an independent risk factor, separate from traditional lipoproteins such as LDL-C and ApoB (10). RDW, which reflects variability in red blood cell volume, has been linked to inflammation, apoptosis, and tissue fibrosis (11). In patients with type 2 diabetes and ACS, elevated RDW not only indicates disease severity (12) but also correlates with increased cardiovascular and all-cause mortality (13). Meanwhile, BMI remains a key marker of obesity—a growing concern globally. Importantly, a recent study demonstrated that both triglyceride and BMI were independent predictors of small dense LDL-cholesterol—a key atherogenic lipid fraction—in ACS patients, and their combination significantly elevated sdLDL-C levels (14). These findings support the integration of lipid and metabolic markers for enhanced cardiovascular risk stratification. Furthermore, recent research has shown that integrated models combining inflammatory and lipid biomarkers such as RDW, BMI, and LDL-C/HDL-C outperform individual markers in predicting coronary lesion severity in ACS patients (15), further justifying a multi-indicator approach.
Despite substantial progress in understanding the individual roles of these biomarkers in cardiovascular disease, their specific contributions to premature ACS are not well established. Furthermore, existing studies largely focus on individual biomarkers rather than integrating multiple indicators into a composite model. This presents a critical gap in early diagnostic strategies. Although RC, RDW, and BMI each contribute to ACS pathogenesis and may interact biologically, their combined diagnostic potential in premature ACS has yet to be fully explored. Traditional diagnostic models, which rely heavily on symptomatic and imaging findings, often overlook the predictive value of such emerging biomarkers. This study aims to address that gap by investigating the independent and combined diagnostic value of RC, RDW, and BMI in premature ACS. These three biomarkers are not only clinically accessible and cost-effective but also reflect key physiological domains: lipid metabolism, systemic inflammation, and adiposity. By integrating them into a multifactorial predictive model, this study seeks to enhance early risk identification of premature ACS. Unlike previous research that focuses on each marker in isolation, this study evaluates their synergistic potential to improve diagnostic accuracy.
We conducted a retrospective analysis of ACS patient data from the cardiology department of Binzhou Medical University Hospital. Using advanced statistical approaches including Spearman correlation analysis, logistic regression, and receiver operating characteristic (ROC) curve analysis, we aim to develop a multifactorial model for early prediction of premature ACS. Scientifically, this study contributes to a growing body of evidence supporting the combined use of emerging biomarkers in cardiovascular risk stratification. Clinically, it offers a practical and theoretically grounded approach for early diagnosis and intervention in premature ACS, with implications for improved outcomes. Moreover, the findings may serve as a reference for integrating big data analytics and precision medicine in cardiovascular early-warning systems.
Materials and methods
Study design
This single-center retrospective cohort study aimed to evaluate the independent and combined diagnostic value of RC, RDW, and BMI in predicting premature ACS. Data were collected from electronic medical records of patients admitted to the Cardiology Department of Binzhou Medical University Hospital between September 2021 and March 2023. The study was based on the hypothesis that RC reflects lipid-related inflammation, RDW indicates systemic inflammatory status, and BMI reflects metabolic dysregulation—factors that may collectively contribute to premature ACS. Group comparisons, multivariate analyses, and receiver operating characteristic (ROC) curve evaluations were used to validate this hypothesis. To ensure data quality and reliability, strict quality control procedures were implemented at each stage. All laboratory parameters, including RC and RDW, were measured using standardized protocols by certified clinical laboratory technicians. Equipment calibration and internal quality control checks were performed daily in accordance with hospital regulations. BMI was calculated from height and weight measured by trained nursing staff using standardized equipment. All data extracted from the hospital electronic medical record system underwent double-entry verification by two independent researchers to minimize manual error. Inconsistencies were resolved through cross-checking with original records. Prior to statistical analysis, data were screened for outliers, missing values, and normality assumptions. Cases with incomplete or ambiguous data were excluded based on pre-defined criteria.
This study complied with the Declaration of Helsinki. Written informed consent was obtained from all participants or from a legal guardian in cases where patients were unable to consent. All data were anonymized and analyzed solely for research purposes. Data were stored on an encrypted server and destroyed upon study completion. The study protocol was approved by the Ethics Committee of Binzhou Medical University Hospital (Approval No. KT-01).
Study population
Eligible participants were hospitalized patients diagnosed with ACS according to the 2023 European Society of Cardiology (ESC) guidelines. Diagnosis was confirmed by coronary angiography, including STEMI, NSTEMI, and UA. Patients were categorized into early-onset (<60 years) and late-onset (≥60 years) groups, based on the established age threshold for premature coronary artery disease (16). Exclusion criteria included recent use of lipid-lowering medications, severe hepatic or renal dysfunction, anemia, active infections, and other conditions that could affect the study parameters. Pregnant or breastfeeding women and patients with incomplete data were also excluded.
Sample size description
A total of 454 patients diagnosed with ACS were admitted to the Cardiology Department of Binzhou Medical University Hospital between September 2021 and March 2023. After excluding 36 patients due to missing critical clinical data or failure to meet inclusion criteria, 418 patients were included in the final analysis. These were categorized into an early-onset group (<60 years; n = 196) and a late-onset group (≥60 years; n = 222) (Figure 1). The sample size was determined based on the number of eligible patients during the study period and prior statistical calculations, ensuring sufficient statistical power (power >80%).
Figure 1
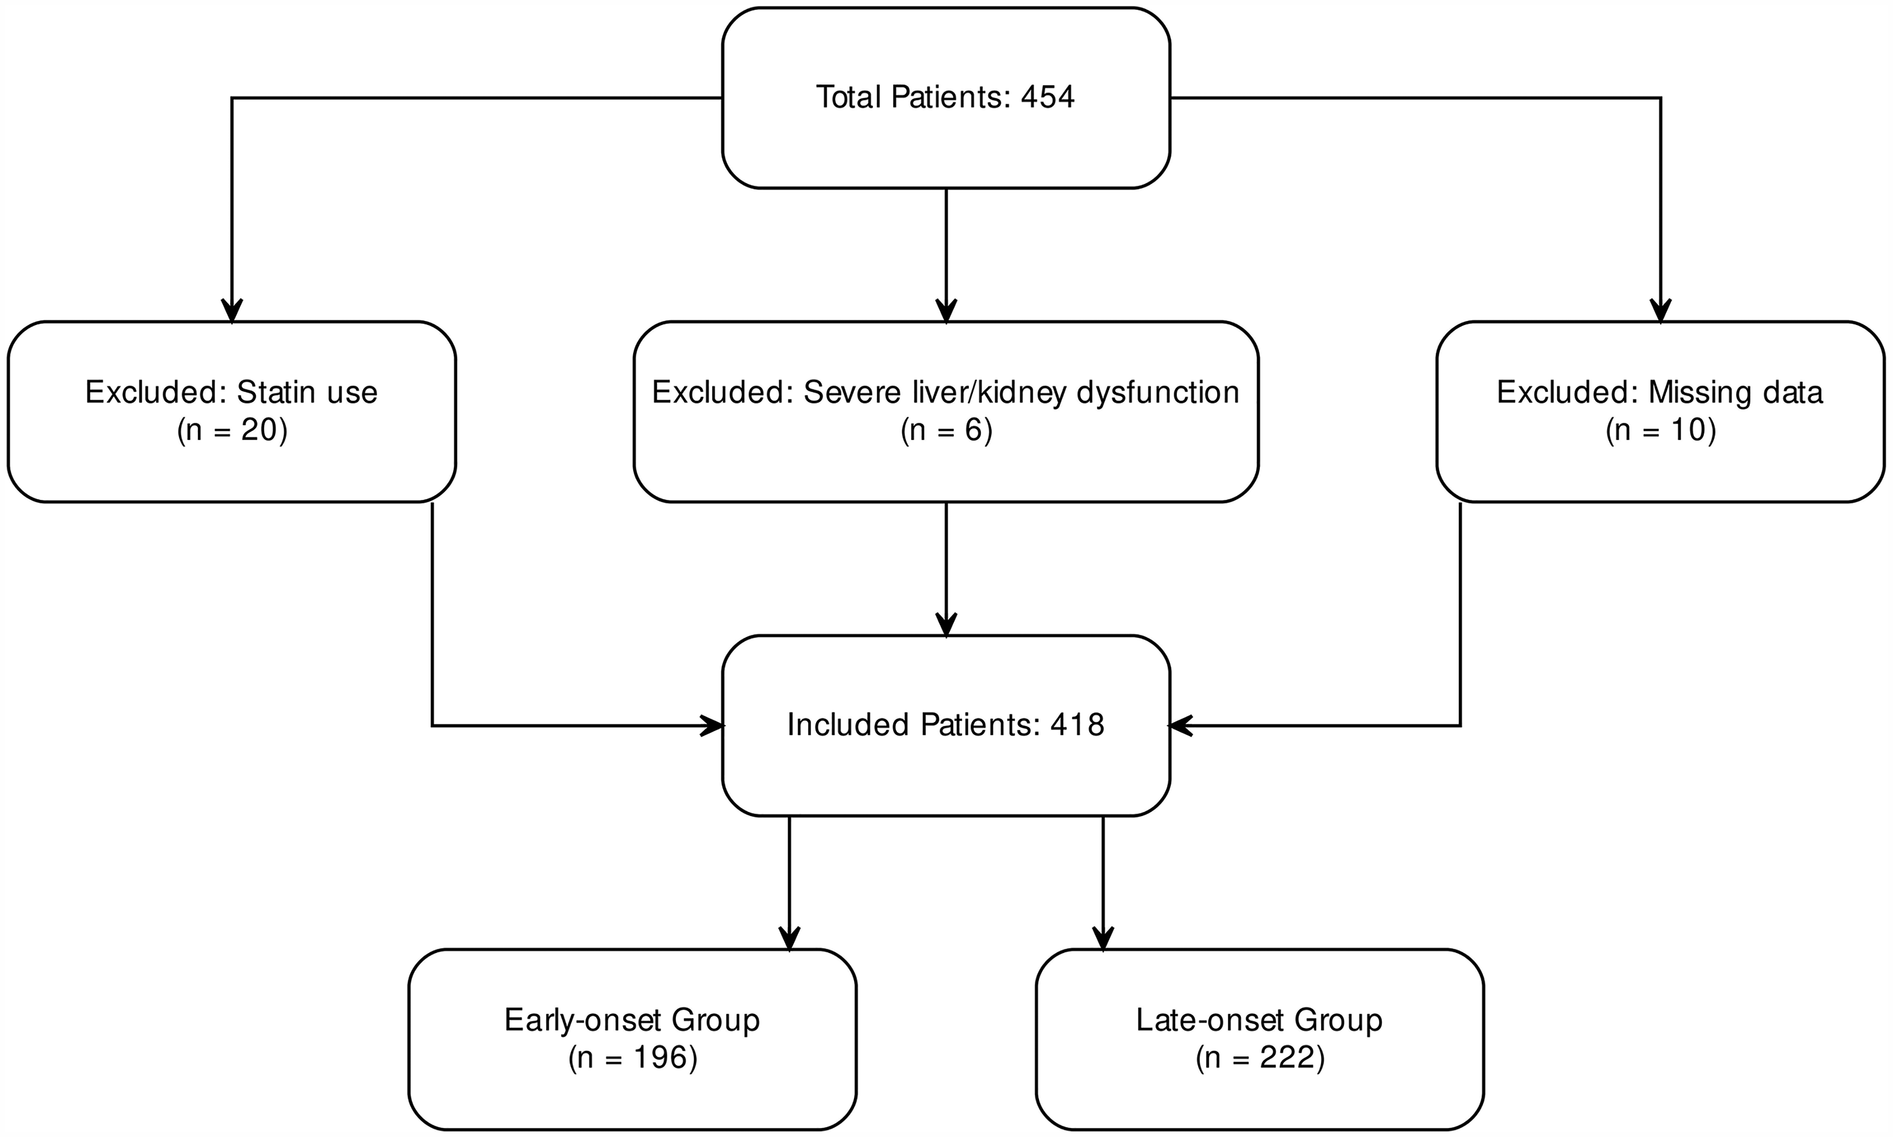
Inclusion and exclusion flowchart for ACS patients.
Clinical data collection
Comprehensive data were collected for each patient, including demographics, laboratory values, BMI, and imaging findings. Demographic variables included age, sex, smoking and alcohol use, and history of hypertension and diabetes. Laboratory tests comprised white blood cell count (WBC), RDW, total cholesterol (TC), triglycerides (TG), low-density lipoprotein cholesterol (LDL-C), high-density lipoprotein cholesterol (HDL-C), and RC, calculated using the formula: RC = TC−LDL-C−HDL-C (17). BMI was calculated as weight (kg) divided by height squared (m²) (18). Imaging assessments included echocardiographic evaluation of left ventricular ejection fraction (LVEF) and coronary angiography to quantify stenosis severity using the Gensini score (19)), number of diseased vessels, and presence of calcification. All data were anonymized and securely stored for analysis.
Comparison of study indicators
Differences in RC, RDW, and BMI were analyzed between early-onset and late-onset ACS patients. A subgroup analysis was also conducted to evaluate these markers within different ACS types, including acute myocardial infarction (AMI) and UA. This analysis revealed significant variations in metabolic and hematologic parameters between age groups, providing insights into potential pathophysiological mechanisms.
Multivariate analysis and nomogram model construction
Pearson correlation analysis was used to examine the linear associations between RC, RDW, BMI, and premature ACS. Premature ACS was then used as the dependent variable in a multivariate logistic regression model to evaluate the independent predictive value of each marker. Based on the regression results, a nomogram was constructed to visualize the relative contribution of each variable to the risk of premature ACS, offering a tool for individualized risk prediction.
Model performance evaluation
The predictive performance of the nomogram was assessed using the concordance index (C-index), calibration curves, and ROC curve analysis. The C-index indicated the model's discriminative ability, with values approaching 1.0 reflecting better performance. Calibration was evaluated via bootstrap resampling (1,000 iterations) to compare predicted probabilities with observed outcomes. ROC curves were generated for individual and combined predictors, and the area under the curve (AUC), sensitivity, and specificity were calculated. The combined model showed superior diagnostic accuracy compared to individual parameters.
Statistical analysis
All statistical analyses were conducted using SPSS version 26.0 and R version 4.2.0. Normally distributed continuous variables were expressed as mean ± standard deviation (SD) and compared using independent-sample t-tests. Non-normally distributed variables were reported as median (interquartile range) and analyzed using the Mann–Whitney U test. Categorical variables were presented as counts (percentages) and compared using the chi-square test. Pearson correlation coefficients were calculated to assess linear associations. A p-value < 0.05 was considered statistically significant. These analyses ensured methodological rigor and robustness of the findings.
Results
Comparison of characteristics between early-onset and late-onset ACS patients
We systematically compared baseline characteristics, laboratory findings, echocardiographic parameters, and study-specific indicators between early-onset (n = 196) and late-onset (n = 222) ACS patients (Table 1). No statistically significant differences were observed between the two groups in systolic blood pressure (SBP), diastolic blood pressure (DBP), heart rate (HR), smoking and alcohol history, or history of hypertension and diabetes (p > 0.05). However, the proportion of male patients was significantly higher in the early-onset group (p < 0.05). In terms of laboratory parameters, the early-onset group had significantly elevated levels of WBC, red blood cell count (RBC), hemoglobin (HGB), platelet count (PLT), alanine aminotransferase (ALT), TC, TG, and LDL-C (p < 0.05). Conversely, levels of NT-proBNP and D-dimer were significantly lower in this group (p < 0.05). No significant differences were noted in aspartate aminotransferase (AST), creatinine (Cr), blood urea nitrogen (BUN), homocysteine (Hcy), uric acid, blood glucose, HDL-C, lipoprotein(a), creatine kinase (CK), CK-MB, or troponin I (TnI) (p > 0.05). Cardiac ultrasound findings revealed no significant differences in left atrial (LA) and left ventricular (LV) dimensions or LVEF (p > 0.05). Regarding study-specific indicators, RC and BMI were significantly higher in the early-onset group, while RDW was significantly lower (p < 0.05) (Figure 2).
Table 1
| Variables | Early onset group | Late onset group | t/χ2/Z | P value |
|---|---|---|---|---|
| (n = 196) | (n = 222) | |||
| General information | ||||
| Male (%) | 156 (79.6) | 124 (55.9) | 13.26 | 0.000 |
| SBP (mmHg) | 130.33 ± 21.41 | 132.06 ± 22.55 | 0.569 | 0.570 |
| DBP (mmHg) | 84.48 ± 15.81 | 81.39 ± 13.01 | −1.550 | 0.123 |
| HR (bpm) | 80.27 ± 14.87 | 78.97 ± 13.81 | −0.651 | 0.516 |
| Smoking (%) | 92 (46.9) | 88 (39.6) | 1.131 | 0.288 |
| Drinking (%) | 38 (19.4) | 32 (14.4) | 0.923 | 0.337 |
| Hypertension (%) | 96 (49.0) | 134 (60.4) | 2.724 | 0.099 |
| Diabetes (%) | 38 (19.4) | 46 (20.7) | 0.058 | 0.810 |
| Laboratory index | ||||
| WBC(×109 /L) | 7.95 (6.40,10.80) | 7.10 (5.90,9.60) | 2.013 | 0.044 |
| RBC(×1012 /L) | 4.70 (4.40,5.00) | 4.40 (4.20,4.70) | 4.478 | 0.000 |
| HGB(g/L) | 144.61 ± 13.85 | 135.68 ± 15.52 | −4.363 | 0.000 |
| PLT(×109 /L) | 259.22 ± 57.28 | 227.16 ± 53.78 | −4.172 | 0.000 |
| ALT(U/L) | 29.55 (18.93,48.24) | 23.06 (15.90,41.79) | 2.446 | 0.014 |
| AST(U/L) | 33.25 (21.05,145.38) | 30.50 (19.80,171.20) | 0.755 | 0.450 |
| Cr(ummol/L) | 62.80 (57.30,75.25) | 66.20 (55.60,74.60) | −0.612 | 0.541 |
| BUN(mmol/L) | 4.87 (4.24,5.92) | 5.22 (4.47,6.17) | −1.673 | 0.094 |
| Hcy(umol/L) | 11.50 (9.18,16.32) | 12.40 (9.40,15.70) | −0.422 | 0.673 |
| UA(umol/L) | 311.95 (270.80,382.45) | 296.00 (252.20,369.10) | 1.549 | 0.121 |
| Glucose(mmol/L) | 6.40 (5.19,8.71) | 6.55 (5.12,8.57) | 0.213 | 0.831 |
| TC(mmol/L) | 4.99 (4.17,5.87) | 4.37 (3.93,4.96) | 3.680 | 0.000 |
| Triglyceride(mmol/L) | 1.46 (1.04,2.00) | 1.30 (0.99,1.71) | 2.081 | 0.037 |
| HDL-c(mmol/L) | 1.09 (0.95,1.26) | 1.06 (0.93,1.31) | 0.306 | 0.760 |
| LDL-c(mmol/L) | 3.09 (2.51,3.75) | 2.66 (2.30,3.06) | 3.577 | 0.000 |
| Lipoprotein a(mg/dl) | 18.73 (11.07,36.29) | 22.39 (13.26,36.23) | −1.193 | 0.233 |
| NT-proBNP(pg/ml) | 134.50 (46.83,720.00) | 322.80 (107.20,1,436.00) | −3.659 | 0.000 |
| Creatine kinase(U/L) | 138.75 (72.70,1,196.30) | 138.60 (71.60,818.20) | 0.345 | 0.730 |
| Creatine kinase isoenzyme(ng/ml) | 2.94 (1.20,69.39) | 2.90 (1.33,48.22) | −0.261 | 0.794 |
| Troponin I(ng/ml) | 0.18 (0.02,22.82) | 0.06 (0.03,15.79) | −0.480 | 0.631 |
| D-dimer(ug/ml) | 0.19 (0.12,0.32) | 0.24 (0.18,0.39) | −2.671 | 0.008 |
| Cardiac color ultrasound | ||||
| LA(mm) | 35.00 (32.00,37.00) | 36.00 (33.00,38.00) | −0.884 | 0.377 |
| LV(mm) | 50.00 (47.00,53.00) | 49.00 (46.00,52.00) | 1.108 | 0.268 |
| EF(%) | 58.00 (46.00,60.00) | 58.00 (47.00,60.00) | 0.013 | 0.990 |
| Research index | ||||
| RC(mmol/L) | 0.69 (0.45,1.01) | 0.58 (0.38,0.78) | 2.718 | 0.007 |
| RDW(fL) | 39.98 ± 2.43 | 40.98 ± 2.55 | 2.889 | 0.004 |
| BMI(kg/m2) | 26.76(24.36,29.38) | 24.22(22.04,26.89) | 4.577 | 0.000 |
Baseline characteristics of patients.
Note: Abbreviations: SBP, systolic blood pressure; DBP, diastolic blood pressure; HR, heart rate; WBC, white blood cell count; RBC, red blood cell count; HGB, hemoglobin; PLT, platelet count; ALT, alanine aminotransferase; AST, aspartate aminotransferase; Cr, creatinine; BUN, blood urea nitrogen; Hcy, homocysteine; UA, uric acid; TC, total cholesterol; HDL-c, high density lipoprotein cholesterol; LDL-c, low density lipoprotein cholesterol; LA, left atrial size; LV, Left ventricular size; EF, ejection fraction; RC, remnant cholesterol; RDW, red blood cell distribution width; BMI, body mass index.
Figure 2
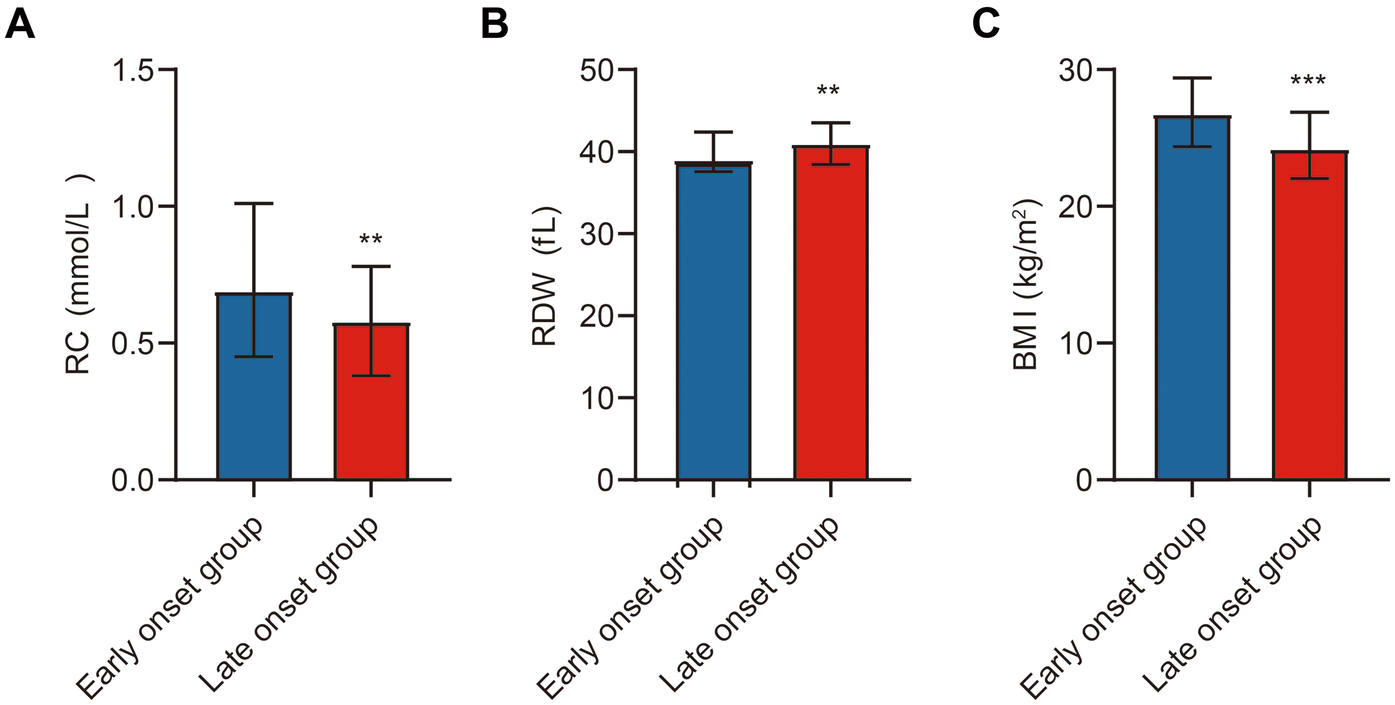
Comparison of study indicators between ACS patients. Note: (A) Comparison of RC between the early-onset and late-onset groups; (B) Comparison of RDW between the early-onset and late-onset groups; (C) Comparison of BMI between the early-onset and late-onset groups. Early-onset group (n = 196), late-onset group (n = 222). Statistical significance is indicated as **p < 0.01, ***p < 0.001.
In summary, early-onset ACS patients differed significantly from late-onset patients in several hematologic and metabolic parameters. These differences may provide insights into distinct pathophysiological mechanisms underlying premature ACS.
Subgroup analysis of RC, RDW, and BMI in ACS patients
A detailed subgroup analysis was performed to compare RC, RDW, and BMI between early-onset and late-onset patients within the AMI and UA subgroups. In the AMI subgroup, early-onset patients had significantly higher RC and BMI levels, and lower RDW levels compared to late-onset patients (p < 0.05). A similar pattern was observed in the UA subgroup, with early-onset patients again showing elevated RC and BMI and reduced RDW (p < 0.05) (Table 2; Figure 3).
Table 2
| Variables | Early onset group (AMI) | Late onset group (AMI) | Early onset group (UA) | Late onset group (UA) | t/Z | P value |
|---|---|---|---|---|---|---|
| (n = 102) | (n = 106) | (n = 94) | (n = 116) | |||
| RC (mmol/L) | 0.72 (0.46,1.01) | 0.58 (0.42,0.76) | 2.415 | 0.018 | ||
| 0.65 (0.41,0.97) | 0.57 (0.37,0.79) | 2.122 | 0.036 | |||
| RDW (fL) | 39.80 ± 2.56 | 40.91 ± 2.95 | −2.041 | 0.044 | ||
| 40.17 ± 2.30 | 41.04 ± 2.15 | −2.001 | 0.048 | |||
| BMI (kg/m2) | 27.34 (25.83,29.41) | 24.22 (21.39,25.39) | 4.933 | 0.000 | ||
| 25.95 (23.59,28.55) | 24.56 (22.66,27.61) | 1.444 | 0.049 |
Subgroup comparison.
Note: Abbreviations: RC, remnant cholesterol; RDW, red blood cell distribution width; BMI, body mass index.
Figure 3
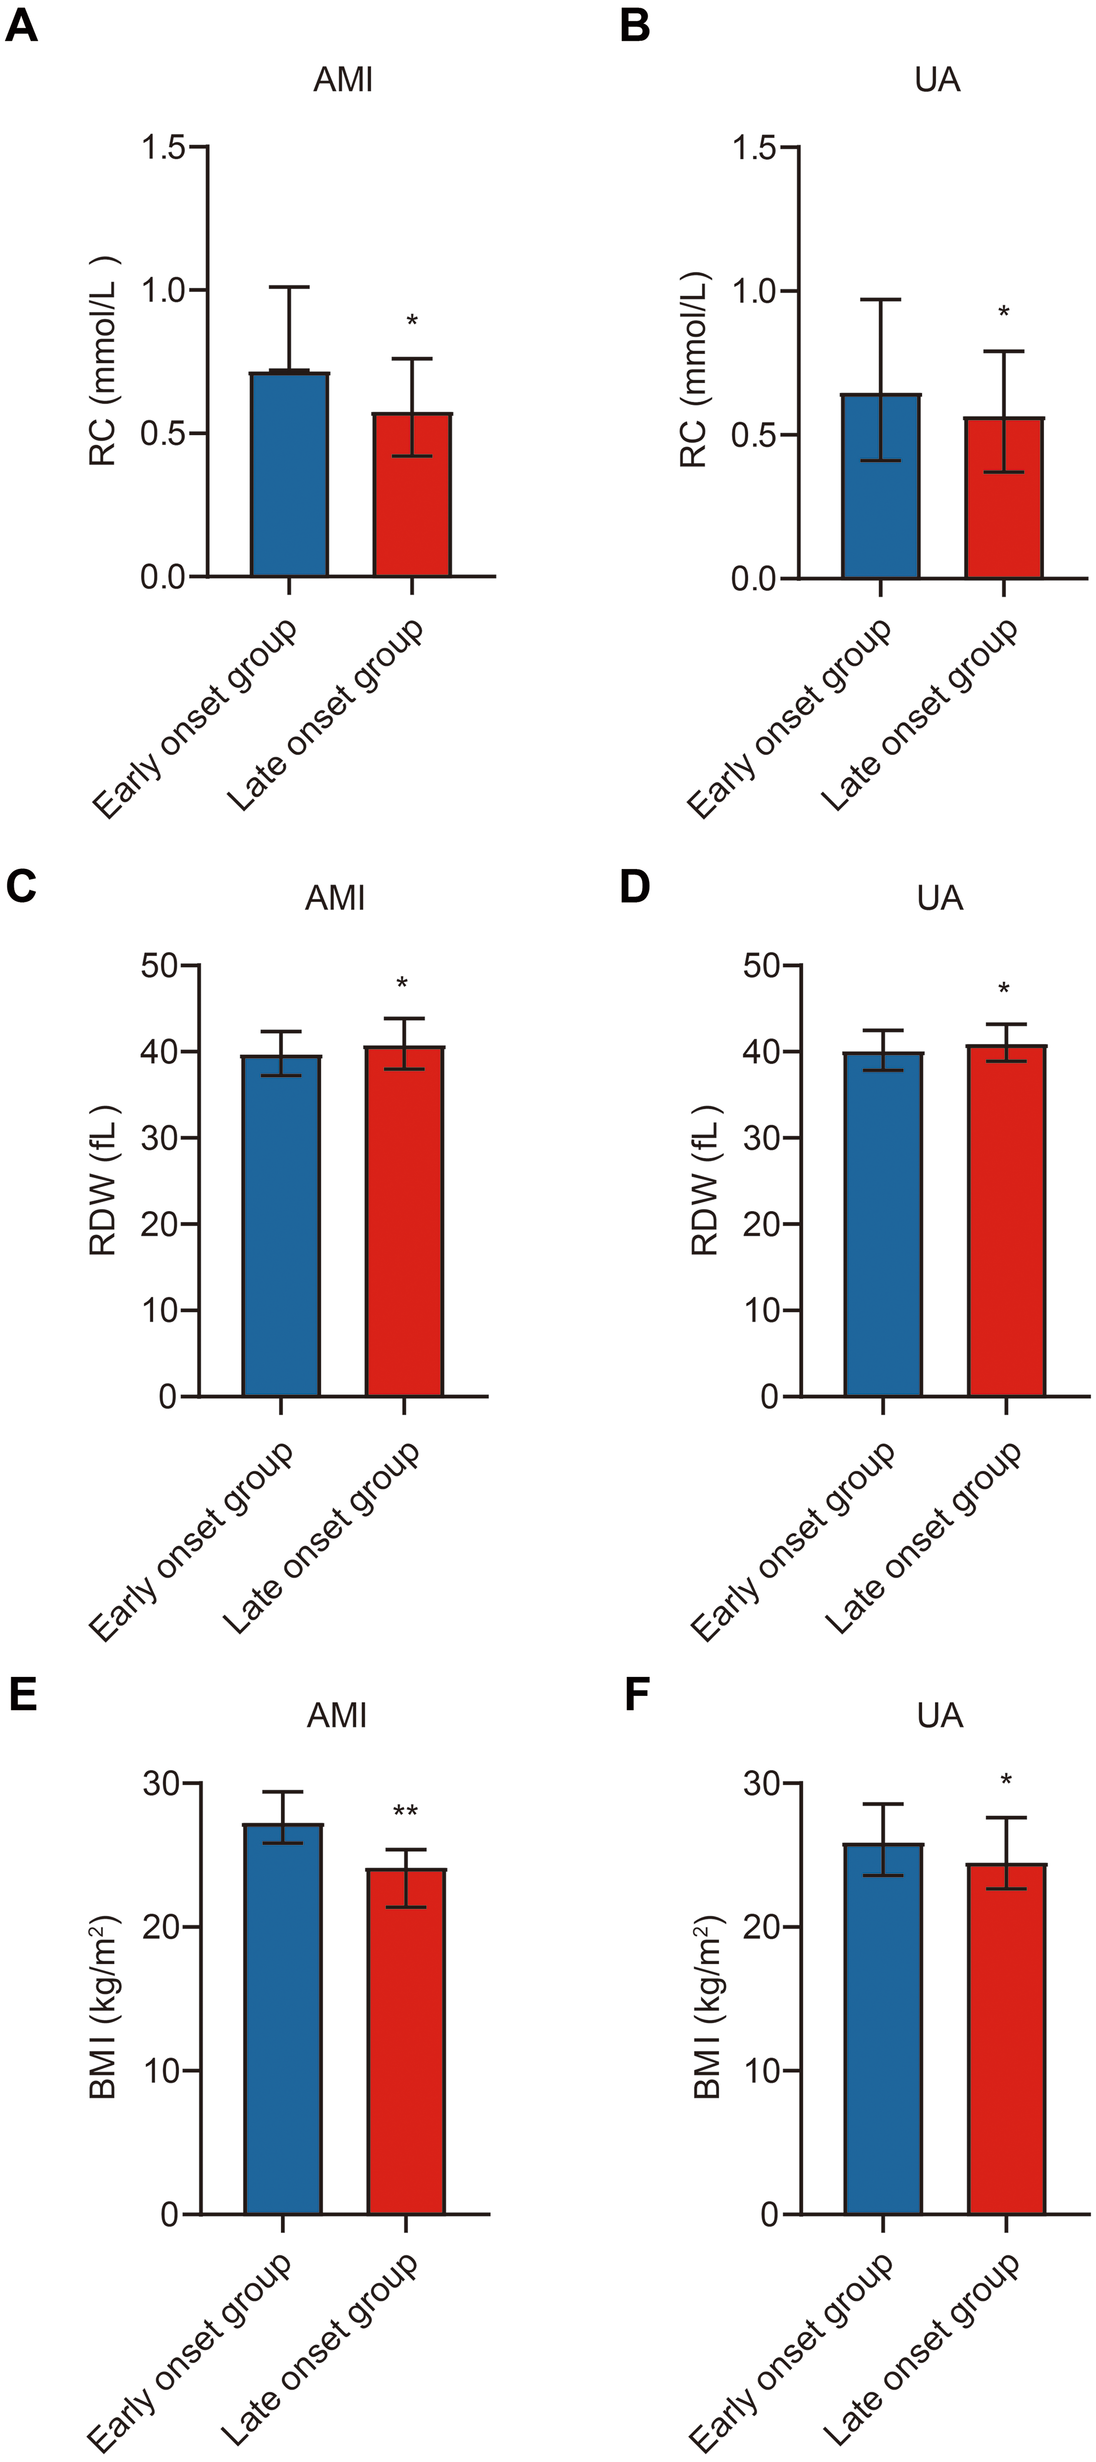
Subgroup comparison of study indicators in ACS patients. Note: (A) Comparison of RC between the early-onset and late-onset groups in the AMI subgroup; (B) Comparison of RC between the early-onset and late-onset groups in the UA subgroup; (C) Comparison of RDW between the early-onset and late-onset groups in the AMI subgroup; (D) Comparison of RDW between the early-onset and late-onset groups in the UA subgroup; (E) Comparison of BMI between the early-onset and late-onset groups in the AMI subgroup; (F) Comparison of BMI between the early-onset and late-onset groups in the UA subgroup. Early-onset group (n = 196), late-onset group (n = 222). Statistical significance is indicated as *p < 0.05, **p < 0.01.
These findings further support that RC, BMI, and RDW differ significantly across age-defined ACS groups and may reflect underlying biological distinctions in the pathogenesis of premature vs. late-onset disease.
Comparison of coronary angiographic features between early-onset and late-onset ACS patients
To further evaluate differences in coronary pathology, angiographic features were compared between early-onset and late-onset ACS patients (Table 3). The late-onset group exhibited a significantly higher incidence of coronary artery calcification (p < 0.05) and a greater number of affected vessels (p < 0.05). However, no significant difference was observed in Gensini scores between the two groups (p > 0.05). Regarding interventional strategies, the early-onset group had a significantly higher intervention rate in the left circumflex artery (LCX) (p < 0.05), while no significant differences were found in intervention rates for the left anterior descending artery (LAD) and right coronary artery (RCA) (p > 0.05).
Table 3
| Variables | Early onset group | Late onset group | Z/χ 2/t | P value |
|---|---|---|---|---|
| (n = 196) | (n = 222) | |||
| Gensini score | 39.50 (23.50,74.75) | 42.00 (25.00,70.00) | −0.577 | 0.564 |
| Coronary calcification (%) | 18 (9.2) | 46 (20.7) | 5.343 | 0.021 |
| Lesion count | 1.40 ± 0.77 | 1.61 ± 0.73 | 2.070 | 0.040 |
| Intervention vessels | ||||
| LAD (%) | 114 (58.2) | 110 (49.5) | 1.553 | 0.213 |
| LCX (%) | 46 (23.5) | 18 (8.1) | 9.472 | 0.002 |
| RCA (%) | 82 (41.8) | 80 (36.0) | 0.738 | 0.390 |
Comparison of coronary angiography.
Note: Abbreviations: LAD, left anterior descending; LCX, left circumflex; RCA, right coronary artery.
In summary, late-onset patients exhibited more extensive coronary calcification and multivessel disease, while early-onset patients were more likely to undergo LCX intervention. These findings suggest that age of onset may influence coronary lesion characteristics and treatment patterns, with potential implications for individualized therapy.
Evaluation and clinical value of combined prediction of premature ACS using RC, RDW, and BMI
To assess the predictive value of RC, RDW, and BMI for premature ACS, correlation analysis was first conducted. RC (r = 0.527, p < 0.0001) and BMI (r = 0.574, p < 0.0001) showed significant positive correlations, while RDW exhibited a strong negative correlation with premature ACS (r = −0.589, p < 0.0001) (Table 4). Subsequently, multivariate logistic regression identified all three variables—RC (p = 0.0013), RDW (p < 0.0001), and BMI (p < 0.0001)—as independent risk factors for premature ACS (Table 5).
Table 4
| Indicators | r | P value |
|---|---|---|
| RC | 0.527 | <0.0001 |
| RDW | −0.589 | <0.0001 |
| BMI | 0.574 | <0.0001 |
Relevance analysis.
Note: Abbreviations: RC, remnant cholesterol; RDW, red blood cell distribution width; BMI, body mass index.
Table 5
| Variables | Parameter | SE | 95%CI | Z | P |
|---|---|---|---|---|---|
| RC | 4.992 | 1.557 | 2.039–8.193 | 3.206 | 0.0013 |
| RDW | −1.247 | 0.2382 | −1.758−0.8172 | 5.235 | <0.0001 |
| BMI | 0.8157 | 0.1530 | 0.5359–1.141 | 5.332 | <0.0001 |
Logistic regression analysis.
Note: Abbreviations: RC, remnant cholesterol; RDW, red blood cell distribution width; BMI, body mass index.
Based on these results, a nomogram model was constructed to provide quantitative risk estimation. Among the predictors, RC contributed the widest point range, with higher values associated with greater risk. RDW and BMI also significantly impacted risk: lower RDW and higher BMI corresponded to increased probability of premature ACS. The total nomogram score ranged from 0 to 240, with higher scores indicating greater risk (Figure 4A). The model demonstrated excellent discriminative ability, achieving a C-index of 0.941. Calibration analysis based on 1,000 bootstrap resamples showed strong agreement between predicted and observed outcomes (Figure 4B). ROC analysis revealed that RC, RDW, and BMI individually achieved AUCs of 0.807, 0.837, and 0.833, respectively. The combined model produced an AUC of 0.941, significantly outperforming individual markers. The ROC curve of the multivariate model closely approached the upper-left corner, reflecting superior sensitivity, specificity, and overall diagnostic accuracy (Figure 4C).
Figure 4
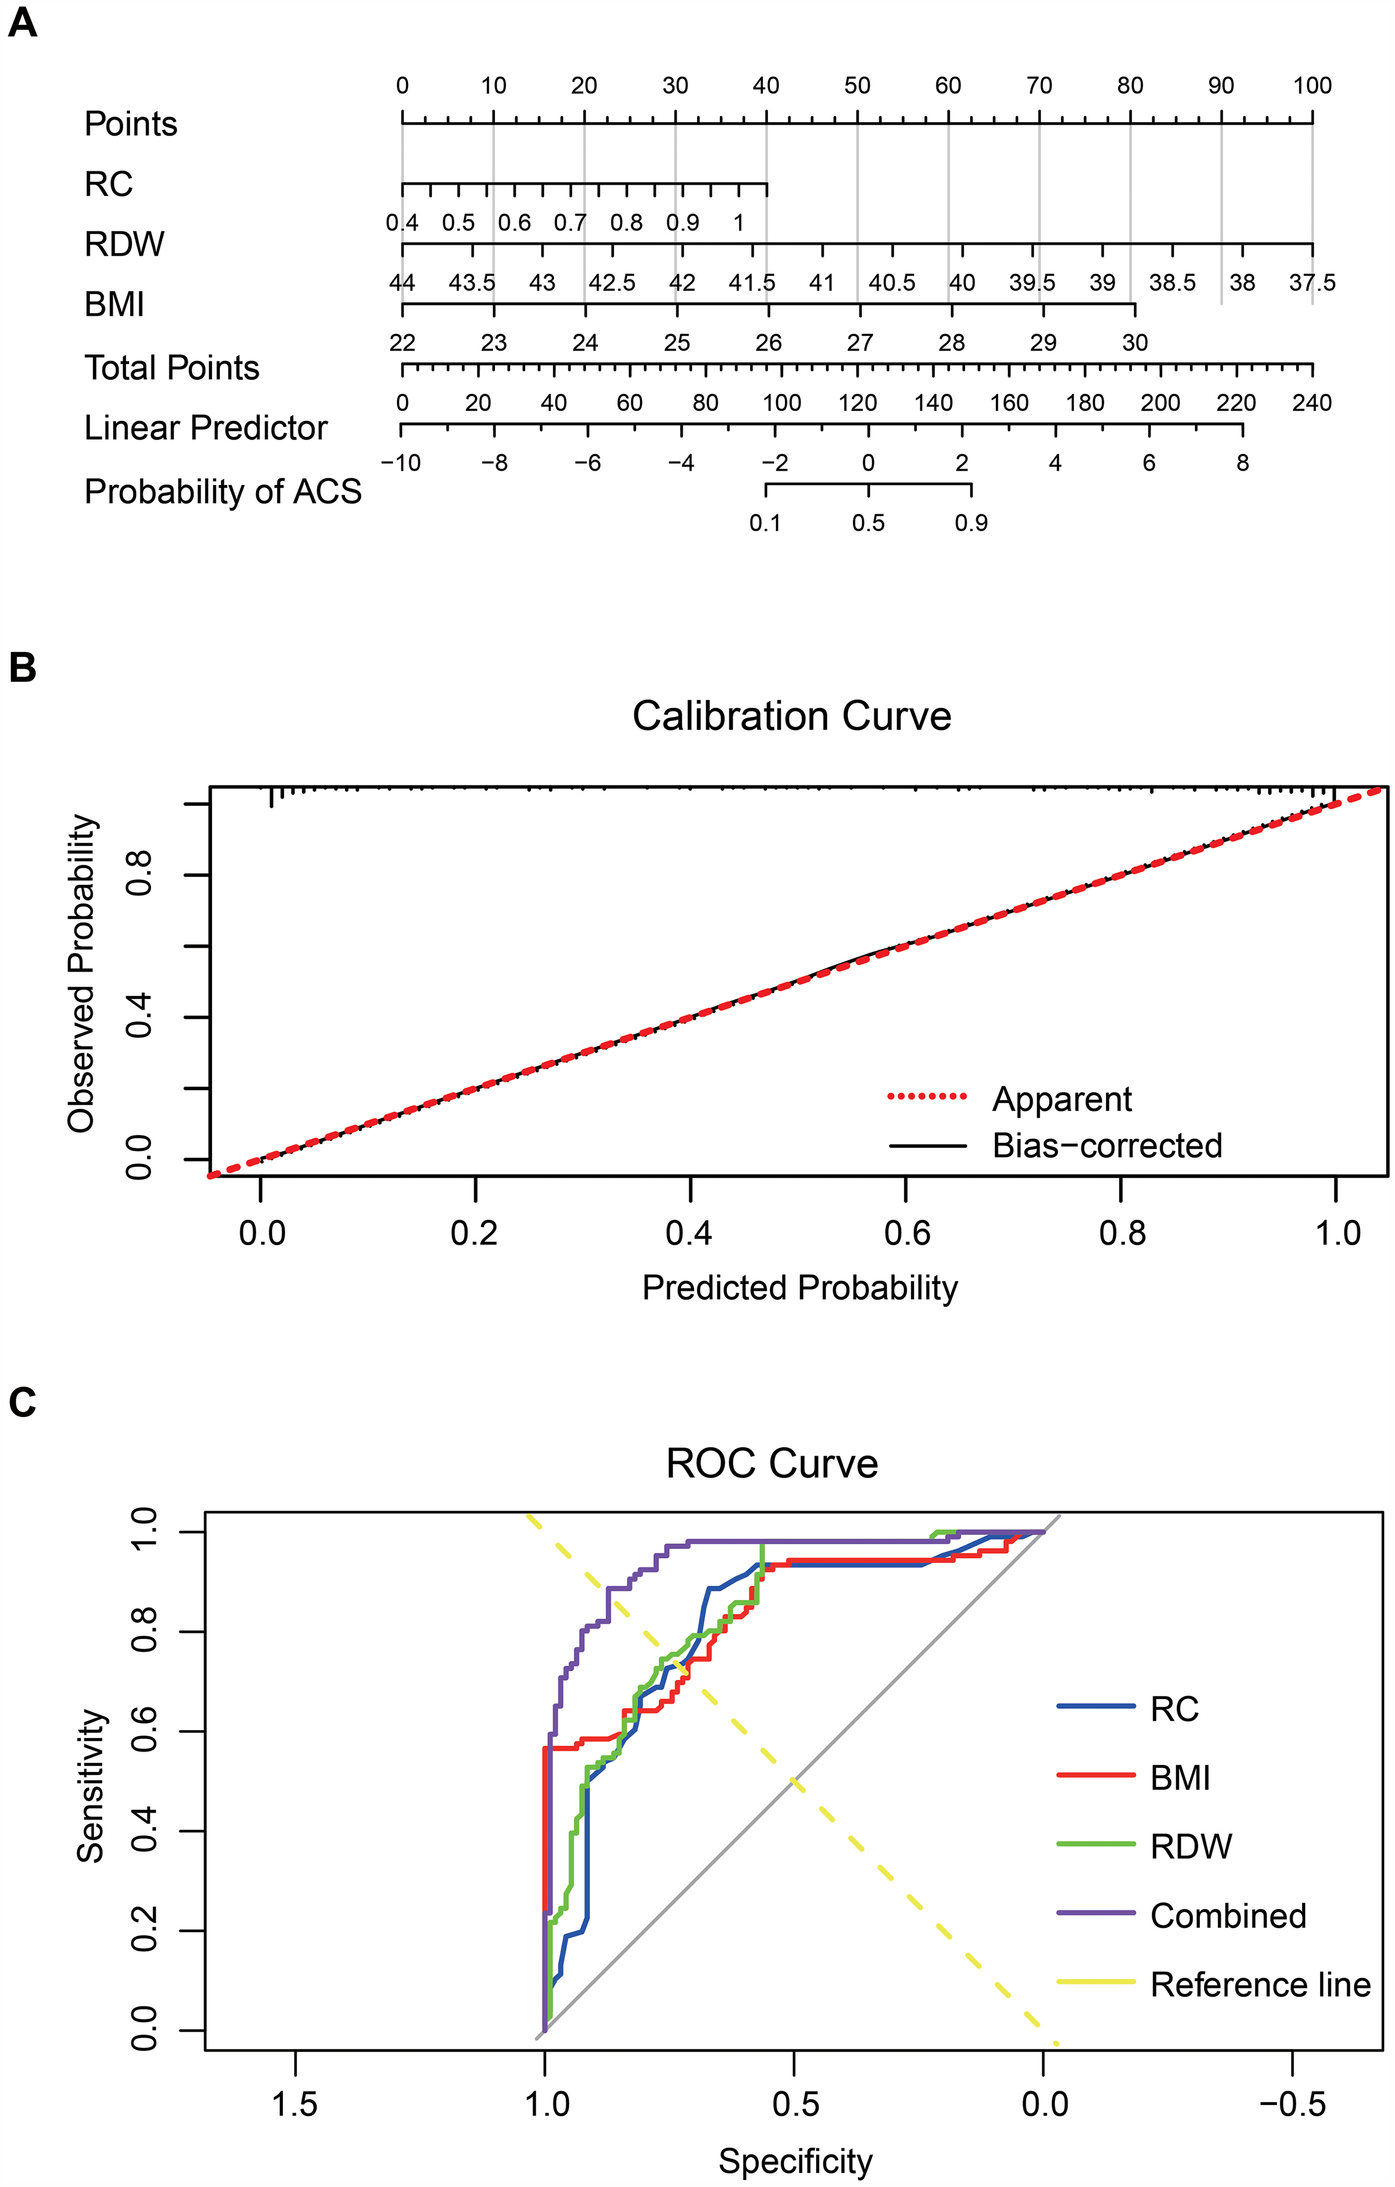
RC, RDW, and BMI combined to predict premature ACS. Note: (A) Nomogram constructed using RC, RDW, and BMI; (B) Calibration curve assessing the nomogram model's predictive accuracy; (C) ROC curves of RC, RDW, BMI, and the combined multivariable model.
Collectively, these results indicate that integrating RC, RDW, and BMI enhances the early identification of individuals at high risk for premature ACS. This multifactorial approach offers important clinical value for precision diagnosis and targeted prevention.
Discussion
ACS remains one of the leading causes of cardiovascular morbidity and mortality worldwide, posing a persistent threat to global public health (3). The underlying pathology involves atherosclerotic plaque rupture, erosion, or thrombosis, leading to acute myocardial ischemia (1). Despite improvements in diagnostic and interventional strategies, early identification of high-risk individuals—particularly those with premature ACS—remains a clinical challenge. Many young patients lack typical symptoms or present with normal LDL-C levels, making timely diagnosis difficult (4). The main findings of this study are as follows. First, RC and BMI levels were significantly higher in patients with premature ACS compared to those with late-onset ACS, while RDW was significantly lower. RC and BMI showed positive correlations with premature ACS, whereas RDW was negatively correlated. Second, all three markers—RC, RDW, and BMI—were identified as independent risk factors for premature ACS. Third, the combination of these markers significantly improved diagnostic performance, supporting the development of a novel multifactorial early diagnostic model. Clinically, these routinely available and cost-effective biomarkers may assist in identifying high-risk individuals earlier, facilitating timely intervention and improved patient outcomes.
These results are largely consistent with previous research, while also revealing some differences. Prior studies have established a strong link between RC and atherosclerosis or cardiovascular events (10, 20). Our findings further demonstrate that RC levels are elevated in premature ACS and confirm RC as an independent risk factor, aligning with results reported by Cordero et al. (9). Mechanistically, RC may promote the progression of ACS through inflammatory pathways and lipid deposition, independent of traditional markers such as LDL-C. The relationship between RDW and ACS has also been well-documented, with elevated RDW generally associated with worse cardiovascular outcomes (21). In contrast, our study observed a negative correlation between RDW and premature ACS. This discrepancy may be attributed to variations in inflammatory status, oxidative stress, or erythropoietic activity unique to younger ACS patients. Additionally, the role of BMI in cardiovascular risk is well-supported (22), and our findings further highlight its contribution to premature ACS, underscoring the growing importance of obesity as a modifiable risk factor.
Recent studies have highlighted the significance of integrating metabolic and inflammatory markers in assessing the risk and severity of ACS. Hori et al. demonstrated that triglyceride levels and BMI are independent determinants of sdLDL-C in ACS patients, with those exhibiting both high triglyceride and high BMI levels showing approximately threefold higher sdLDL-C levels compared to those with lower values (14). Similarly, Yuan et al. found that combining the NLR with the LDL-C/HDL-C ratio provided superior predictive value for the severity of coronary lesions in ACS patients. Their study also identified significant associations between BMI, RDW, and coronary lesion severity, underscoring the potential of integrated biomarker models in ACS risk stratification (15). These findings align with our results, suggesting that the combined assessment of RC, RDW, and BMI could enhance early detection and risk stratification for premature ACS.
The negative correlation between RDW and premature ACS observed in this study was unexpected. Previous studies have generally reported that elevated RDW is associated with increased severity and poor prognosis in ACS patients. In contrast, our findings show significantly lower RDW levels in patients with premature ACS. Several possible explanations may account for this discrepancy. First, our study population consisted exclusively of ACS patients, and RDW baseline levels may differ across age groups and pathological stages. Second, RDW may be influenced by diverse factors such as chronic inflammation, oxidative stress, and bone marrow activity, which could vary in premature ACS. For example, changes in RDW may reflect acute-phase red blood cell deformability, endothelial damage, or hemodynamic alterations. These differences highlight the complexity of RDW behavior in specific clinical contexts and indicate that further research is needed to elucidate its role in premature ACS.
This study offers new insights into the early diagnosis and risk stratification of premature ACS. RC, RDW, and BMI are simple, low-cost biomarkers that can be readily obtained through routine clinical assessments. As an independent risk factor, RC provides additional diagnostic information, especially in patients with well-controlled LDL-C levels. RDW and BMI also reflect systemic inflammation and metabolic status, contributing to a more comprehensive risk evaluation. Their clinical utility lies in their accessibility and ability to identify high-risk individuals before symptom onset. We recommend incorporating these markers into standard cardiovascular assessments to improve early detection and intervention.
From a real-world clinical perspective, the combined use of RC, RDW, and BMI offers a cost-effective and accessible tool for early risk assessment of premature ACS. These biomarkers are routinely collected during standard blood tests or physical examinations, without the need for specialized equipment or additional cost. In particular, residual cholesterol can be calculated indirectly from existing lipid panels (TC—HDL-C—LDL-C), making it feasible to implement even in primary care settings. This is especially relevant in younger patients who may present atypically or lack traditional risk factors, where early warning signs are often missed. Our findings support the idea that integrating these markers into routine cardiovascular screening protocols could enhance the early identification of high-risk individuals and facilitate timely preventive strategies, potentially reducing the burden of ACS in younger populations. Moreover, as electronic health records and AI-driven risk tools evolve, these simple parameters could be easily incorporated into predictive algorithms for wider clinical use.
The limitations of this study are as follows: (1) although the total sample size of 418 patients is relatively adequate compared to similar biomarker studies, it remains modest given the high prevalence and clinical heterogeneity of ACS. A larger cohort would strengthen the statistical power and generalizability of the findings, particularly for subgroup analyses. (2) the study was conducted in a single tertiary center, which may introduce selection bias and limit external validity. (3) important covariates such as physical activity, dietary habits, and family history were not available, which could confound the observed associations. (4) This study did not further analyze the relationships between these biomarkers and specific ACS subtypes, such as the differences between STEMI and NSTEMI patients. Future studies should be based on larger sample sizes and incorporate more clinical information and cardiac imaging data to further validate the roles of these biomarkers in different ACS subtypes.
Future research should explore the biological mechanisms underlying the associations between RC, RDW, BMI, and premature ACS. In particular, the inverse relationship between RDW and early-onset ACS warrants further investigation through experimental and longitudinal studies. Advances in genomics, proteomics, and high-throughput screening may also help refine predictive models and enable more personalized approaches to cardiovascular risk assessment. Ultimately, integrating diverse biomarker domains—lipid metabolism, inflammation, and anthropometry—may enhance our ability to identify and manage individuals at risk of premature ACS.
Conclusion
This study investigates the predictive value of RC, RDW, and BMI in patients with premature ACS. The findings demonstrate that RC and BMI are positively associated with premature ACS, whereas RDW shows a negative correlation (Figure 5). All three factors were identified as independent risk factors. Furthermore, logistic regression and ROC curve analyses further confirmed that the combined use of RC, RDW, and BMI significantly improved diagnostic performance, enhancing both diagnostic sensitivity and specificity for the early detection of premature ACS.
Figure 5
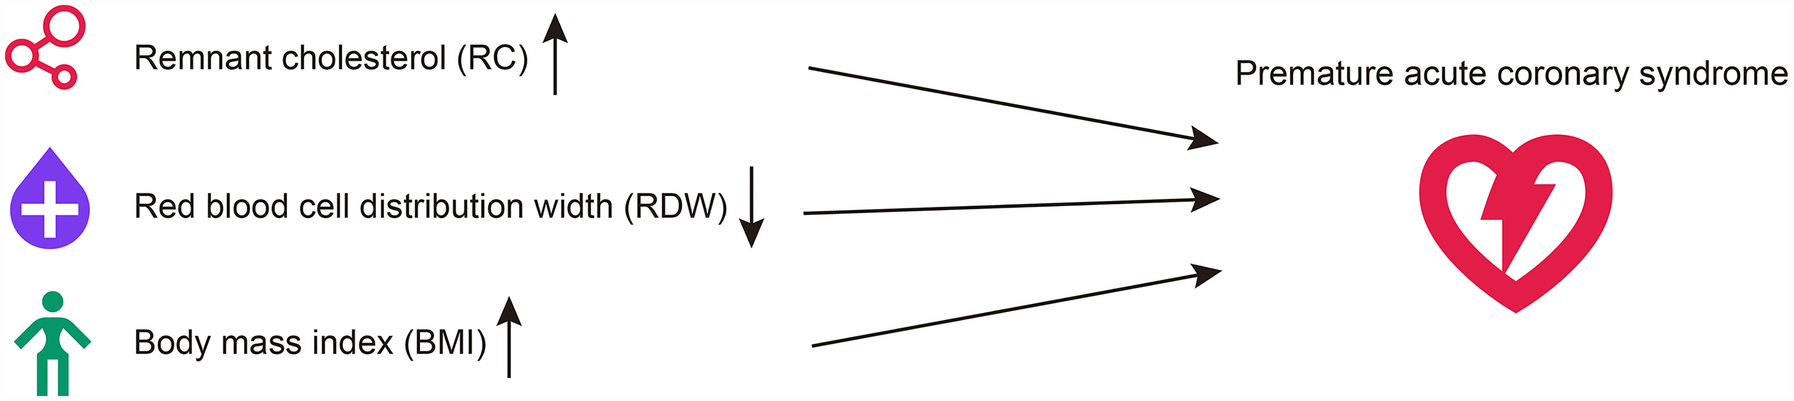
Mechanistic diagram illustrating how RC, RDW, and BMI contribute to the prediction of premature ACS.
Statements
Data availability statement
The raw data supporting the conclusions of this article will be made available by the authors, without undue reservation.
Ethics statement
The studies involving humans were approved by the Ethics Committee of Binzhou Medical University Hospital (Ethical Approval Number: KT-01). The studies were conducted in accordance with the local legislation and institutional requirements. The participants provided their written informed consent to participate in this study.
Author contributions
YL: Conceptualization, Data curation, Formal analysis, Resources, Software, Visualization, Writing – original draft. TL: Data curation, Formal analysis, Software, Validation, Visualization, Writing – original draft. JL: Data curation, Formal analysis, Methodology, Validation, Visualization, Writing – review & editing. HH: Data curation, Formal analysis, Methodology, Resources, Visualization, Writing – review & editing. YC: Conceptualization, Funding acquisition, Investigation, Methodology, Project administration, Resources, Software, Supervision, Visualization, Writing – review & editing.
Funding
The author(s) declare that financial support was received for the research and/or publication of this article. This study was supported by the Science and Technology Program of Binzhou Medical University (No. BY2021KJ18).
Conflict of interest
The authors declare that the research was conducted in the absence of any commercial or financial relationships that could be construed as a potential conflict of interest.
Generative AI statement
The author(s) declare that no Generative AI was used in the creation of this manuscript.
Publisher’s note
All claims expressed in this article are solely those of the authors and do not necessarily represent those of their affiliated organizations, or those of the publisher, the editors and the reviewers. Any product that may be evaluated in this article, or claim that may be made by its manufacturer, is not guaranteed or endorsed by the publisher.
Abbreviations
ACS, acute coronary syndrome; AUC, area under the curve; ALT, alanine aminotransferase; AMI, acute myocardial infarction; AST, aspartate aminotransferase; BMI, body mass index; BUN, blood urea nitrogen; CK, creatine kinase; CK-MB, creatine kinase-muscle/brain; Cr, creatinine; DBP, diastolic blood pressure; ESC, European Society of Cardiology; Hcy, homocysteine; HGB, hemoglobin; HDL-C, high-density lipoprotein cholesterol; HR, heart rate; IDL, intermediate-density lipoprotein; LA, left atrial; LAD, left anterior descending artery; LCX, left circumflex artery; LDL-C, low-density lipoprotein cholesterol; LV, left ventricular; LVEF, left ventricular ejection fraction; NSTEMI, non-ST-segment elevation myocardial infarction; PLT, platelet count; RC, residual cholesterol; RCA, right coronary artery; RBC, red blood cell count; RDW, red blood cell distribution width; ROC, receiver operating characteristic; SBP, systolic blood pressure; SD, standard deviation (from “Mean ± SD”); STEMI, ST-segment elevation myocardial infarction; TC, total cholesterol; TG, triglycerides; TnI, troponin I; UA, unstable angina; VLDL, very-low-density lipoprotein; WBC, white blood cell count.
References
1.
Andò G Micari A Costa F . Advances in acute coronary syndromes: bridging gaps in diagnosis and treatment. JCM. (2024) 13:6003. 10.3390/jcm13196003
2.
Kiełbowski K Skórka P Plewa P Bakinowska E Pawlik A . The role of alarmins in the pathogenesis of atherosclerosis and myocardial infarction. CIMB. (2024) 46:8995–9015. 10.3390/cimb46080532
3.
Byrne RA Rossello X Coughlan JJ Barbato E Berry C Chieffo A et al Correction to: 2023 ESC guidelines for the management of acute coronary syndromes: developed by the task force on the management of acute coronary syndromes of the European Society of Cardiology (ESC). Eur Heart J. (2024) 45:1145–1145. 10.1093/eurheartj/ehad870
4.
Xu M Wang W Cheng J Qu H Xu M Wang L . Effects of mitochondrial dysfunction on cellular function: role in atherosclerosis. Biomed Pharmacother. (2024) 174:116587. 10.1016/j.biopha.2024.116587
5.
Moriarty PM Steg PG McGinniss J Zeiher AM White HD Manvelian G et al Relation of red blood cell distribution width to risk of major adverse cardiovascular events, death, and effect of alirocumab after acute coronary syndromes. J Clin Lipidol. (2022) 16:747–56. 10.1016/j.jacl.2022.08.004
6.
Weitzman D Raz R Steinvil A Zeltser D Berliner S Chodick G et al Red blood cell distribution width and the risk of cardiovascular morbidity and all-cause mortality. Thromb Haemost. (2014) 112:300–7. 10.1160/th13-07-0567
7.
Varbo A Freiberg JJ Nordestgaard BG . Remnant cholesterol and myocardial infarction in normal weight, overweight, and obese individuals from the copenhagen general population study. Clin Chem. (2018) 64:219–30. 10.1373/clinchem.2017.279463
8.
Yang N Wang M Liu J Liu J Hao Y Zhao D . The level of remnant cholesterol and implications for lipid-lowering strategy in hospitalized patients with acute coronary syndrome in China: findings from the improving care for cardiovascular disease in China—acute coronary syndrome project. Metabolites. (2022) 12:898. 10.3390/metabo12100898
9.
Cordero A Alvarez-Alvarez B Escribano D García-Acuña JM Cid-Alvarez B Rodríguez-Mañero M et al Remnant cholesterol in patients admitted for acute coronary syndromes. Eur J Prev Cardiol. (2022) 30:340–8. 10.1093/eurjpc/zwac286
10.
Quispe R Martin SS Michos ED Lamba I Blumenthal RS Saeed A et al Remnant cholesterol predicts cardiovascular disease beyond LDL and ApoB: a primary prevention study. Eur Heart J. (2021) 42:4324–32. 10.1093/eurheartj/ehab432
11.
Namazi G Heidar Beygi S Vahidi MH Asa P Bahmani F Mafi A et al Relationship between red cell distribution width and oxidative stress indexes in patients with coronary artery disease. Rep Biochem Mol Biol. (2023) 12:241–50. 10.61186/rbmb.12.2.241
12.
Turcato G Serafini V Dilda A Bovo C Caruso B Ricci G et al Red blood cell distribution width independently predicts medium-term mortality and major adverse cardiac events after an acute coronary syndrome. Ann Transl Med. (2016) 4:254–254. 10.21037/atm.2016.06.35
13.
Ferreira JP Lamiral Z Bakris G Mehta C White WB Zannad F . Red cell distribution width in patients with diabetes and myocardial infarction: an analysis from the EXAMINE trial. Diab Obes Metab. (2021) 23:1580–7. 10.1111/dom.14371
14.
Hori M Imamura T Narang N Onoda H Tanaka S Ushijima R et al Triglyceride and small dense LDL-cholesterol in patients with acute coronary syndrome. JCM. (2021) 10:4607. 10.3390/jcm10194607
15.
Yuan S Li L Pu T Fan X Wang Z Xie P et al The relationship between NLR, LDL-C/HDL-C, NHR and coronary artery disease. PLoS One. (2024) 19:e0290805. 10.1371/journal.pone.0290805
16.
Byrne RA Rossello X Coughlan JJ Barbato E Berry C Chieffo A et al 2023 ESC guidelines for the management of acute coronary syndromes. Eur Heart J. (2023) 44:3720–826. 10.1093/eurheartj/ehad191
17.
Xuan Y Hu W Wang Y Li J Yang L Yu S et al Association between RC/HDL-C ratio and risk of non-alcoholic fatty liver disease in the United States. Front Med. (2024) 11:1427138. 10.3389/fmed.2024.1427138
18.
Zierle-Ghosh A Jan A . Physiology, Body Mass Index. Treasure Island, FL: StatPearls Publishing (2023).
19.
Gensini GG . A more meaningful scoring system for determining the severity of coronary heart disease. Am J Cardiol. (1983) 51:606. 10.1016/s0002-9149(83)80105-2
20.
Zafrir B Khoury R Saliba W . Remnant cholesterol and risk of myocardial infarction in patients with coronary artery disease undergoing revascularization. J Clin Lipidol. (2023) 17:332–41. 10.1016/j.jacl.2023.03.009
21.
Pan R . Relationship of red cell volume distribution width and N-terminal pro-brain natriuretic peptide with severity and prognosis of patients with acute coronary syndrome receiving percutaneous coronary intervention. Clin Lab. (2020) 66(4). 10.7754/clin.lab.2019.190513
22.
Demirci D Demirci DE Chi G . Association between obesity grade and the age of the first acute coronary syndrome: prospective observational study. Int J Cardiol. (2022) 351:93–9. 10.1016/j.ijcard.2021.11.080
Summary
Keywords
acute coronary syndrome, residual cholesterol, red blood cell distribution width, body mass index, diagnostic value, risk assessment
Citation
Liang Y, Li T, Li J, Han H and Cheng Y (2025) Integrated risk factors for premature acute coronary syndrome: residual cholesterol, RDW, and BMI. Front. Cardiovasc. Med. 12:1574620. doi: 10.3389/fcvm.2025.1574620
Received
11 February 2025
Accepted
13 May 2025
Published
26 June 2025
Volume
12 - 2025
Edited by
Serafino Fazio, Federico II University Hospital, Italy
Reviewed by
Shengkai Yan, Zunyi Medical University, China
Azmi Eyiol, Konya Beyhekim State Hospital, Türkiye
Updates
Copyright
© 2025 Liang, Li, Li, Han and Cheng.
This is an open-access article distributed under the terms of the Creative Commons Attribution License (CC BY). The use, distribution or reproduction in other forums is permitted, provided the original author(s) and the copyright owner(s) are credited and that the original publication in this journal is cited, in accordance with accepted academic practice. No use, distribution or reproduction is permitted which does not comply with these terms.
* Correspondence: Yanli Cheng bzmucardiac@163.com
Disclaimer
All claims expressed in this article are solely those of the authors and do not necessarily represent those of their affiliated organizations, or those of the publisher, the editors and the reviewers. Any product that may be evaluated in this article or claim that may be made by its manufacturer is not guaranteed or endorsed by the publisher.