 Mao Li
 Bin Yu
 Jia Pan
 Chaohui Dong
 Honglian Zeng1*
 Shujuan Yang
- 1Department of Health Management Centre, Clinical Medical College &Affiliated Hospital of Chengdu University, Chengdu University, Chengdu, Sichuan, China
- 2West China School of Public Health and West China Fourth Hospital, Sichuan University, Chengdu, Sichuan, China
Background: Hyperuricemia is a recognized predictor of hypertension. However, the consistent link between elevated serum uric acid (SUA) levels and hypertension risk across different age groups, especially in males, remains a subject of debate. This study aimed to examine the association between SUA trajectories and the risk of new-onset hypertension, focusing on age-group disparities.
Methods: We conducted a longitudinal study of 4,221 male employees from Southwestern China, initially free of hypertension, over a 4-year period (2018–2021). All employees underwent annual physical examinations each year. Incident hypertension was defined as newly detected blood pressure ≥140/90 mmHg, or the initiation of anti-hypertensive medication. We employed group-based trajectory modeling to identify the trajectory patterns of SUA levels over the study period. Logistic regression was used to assess the association between these SUA trajectories and the risk of developing hypertension. Additionally, subgroup analyses were conducted by stratifying participants into young (<45 years) and middle-aged (≥45 years) groups, with sensitivity analyses conducted using additional cutoffs of 40 and 50 years.
Results: Four distinct SUA trajectories were identified: low (21.18%), moderate-low (45.44%), moderate-high (28.26%), and high (5.12%). The 4-year cumulative incidence of hypertension was 13.2%. Compared to the low SUA trajectory, the high SUA trajectory was independently associated with an increased risk of developing hypertension (OR = 2.22, 95% CI 1.43–3.43). The risk of developing hypertension increased significantly with higher SUA trajectories (P for trend = 0.003), and this dose-response relationship was modified by age (P for interaction = 0.026). In male employees under 45 years, the high SUA trajectory was associated with a higher risk of hypertension (OR = 1.78, 95% CI 1.04–3.07) compared to the low SUA trajectory, while no significant association was found in male employees over 45 years (OR = 2.22, 95% CI 0.89–5.33). Sensitivity analyses showed a significant association in males <40 years (OR = 2.17), a borderline association in those aged 40–49 (OR = 2.07, P = 0.053), but none in those ≥50 (OR = 1.22).
Conclusion: Persistently high SUA levels may elevate hypertension risk in males, particularly younger individuals. Age-specific management of SUA may be necessary for hypertension prevention, with early intervention in young men likely yielding greater benefits than in middle-aged men.
1 Introduction
Hyperuricemia has emerged as a prevalent public health concern worldwide, particularly among males (1). According to United States data from 2015 to 2016, there is a significant gender disparity in prevalence, affecting 24.7% of men and 5.2% of women (2). Echoing this trend, in China, the 2018–2019 survey reports reveal a pronounced male predominance, with a prevalence of 24.4% among men and a notably lower rate of 3.6% among women (3). This disparity highlights the urgency of addressing hyperuricemia within the male demographic as a critical public health challenge.
Recent statistics indicate a significant rise in the prevalence of hypertension among Chinese adults, increasing from 25.2% in 2012 to 27.5% in 2019 (4). This trend underscores the growing public health concern posed by hypertension. It is well established that complications associated with hypertension are among the leading causes of disability and all-cause mortality globally. Fortunately, hypertension is preventable and controllable, with effective management reducing risks of cardiovascular diseases, stroke, and related mortality (5).
Hyperuricemia is widely recognized as an independent predictor of prehypertension and hypertension development (6–9), often preceding the onset of hypertension (10, 11). An increasing number of studies suggest that elevated serum uric acid (SUA) levels play a direct role in the pathogenesis and natural history of hypertension (12). Despite this recognition, the consistency of the association between elevated SUA levels and the risk of hypertension across different age groups, particularly in males, remains a subject of ongoing debate (13–16). For instance, a Japanese study has indicated that this association was observed only in men under 45 years, but not in those over 45 years (13). In contrast, another study has shown this relationship to be significant for middle-aged men (aged 45–60), with no observable association in younger or older men (14). What accounts for these inconsistencies in the findings? Notably, SUA levels are influenced by various factors (17) and often exhibit significant fluctuations between baseline and follow-up measurements (18, 19). Baseline SUA values may not represent long-term SUA levels. However, most prior studies have relied on single measurements of SUA levels (6, 8, 13, 14, 20–22), possibly neglecting the dynamic variations of SUA that occur over time, thereby potentially introducing bias into the estimations. Trajectory modeling is a technique that utilizes long-term longitudinal data to analyze trends over time (23), potentially addressing the limitations of single SUA measurements in previous studies. In this study, we conducted a 4-year longitudinal study from 2018 to 2021 to track SUA trajectories and investigate their association with the risk of developing hypertension in male employees, as well as to identify potential age-related heterogeneity in this relationship. The research findings are expected to provide a basis for long-term management strategies of SUA in males of different age groups, aiming to reduce the risk of hypertension.
2 Methods
2.1 Study design and participants
This longitudinal study was conducted in southwest China, involving employees from the Chengdu Bureau of the National Railway Administration of China (24). In 2018, 24,289 male employees, aged 20–60 underwent physical examinations at the Affiliated Hospital of Chengdu University and completed a face-to-face survey on demographics and lifestyle behaviors. Individuals with hypertension in 2018 were excluded from the study. Subsequently, annual follow-up examinations were conducted, with 4,299 male employees undergoing annual physical examinations each year from 2019 to 2021. Participants were excluded if they met any of the following criteria: (a) presence of malignant tumors, severe hepatic, or renal insufficiency at baseline or during follow-up exams; (b) incomplete survey or physical examination data (see Figure 1). Ultimately, 4,221 male employees were included in the analysis.
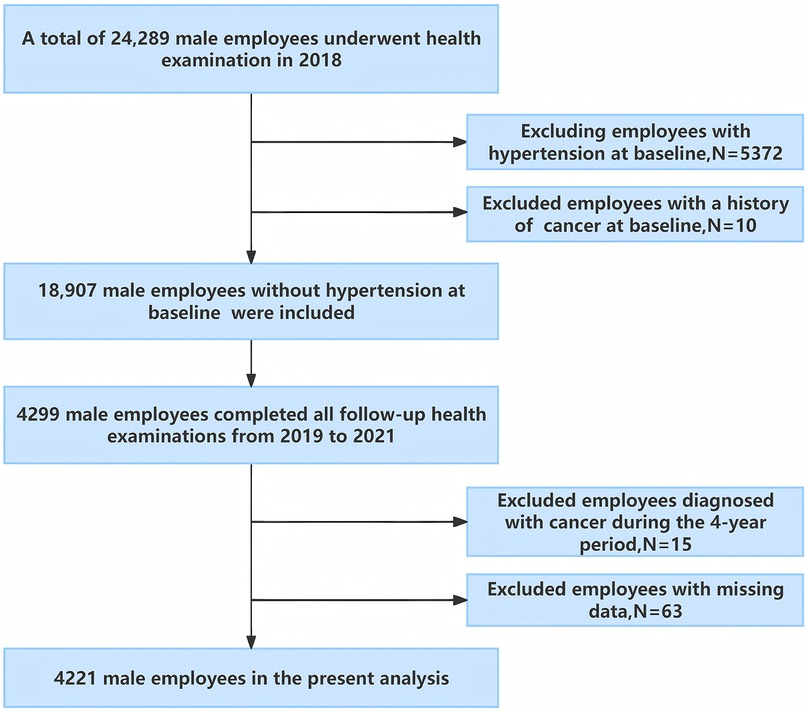
Figure 1. Flow diagram of study enrollment.
2.2 Measurement of hypertension
Annual health check-ups included standardized blood pressure (BP) measurements. A well-trained nurse measured the subject's resting BP in the sitting position after a minimum of 5 min of rest in the morning, utilizing an electronic sphygmomanometer (TM-2655P, A&D Corporation, Japan). Measure three times continuously, with an interval of at least 1–2 min, and take the average as the final systolic blood pressure (SBP) and diastolic blood pressure (DBP). In accordance with the 2024 European Society of Cardiology (ESC) guidelines, incident hypertension was defined as the detection of SBP ≥140 mmHg or DBP ≥90 mmHg, or the initiation of anti-hypertensive medication (25). The occurrence of hypertension during the follow-up was considered as the outcome event.
2.3 Measurement of SUA
Annual health check-ups included laboratory tests. Prior to blood collection, all employees fasted for a minimum of 8 h. Subsequently, SUA levels were measured using an automatic biochemical analyzer (AU5800, Beckman Coulter, USA) at the Clinical Laboratory of the Affiliated Hospital of Chengdu University.
2.4 Covariates
According to previous studies (8, 26), the factors that affect the association between SUA and hypertension were considered as covariates, including age, marital status, smoking status, drink status, diabetes, family history of hypertension, SBP, DBP, body mass index (BMI), low-density lipoprotein cholesterol (LDL-C), high-density lipoprotein cholesterol (HDL-C), triglycerides (TG), and estimated glomerular filtration rate (eGFR). In this study, face-to-face surveys conducted by uniformly trained physicians collected data from employees on basic demographic information (including age, gender, and marital status), health behaviors (including smoking and alcohol intake), chronic disease history (such as hypertension and diabetes), medication use, and family history of hypertension. Current smokers were defined as those who have smoked at least 100 cigarettes in their lifetime and have been smoke-free for less than a year (27). Current drinkers were defined as subjects who drank at least once a month, and abstinence from alcohol for more than a year was defined as quit drinking. Laboratory assessments, including fasting plasma glucose (FPG), total cholesterol (TC), LDL-C, HDL-C, TG, and serum creatinine (Scr), were conducted. Diabetes was defined by a self-reported history of diabetes, usage of anti-diabetic medicine, or FPG ≥7.0 mmol/L, according to the criteria of the World Health Organization (WHO) (28). The eGFR was calculated using the Cockcroft-Gault equations (29).
2.5 Statistical analysis
R (version 4.2.3) was utilized for conducting the statistical analysis. Firstly, group-based trajectory modeling (GBTM) was employed to delineate the trajectory patterns of SUA from 2018 to 2021 among the study cohort. The R package LCTM tools, accessible at [https://github.com/hlennon/LCTMtools], was utilized to establish the GBTM (30). The number of SUA trajectory groups was determined based on the following criteria: (1) the minimization of the Bayesian Information Criterion (BIC); (2) an average posterior probability assignment (APPA) greater than 70%; and (3) a minimum of 5% membership in each trajectory group (23, 31).
Secondly, we presented baseline data based on SUA trajectory groups. Differences in demographic characteristics, lifestyle information, laboratory indicators were analyzed by one-way ANOVA (when the data met normal distribution) and Kruskal–Wallis test (when the data did not meet normal distribution) for continuous variables, and by Chi-square test or Fisher's Exact test, as appropriate, for categorical variables.
Thirdly, we utilized the Cochran-Armitage trend test to analyze the association between SUA trajectory patterns and the cumulative incidence of hypertension. Subsequently, multiple regression models were employed to explore the relationship between these patterns and the risk of developing hypertension, with covariates adjusted step by step. Prior to this, variance inflation factor (VIF) analysis identified multicollinearity. The C statistic was used to assess the predictive accuracy of the models. Additionally, we explored the potential dose-response relationship between SUA trajectory patterns and the risk of developing hypertension by modeling the trajectory groups as a continuous variable in our statistical analyses.
Fourthly, we conducted subgroup and interaction analyses within the adjusted models to identify potential effect modification. Employees were stratified by age (<45 years and ≥45 years) (13, 32), BMI (<24 kg/m2 and ≥24 kg/m2), current drinking (yes, no), current smoking (yes, no), and family history of hypertension (yes, no). The cross-product term of SUA trajectory patterns and stratified factors was included in the regression model to examine the effect modification.
Finally, we conducted a sensitivity analysis, redefining the age cutoffs at 40 and 50 years old to explore the impact of different age groups on this association (33).
All statistical analyses were conducted in R Studio. Two-sided P values below 0.05 were considered statistically significant.
3 Results
3.1 The trajectory of SUA
A total of 4,221 male employees were included in present analysis. The average SUA levels from 2018 to 2021 were 6.42 ± 1.30 mg/dl, 6.43 ± 1.37 mg/dl, 6.65 ± 1.38 mg/dl, and 6.55 ± 1.37 mg/dl, respectively. A significant change in SUA levels over time was observed (F = 18.92, P < 0.001). Employees were classified according to SUA trajectory types, with trajectory models for groups 1–6 compared in sequence. Finally, four SUA distinct trajectories were identified as the best fitted model by GBTM (Table 1). In this model, the minimum proportion of participants in per category was 5.12%, and the minimum APPA for each category was 90.09%. The patterns of the trajectory groups were depicted in Figure 2 and named as follows: low SUA group (n = 894, 21.18%), moderate-low SUA group (n = 1,918, 45.44%), moderate-high SUA group (n = 1,193, 28.26%), and high SUA group (n = 216, 5.12%).
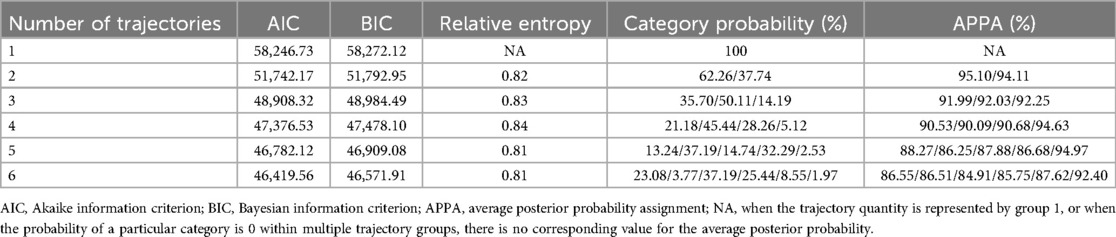
Table 1. Fitted results of latent class trajectory model for uric acid changes.
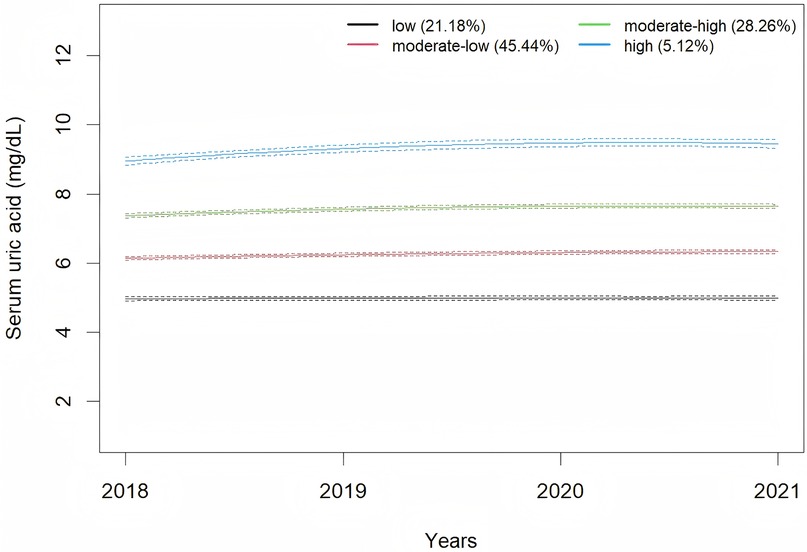
Figure 2. Trajectories of serum uric acid during 2018–2021.
3.2 Baseline data of different SUA trajectory groups
Table 2 shows the baseline characteristics stratified by SUA trajectory groups. Significant differences were observed across the SUA trajectory groups in age, BMI, SBP, DBP, marital status, prevalence of diabetes, SUA, eGFR, FBG, TC, HDL-C, and TG (P < 0.05).
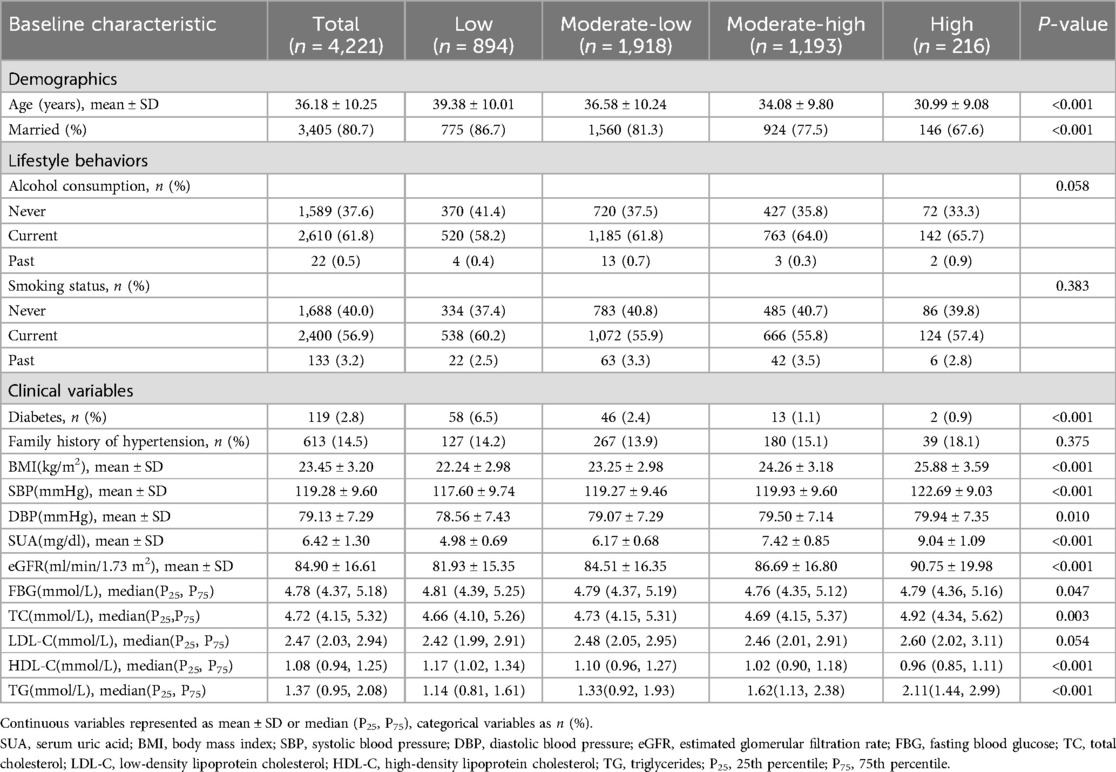
Table 2. Baseline demographic clinical characteristic according to serum uric acid trajectories.
3.3 Association of SUA change trajectories and hypertension development risk
The cumulative incidence of hypertension among all participants from 2018 to 2021 was 13.2%. Cochran-Armitage trend test showed that the cumulative incidence of hypertension was significantly elevated as SUA changing trajectory increased (Table 3, P for trend < 0.001). Prior to conducting multivariable logistic regression models (models 1–3, Table 3), multicollinearity diagnostics identified a collinearity issue between total cholesterol (TC, VIF = 10.52) and low-density lipoprotein cholesterol (LDL-C, VIF = 8.92). Based on subject-matter expertise, TC was excluded from the models to address this issue. Model 3 exhibited a good discriminatory power with a C statistic of 0.77 (95% CI 0.75–0.79). Compared to the low SUA trajectory group, the odds ratios (ORs) with 95% confidence intervals (CIs) for developing hypertension were 0.94 (0.72–1.23) for the moderate-low SUA group, 1.15 (0.85–1.56) for the moderate-high SUA group, and 2.22 (1.43–3.43) for the high SUA group. Furthermore, a significant trend of increasing risk of developing hypertension was observed with escalating SUA trajectories in all three models (P for trend < 0.01).
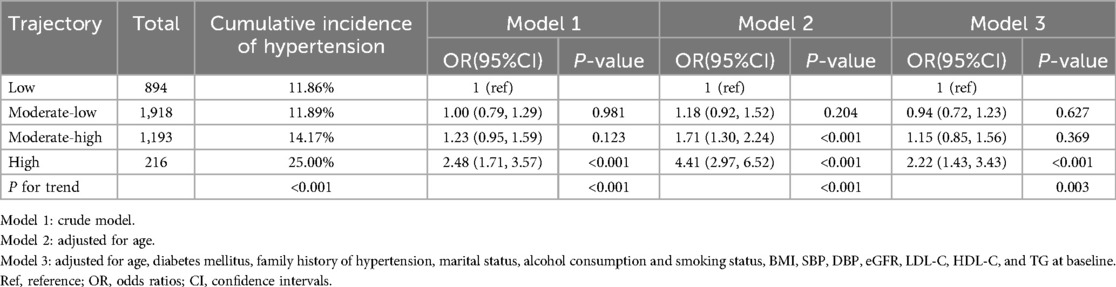
Table 3. The association between serum uric acid trajectories and risk of developing hypertension.
3.4 Subgroup and interaction analysis
Table 4 presents the subgroup analysis results. Age-stratified subgroup analyses indicated that the high SUA trajectory was associated with a higher risk of hypertension (OR = 1.78, 95% CI 1.04–3.07) in male employees under 45 years of age, compared to a low trajectory. In contrast, no significant association was observed in male employees aged 45 years and older (OR = 2.22, 95% CI 0.89–5.33). Interaction analyses revealed that the dose-response relationship between SUA trajectories and hypertension development risk was modified by age (P for interaction = 0.026).
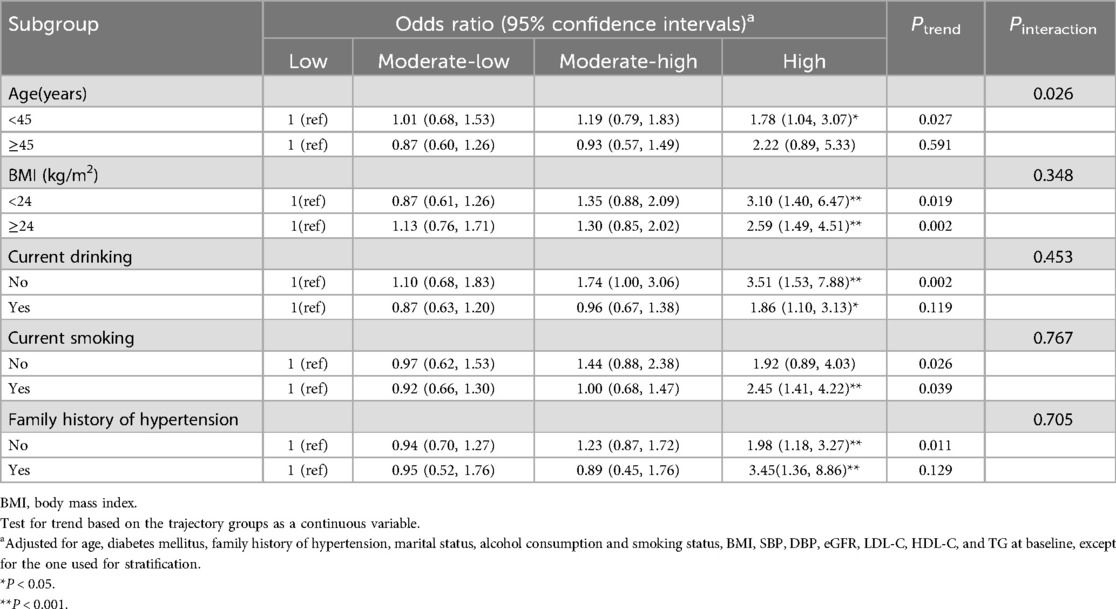
Table 4. Subgroup analyses for the association between serum uric acid trajectories and risk of developing hypertension.
3.5 Sensitivity analysis
As illustrated in Table 5, upon redefining the age cutoffs, the high SUA trajectory was found to be independently associated with an increased risk of developing hypertension in male employees under 40 years of age (OR = 2.17, 95% CI 1.05–4.69). In male employees aged 40 to under 50 years, there was a borderline significant association (OR = 2.07, 95% CI 0.97–4.30, P = 0.053). However, no significant association was observed in male employees aged 50 years and older (OR = 1.22, 95% CI 0.16–6.74).
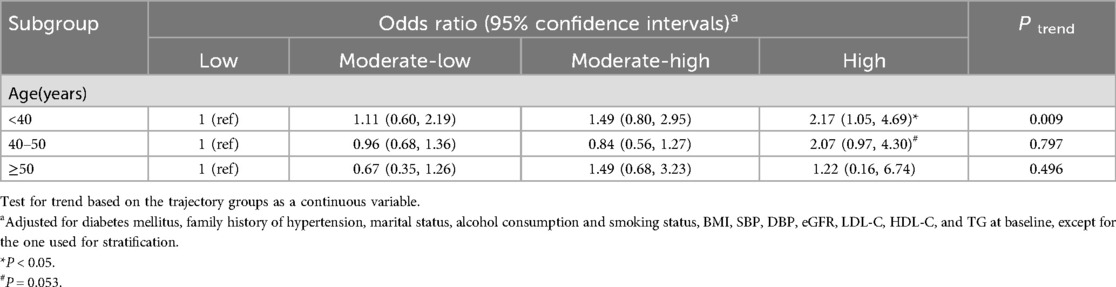
Table 5. Sensitivity analysis for the association between serum uric acid trajectories and hypertension development risk.
4 Discussion
This study utilized GBTM to assess the trajectories of SUA changes among male employees in Southwest China from 2018 to 2021. The SUA change trajectories were classified into four distinct groups. Notably, higher SUA trajectories were found to be associated with an increased risk of developing hypertension, with this association being modified by age. The association between the high SUA trajectory and the risk of developing hypertension was observed in male employees aged 45 years and older, but not in those younger than 45 years.
In this study, as the SUA trajectories increased, the baseline age exhibited a downward trend. This observation aligns with epidemiological surveys in China, which also indicate a trend toward younger onset of hyperuricemia (34). Additionally, in this study, the baseline SUA level was 6.42 ± 1.30 mg/dl, which is notably higher than the levels reported in previous studies (35, 36). This elevation may be associated with factors such as night shift work, irregular diet, insufficient exercise and alcohol consumption among the occupational population (37, 38). The GBTM demonstrated that moderate-high SUA group and high SUA group exhibited SUA levels above the normal range at baseline, and these elevated SUA levels persisted throughout the follow-up period. This pattern implies that individuals within this occupational cohort with hyperuricemia have not adopted measures to lower SUA levels. Previous studies have also found that the majority of individuals with hyperuricemia have not received effective treatment (39, 40). This may be due to the fact that, aside from gout, the harmful effects of hyperuricemia on human health are relatively covert, resulting in inadequate public recognition and insufficient emphasis on the condition.
Our study demonstrated that, compared to the low SUA trajectory, the high SUA trajectory was associated with an increased risk of new-onset hypertension in male employees. This finding is consistent with the work of Ma et al., who also reported that low-increasing and moderate-increasing SUA trajectories was associated with an elevated risk of hypertension (41). These results underscore the importance of monitoring SUA levels over time to better predict and manage the risk of hypertension.
Our study demonstrated that the relationship between SUA trajectories and the risk of new-onset hypertension was modified by age. Specifically, compared to the low SUA trajectory, the high SUA trajectory was significantly associated with an increased risk of developing hypertension in male employees under 45 years of age. However, this association was not statistically significant in male employees aged 45 and older. This finding is similar to a cohort study of Japanese professional men aged 18–64, which reported a significantly higher risk of hypertension in the highest SUA quartile (≥6.7 mg/dl) compared to the lowest (≤5.1 mg/dl). Notably, this significant association was only observed in individuals under 45 years, not in those over 45 (13). However, a prospective cohort study in Japan, which included 26,442 males aged 18–60 years, demonstrated that the association between elevated SUA levels and hypertension was stronger in males aged ≥40 years than in those aged <40 years (15). To further investigate whether different age cutoffs would influence this association, we redefined the age groups in our study. We found that among male employees under 40 years of age, the high SUA trajectory was independently associated with an elevated incidence of hypertension (OR = 2.17, 95% CI 1.05–4.69) compared to the low SUA trajectory. This association tended to be more pronounced in the age group under 40 years compared to the age group under 45 years. Furthermore, a borderline significant association was observed in male employees aged 40–49 years. In the older age subgroup (50 years and above), no significant association was detected. Similarly, a South Korean community-based prospective cohort study of non-hypertensive participants aged 40–79 years, with a mean follow-up of 3.8 years, showed that hyperuricemia significantly increased the risk of incident hypertension in male employees aged 40–49 years. No significant associations were observed in male employees aged 50–59 years or ≥60 years (33). Additionally, two studies focusing on elderly populations have also found no association between SUA levels and the risk of developing hypertension in men (16, 20). Nevertheless, other studies have reported inconsistent findings, suggesting that SUA is associated with the incidence of hypertension in middle-aged and older men as well (14, 42, 43). The potential reasons for these inconsistencies may include the reliance on a single baseline measurement of SUA in some studies, which may fail to account for the dynamic changes in SUA levels over time and thus introduce potential bias. Moreover, the impact of SUA on hypertension appears to vary across different racial groups. For instance, a study comprising 6,399 individuals aged ≥40 years from the U.S. population, utilizing data from the National Health and Nutrition Examination Survey, demonstrated that the association between SUA levels and the incidence of hypertension in men was significant only among Whites, with no significant associations observed among Blacks, Mexican Americans, or other racial groups (43). Future research should encompass large-scale, multinational prospective cohort studies to further substantiate this perspective.
Currently, the potential biological mechanisms underlying why younger men are more susceptible to the hypertensive effects of elevated SUA remain unclear. Several investigations have suggested that the development of hypertension due to elevated SUA occurs through a two-phase process, with the initial phase showing a particularly strong correlation. In this early period, SUA activates the renin-angiotensin system and suppresses neuronal nitric oxide synthase, resulting in heightened renal renin synthesis and reduced systemic nitrate concentrations, which in turn leads to enhanced vasoconstriction (44, 45). A rat model of hyperuricemia, induced by the uric acid oxidase inhibitor oxonic acid, demonstrated a progressive rise in BP over a period of 2–3 weeks. Notably, the early increase in BP observed in this model can be mitigated by discontinuing oxonic acid, administering uric acid-reducing medications, or inhibiting the renin-angiotensin system (46, 47). In the subsequent phase, the persistent increase in SUA levels triggers a cascade of renal pathophysiological alterations. These include the proliferation of vascular smooth muscle cells, reduced compliance of the renal afferent arterioles, and a significant shift in the pressure natriuresis curve. Collectively, these changes result in a form of hypertension that is marked by salt sensitivity and becomes decoupled from uric acid levels. At this stage, hypertension becomes refractory to urate-lowering therapies (48). The pathogenetic mechanisms of hypertension related to hyperuricemia may be more dominant in the earlier stages of hypertension than in the later stages. Additionally, recent studies have shown that with advancing age, senescent vascular endothelial cells (ECs) accumulate progressively. These senescent ECs undergo phenotypic changes that alter the pattern of expressed proteins as well as their morphological and functional characteristics. These alterations in senescent ECs are associated with vascular dysfunction and impairments, such as aortic stiffness, enhanced inflammation, and dysregulated vascular tone, ultimately increasing the risk of cardiovascular diseases, including hypertension (49). Therefore, in middle-aged and older individuals, the impact of age on BP may predominate, while the influence of SUA on BP may diminish. Consequently, it is imperative to address hyperuricemia in younger individuals promptly to mitigate the risk of future hypertension and potentially revert early-stage hypertension.
While this study provides valuable insights, it also has several limitations that warrant consideration. Firstly, the analysis excluded female employees due to their low representation in the railway industry. Secondly, the study population was restricted to adults aged 20–60, as retired railway workers do not participate in annual health examinations. Future research should further investigate the impact of SUA trajectories on BP in men over 60 years of age. Thirdly, although our model accounted for several known confounders associated with hypertension, the influence of unmeasured confounders, such as dietary habits and physical activity, cannot be completely ruled out. Lastly, the relatively short follow-up period is another limitation of this study.
5 Conclusion
Our study confirms that persistent high SUA levels are associated with an increased risk of developing hypertension in males, particularly in younger individuals. Therefore, age-specific management of SUA may be necessary for hypertension prevention, with early intervention in young males likely yielding greater benefits than in middle-aged males.
Data availability statement
The raw data supporting the conclusions of this article will be made available by the authors, without undue reservation.
Ethics statement
The studies involving humans were approved by the Ethics Committee of the Affiliated Hospital of Chengdu University (approval number/ID: PJ 2019-015-02). The studies were conducted in accordance with the local legislation and institutional requirements. The participants provided their written informed consent to participate in this study.
Author contributions
ML: Formal analysis, Writing – original draft, Data curation, Conceptualization, Investigation, Funding acquisition, Writing – review & editing. BY: Data curation, Formal analysis, Writing – review & editing, Methodology, Writing – original draft. JP: Funding acquisition, Writing – review & editing, Investigation. CD: Investigation, Data curation, Writing – review & editing. HZ: Writing – review & editing, Investigation, Supervision, Project administration. SY: Formal analysis, Project administration, Conceptualization, Supervision, Writing – review & editing, Data curation.
Funding
The author(s) declare that financial support was received for the research and/or publication of this article. This study was supported by the Chengdu Medical Research Project (Grant No. 2024640); Medical Research Project of Jinniu District, Chengdu, Sichuan Province (Grant No. JNKY 2024-12); natural science project of Clinical Medical College & Affiliated Hospital of Chengdu University (Grant No. Y202233); Youth Fund Project of Chengdu University (Grant No. 2018XZB13).
Acknowledgments
The authors thank all members of Chengdu University Hospital Health Management for their contributions, as well as the employees of China Railway Chengdu Bureau Group Co. for their cooperation and support.
Conflict of interest
The authors declare that the research was conducted in the absence of any commercial or financial relationships that could be construed as a potential conflict of interest.
Generative AI statement
The author(s) declare that no Generative AI was used in the creation of this manuscript.
Publisher's note
All claims expressed in this article are solely those of the authors and do not necessarily represent those of their affiliated organizations, or those of the publisher, the editors and the reviewers. Any product that may be evaluated in this article, or claim that may be made by its manufacturer, is not guaranteed or endorsed by the publisher.
Abbreviations
SUA, serum uric acid; GBTM, group-based trajectory modeling; BP, blood pressure; SBP, systolic blood pressure; DBP, diastolic blood pressure; ESC, European Society of Cardiology; BMI, body mass index; LDL-C, low-density lipoprotein cholesterol; HDL-C, high-density lipoprotein cholesterol; TG, triglycerides; eGFR, estimated glomerular filtration rate; FPG, fasting plasma glucose; TC, total cholesterol; Scr, serum creatinine; WHO, World Health Organization; BIC, Bayesian information criterion; APPA, average posterior probability assignment; VIF, variance inflation factor; P25, 25th percentile; P75, 75th percentile; Ref, reference; OR, odds ratios; CI, confidence intervals.
References
1. Dehlin M, Jacobsson L, Roddy E. Global epidemiology of gout: prevalence, incidence, treatment patterns and risk factors. Nat Rev Rheumatol. (2020) 16(7):380–90. doi: 10.1038/s41584-020-0441-1
2. Chen-Xu M, Yokose C, Rai SK, Pillinger MH, Choi HK. Contemporary prevalence of gout and hyperuricemia in the United States and decadal trends: the national health and nutrition examination survey, 2007–2016. Arthritis Rheumatol. (2019) 71(6):991–9. doi: 10.1002/art.40807
3. Zhang M, Zhu X, Wu J, Huang Z, Zhao Z, Zhang X, et al. Prevalence of hyperuricemia among Chinese adults: findings from two nationally representative cross-sectional surveys in 2015–16 and 2018–19. Front Immunol. (2021) 12:791983. doi: 10.3389/fimmu.2021.791983
4. The Chinese National Health Commission. The Nutrition and Health Status of the Chinese People (2020 Report). Beijing: People's Medical Publishing House (2020). Available online at: http://www.scio.gov.cn/xwfbh/xwbfbh/wqfbh/42311/44583/wz44585/Document/1695276/1695276.htm (Accessed December 20, 2021).
5. Thomopoulos C, Parati G, Zanchetti A. Effects of blood-pressure-lowering treatment on outcome incidence. 12. Effects in individuals with high-normal and normal blood pressure: overview and meta-analyses of randomized trials. J Hypertens. (2017) 35(11):2150–60. doi: 10.1097/HJH.0000000000001547
6. Liu L, Gu Y, Li C, Zhang Q, Meng G, Wu H, et al. Serum uric acid is an independent predictor for developing prehypertension: a population-based prospective cohort study. J Hum Hypertens. (2017) 31(2):116–20. doi: 10.1038/jhh.2016.48
7. Sundstrom J, Sullivan L, D’Agostino RB, Levy D, Kannel WB, Vasan RS. Relations of serum uric acid to longitudinal blood pressure tracking and hypertension incidence. Hypertension. (2005) 45(1):28–33. doi: 10.1161/01.HYP.0000150784.92944.9a
8. Tatsumi Y, Asayama K, Morimoto A, Satoh M, Sonoda N, Miyamatsu N, et al. Hyperuricemia predicts the risk for developing hypertension independent of alcohol drinking status in men and women: the Saku study. Hypertens Res. (2020) 43(5):442–9. doi: 10.1038/s41440-019-0361-0
9. Xu J, Zhao J, Gu J, Wang W, Chen J. Serum uric acid levels as a causal factor in hypertension: insights from Mendelian randomization analysis. Clin Exp Hypertens. (2025) 47(1):2496514. doi: 10.1080/10641963.2025.2496514
10. Jiang Y, Yu J, Zhang Q, Ren L, He Y, Li J, et al. Microalbuminuria mediates the association between serum uric acid and elevation of blood pressure: a longitudinal analysis in the Gusu cohort. J Hypertens. (2020) 38(4):625–32. doi: 10.1097/HJH.0000000000002316
11. Tian X, Chen S, Wang P, Xu Q, Zhang Y, Zhang X, et al. Temporal relationship between hyperuricemia and hypertension and its impact on future risk of cardiovascular disease. Eur J Intern Med. (2023) 111:82–9. doi: 10.1016/j.ejim.2023.02.023
12. Borghi C, Agnoletti D, Cicero AFG, Lurbe E, Virdis A. Uric acid and hypertension: a review of evidence and future perspectives for the management of cardiovascular risk. Hypertension. (2022) 79(9):1927–36. doi: 10.1161/HYPERTENSIONAHA.122.17956
13. Kansui Y, Matsumura K, Morinaga Y, Inoue M, Kiyohara K, Ohta Y, et al. Impact of serum uric acid on incident hypertension in a worksite population of Japanese men. J Hypertens. (2018) 36(7):1499–505. doi: 10.1097/HJH.0000000000001743
14. Han Y, Han K, Han X, Yin Y, Di H, Wu J, et al. Serum uric acid might be positively associated with hypertension in Chinese adults: an analysis of the China health and nutrition survey. Front Med (Lausanne). (2021) 8:755509. doi: 10.3389/fmed.2021.755509
15. Yokoi Y, Kondo T, Okumura N, Shimokata K, Osugi S, Maeda K, et al. Serum uric acid as a predictor of future hypertension: stratified analysis based on body mass index and age. Prev Med. (2016) 90:201–6. doi: 10.1016/j.ypmed.2016.07.007
16. Forman JP, Choi H, Curhan GC. Plasma uric acid level and risk for incident hypertension among men. J Am Soc Nephrol. (2007) 18(1):287–92. doi: 10.1681/ASN.2006080865
17. Cheang C, Law S, Ren J, Chan W, Wang C, Dong Z. Prevalence of hyperuricemia in patients with severe obesity and the relationship between serum uric acid and severe obesity: a decade retrospective cross-section study in Chinese adults. Front Public Health. (2022) 10:986954. doi: 10.3389/fpubh.2022.986954
18. Wei F, Sun N, Cai C, Feng S, Tian J, Shi W, et al. Associations between serum uric acid and the incidence of hypertension: a Chinese senior dynamic cohort study. J Transl Med. (2016) 14(1):110. doi: 10.1186/s12967-016-0866-0
19. Wen X, Zhang Y, Gu J, Wang Y. Age- and gender-specific dynamics of hyperuricemia: a longitudinal community study on metabolic trajectories and comorbidity stratification. Int J Rheum Dis. (2025) 28(5):e70254. doi: 10.1111/1756-185X.70254
20. Sasaki N, Ueno Y, Ozono R, Yoshimura K, Nakano Y, Higashi Y. Association of serum uric acid levels with blood pressure and the incidence of hypertension in the middle-aged and elderly populations. J Hypertens. (2024) 42(2):292–300. doi: 10.1097/HJH.0000000000003597
21. Zhu J, Shen L, Jia S, Wang W, Xiong Y. The role of uric acid in the risk of hypertension developed from prehypertension: a five-year Chinese urban cohort study. Arch Public Health. (2024) 82(1):185. doi: 10.1186/s13690-024-01421-2
22. Liu D, Zheng X, Zhu J, Yang J, Lu L, Ji X, et al. Gender-specific association between serum uric acid levels and hypertension in east China: a cross-sectional study. BMC Public Health. (2025) 25(1):944. doi: 10.1186/s12889-025-22064-0
23. Nagin DS, Jones BL, Elmer J. Recent advances in group-based trajectory modeling for clinical research. Annu Rev Clin Psychol. (2024) 20(1):285–305. doi: 10.1146/annurev-clinpsy-081122-012416
24. Fu Y, Yu B, Yang B, Pan J, Feng C, Jia P, et al. Association between chronotype and metabolic-associated fatty liver disease in employed adults: a longitudinal study in southwestern China. Chronobiol Int. (2023) 40(12):1557–65. doi: 10.1080/07420528.2023.2285316
25. McEvoy JW, McCarthy CP, Bruno RM, Brouwers S, Canavan MD, Ceconi C, et al. 2024 ESC guidelines for the management of elevated blood pressure and hypertension. Eur Heart J. (2024) 45(38):3912–4018. doi: 10.1093/eurheartj/ehae178
26. Yu C, Ren X, Pan L, Zhao H, Wang Y, Chang L, et al. Association between serum uric acid and hypertension in Han and Yugur of Gansu province: the China national health survey. Kidney Blood Press Res. (2021) 46(6):723–33. doi: 10.1159/000518768
27. McDermott G, Fu X, Stone JH, Wallwork R, Zhang Y, Choi HK, et al. Association of cigarette smoking with antineutrophil cytoplasmic antibody-associated vasculitis. JAMA Intern Med. (2020) 180(6):870–6. doi: 10.1001/jamainternmed.2020.0675
28. World Health Organization (WHO) & International Diabetes Federation (IDF). Definition and Diagnosis of Diabetes Mellitus and Intermediate Hyperglycemia: Report of a WHO/IDF Consultation. Geneva: World Health Organization (2006).
29. Cockcroft DW, Gault MH. Prediction of creatinine clearance from serum creatinine. Nephron. (1976) 16(1):31–41. doi: 10.1159/000180580
30. Lennon H, Kelly S, Sperrin M, Buchan I, Cross AJ, Leitzmann M, et al. Framework to construct and interpret latent class trajectory modelling. BMJ Open. (2018) 8(7):e020683. doi: 10.1136/bmjopen-2017-020683
31. Xin F, He S, Zhou Y, Jia X, Zhao Y, Zhao H. The triglyceride glucose index trajectory is associated with hypertension: a retrospective longitudinal cohort study. Cardiovasc Diabetol. (2023) 22(1):347. doi: 10.1186/s12933-023-02087-w
32. Hu Y, Wang Z, He H, Pan L, Tu J, Shan G. Prevalence and patterns of multimorbidity in China during 2002–2022: a systematic review and meta-analysis. Ageing Res Rev. (2024) 93:102165. doi: 10.1016/j.arr.2023.102165
33. Kim W, Go TH, Kang DO, Lee J, Choi JY, Roh SY, et al. Age and sex dependent association of uric acid and incident hypertension. Nutr Metab Cardiovasc Dis. (2021) 31(4):1200–8. doi: 10.1016/j.numecd.2020.12.015
34. Wu J, Qiu L, Cheng XQ, Xu T, Wu W, Zeng XJ, et al. Hyperuricemia and clustering of cardiovascular risk factors in the Chinese adult population. Sci Rep. (2017) 7(1):5456. doi: 10.1038/s41598-017-05751-w
35. She D, Wang Y, Liu J, Luo N, Feng S, Li Y, et al. Changes in the prevalence of hyperuricemia in clients of health examination in eastern China, 2009 to 2019. BMC Endocr Disord. (2022) 22(1):202. doi: 10.1186/s12902-022-01118-z
36. Chang DY, Wang JW, Chen M, Zhang LX, Zhao MH. Association between serum uric acid level and mortality in China. Chin Med J (Engl). (2021) 134(17):2073–80. doi: 10.1097/CM9.0000000000001631
37. Yang B, Feng CT, Yu WJ, Dong S, Fu Y, Yu B, et al. Association and mediation effect analysis of night shift work and metabolic syndrome in railroad occupational population. Mod Prev Med. (2023) 50(02):239–244 +262. doi: 10.20043/j.cnki.MPM.202207260
38. Dong H, Cao Y, Ding X, Yan T, Zhou C, Bi M, et al. The influence of night shift work and associated factors on serum uric acid in aircraft maintenance workers. BMC Public Health. (2024) 24(1):1969. doi: 10.1186/s12889-024-18849-4
39. Ma Z, Xu C, Kang X, Zhang S, Li H, Tao L, et al. Changing trajectories of serum uric acid and risk of non-alcoholic fatty liver disease: a prospective cohort study. J Transl Med. (2020) 18(1):133. doi: 10.1186/s12967-020-02296-x
40. Huang SN, Lin ZJ, Zhang B, Niu HJ, Zhang XM, Wang XJ, et al. Follow-up survey 2011–2014 on 379 patients of hyperuricemia in occupational population. Med Rec. (2016) 22(01):147–50. doi: 10.3969/j.issn.1006-2084.2016.01.042
41. Ma H, Wang X, Guo X, Li X, Qi L, Li Y. Distinct uric acid trajectories are associated with different risks of incident hypertension in middle-aged adults. Mayo Clin Proc. (2019) 94(4):611–9. doi: 10.1016/j.mayocp.2018.08.042
42. Shankar A, Klein R, Klein BE, Nieto FJ. The association between serum uric acid level and long-term incidence of hypertension: population-based cohort study. J Hum Hypertens. (2006) 20(12):937–45. doi: 10.1038/sj.jhh.1002095
43. Xu X, Huang J, Wu S, Ji Q, Guo X, Huang Y. The association between the serum uric acid level and hypertension in middle-aged and elderly adults. Cardiovasc Ther. (2021) 2021:4626062. doi: 10.1155/2021/4626062
44. Sautin YY, Nakagawa T, Zharikov S, Johnson RJ. Adverse effects of the classic antioxidant uric acid in adipocytes: NADPH oxidase-mediated oxidative/nitrosative stress. Am J Physiol Cell Physiol. (2007) 293(2):C584–96. doi: 10.1152/ajpcell.00600.2006
45. Sanchez-Lozada LG, Tapia E, Lopez-Molina R, Nepomuceno T, Soto V, Avila-Casado C, et al. Effects of acute and chronic L-arginine treatment in experimental hyperuricemia. Am J Physiol Renal Physiol. (2007) 292(4):F1238–44. doi: 10.1152/ajprenal.00164.2006
46. Mazzali M, Hughes J, Kim YG, Jefferson JA, Kang DH, Gordon KL, et al. Elevated uric acid increases blood pressure in the rat by a novel crystal-independent mechanism. Hypertension. (2001) 38(5):1101–6. doi: 10.1161/hy1101.092839
47. Mazzali M, Kanellis J, Han L, Feng L, Xia YY, Chen Q, et al. Hyperuricemia induces a primary renal arteriolopathy in rats by a blood pressure-independent mechanism. Am J Physiol Renal Physiol. (2002) 282(6):F991–7. doi: 10.1152/ajprenal.00283.2001
48. De Becker B, Borghi C, Burnier M, van de Borne P. Uric acid and hypertension: a focused review and practical recommendations. J Hypertens. (2019) 37(5):878–83. doi: 10.1097/HJH.0000000000001980
Keywords: hypertension, serum uric acid, changing trajectory, age differences, group-based trajectory modeling
Citation: Li M, Yu B, Pan J, Dong C, Zeng H and Yang S (2025) Associations of serum uric acid trajectories with hypertension risk: exploring differences between age groups. Front. Cardiovasc. Med. 12:1594142. doi: 10.3389/fcvm.2025.1594142
Received: 15 March 2025; Accepted: 23 June 2025;
Published: 4 July 2025.
Edited by:
Harry H. X. Wang, Sun Yat-sen University, ChinaReviewed by:
Chonin Cheang, Macau Society for Health Economics, Macao SAR, ChinaWei Zhong, Jiangsu University, China
Jinjie Zhang, Zhengzhou University, China
Copyright: © 2025 Li, Yu, Pan, Dong, Zeng and Yang. This is an open-access article distributed under the terms of the Creative Commons Attribution License (CC BY). The use, distribution or reproduction in other forums is permitted, provided the original author(s) and the copyright owner(s) are credited and that the original publication in this journal is cited, in accordance with accepted academic practice. No use, distribution or reproduction is permitted which does not comply with these terms.
*Correspondence: Shujuan Yang, cmVraW55QDEyNi5jb20=; Honglian Zeng, emVuZ2hvbmdsaWFuaGxAMTYzLmNvbQ==
†These authors have contributed equally to this work and share first authorship