Abstract
Background:
Malnutrition is increasingly recognized as a modifiable prognostic factor in myocardial infarction (MI), yet traditional nutritional assessment methods often fail to adequately capture lipid-related atherogenic risk. We introduced an innovative modified Controlling Nutritional Status (mCONUT) score, which replaces total cholesterol with non-HDL cholesterol, aiming to improve the stratification of atherosclerotic risk and to assess its prognostic utility in predicting MI outcomes.
Methods:
In this retrospective cohort study, we analyzed a total of 3,730 patients diagnosed with MI, extracted from the MIMIC-IV database, and stratified them into Normal, Mild, and Worse groups based on the mCONUT score. After performing 1:1:1 propensity score matching, we selected 993 patients for comparative analysis. Multivariable Cox proportional hazards models, adjusted for clinical and demographic confounders, were employed to evaluate all-cause mortality at 180 days and 1 year.
Results:
Among 993 MI patients, the median age was 75 years (IQR 68–82) with 58.4% males (n = 580). Malnutrition severity (mCONUT ≥6) stratified prognostic risk: Worse group demonstrated progressive mortality increases (180-day: 13.9% vs. Normal 7.85%, p = 0.037; 1-year: 31.4% vs. 21.2%, p = 0.011), alongside lower BMI, extended hospitalization, reduced hypertension, higher CKD incidence, and diminished revascularization (all p < 0.05). Multivariable analyses confirmed graded mortality risk: 180-day (Model 1: adjusted HR 1.58, p = 0.009; Model 2: HR 1.46, p = 0.031) and 1-year (Model 1: HR 1.61, p = 0.002; Model 2: HR 1.52, p = 0.008). Consistency across subgroups was observed, with heightened vulnerability in males, hypertensives (interaction p = 0.004), diabetes and non-white individuals.
Conclusions:
The mCONUT score has emerged as a robust multidimensional biomarker for predicting MI prognosis, with worse malnutrition (mCONUT ≥ 6) being significantly associated with a 46%–61% elevation in mortality risk, demonstrating a clear linear dose-response relationship. Routine screening and tailored nutritional interventions should be prioritized in modern MI management practices.
1 Introduction
Cardiovascular disease (CVD) continues to be the leading cause of death worldwide, accounting for an estimated 18 million fatalities each year, as reported by the World Health Organization (1). In China, CVD accounted for over 40% of all deaths in 2016 (2), a trend that has been further aggravated by population aging and the widespread adoption of unhealthy lifestyles. Myocardial infarction (MI), recognized as the most acute and life-threatening manifestation of CVD, continues to pose a substantial residual risk, even in the face of significant advances in reperfusion therapies and secondary prevention measures. Despite the decline in 1-year mortality from 30% in the pre-reperfusion era to 3%–8% in current clinical practice (3), the consistently high rate of recurrent cardiovascular events—especially among younger populations (4)—highlights an urgent need for innovative prognostic biomarkers. Growing evidence has identified malnutrition as a pivotal, modifiable risk factor significantly impacting cardiovascular outcomes.
Recent epidemiological studies have shown that 20%–50% of hospitalized patients and as many as 78% of critically ill individuals present with varying levels of malnutrition (5, 6). Among MI patients, almost half experience nutritional deficiencies, with 11.2% exhibiting moderate-to-severe malnutrition, as assessed using the Controlling Nutritional Status (CONUT) score (7). Originally proposed in 2005 (8), the CONUT score is a composite nutritional assessment tool incorporating serum albumin, total lymphocyte count, and total cholesterol (TC). Although validated across various cardiovascular populations (9–14), recent meta-analyses have highlighted significant limitations in its prognostic accuracy specifically for MI cohorts (15). Specifically, the inclusion of high-density lipoprotein cholesterol (HDL-C) within total cholesterol—a component known to be inversely associated with atherosclerotic risk (16)—may paradoxically reduce the score's ability to accurately capture atherogenic lipid burden.
To resolve this pathophysiological inconsistency, we established a modified CONUT (mCONUT) score by replacing TC with non-HDL cholesterol (TC minus HDL-C), aiming to enhance the score's specificity for identifying pro-atherogenic lipid profiles without compromising its capacity to assess nutritional status. This study seeks to explore the prognostic value of the mCONUT score in MI patients and to identify potential clinical applications for nutritional risk stratification within modern MI management strategies.
2 Materials and methods
2.1 MIMIC-IV database
This retrospective cohort study was conducted using the MIMIC-IV database (17), a comprehensive, publicly available dataset that provides detailed diagnostic, therapeutic, and nursing information for patients admitted to the emergency department and intensive care unit of Beth Israel Deaconess Medical Center (Boston, MA, USA).
The study protocol was reviewed and approved by the Institutional Review Boards of the Massachusetts Institute of Technology (Cambridge, MA, USA) and Beth Israel Deaconess Medical Center (Boston, MA, USA) (IRB approval number: 53015455). Given the study's retrospective design, the need for informed consent was waived by the Institutional Review Boards.
2.2 Study population
The study cohort was sourced from the MIMIC-IV database (v2.2), consisting of adult patients with a confirmed diagnosis of myocardial infarction (MI), identified using validated ICD-9 (410.00–410.92) and ICD-10 (I21-I22.9) codes. An initial screening process identified 9,698 MI cases, encompassing both ST-elevation (STEMI) and non-ST-elevation (NSTEMI) myocardial infarction subtypes. Systematic exclusion criteria were implemented as follows: (1) active malignancy (ICD codes C00-C97, n = 387), (2) decompensated liver cirrhosis (K70.3, K71.1, K72.1, K76.7, n = 77), (3) pregnancy (O09-O99, n = 2), and (4) incomplete nutritional or laboratory data (>30% missing, n = 5,502). Following exclusion, a final analytic cohort of 3,730 patients was established. Patients were stratified into three nutritional risk categories based on mCONUT thresholds: Normal (n = 2,122, 56.9%), Mild (n = 692, 18.6%), and Worse (n = 916, 24.5%). Baseline characteristics of the final cohort (3,730) are detailed in Supplementary Table.
To mitigate selection bias, 1:1:1 propensity score matching (PSM) with a caliper of 0.02 was applied, using age, gender, race, BMI, comorbidities, procedures, medications, and laboratory data as matching variables, resulting in well-balanced subgroups of 331 patients in each category (total n = 993). A detailed flowchart illustrating the patient selection process is presented in Figure 1.
Figure 1
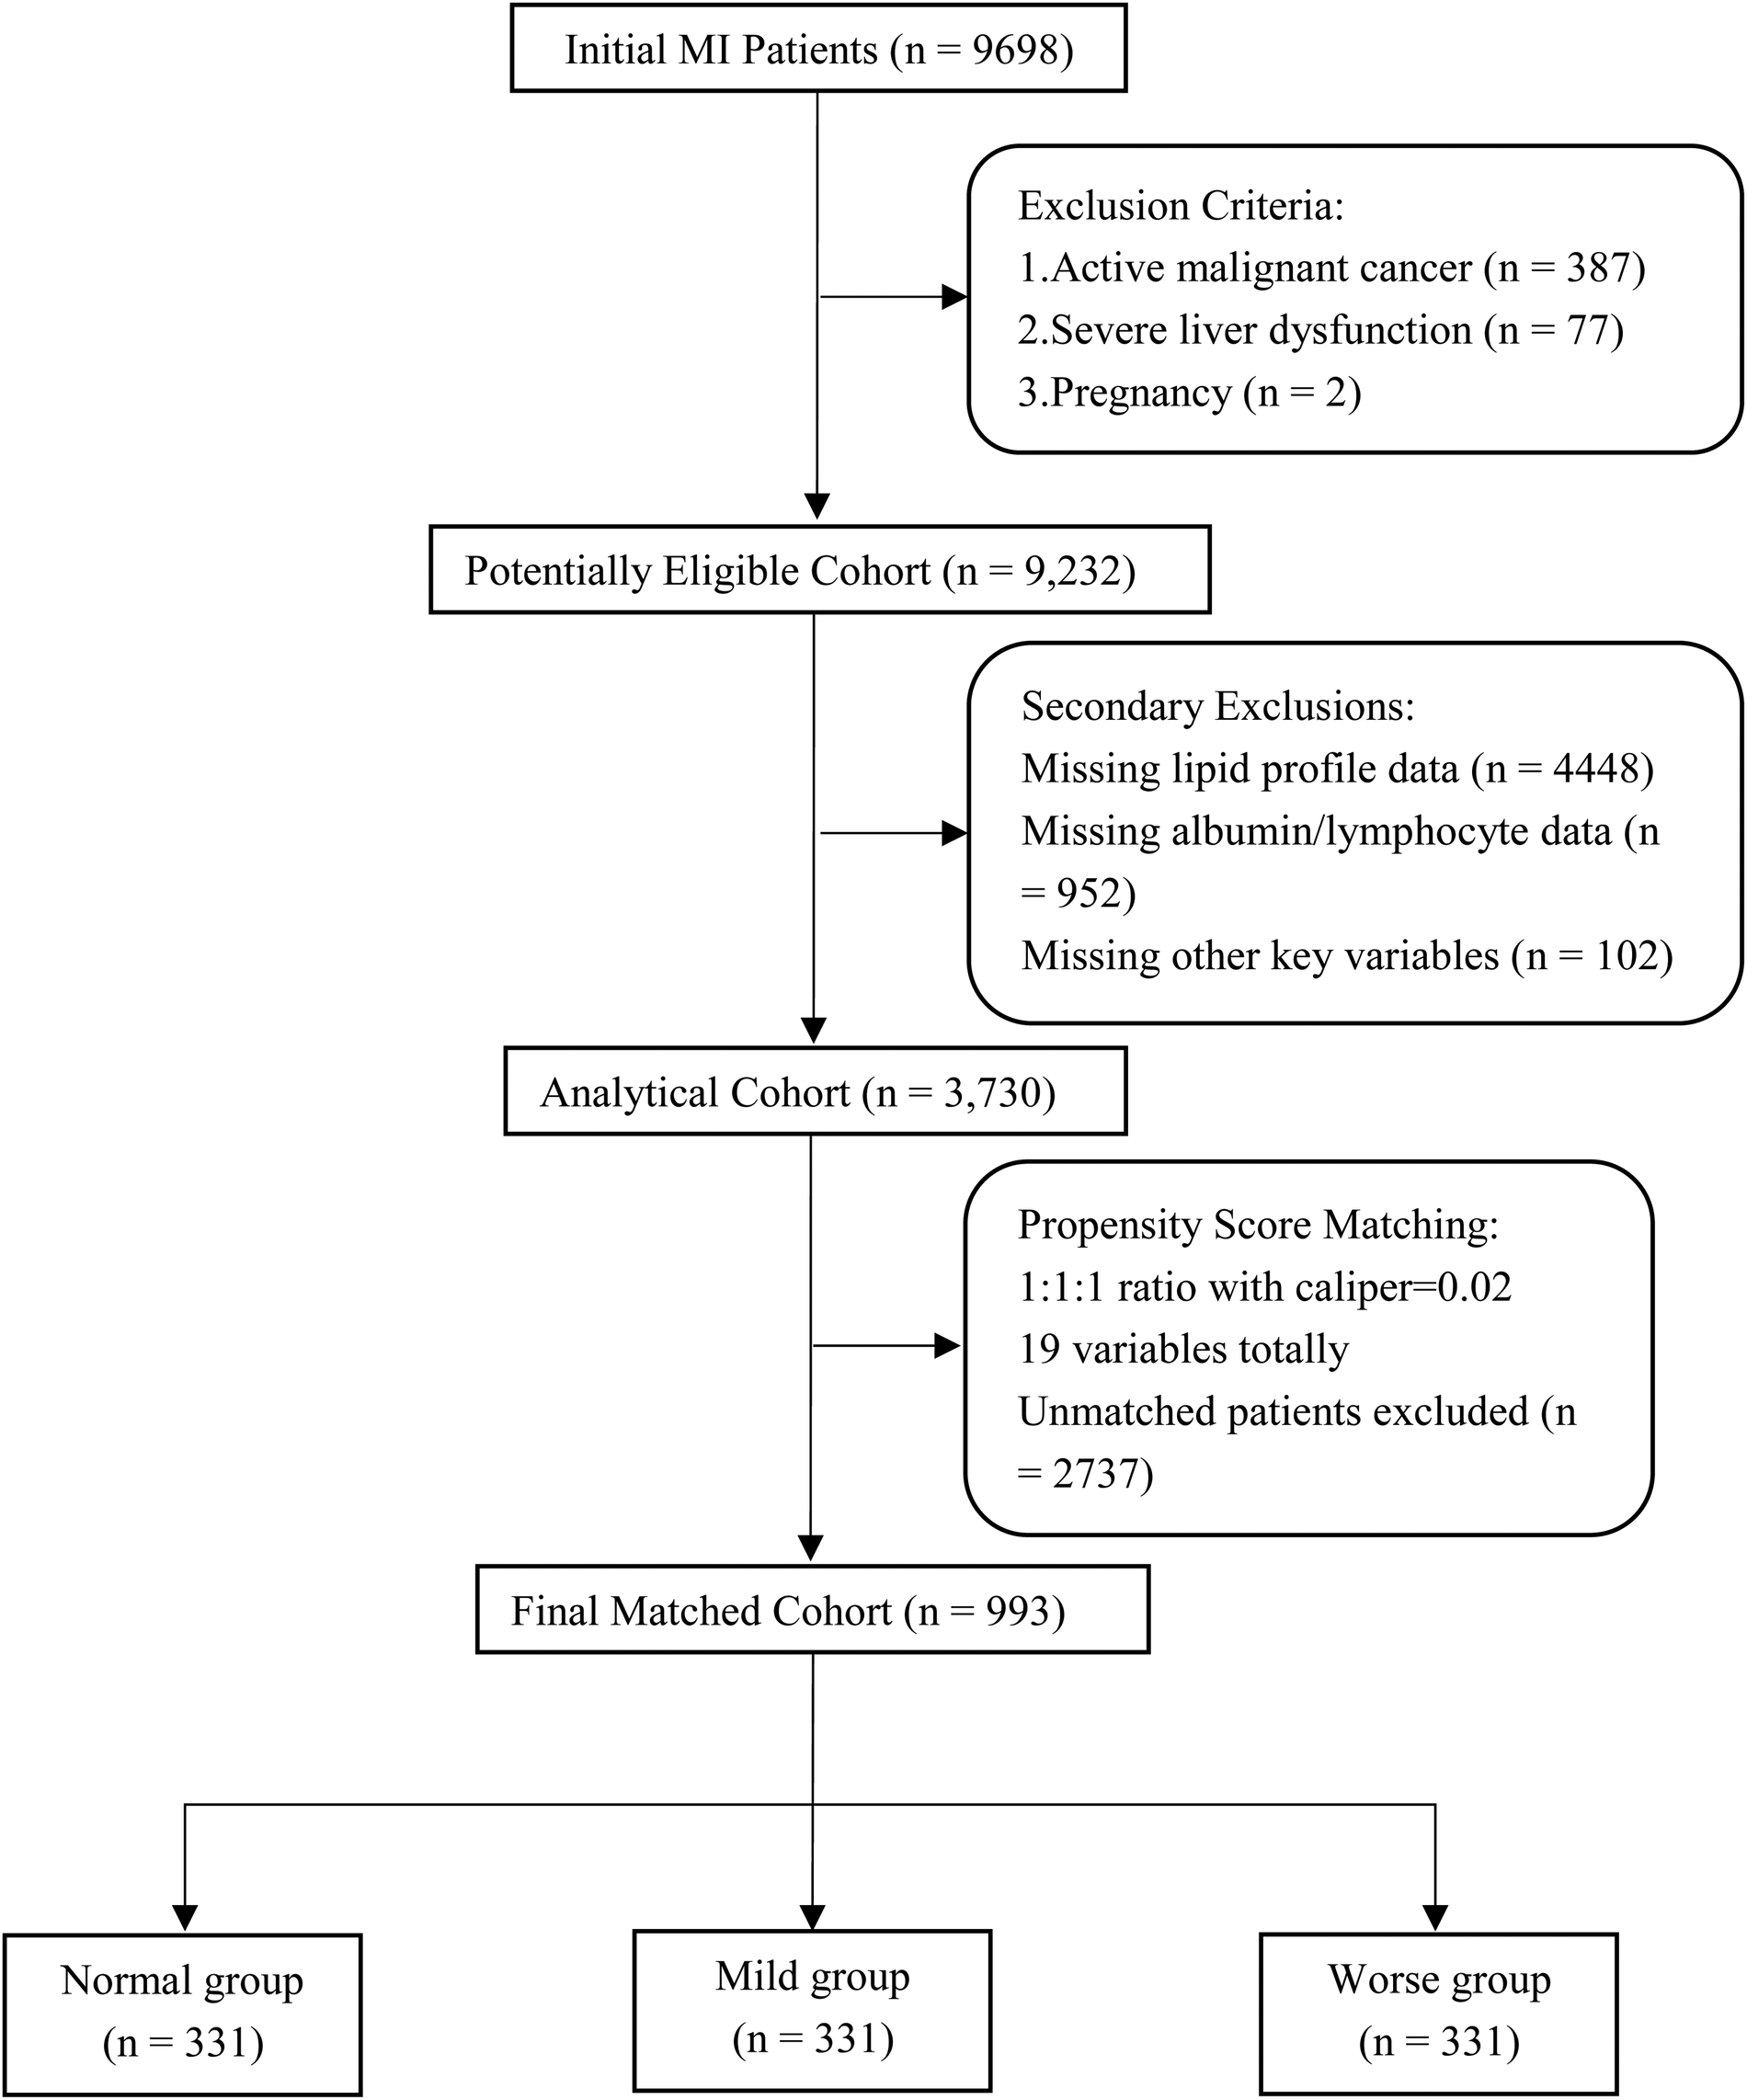
Search process and grouping of the included patients in the MIMIC-IV 2.2 database. MI, myocardial infarction;19 variables including age, gender, race, BMI (body mass index), comorbidities, procedures, medications and laboratory data.
2.3 Clinical data
For the final propensity-matched cohort, hospitalization records of MI patients were extracted using subject_id and hadm_id, which serve as unique identifiers for patient identity and hospital admission, respectively. For laboratory parameters measured repeatedly during hospitalization, only the initial test results recorded after admission were considered for analysis to ensure consistency.
Data extraction was systematically categorized into five domains: (1) Demographic Characteristics: age, sex, race, body mass index (BMI). (2) Comorbidities: hypertension, diabetes mellitus (DM), peripheral arterial disease (PAD), chronic kidney disease (CKD), stroke, atrial fibrillation (AF). (3) Therapeutic Interventions: percutaneous coronary intervention (PCI), coronary artery bypass grafting (CABG). (4) Medication Administration: vasoactive agents (VA), anti-platelet therapy (APT), beta-blockers (BB), renin-angiotensin system inhibitors (RASi), and statins. (5) Laboratory Parameters: complete blood count, comprehensive biochemical profile, and lipid panel.
Prognostic outcomes, including survival status and time-to-event data, were meticulously documented for subsequent analysis. Baseline characteristics of the study population are comprehensively summarized in Table 1.
Table 1
| Variables | Normal | Mild | Worse | p |
|---|---|---|---|---|
| (n = 331) | (n = 331) | (n = 331) | ||
| Demographic data | ||||
| Male, n (%) | 192 (58.01) | 209 (63.14) | 179 (54.08) | 0.06 |
| Age, years | 74.0 (67.0, 83.5) | 74.0 (64.0, 84.0) | 76.0 (65.0, 83.0) | 0.705 |
| BMI, kg/m2 | 27.80 (25.15, 31.95) | 26.10 (24.10, 30.25) | 26.10 (23.15, 29.80) | <.001 |
| White, n (%) | 75 (22.66) | 87 (26.28) | 97 (29.31) | 0.149 |
| LoH, days | 7.0 (3.0, 14.0) | 6.0 (3.0, 11.0) | 9.0 (5.0, 14.0) | <.001 |
| Comorbidities | ||||
| HT, n (%) | 151 (45.62) | 136 (41.09) | 109 (32.93) | 0.003 |
| DM, n (%) | 136 (41.09) | 142 (42.90) | 152 (45.92) | 0.448 |
| PAD, n (%) | 63 (19.03) | 57 (17.22) | 69 (20.85) | 0.494 |
| CKD, n (%) | 101 (30.51) | 108 (32.63) | 130 (39.27) | 0.046 |
| Stroke, n (%) | 30 (9.06) | 46 (13.90) | 37 (11.18) | 0.146 |
| AF, n (%) | 104 (31.42) | 112 (33.84) | 118 (35.65) | 0.513 |
| Procedures | ||||
| PCI, n (%) | 163 (49.24) | 181 (54.68) | 145 (43.81) | 0.02 |
| CABG, n (%) | 74 (22.36) | 43 (12.99) | 24 (7.25) | <.001 |
| Medications | ||||
| VA, n (%) | 118 (35.65) | 98 (29.61) | 109 (32.93) | 0.252 |
| APT, n (%) | 304 (91.29) | 314 (94.29) | 309 (92.79) | 0.377 |
| BB, n (%) | 285 (86.10) | 301 (90.94) | 293 (88.52) | 0.149 |
| RASi, n (%) | 133 (40.18) | 153 (46.22) | 137 (41.39) | 0.251 |
| Statin, n (%) | 297 (89.73) | 297 (89.73) | 292 (88.22) | 0.77 |
| Laboratory data | ||||
| Hb, g/dl | 11.60 (10.25, 13.00) | 11.20 (9.90, 12.40) | 10.30 (8.85, 11.57) | <.001 |
| Plt, 109/L | 224.0 (186.5, 280.0) | 206.0 (156.0, 256.5) | 214.0 (165.5, 277.0) | <.001 |
| Scr, mg/dl | 1.10 (0.90, 1.65) | 1.20 (0.90, 1.85) | 1.40 (1.00, 2.30) | <.001 |
| TB, mg/dl | 0.50 (0.30, 0.80) | 0.50 (0.40, 0.80) | 0.50 (0.30, 0.80) | 0.805 |
| Cl, mmol/L | 102.0 (99.0, 105.0) | 103.0 (100.0, 106.0) | 103.0 (100.0, 106.0) | 0.118 |
| ALT, U/L | 24.0 (16.0, 40.0) | 25.0 (17.0, 43.0) | 25.0 (15.0, 54.0) | 0.698 |
| Alb, g/dl | 3.90 (3.70,4.20) | 3.50 (3.30,3.70) | 3.00 (2.70,3.20) | <.001 |
| Lym, 109/L | 1.59 (1.27,2.05) | 1.24 (0.92,1.68) | 1.08 (0.85,1.55) | <.001 |
| HDL, mg/dl | 48.00 (36.00,56.50) | 44.00 (36.00,55.50) | 44.00 (34.00,54.00) | 0.021 |
| TC, mg/dl | 170.0 (143.0,202.5) | 146.0 (122.0,176.0) | 133.0 (110.0,169.0) | <.001 |
| NewTC, mg/dl | 48.00 (36.00,56.50) | 44.00 (36.00,55.50) | 44.00 (34.00,54.00) | <.001 |
| mCONUT | 2.0 (1.0,3.0) | 4.00 (4.0,5.0) | 7.0 (6.0,8.0) | <.001 |
| Prognosis | ||||
| 180d-d, n (%) | 26 (7.85) | 33 (9.97) | 46 (13.90) | 0.037 |
| 365d-d, n (%) | 70 (21.15) | 88 (26.59) | 104 (31.42) | 0.011 |
Baseline characteristics for final matched cohort divided by mCONUT.
BMI, body mass index; LoH, length of hospital stay; HT, hypertension; DM, diabetes mellitus; PAD, peripheral artery diseases; CKD, chronic kidney disease; AF, atrial fibrillation; PCI, percutaneous coronary intervention; CABG, coronary artery bypass grafting; VA, vasoactive agents; APT, antiplatelet therapy; BB, beta blockers; RASi, renin-angiotensin-aldosterone system inhibitors; Hb, hemoglobin; Plt, platelet; Scr, serum creatinine; TB, total bilirubin; Cl, chlorine; ALT, alanine aminotransferase; Alb, albumin; Lym, lymphocyte count; HDL, high-density lipoprotein cholesterol; TC, total cholesterol; NewTC, non-high-density lipoprotein cholesterol (calculated as TC—HDL-C); mCONUT, modified controlling nutritional status scoring; 180d-d, death of 180 days after admission; 365d-d, death of 1 year after admission.
2.4 Modified CONUT score and follow-up endpoints
The mCONUT score is an optimized nutritional assessment tool that replaces total cholesterol (TC) with non-HDL cholesterol (TC minus HDL-C), addressing a critical pathophysiological inconsistency in MI cohorts. By eliminating HDL-C—a protective, anti-atherogenic lipid—the mCONUT score focuses exclusively on pro-atherogenic lipids (e.g., LDL-C, remnant cholesterol), thereby enhancing its capacity to evaluate malnutrition in the context of atherosclerosis-driven prognosis.
Optimal thresholds for albumin, lymphocyte count, and non-HDL cholesterol were determined using restricted cubic spline (RCS) analysis (Supplementary Figures), ensuring data-driven cutoff values. Each of the three biomarkers demonstrated statistically significant nonlinear associations with mortality (p < 0.001 for knot transitions), with inflection points objectively determined as optimal cutoffs.
The mCONUTscore is calculated by summing points assigned to three laboratory parameters: albumin (>3.7 g/dl = 0; 3.4–3.7 = 2; 3.0–3.4 = 4; <3.0 = 6), lymphocyte count (>1,500/μl = 0; 1,100–1,500 = 1; 700–1,100 = 2; <700 = 3), and non-HDL cholesterol (>110 mg/dl = 0; 90–110 = 1; 60–90 = 2; <60 = 3). The total score classifies nutritional risk: 0–3 indicates mild malnutrition, 4–5 moderate malnutrition, and 6–12 severe malnutrition, as outlined in Table 2. The primary endpoints were defined as 180-day and 1-year all-cause mortality following hospital admission.
Table 2
| Indices | Nutritional Risk | |||
|---|---|---|---|---|
| Normal | Mild | Worse | ||
| Alb, g/dl | >3.7 (0) | 3.4–3.7 (2) | 3.0–3.4 (4) | <3.0 (6) |
| Lym, u/μl | >1.5 (0) | 1.1–1.5 (1) | 0.7–1.1 (2) | <0.7 (3) |
| Non-HDL TC, mg/dl | >110 (0) | 90–110 (1) | 60–90 (2) | <60 (3) |
| Total | 0–3 | 4–5 | 6–12 | |
Modified controlling nutritional Status scoring (mCONUT).
Alb, albumin; Lym, lymphocyte count; Non-HDL TC, non-high-density lipoprotein total cholesterol.
2.5 Statistical analysis
The distribution of continuous variables was evaluated using the Kolmogorov–Smirnov test, with a p-value threshold of <0.1 indicating deviation from normality. Normally distributed data were reported as mean ± standard deviation (SD), while non-normally distributed data were presented as median with interquartile range [IQR]. Categorical variables were described as frequencies and percentages.
Group comparisons were conducted using analysis of variance (ANOVA) for normally distributed continuous variables, Kruskal–Wallis tests for non-normally distributed continuous variables, and chi-square (χ²) tests for categorical variables, with a two-tailed significance level of α = 0.05. Multivariable Cox proportional hazards regression models employing backward stepwise selection (retention criterion p < 0.05) were utilized to assess the association between malnutrition categories and clinical outcomes. A hierarchical adjustment approach was employed: Model 1 accounted for demographic characteristics (age, sex, race, and BMI), while Model 2 further adjusted for key clinical covariates, including hospitalization duration, hypertension, diabetes, PCI, VA, BB, hemoglobin, and serum creatinine levels.
Temporal survival distributions were visualized using Kaplan–Meier survival curves, and differences between stratified groups were statistically assessed using the log-rank test. To ensure the robustness of findings, prespecified subgroup analyses were conducted across clinically relevant strata, including age (≥75 vs. <75 years), sex, race, hypertension, diabetes, CKD, history of stroke, and revascularization status. Sensitivity analyses were performed using univariate Cox regression models, with interaction terms assessed to identify potential effect modifiers. All statistical analyses were performed using R software (version 4.4.2).
3 Results
3.1 Baseline characteristics
Table 1 presents baseline characteristics of the 993 MI patients stratified by mCONUT nutritional status. The Worse group (n = 331) demonstrated significantly lower BMI (26.1 vs. 27.8/26.1 kg/m2, p < 0.001), prolonged hospitalization (9.0 vs. 7.0/6.0 days, p < 0.001), and paradoxically reduced hypertension prevalence (32.9% vs. 45.6%/41.1%, p = 0.003) compared to Normal/Mild groups. This cohort exhibited higher CKD rates (39.3% vs. 30.5%/32.6%, p = 0.046), lower revascularization (PCI: 43.8% vs. 49.2%/54.7%; CABG: 7.3% vs. 22.4%/13.0%, both p < 0.05), and worse hematological profiles (hemoglobin, platelets, creatinine, albumin, lymphocytes; all p < 0.001). Nutritional status did not influence age, sex, ethnicity, or medication use. Mortality progressively increased with malnutrition severity (180-day: 13.9% Worse vs. 7.85% Normal, p = 0.037; 1-year: 31.4% vs. 21.2%, p = 0.011).
3.2 Malnutrition and prognosis
During the 180-day follow-up period, 105 fatalities (10.57%) occurred, demonstrating a graded mortality increase across nutritional strata: Normal group (n = 26, 7.85%), Mild group (n = 33, 9.97%), and Worse group (n = 46, 13.90%). Univariate Cox regression (Table 3) demonstrated significantly elevated mortality risk in the Worse vs. Normal group (HR 1.59, 95% CI 1.13–2.23; p = 0.008), whereas the Mild group exhibited no significant difference (HR 1.15, 95% CI 0.80–1.66; p = 0.435). Following multivariable adjustment for confounders, the Worse group maintained significantly heightened mortality risk. Model 1 (adjusted for age, sex, race, BMI) yielded an HR of 1.58 (95% CI 1.12–2.23; p = 0.009). Model 2 (further adjusted for hospitalization duration, hypertension, diabetes, PCI, VA, BB, hemoglobin, and creatinine) revealed a hazard ratio of 1.46 (95% CI 1.10–2.19; p = 0.031).
Table 3
| Prognosis | Group | Unadjusted | p | Model 1a | p | Model 2b | p |
|---|---|---|---|---|---|---|---|
| HR (95% CI) | HR (95% CI) | HR (95% CI) | |||||
| 180-day mortality | Normal | Reference | Reference | Reference | |||
| Mild | 1.15 (0.80–1.66) | 0.435 | 1.17 (0.81–1.68) | 0.41 | 1.21 (0.84–1.74) | 0.310 | |
| Worse | 1.59 (1.13–2.23) | 0.008 | 1.58 (1.12–2.23) | 0.009 | 1.46 (1.10–2.19) | 0.031 | |
| 1-year mortality | Normal | Reference | Reference | Reference | |||
| Mild | 1.28 (0.93–1.75) | 0.124 | 1.30 (0.95–1.78) | 0.104 | 1.34 (0.93–1.83) | 0.07 | |
| Worse | 1.59 (1.17–2.15) | 0.003 | 1.61 (1.19–2.18) | 0.002 | 1.52 (1.12–2.07) | 0.008 |
Cox proportional hazards regression analysis of mortality risk by mCONUT score.
Model 1: Adjusted for age, sex, race, and BMI.
Model 2: Additionally adjusted for hospitalization duration, hypertension, diabetes, PCI, vasoactive agents, β-blockers, hemoglobin, and creatinine.
At the 1-year follow-up, 262 deaths (26.38%) were documented: Normal group (n = 70, 21.15%), Mild group (n = 88, 26.59%), and Worse group (n = 104, 31.42%). Univariate analysis indicated a 59% elevated mortality risk in the Worse group (95% CI 1.17–2.15, p = 0.003), with Model 1 showing a 61% increase (95% CI 1.19–2.18; p = 0.002) and Model 2 a 52% increase (95% CI 1.12–2.07; p = 0.008). Kaplan–Meier analysis (Figure 2) corroborated these observations, evidencing significant survival curve divergence at 180 days (log-rank p = 0.018) and 1 year (log-rank p = 0.010).
Figure 2
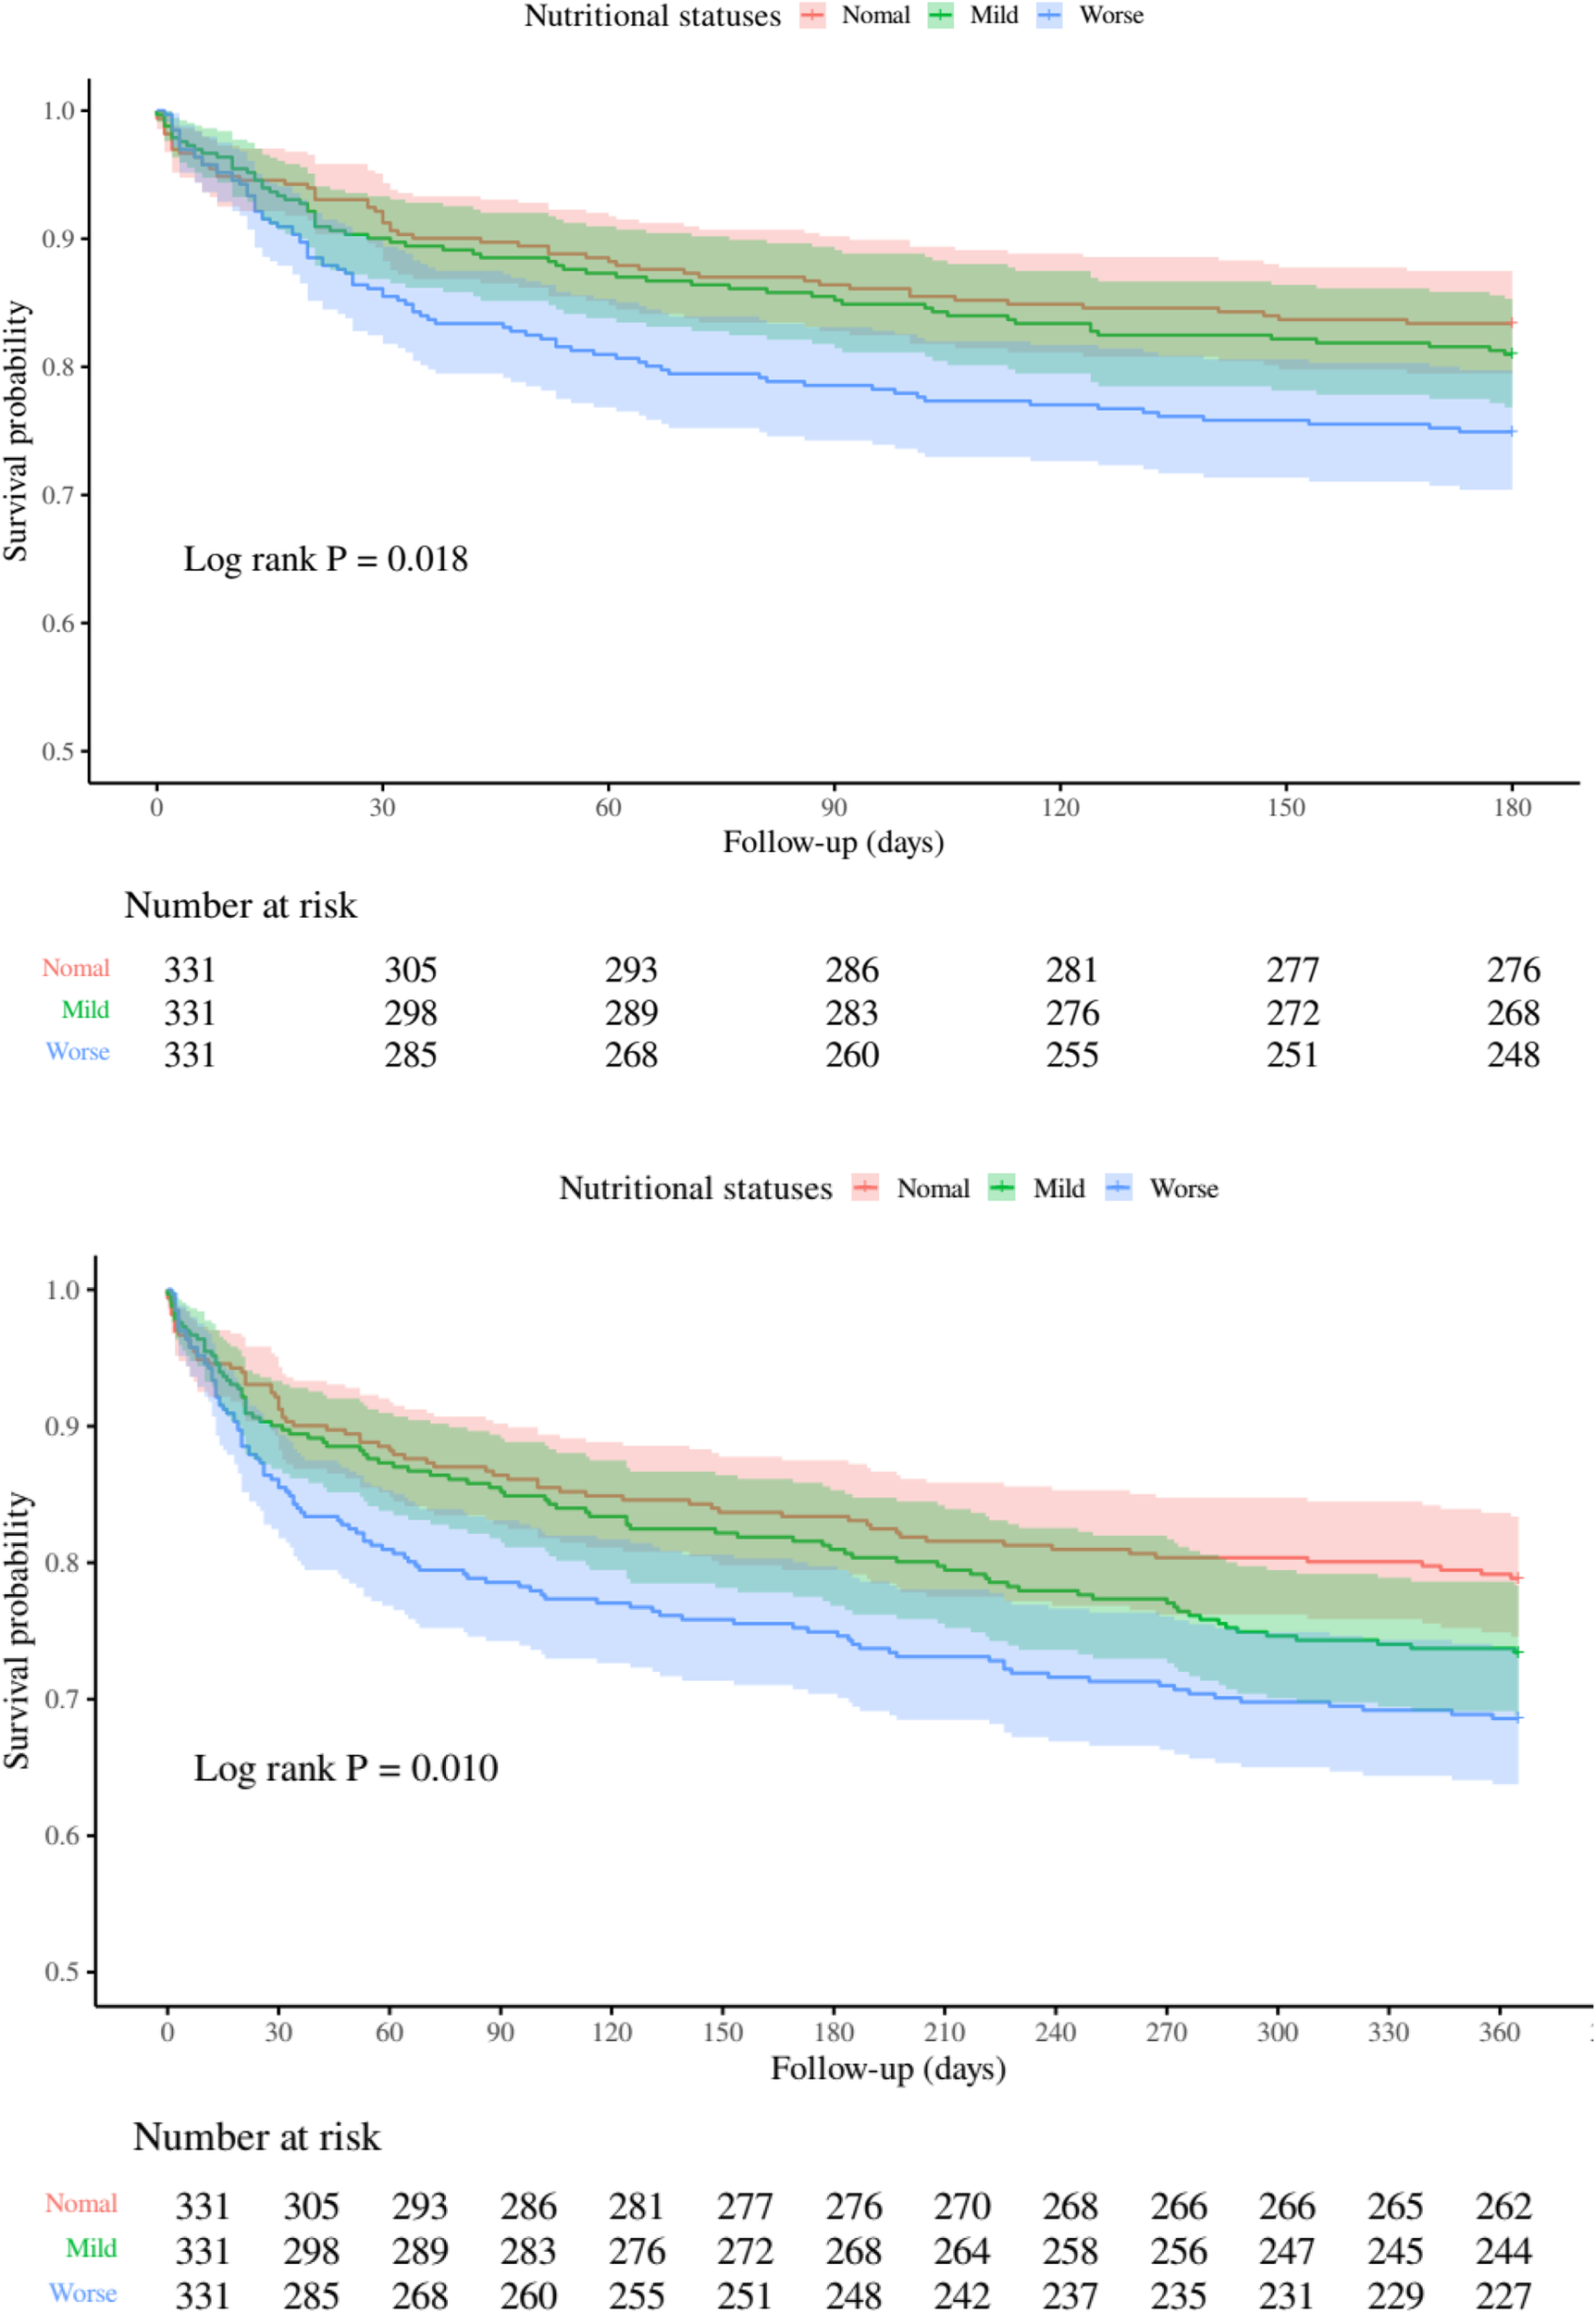
Kaplan-Meier curves depicting all-cause mortality risk at 180 days (top) and 1 year (bottom) across nutritional status categories.
The restricted cubic spline analysis (Figure 3) demonstrated significant linear associations between mCONUT scores and mortality risk at 180 days (p-overall = 0.039) and 360 days (p-overall = 0.022), with no evidence of nonlinearity (p-nonlinear = 0.834 and 0.809, respectively). Hazard ratio curves exhibited consistent dose-response patterns devoid of inflection points or threshold effects, supporting a progressive mortality risk elevation with increasing mCONUT scores during both follow-up intervals.
Figure 3
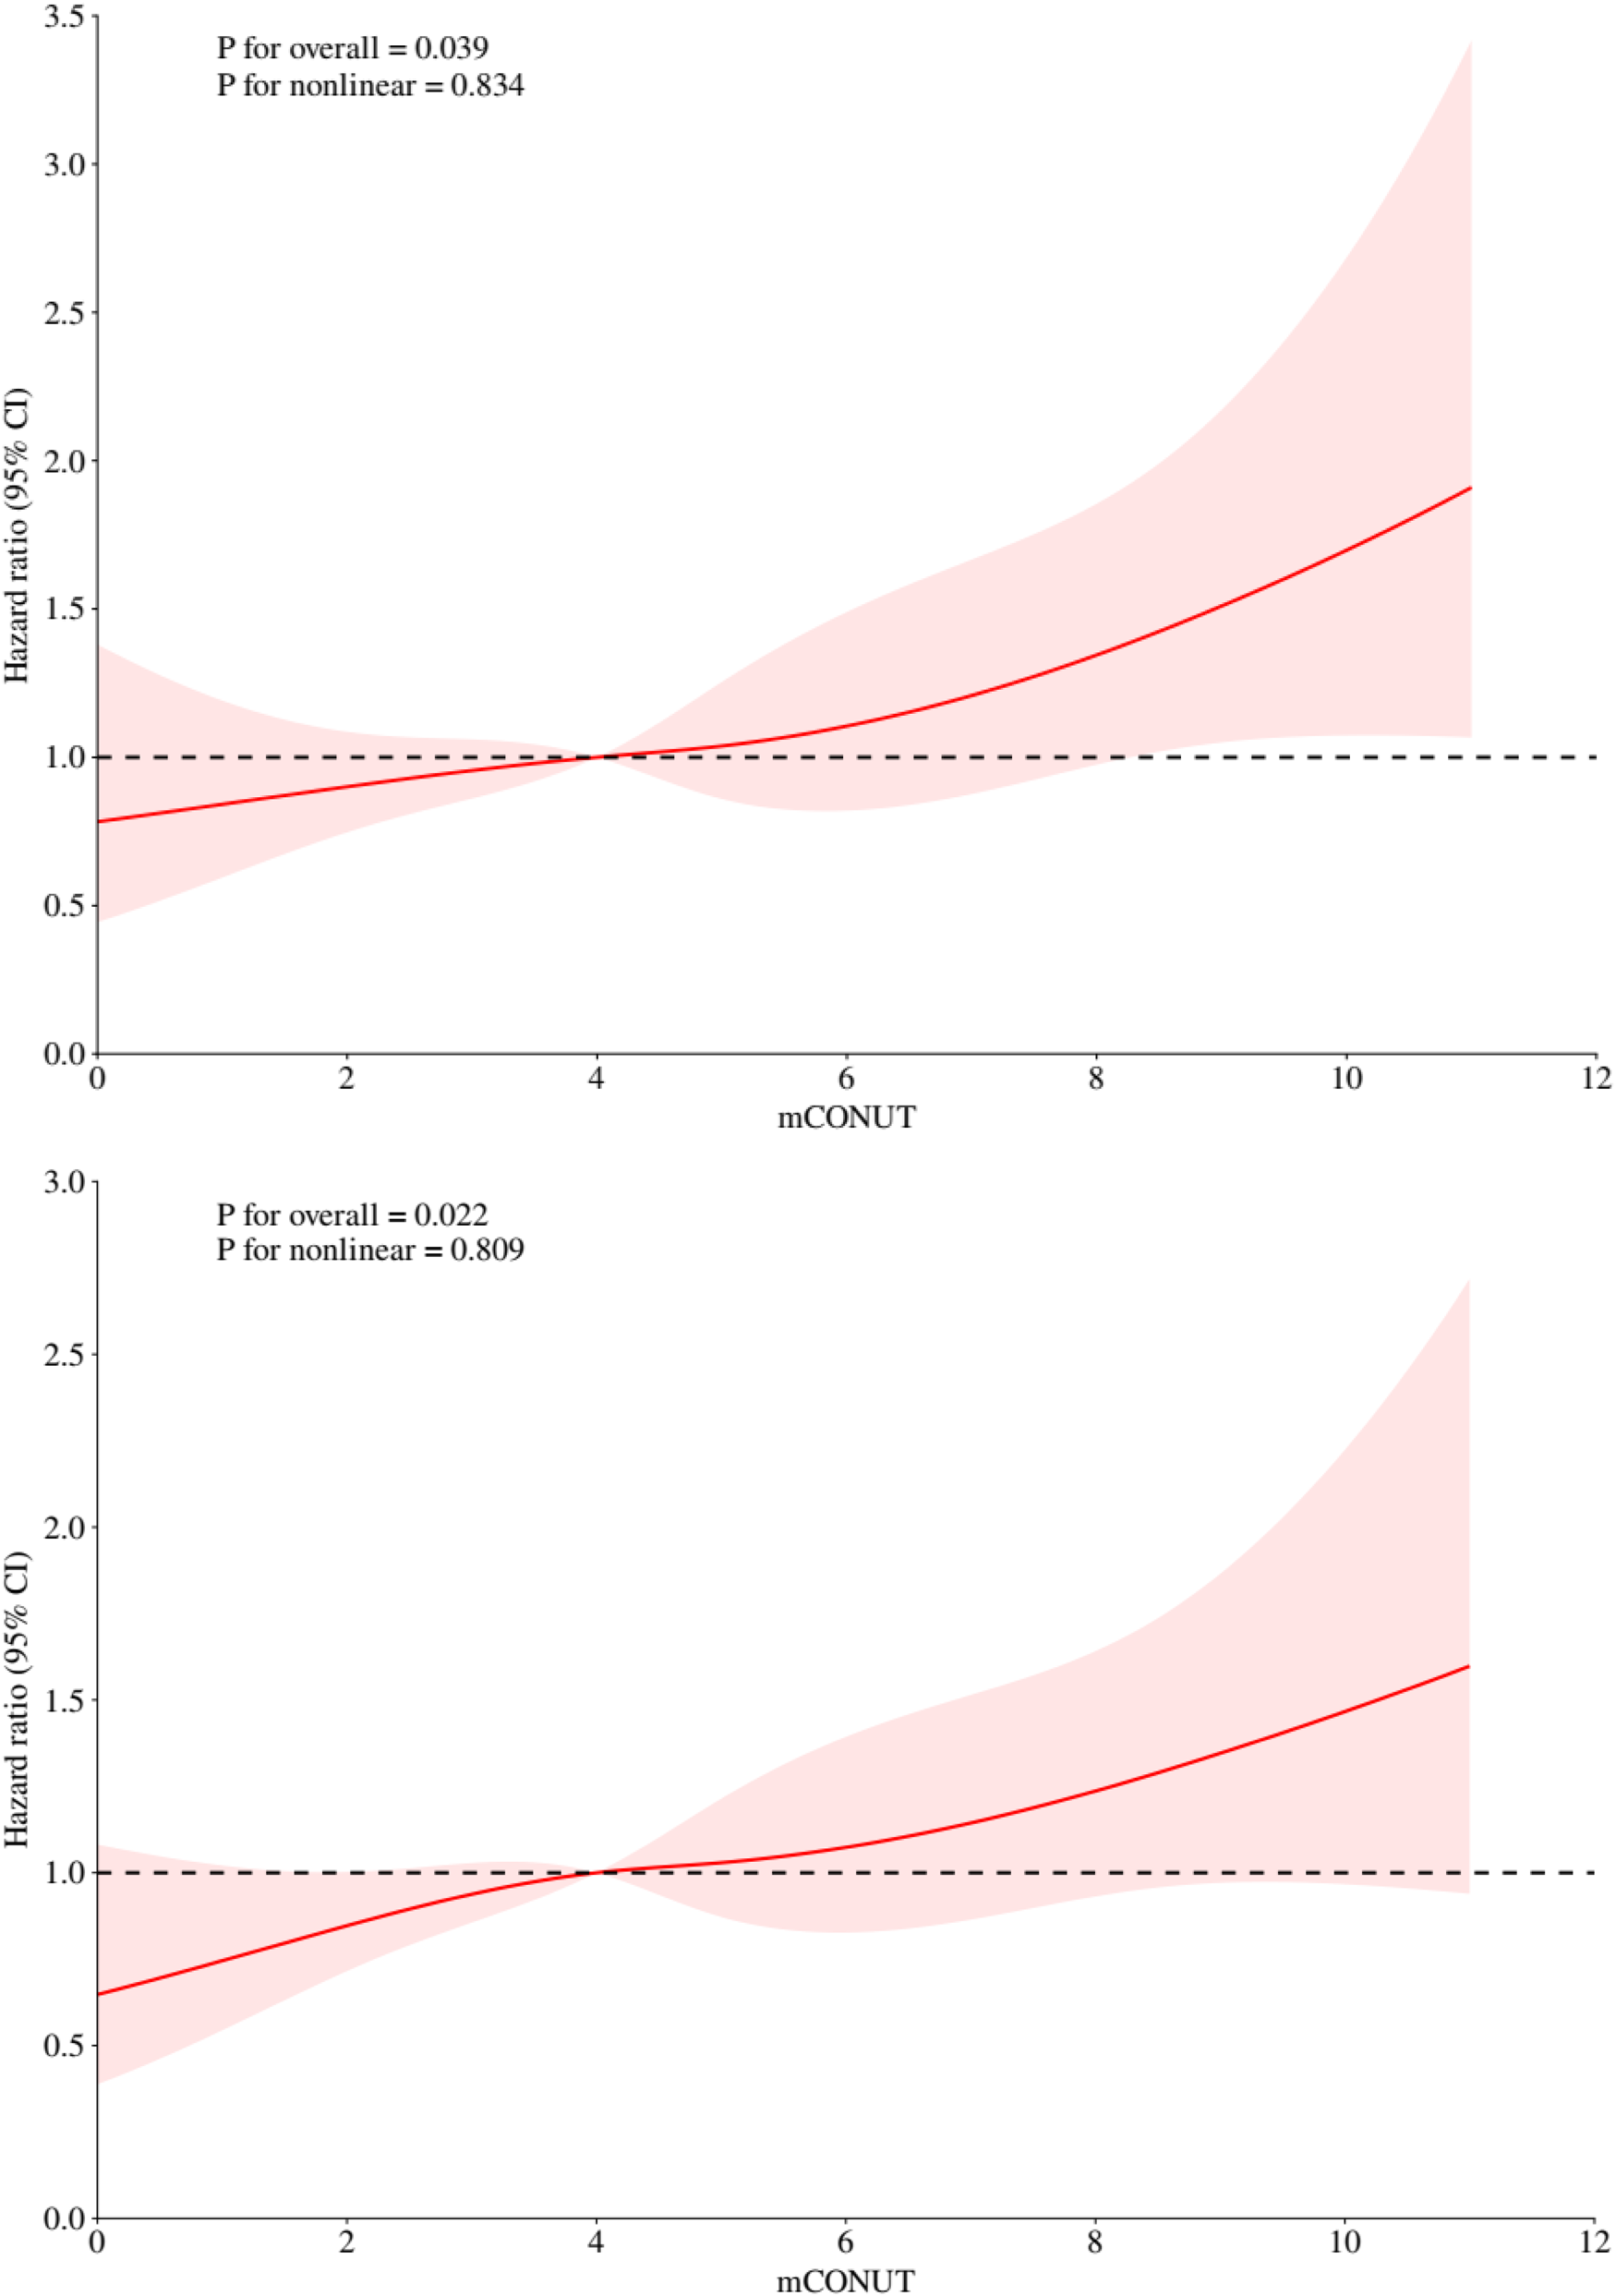
Restricted cubic spline analyses illustrating the association between mCONUT scores and all-cause mortality risk at 180 days (top) and 1 year (bottom).
3.3 Subgroup analyses
Subgroup analyses (Figure 4) using univariate cox regression revealed differential mortality risks associated with worse malnutrition (mCONUT-defined) across clinical and demographic strata. Patients <75 years exhibited an 86% increased mortality risk (HR 1.86, 95% CI 1.09–3.16; p = 0.022), contrasting with non-significant findings in those ≥75 years (HR 1.42, 95% CI 0.98–2.05; p = 0.063). Males demonstrated markedly elevated risk (HR 1.95, 95% CI 1.28–2.99; p = 0.002), while females showed no significant association (HR 1.24, 95% CI 0.80–1.91; p = 0.338). Non-white individuals experienced an 84% higher mortality (HR 1.84, 95% CI 1.28–2.64; p < 0.001), unlike white counterparts (HR 1.06, 95% CI 0.61–1.84; p = 0.848).
Figure 4
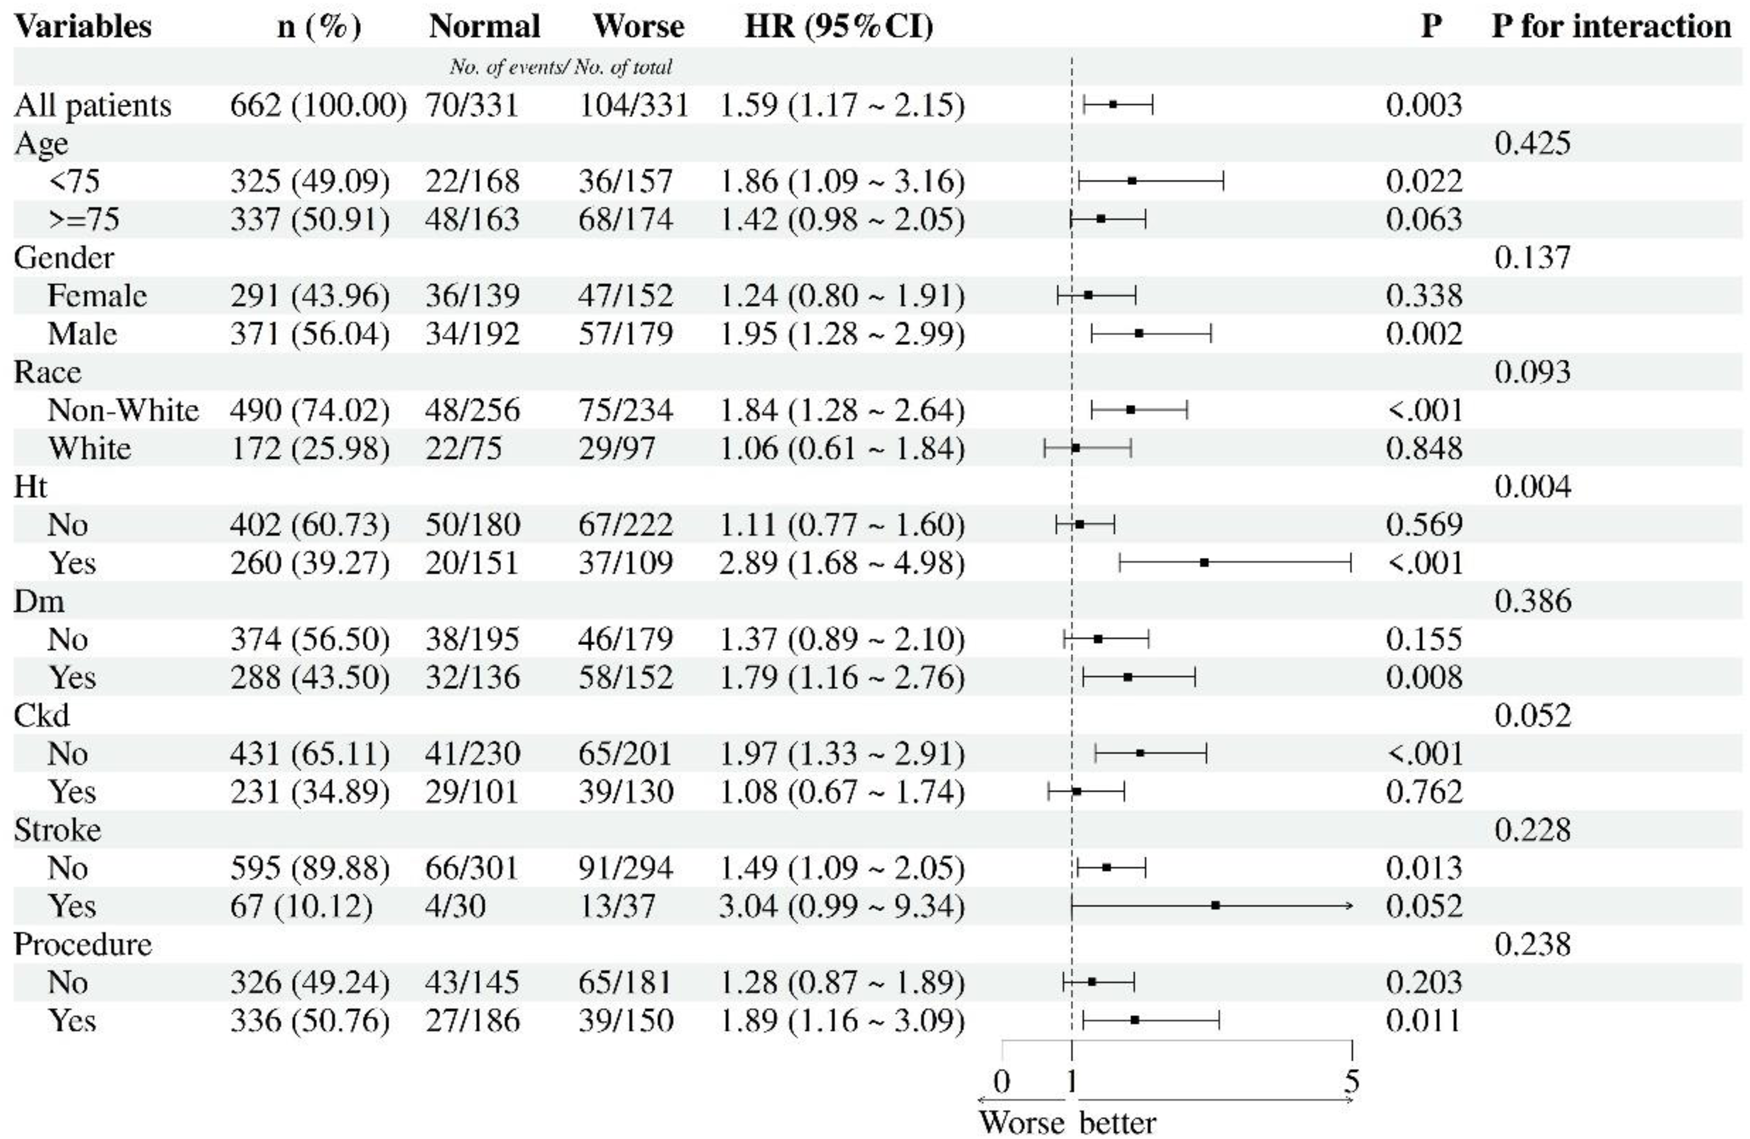
Subgroup analyses for nutritional statuses and 1-year all-cause mortality. HT, hypertension; DM, diabetes mellitus; CKD, chronic kidney diseases; Procedures including PCI, percutaneous coronary intervention; CABG, coronary artery bypass grafting.
Hypertensive patients displayed a striking 2.89-fold risk elevation (95% CI 1.68–4.98; p < 0.001), whereas non-hypertensives showed no association (HR 1.11, 95% CI 0.77–1.60; p = 0.569). Diabetics exhibited increased mortality (HR 1.79, 95% CI 1.16–2.76; p = 0.008), contrasting with non-diabetics (HR 1.37, 95% CI 0.89–2.10; p = 0.155). Notably, CKD-free patients demonstrated significant risk (HR 1.97, 95% CI 1.33–2.91; p < 0.001), unlike CKD patients (HR 1.08, 95% CI 0.67–1.74; p = 0.762). Stroke history modified risk association: Non-stroke patients showed significant risk elevation (HR 1.49, 95% CI 1.09–2.05; p = 0.013), while stroke survivors demonstrated marginally significant increased mortality (HR 3.04, 95% CI 0.99–9.34; p = 0.052). Revascularized patients (PCI/CABG) showed elevated risk (HR 1.89, 95% CI 1.16–3.09; p = 0.011), while non-revascularized individuals trended toward significance (HR 1.28, 95% CI 0.87–1.89; p = 0.203). Significant interaction effects emerged for hypertension (p for interaction = 0.004), with other subgroups showing non-significant interactions.
4 Discussion
Our study presents three key findings from the comprehensive analysis of the MIMIC-IV cohort: (1) Malnutrition affects 43.1% of MI patients (mCONUT ≥ 4), with 24.5% exhibiting severe malnutrition (mCONUT ≥ 6); (2) The mCONUT score is a robust prognostic tool, with severe malnutrition independently predicting a 46%–58% higher risk of mortality at 180 days and a 52%–61% increased risk at 1 year after multivariable adjustment; (3) Nonlinear analysis demonstrates a dose-response relationship between mCONUT scores and mortality risk, validated through restricted cubic spline curves. These findings not only reinforce but also extend previous research on nutritional indices, marking three significant advancements in the field.
Nutritional assessments in clinical practice are often subjective, but objective tools such as the Subjective Global Assessment (SGA) (18) and Mini Nutritional Assessment (MNA) (19). Other indices like the Prognostic Nutritional Index (PNI) (20), based on lymphocyte count and serum albumin levels, and the Geriatric Nutritional Risk Index (GNRI) (21), which uses albumin and body weight, also serve as reliable indicators of malnutrition. A PNI below 45 or a GNRI under 98 has been associated with adverse outcomes, including increased mortality. Studies have linked lower serum albumin levels and malnutrition to worse outcomes in coronary heart disease, including higher risks of acute heart failure and cardiogenic shock in ACS patients (22, 23). The “Cholesterol Paradox” further suggests that low LDL cholesterol, potentially associated with malnutrition, correlates with poorer long-term outcomes (25–28). Malnutrition can induce immune dysfunction, as energy depletion impairs immune system activation, which is energy-intensive. Lymphocyte count, reflecting both immune function and nutritional status, has been identified as an independent risk factor for poor prognosis in coronary artery disease, particularly in ACS (30, 31). The CONUT score, which evaluates albumin, total cholesterol (TC), and lymphocyte count, is widely used to assess nutritional status in cardiovascular diseases (32–38). Our study introduces a modified version, the mCONUT score, which replaces total cholesterol with non-HDL cholesterol for improved predictive accuracy in MI patients, particularly those with severe malnutrition.
In our cohort, patients with mCONUT scores ≥6 exhibited longer hospital stays and worse in-hospital outcomes, consistent with previous studies (7, 37, 38) linking severe malnutrition to hemodynamic instability and an exaggerated inflammatory response (39). These patients also faced significantly higher risks of all-cause mortality. Notably, the mortality risk gradient was most pronounced in male patients aged <75 years undergoing procedures and those with multiple comorbidities, particularly hypertension, diabetes, and stroke. This aligns with other research showing that ACS patients with moderate to severe malnutrition face a 2.02- to 3.65-fold increase in mortality risk (7, 40, 41).
The association between the mCONUT score and prognosis likely operates through two interconnected pathways: metabolic depletion and immunoinflammatory dysregulation. By incorporating non-HDL cholesterol, a superior marker for atherosclerotic risk (42), instead of total cholesterol, the mCONUT score better reflects lipid metabolism abnormalities in malnourished MI patients. Hypoalbuminemia (albumin <3.5 g/dl) in severe malnutrition impairs antioxidant defenses and nitric oxide bioavailability, exacerbating myocardial ischemia (43). Concurrently, lymphocytopenia (lymphocyte count <1.5 × 10³/μl) reflects immune system collapse, allowing uncontrolled inflammation after an infarction (44). This results in a pathogenic cycle of energy deficit, immune exhaustion, and persistent inflammation, as evidenced by elevated neutrophil-to-lymphocyte ratio (NLR) and C-reactive protein (CRP) levels in MI patients (45). Recent metabolomic studies (46) have further identified malnutrition-induced depletion of branched-chain amino acids, critical for cardiac energy production, as a potential driver of ventricular remodeling.
Addressing malnutrition with clinical interventions can improve patient outcomes. Nutritional support, such as oral supplements, has been shown to enhance muscle strength and recovery in malnourished patients with cardiopulmonary diseases like ACS. Moreover, nutritional interventions can reduce mortality and improve post-discharge recovery in these patients (47, 48). Our study confirms that the modified CONUT score is a multifaceted prognostic biomarker, integrating nutritional, metabolic, and immunological risks for MI patients. For clinical implementation, we recommend: (1) systematic mCONUT screening at admission to stratify high-risk patients; (2) dynamic monitoring of albumin (>3.8 g/dl) and lymphocyte count (>1.8 × 10³/μl); and (3) post-discharge nutritional protocols to mitigate the inflammation-malnutrition cycle. These recommendations underscore the potential of mCONUT as a modifiable determinant of adverse outcomes in MI management.
Despite rigorous adjustments, our study may still be subject to residual confounding due to unmeasured inflammatory markers (e.g., IL-6) and socioeconomic factors. Additionally, the single-center design limits generalizability, though the demographic diversity of the MIMIC-IV 2.2 cohort partially mitigates this concern. While we have established temporal associations, further validation through intervention studies targeting malnutrition is needed to establish causality.
Statements
Data availability statement
The raw data supporting the conclusions of this article will be made available by the authors, without undue reservation.
Ethics statement
The studies involving humans were approved by Data were obtained from the MIMIC-IV database (authorization No. 53015455). The studies were conducted in accordance with the local legislation and institutional requirements. Written informed consent for participation was not required from the participants or the participants' legal guardians/next of kin in accordance with the national legislation and institutional requirements.
Author contributions
WY: Supervision, Writing – review & editing, Software, Formal analysis, Project administration, Writing – original draft, Methodology, Data curation, Visualization, Resources, Investigation, Validation, Conceptualization. YL: Writing – review & editing, Validation, Methodology, Supervision, Visualization, Writing – original draft. QC: Validation, Writing – review & editing, Supervision, Writing – original draft, Methodology. JY: Data curation, Formal analysis, Methodology, Writing – original draft, Software. WD: Writing – original draft. RD: Writing – review & editing, Visualization, Methodology, Validation, Project administration, Supervision. XX: Investigation, Writing – review & editing, Visualization, Formal analysis, Validation, Data curation, Project administration, Methodology, Supervision, Conceptualization.
Funding
The author(s) declare that no financial support was received for the research and/or publication of this article.
Acknowledgments
The authors gratefully acknowledge the MIMIC-IV database for providing clinical data access.
Conflict of interest
The authors declare that the research was conducted in the absence of any commercial or financial relationships that could be construed as a potential conflict of interest.
Generative AI statement
The author(s) declare that no Generative AI was used in the creation of this manuscript.
Publisher’s note
All claims expressed in this article are solely those of the authors and do not necessarily represent those of their affiliated organizations, or those of the publisher, the editors and the reviewers. Any product that may be evaluated in this article, or claim that may be made by its manufacturer, is not guaranteed or endorsed by the publisher.
Supplementary material
The Supplementary Material for this article can be found online at: https://www.frontiersin.org/articles/10.3389/fcvm.2025.1596575/full#supplementary-material
Supplementary FiguresContent: Restricted Cubic Spline (RCS) analyses for albumin, lymphocyte count, and non-HDL cholesterol cutoff determination.
References
1.
Cardiovascular diseases (CVDs). Available online at:https://www.who.int/news-room/fact-sheets/detail/cardiovascular-diseases-(cvds)(Accessed October 8, 2024).
2.
Liu S Li Y Zeng X Wang H Yin P Wang L et al Burden of cardiovascular diseases in China, 1990–2016: findings from the 2016 global burden of disease study. JAMA Cardiol. (2019) 4(4):342–52. 10.1001/jamacardio.2019.0295
3.
Szummer K Jernberg T Wallentin L . From early pharmacology to recent pharmacology interventions in acute coronary syndromes: JACC state-of-the-art review. J Am Coll Cardiol. (2019) 74(12):1618–36. 10.1016/j.jacc.2019.03.531
4.
Gulati R Behfar A Narula J Kanwar A Lerman A Cooper L et al Acute myocardial infarction in young individuals. Mayo Clin Proc. (2020) 95(1):136–56. 10.1016/j.mayocp.2019.05.001
5.
Barker LA Gout BS Crowe TC . Hospital malnutrition: prevalence, identification and impact on patients and the healthcare system. Int J Environ Res Public Health. (2011) 8(2):514–27. 10.3390/ijerph8020514
6.
Lew CC Yandell R Fraser RJ Chua AP Chong MF Miller M . Association between malnutrition and clinical outcomes in the intensive care unit: a systematic review. JPEN J Parenter Enteral Nutr. (2017) 41(5):744–58. 10.1177/0148607115625638
7.
Raposeiras Roubin S Abu Assi E Cespon Fernandez M Barreiro Pardal C Lizancos Castro A Parada JA et al Prevalence and prognostic significance of malnutrition in patients with acute coronary syndrome. J Am Coll Cardiol. (2020) 76(7):828–40. 10.1016/j.jacc.2020.06.058
8.
Ignacio de Ulíbarri J González-Madroño A de Villar NGP González P González B Mancha A et al CONUT: a tool for controlling nutritional status. First validation in a hospital population. Nutr Hosp. (2005) 20(1):38–45.
9.
Iwakami N Nagai T Furukawa TA Sugano Y Honda S Okada A et al Prognostic value of malnutrition assessed by controlling nutritional status score for long-term mortality in patients with acute heart failure. Int J Cardiol. (2017) 230:529–36. 10.1016/j.ijcard.2016.12.064
10.
Kalantar-Zadeh K Anker SD Horwich TB Fonarow GC . Nutritional and anti-inflammatory interventions in chronic heart failure. Am J Cardiol. (2008) 101(11A):S89–S103. 10.1016/j.amjcard.2008.03.007
11.
Sun X Luo L Zhao X Ye P . Controlling nutritional status (CONUT) score as a predictor of all-cause mortality in elderly hypertensive patients: a prospective follow-up study. BMJ Open. (2017) 7(9):e015649. 10.1136/bmjopen-2016-015649
12.
Wu L Wang W Gui Y Yan Q Peng G Zhang X et al Nutritional status as a risk factor for new-onset atrial fibrillation in acute myocardial infarction. Clin Interv Aging. (2023) 18:29–40. 10.2147/CIA.S387602
13.
Yokoyama M Watanabe T Otaki Y Watanabe K Toshima T Sugai T et al Impact of objective malnutrition status on the clinical outcomes in patients with peripheral artery disease following endovascular therapy. Circ J. (2018) 82(3):847–56. 10.1253/circj.CJ-17-0731
14.
Wada H Dohi T Miyauchi K Doi S Konishi H Naito R et al Prognostic impact of nutritional status assessed by the controlling nutritional status score in patients with stable coronary artery disease undergoing percutaneous coronary intervention. Clin Res Cardiol. (2017) 106(11):875–83. 10.1007/s00392-017-1132-z
15.
Peng L Tang J Zhang N Zhang Z Wang D He Y . Association between controlling nutritional status score and the prognosis of patients with acute myocardial infarction: a systematic review and meta-analysis. Front Nutr. (2025) 11:1518822. 10.3389/fnut.2024.1518822
16.
Ouimet M Barrett TJ Fisher EA . HDL and reverse cholesterol transport. Circ Res. (2019) 124(10):1505–18. 10.1161/CIRCRESAHA.119.312617
17.
Johnson AE Bulgarelli L Shen L Gayles A Shammout A Horng S et al MIMIC-IV, a freely accessible electronic health record dataset. Sci Data. (2023) 10(1):1. 10.1038/s41597-022-01899-x
18.
da Silva Fink J de Mello PD de Mello ED . Subjective global assessment of nutritional status—a systematic review of the literature. Clin Nutr. (2015) 34(5):785–92. 10.1016/j.clnu.2014.12.014
19.
Rubenstein LZ Harker JO Salvà A Guigoz Y Vellas B . Screening for undernutrition in geriatric practice: developing the short-form mini-nutritional assessment (MNA-SF). J Gerontol A Biol Sci Med Sci. (2001) 56(6):M366–372. 10.1093/gerona/56.6.M366
20.
Wang X Wang Y . The prognostic nutritional index is prognostic factor of gynecological cancer: a systematic review and meta-analysis. Int J Surg. (2019) 67:79–86. 10.1016/j.ijsu.2019.05.018
21.
Bouillanne O Morineau G Dupont C Coulombel I Vincent JP Nicolis I et al Geriatric nutritional risk index: a new index for evaluating at-risk elderly medical patients. Am J Clin Nutr. (2005) 82(4):777–83. 10.1093/ajcn/82.4.777
22.
Djoussé L Rothman KJ Cupples LA Levy D Ellison RC . Serum albumin and risk of myocardial infarction and all-cause mortality in the Framingham offspring study. Circulation. (2002) 106(23):2919–24. 10.1161/01.CIR.0000042673.07632.76
23.
Nelson JJ Liao D Sharrett AR Folsom AR Chambless LE Shahar E et al Serum albumin level as a predictor of incident coronary heart disease: the atherosclerosis risk in communities (ARIC) study. Am J Epidemiol. (2000) 151(5):468–77. 10.1093/oxfordjournals.aje.a010232
24.
Hartopo AB Gharini PP Setianto BY . Low serum albumin levels and in-hospital adverse outcomes in acute coronary syndrome. Int Heart J. (2010) 51(4):221–6. 10.1536/ihj.51.221
25.
Wang TY Newby LK Chen AY Mulgund J Roe MT Sonel AF et al Hypercholesterolemia paradox in relation to mortality in acute coronary syndrome. Clin Cardiol. (2009) 32(9):E22–8. 10.1002/clc.20518
26.
Cho KH Jeong MH Ahn Y Kim YJ Chae SC Hong TJ et al Low-density lipoprotein cholesterol level in patients with acute myocardial infarction having percutaneous coronary intervention (the cholesterol paradox). Am J Cardiol. (2010) 106(8):1061–8. 10.1016/j.amjcard.2010.06.009
27.
Wang TY Newby LK Chen AY Mulgund J Roe MT Sonel AF et al Hypercholesterolemia paradox in relation to mortality in acute coronary syndrome. Clin Cardiol. (2009) 32(9):E22–28. 10.1002/clc.20518
28.
Wang B Liu J Chen S Ying M Chen G Liu L et al Malnutrition affects cholesterol paradox in coronary artery disease: a 41,229 Chinese cohort study. Lipids Health Dis. (2021) 20(1):1–8. 10.1186/s12944-021-01460-6
29.
Chandra RK . Immunocompetence in undernutrition. J Pediatr. (1972) 81(6):1194–200. 10.1016/S0022-3476(72)80262-2
30.
Omran ML Morley JE . Assessment of protein energy malnutrition in older persons, part II: laboratory evaluation. Nutrition. (2000) 16(2):131–40. 10.1016/S0899-9007(99)00251-8
31.
Bian C Wu Y Shi Y Xu G Wang J Xiang M et al Predictive value of the relative lymphocyte count in coronary heart disease. Heart Vessels. (2010) 25(6):469–73. 10.1007/s00380-010-0010-7
32.
Naito H Nezu T Hosomi N Aoki S Kinoshita N Kuga J et al Controlling nutritional status score for predicting 3-mo functional outcome in acute ischemic stroke. Nutrition. (2018) 55-56:1–6. 10.1016/j.nut.2018.02.025
33.
Czapla M Karniej P Juárez-Vela R Łokieć K . The association between nutritional status and in-hospital mortality among patients with acute coronary syndrome-A result of the retrospective nutritional status heart study (NSHS). Nutrients. (2020) 12(10):3091. 10.3390/nu12103091
34.
Nochioka K Sakata Y Takahashi J Miyata S Miura M Takada T et al Prognostic impact of nutritional status in asymptomatic patients with cardiac diseases: a report from the CHART-2 study. Circ J. (2013) 77(9):2318–26. 10.1253/circj.CJ-13-0127
35.
Chen L Huang Z Lu J Yang Y Pan Y Bao K et al Impact of the malnutrition on mortality in elderly patients undergoing percutaneous coronary intervention. Clin Interv Aging. (2021) 16:1347–56. 10.2147/CIA.S308569
36.
Chen SC Yang YL Wu CH Huang SS Chan WL Lin SJ et al Association between preoperative nutritional status and clinical outcomes of patients with coronary artery disease undergoing percutaneous coronary intervention. Nutrients. (2020) 12(5):1295. 10.3390/nu12051295
37.
Basta G Chatzianagnostou K Paradossi U Botto N Del Turco S Taddei A et al The prognostic impact of objective nutritional indices in elderly patients with ST-elevation myocardial infarction undergoing primary coronary intervention. Int J Cardiol. (2016) 221:987–92. 10.1016/j.ijcard.2016.07.039
38.
Kang SH Song HN Moon JY Kim SH Sung JH Kim IJ et al Prevalence and prognostic significance of malnutrition in patients with acute coronary syndrome treated with percutaneous coronary intervention. Medicine (Baltimore). (2022) 101(34):e30100. 10.1097/MD.0000000000030100
39.
Rus VA Chitu M Cernea S Benedek I Hodas R Zavate R et al Altered nutritional status, inflammation and systemic vulnerability in patients with acute myocardial infarction undergoing percutaneous coronary revascularisation: a prospective study in a level 3 cardiac critical care unit. Nutr Diet. (2020) 77(2):212–22. 10.1111/1747-0080.12536
40.
Takahashi T Watanabe T Otaki Y Kato S Tamura H Nishiyama S et al Prognostic significance of the controlling nutritional (CONUT) score in patients with acute coronary syndrome. Heart Vessels. (2021) 36(8):1109–16. 10.1007/s00380-021-01792-4
41.
Liu J Huang Z Huang H He Y Yu Y Chen G et al Malnutrition in patients with coronary artery disease: prevalence and mortality in a 46,485 Chinese cohort study. Nutr Metab Cardiovasc Dis. (2022) 32(5):1186–94. 10.1016/j.numecd.2021.12.023
42.
Szufla M Krawczuk A Jajko G Kozyra P Matoga D . Flattening of a bent sulfonated MOF linker: impact on structures, flexibility, gas adsorption, CO2/N2 selectivity, and proton conduction. Inorg Chem. (2024) 63(1):151–62. 10.1021/acs.inorgchem.3c02553
43.
Aljazeeri IA Hagr A . Application of anatomy-based spacing of electrode contacts for achieving a uniform semitonal resolution: a novel concept in cochlear implant electrode design. Sci Rep. (2024) 14(1):2645. 10.1038/s41598-024-53070-8
44.
Cicardi ME Kankate V Sriramoji S Krishnamurthy K Markandaiah SS Verdone BM et al The nuclear import receptor Kapβ2 modifies neurotoxicity mediated by poly(GR) in C9orf72-linked ALS/FTD. Commun Biol. (2024) 7(1):376. 10.1038/s42003-024-06071-2
45.
Das SK Bhattarai A Paudel K Bhusal S Shah S Timsina S et al Socio-demographic determinants of the knowledge of Monkeypox virus among the general public: a cross-sectional study in a tertiary care center in Nepal. BMC Infect Dis. (2024) 24(1):295. 10.1186/s12879-024-09184-5
46.
Hu Y Gu Y Song Y Zhao Y Wang J Ma J et al Differential expression and prognostic value of TLR4 in kidney renal clear cell carcinoma. Mol Cell Probes. (2024) 75:101959. 10.1016/j.mcp.2024.101959
47.
Matheson EM Nelson JL Baggs GE Luo M Deutz NE . Specialized oral nutritional supplement (ONS) improves handgrip strength in hospitalized, malnourished older patients with cardiovascular and pulmonary disease: a randomized clinical trial. Clin Nutr. (2021) 40(3):844–9. 10.1016/j.clnu.2020.08.035
48.
Deutz NE Matheson EM Matarese LE Luo M Baggs GE Nelson JL et al Readmission and mortality in malnourished, older, hospitalized adults treated with a specialized oral nutritional supplement: a randomized clinical trial. Clin Nutr. (2016) 35(1):18–26. 10.1016/j.clnu.2015.12.010
Summary
Keywords
modified CONUT score, myocardial infarction prognosis, malnutrition assessment, MIMIC-IV database, mortality risk stratification
Citation
Yu W, Luo Y, Cai Q, Yang J, Deng W, Dong R and Xie X (2025) Prognostic stratification in myocardial infarction using the modified CONUT score: a multidimensional biomarker from the MIMIC-IV cohort. Front. Cardiovasc. Med. 12:1596575. doi: 10.3389/fcvm.2025.1596575
Received
19 March 2025
Accepted
07 July 2025
Published
24 July 2025
Volume
12 - 2025
Edited by
Tatsuya Sato, Sapporo Medical University, Japan
Reviewed by
Nobuaki Fukuma, Columbia University, United States
Faqiang Zhang, Tongji University, China
Updates
Copyright
© 2025 Yu, Luo, Cai, Yang, Deng, Dong and Xie.
This is an open-access article distributed under the terms of the Creative Commons Attribution License (CC BY). The use, distribution or reproduction in other forums is permitted, provided the original author(s) and the copyright owner(s) are credited and that the original publication in this journal is cited, in accordance with accepted academic practice. No use, distribution or reproduction is permitted which does not comply with these terms.
* Correspondence: Xujing Xie xiexj@mail.sysu.edu.cn Ruimin Dong dongrm@mail.sysu.edu.cn
†These authors have contributed equally to this work and share first authorship
Disclaimer
All claims expressed in this article are solely those of the authors and do not necessarily represent those of their affiliated organizations, or those of the publisher, the editors and the reviewers. Any product that may be evaluated in this article or claim that may be made by its manufacturer is not guaranteed or endorsed by the publisher.