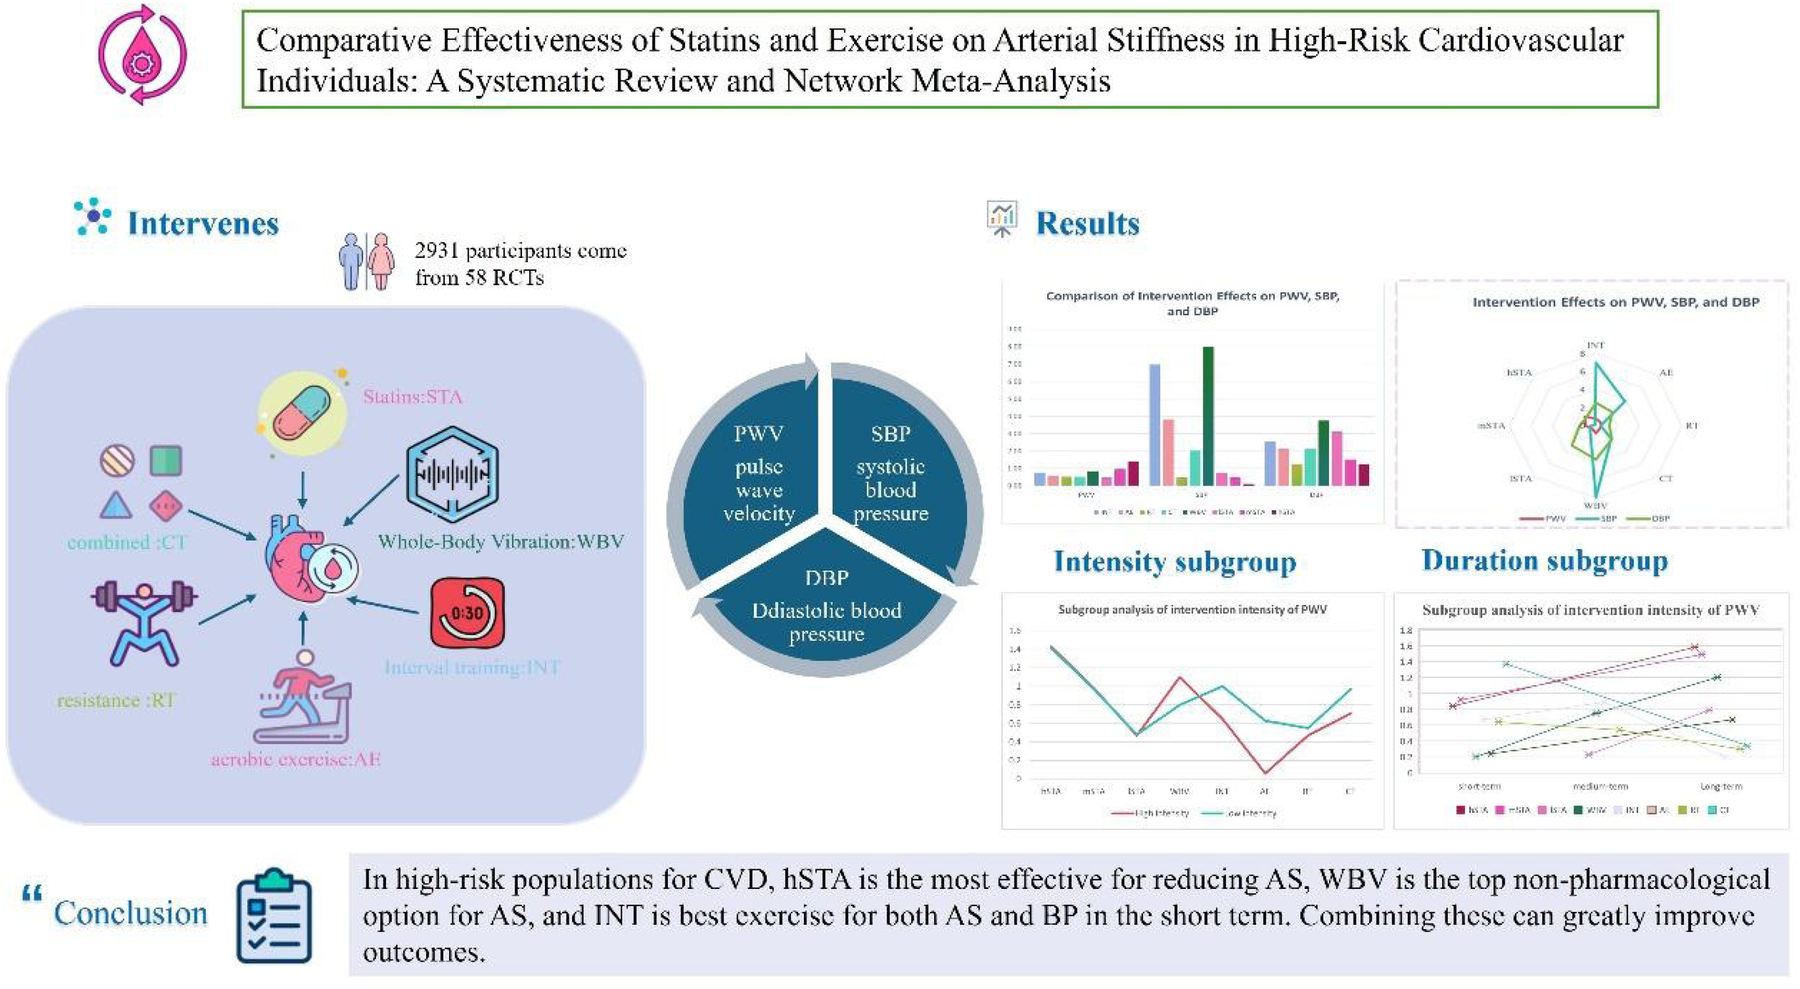
Abstract
Background and aims:
Arterial stiffness (AS) predicts cardiovascular disease (CVD) risk and relates to multiple factors. But the best interventions for AS in high—risk CVD groups are unknown. This review focuses on how different interventions affect AS and related indicators.
Methods:
We searched MEDLINE (PubMed), Embase, Cochrane Library, EBSCO, and Web of Science for relevant studies. Inclusion criteria: (1) randomized controlled trials (RCT); (2) participants with CVD risk factors as per American College of Sports Medicine (ACSM) guidelines; (3) interventions including Whole-Body Vibration (WBV), statins (STA), interval training (INT), aerobic exercise (AE), resistance exercise (RT), and combined exercise (CT); (4) control groups with usual care or placebo; (5) outcomes of pulse wave velocity (PWV), systolic blood pressure (SBP), and diastolic blood pressure (DBP); (6) studies in English. Data were analyzed using a random effects network meta-analysis and assessed for bias using the Cochrane tool.
Results:
This meta-analysis of 58 studies (n = 2,931) found all long-term interventions (STA, WBV, CT, RT, AE, INT) significantly reduced PWV (p < 0.001). WBV, INT, and AE notably lowered both SBP and DBP (p < 0.001). hSTA showed optimal PWV reduction (SUCRA=92.0), while WBV showed highest efficacy for SBP (SUCRA=94.0) and DBP (SUCRA=77.3).
Conclusions:
For CVD high-risk populations, high doses of statins (hSTA) optimally reduces AS; WBV is the top non-drug AS intervention, while INT best improves both AS and BP short-term. Combined, these interventions significantly enhance outcomes.
Systematic Review Registration:
https://www.crd.york.ac.uk/PROSPERO/display_record.php?RecordID=564538, PROSPERO CRD42024564538.
Graphical Abstract
1 Introduction
1.1 Background & significance
Arterial stiffness (AS), measured by pulse-wave velocity (PWV), is an independent predictor of cardiovascular disease (CVD). A 1 m/s PWV increase elevates cardiovascular events by 12%–14% and CVD mortality by 13%–15% (1). AS promotes atherosclerosis through endothelial dysfunction and inflammation (2). Despite statins’ established role in AS management, preventive strategies like exercise remain critical due to challenges in early intervention (3).
1.2 Exercise controversies
Exercise can improve AS by enhancing arterial remodeling, boosting endothelial function, lowering sympathetic nervous system activity, and reducing inflammatory cytokines (4). However, optimal modalities for distinct populations remain controversial due to inconsistent study protocols and populations. Specifically for high-risk CVD patients, meta-analyses conflict on whether aerobic (AE) or interval training (INT) is superior for AS reduction [Ramos 2015 favoring INT (6) vs. Saz-Lara 2021 finding no difference (5)]. Resistance training (RT) effects are particularly contentious: high-intensity RT increased AS in young adults (8) but improved it in another study despite acute BP elevation (7), while moderate-intensity RT showed no effect in young adults and no association in middle-aged populations (8). Whole-Body Vibration (WBV) enhances endothelial function via mechanical stimulation (12–15), but its comparative efficacy is unknown. These inconsistencies necessitate population- and intensity-specific exercise prescriptions.
1.3 Aerobic exercise mechanisms
Aerobic exercise (AE) is often recommended for improving vascular function due to its acute impact on blood vessel dilators like calcium (Ca2+), potassium (K+), hydrogen ions (H+), and carbon dioxide (CO₂) (5). Acutely, AE induces endothelial shear stress, triggering nitric oxide (NO) release and transient arterial dilation within 30–90 min post-exercise (20). Long-term AE (>8 weeks) reduces AS through structural adaptations: decreased collagen deposition, increased elastin content, and attenuated vascular inflammation (21). A analysis confirmed sustained AS improvement after 3-month AE programs in CVD patients (22).
1.4 Statins & research Gap
Statins are a cornerstone therapy for arterial stiffness (AS), a major CVD risk factor (16). Beyond cholesterol reduction, they improve endothelial function and arterial compliance via anti-inflammatory/antioxidant mechanisms, directly reducing AS (17, 18), potentially independent of lipid-lowering (19), underscoring their role in CVD risk management (16). However, critical gaps remain in optimizing statin therapy within broader strategies for high-risk CVD patients. Although systematic reviews exist for isolated interventions [e.g., exercise (4), statins (16)], key limitations persist: (1) Existing meta-analyses [e.g., (5, 6)] focus on single modalities, lacking direct comparisons between pharmacological (e.g., statins) and non-pharmacological (e.g., exercise) strategies; (2) Crucially, no review quantifies dose-response relationships for statin intensity (L/m/hSTA) vs. exercise types. This gap is clinically significant, resulting in absent integrated guidelines for combining statins, WBV, and multi-modal exercise to manage AS in high-risk individuals.
1.5 Study aim
The study aims to bridge this gap by systematically evaluating and comparing the effects of: Interval Training (INT), Aerobic Exercise (AE), Resistance Training (RT), Combined Training (CT), low- (lSTA), moderate- (mSTA), and high-intensity statins (hSTA), and Whole-Body Vibration (WBV) on arterial stiffness (primary outcome) and blood pressure (SBP/DBP, secondary outcomes) in adults at high risk for cardiovascular disease. The findings will provide evidence-based guidance for tailoring effective AS management strategies in this vulnerable population.
2 Methods
2.1 Registration
The study protocol was registered with PROSPERO (CRD42024564538) (23). The systematic review and network meta-analysis (NMA) adhered to the PRISMA-NMA guidelines.
2.2 Literature search strategy
We systematically searched MEDLINE (PubMed), Embase, the Cochrane Library, EBSCO, and Web of Science databases using a detailed electronic search strategy, outlined in Supplementary Appendix 2. The search strategy was based on key phrases related to the PICOS tool: (P) Population: “Hypertension” or “obesity” or “Type 2 diabetes” or “T2D” or “metabolic syndrome” or “older persons over 60 years”; (I) Intervention: “statins” or “simvastatin” or “rosuvastatin” or “lovastatin” or “fluvastatin” or “atorvastatin” or “WBV” or “whole-body vibration training” or “physical activity” or “training” or “aerobic exercise” or “moderate intensity continuous training” or “moderate interval training” or “high interval training” or “resistance training” or “strength training” or “combined training” or “sprint interval training” or “high intensity interval training”; (C) Comparator: “control group” or “no exercise” or “usual care” or “placebo-control”; (O) Outcomes: “arterial stiffness” or “pulse wave velocity” or “PWV”; and (S) Study type: “randomized controlled trial” or “randomized” or “placebo” or “RCT”. The search was restricted to English-language articles published from the inception of the databases through June 2024. We included RCTs that compared different exercise types on AS in high-risk populations for CVD.
2.3 Study selection
Duplicates were first removed using EndNote X9 software (Clarivate Analytics, Philadelphia, PA). Two researchers (JLC and HTM) then independently screened titles and abstracts to identify potentially relevant studies. These reviewers also independently assessed the studies for inclusion criteria. Discrepancies were resolved through discussion or, if needed, consultation with a third expert (JTZ). The inclusion criteria were: (1) Studies must be RCTs; (2) Subjects must have a known risk factor for CVD; (3) Interventions must include AE, RT, INT, CT, WBV, and STA; (4) Comparators must include no intervention, usual care, and placebo-control; (5) Outcomes must include PWV, SBP, and DBP; (6) Studies must be published in English.
Exclusion criteria were: (1) Healthy adult subjects; (2) Animal studies or randomized crossover trials; (3) Acute exercise interventions (<3weeks); (4) Incomplete data or lack of a control group; (5) Reviews, duplicate publications, letters to the editor, and meta-analyses.
2.4 Intervene categories
In the included RCTs, interventions comprised of INT, AE, RT, CT, WBV, and STA. As depicted in Table 1, we operationally defined these intervention as follows:
Table 1
| Type | Definition |
|---|---|
| INT | Frequency: 2–3 times per week |
| Intensity: >65% VO₂max, >65% HRR, or >75% HRmax | |
| Duration per Session: 20–30 min | |
| Mode: Any intermittent traditional interval training, including MIIT and HIIT (e.g., walking, running, cycling, rowing, swimming, elliptical, and stepping exercises) (24) | |
| HIIT | Frequency: 3–5 times per week |
| Intensity: 75%–90% HRmax, 65%–85%VO₂max, or 65%–85% HRR | |
| Duration per Session: ≥60 min | |
| Interval Time: <40 s | |
| MIIT | Frequency: 3–4 times per week |
| Intensity: 75%–90% HRmax, 65%–85% VO2maxa, or 65%–85% HRR | |
| Duration per Session: 30–59 min | |
| Interval Time: 40–90 s | |
| AE | Frequency: 3–5 times per week |
| Intensity: >45% VO₂max, >50% HRR, or >65% HRmax | |
| Duration per Session: 30–60 min | |
| Mode: Any continuous aerobic exercise (e.g., walking, running, cycling, rowing, swimming, aerobics, elliptical, stepping) | |
| RT | Frequency: 2–3 times per week |
| Intensity: ≥50% 1RM | |
| Duration per Session: 30–60 min | |
| Mode: Any resistance training, including circuit-based programs (e.g., free weights, weight machines, resistance bands) (14) | |
| CT | A combination of AE and RT |
| WBV | included six leg exercises standing on a WBV platform |
| lSTA | STA dosage <10 mg once daily |
| mSTA | STA dosage of 10–20 mg once daily |
| hSTA | STA dosage >10 mg once daily |
| CON | No exercise or usual care or placebo |
Definition of the types of exercise.
VO2max, maximal oxygen uptake; HRR, heart rate reserve; HRmax, maximum heart rate; RM, repetition maximu.
2.5 Outcomes
The primary outcome of this study was PWV, with secondary outcomes including SBP and DBP. The cfPWV (carotid-femoral pulse wave velocity) is the gold standard for AS, defined as the distance between measurement sites divided by the time for the pulse wave to travel. A PWV >10 m/s indicates AS (25). This study mainly used cfPWV, with some baPWV (brachial-ankle pulse wave velocity) measurements. baPWV correlates with cfPWV but has limitations due to artery elasticity and measurement interference (26). SBP is the maximum pressure during heart contraction, DBP is the pressure when the heart is relaxed, and PP is the difference between SBP and DBP (27). Stage I hypertension is SBP 130–139 mmHg and/or DBP 80–89 mmHg.
2.6 Data extraction
Data extraction was conducted independently by two investigators (JLC and HTM). Any disagreements were resolved through consensus or by consulting a third author (JTZ) if necessary. Collected information included the first author, publication year, country, subject characteristics (sample size, gender, age, PWV, SBP, DBP, and concomitant diseases), intervention details (type, intensity, duration, frequency, and supervision status), and outcome measures reported in each eligible study, as outlined in Supplementary Appendix 4. For studies with insufficient information, email communication was used to obtain the missing values.
2.7 Risk of bias and GRADE assessment
The risk of bias (ROB) in the included studies was assessed by two researchers using the Cochrane Risk of Bias tool (28), which covers seven domains: (a) allocation generation, (b) allocation concealment, (c) blinding of participants and personnel, (d) blinding of outcome assessment, (e) handling of incomplete outcome data, (f) freedom from selective reporting bias, and (g) other forms of bias. Due to the difficulty in blinding participants to exercise interventions, this component was not factored into the overall ROB score. Studies were categorized into three risk levels: low risk if none of the domains were rated as high risk and ≤3 domains were rated as unclear; moderate risk if one domain was rated as high risk or no domain was high risk but ≥4 domains were unclear; high risk for all other cases (29). The Grading of Recommendations Assessment, Development and Evaluation (GRADE) framework was used to assess the certainty of the evidence for both primary and secondary outcomes (30).
2.8 Data synthesis and statistical analyses
The experimental effect was estimated by combining the pre-to-post changes of both the experimental and CON. The standard deviation (SD) of the change value was calculated using the formula provided in the Cochrane Handbook (version 6.3) (31). (the formula is
Heterogeneity among studies was evaluated using network estimates and pairwise meta-analytic techniques with Review Manager 5.3 (Nordic Cochrane, Denmark). Sensitivity analysis was performed to examine this heterogeneity (32). Pooled effect estimates were computed with a random-effects model, and mean differences (MD) were assessed for PWV, SBP, and DBP. Heterogeneity was measured using the I2 statistic and Cochran's Q test, with significant heterogeneity defined as I2 > 50% or p ≤ 0.10 (33). Publication bias was assessed using a funnel plot and Begg's test.
Statistical analysis was conducted using STATA 16.0 (STATA Corp, College Station, TX, USA) within a frequentist framework and random-effects multivariate network meta-analysis (NMA) (34). Weighted mean differences were reported for continuous variables, with 95% confidence intervals (CI) and 95% prediction intervals. Interventions were compared using network geometry, where node size and line thickness indicated the number of studies and the direct relationships between interventions.
Inconsistencies were evaluated using loop-specific, node-splitting, and global methods to assess ring, local, and global inconsistencies (35). A p-value < 0.05 indicated inconsistency, allowing further NMA analysis (36). The transitivity assumption was checked using a consistency model to ensure valid comparisons and random allocation (36, 37). The network contribution diagram showed the impact of each direct comparison on the NMA results.
The cumulative ranking curve (SUCRA) was used to rank different exercise modalities (31). SUCRA values range from 0 to 100, with higher values representing better outcomes (38, 39,40). Publication bias was also evaluated using a funnel plot and symmetry criterion.
3 Results
3.1 Literature selection
We retrieved 1,973 articles from the database and an additional 5 from other sources, totaling 1,978 articles. After removing 799 duplicates, 1,179 unique articles remained. We then reviewed the titles and abstracts, excluding 668 articles and leaving 511 candidates. A further review of the full texts led to the exclusion of 453 more articles, resulting in 58 articles that met our criteria. Thus, 58 eligible articles were identified, as shown in Figure 1.
Figure 1
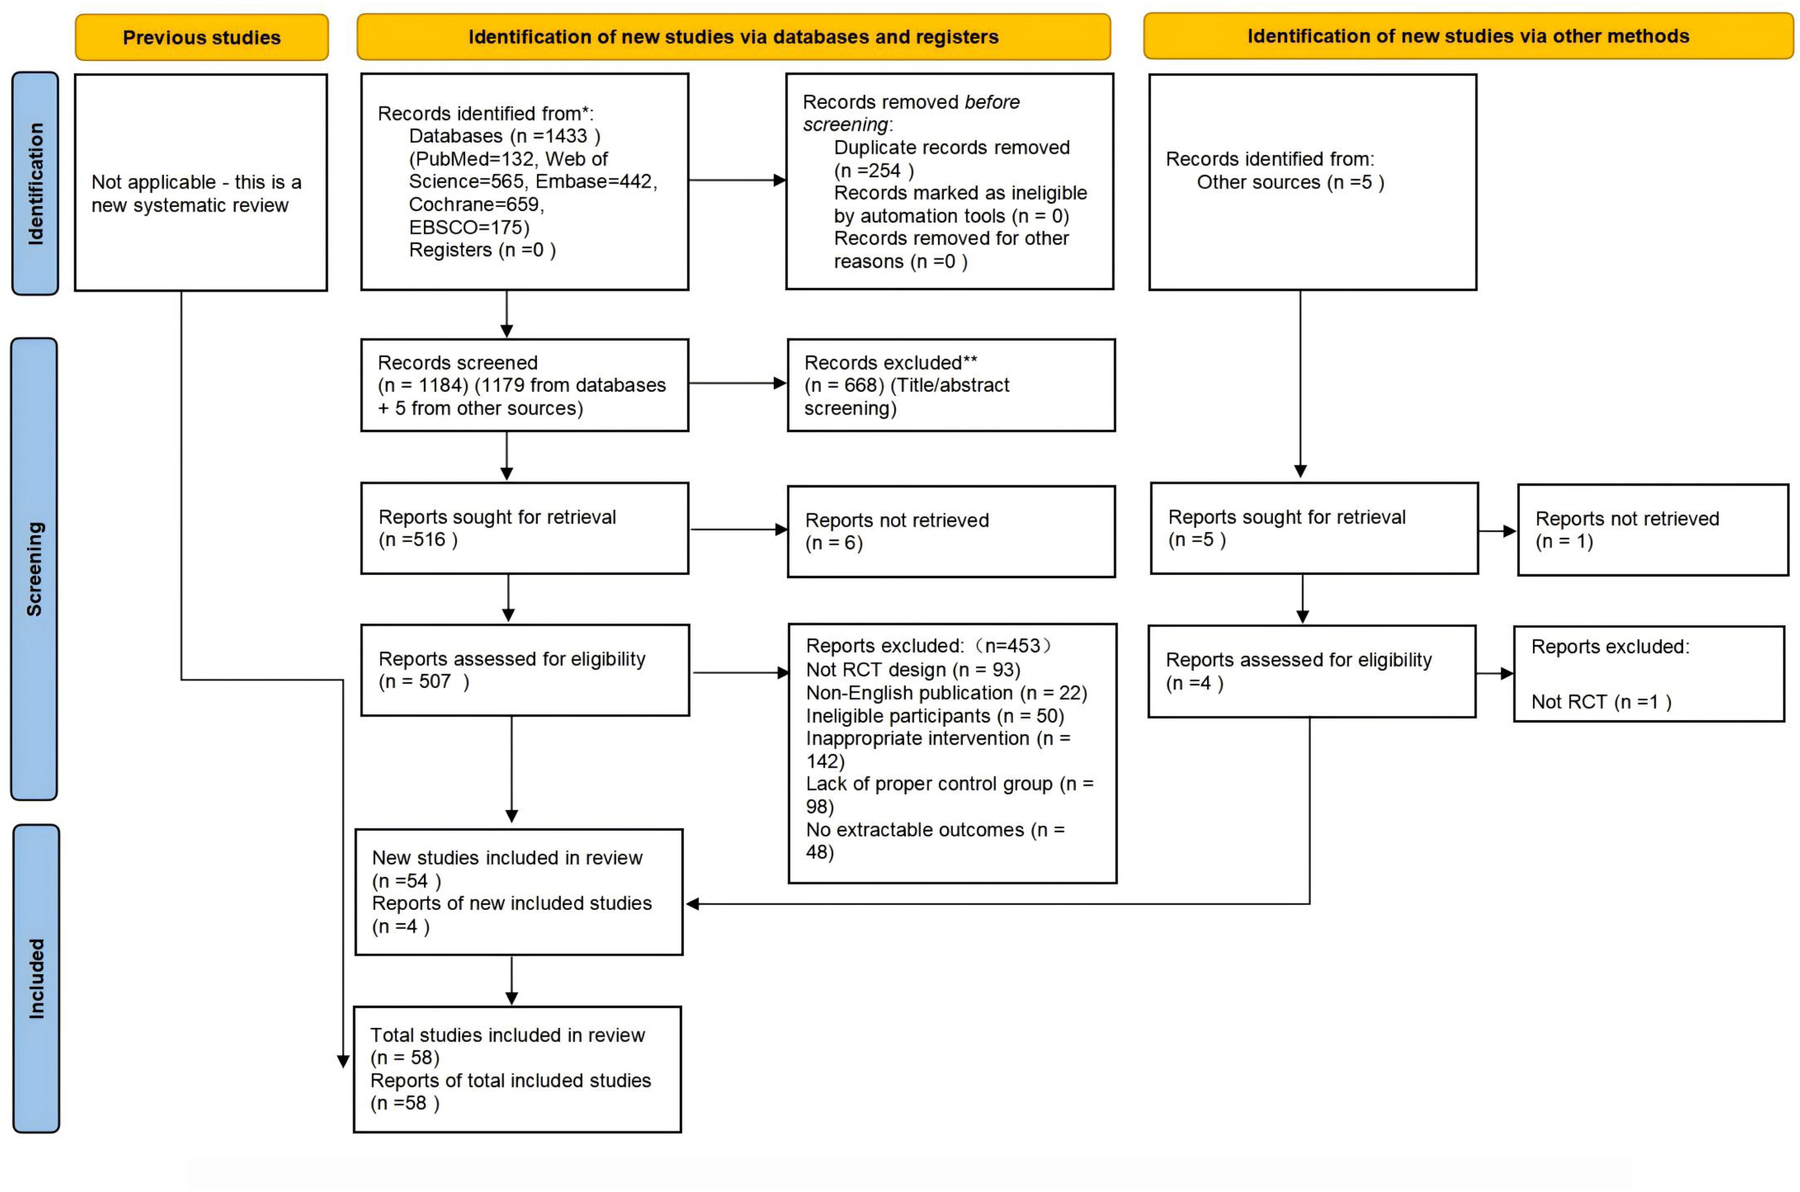
Preferred reporting items for systematic reviews and meta-analyses (PRISMA 2020) flow diagram of each stage of the study selection. Note. RCT indicates randomized controlled trial.
3.2 Characteristics of the included studies
Supplementary Appendix 4 outlines the characteristics of the studies included in our review, conducted between 2003 and 2024 across various regions: Asia (18 studies), North America (19), South America (2), Europe (13), Oceania (2), Latin America (2), and Africa (2). In total, these studies involved 2,931 subjects at high risk for CVD. The experimental group consisted of 1,538 subjects, further categorized into subgroups: INT: 369, AE: 351, RT: 153, CT: 209, WBV: 58, lSTA: 48, mSTA: 251, and hSTA: 99. The control group included 1,393 subjects.
Approximately 50.3% of participants were female, with ages ranging from 10 to 75 years. The studies differed in gender focus: 10 included only males, 11 only females, and 37 included both genders. All 58 studies targeted individuals at high risk for CVD, adhering to American College of Sports Medicine (ACSM) guidelines, which recognize obesity, diabetes, hypertension, metabolic disorders, and advanced age as significant risk factors.
Types of statin therapy include simvastatin, rosuvastatin, lovastatin, fluvastatin, and atorvastatin. In the study, statin dosages were categorized as lSTA (less than 10 mg once daily), mSTA (10–20 mg once daily), and hSTA (more than 20 mg once daily). Exercise interventions included INT, AE, RT, CT (AE + RT), and WBV, with intensity ranging from high to low. The duration of these interventions varied from 8 to 96 weeks and encompassed activities such as running, cycling, rowing, swimming, stepping exercises, free weights, weight machines, and resistance bands. Exercise frequency ranged from 3 to 7 sessions per week, with each session lasting between 30 and 90 min. The control group received usual care, placebo, active control, or no exercise. Among the studies, 38 involved supervised exercise interventions, 3 combined supervisions with home-based interventions, and 17 had no supervision.
Carotid-femoral pulse wave velocity (cfPWV) was measured using applanation tonometry with the SphygmoCor CPV device (AtCor Medical, Australia) or SphygmoCor software version 9.0 (AtCor Medical Pty. Ltd., West Ryde, Australia). CfPWV was calculated by recording pressure pulse waves at the carotid and femoral arteries with a high-fidelity micromanometer (Millar Instruments, Houston, TX) and dividing the distance between the recording sites by the time delay between the carotid and femoral pulse waves (37, 46).
3.3 Results of ROB assessment
The risk of bias (ROB) assessments for each study are detailed in Supplementary Appendix 5. Among the studies, two had a high risk of bias due to randomization procedures, while 18 studies employed appropriate allocation concealment methods. Blinding of outcome assessment was associated with a low risk of bias in 45 studies, whereas eight studies exhibited a high risk of bias related to missing outcome values. Selective reporting posed a low risk of bias in 14 studies. Additionally, studies with sample sizes smaller than 10 or significant measurement errors were classified as having a high risk of other biases, with 44 studies demonstrating a low risk of such biases. In summary, 37 articles were rated as having low ROB, while 15 and 6 articles were rated as having moderate and high ROB, respectively.
3.4 Direct pairwise meta-analyses
3.4.1 Primary outcome
Figure 2 presents forest plots showing the differences and heterogeneity in the effects of exercise (INT, AE, RT, CT, and WBV) and statins (lSTA, mSTA, and hSTA) on improving PWV compared to the CON.
Figure 2
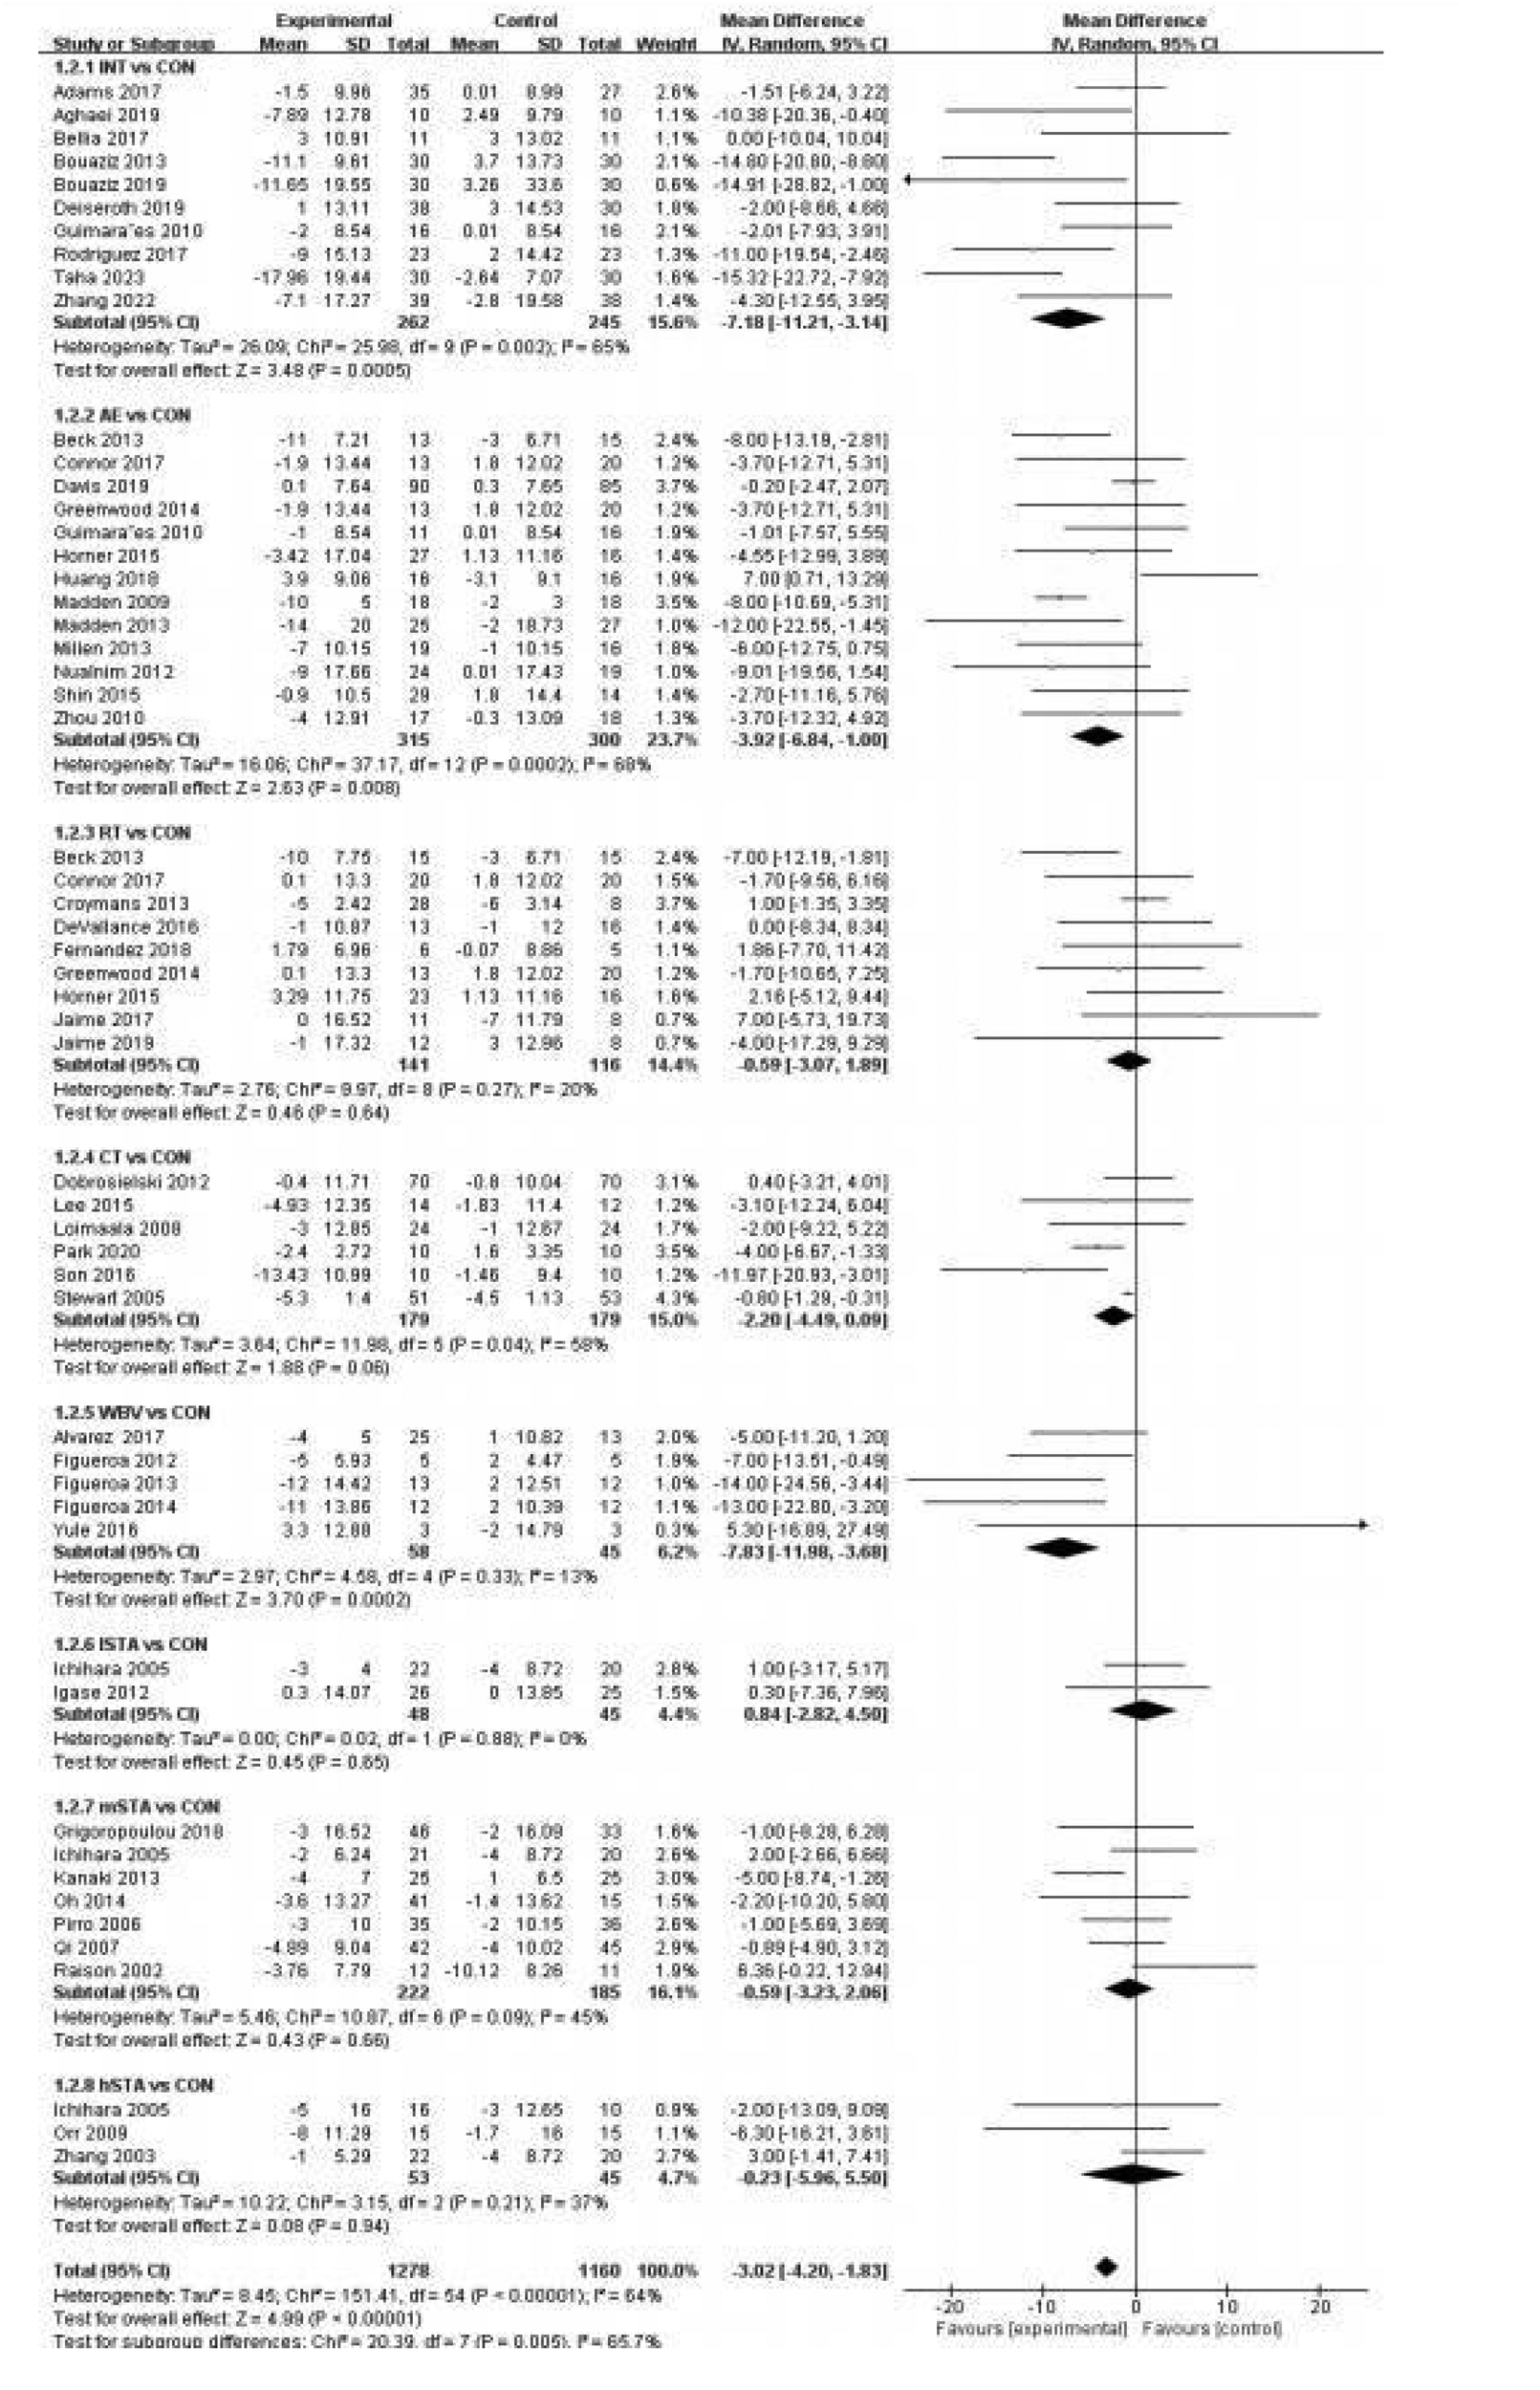
Forest plot of pulse wave velocity.
A pairwise meta-analysis was conducted, and the forest plot of PWV for exercise and statin categories is shown with detailed trial-level information (Figure 2). Compared to the CON, RT significantly decreased PWV with an SMD of −0.38 [p = 0.09, 95% CI (−0.59, −0.17), I2 = 40%], indicating lower heterogeneity. In contrast, INT [SMD = −0.69, p < 0.00001, 95% CI (−1.03, −0.35), I2 = 71%], AE [SMD = −0.61, p < 0.00001, 95% CI (−1.12, −0.10), I2 = 94%], CT [SMD = −0.69, p < 0.00001, 95% CI (−1.60, 0.24), I2 = 98%], lSTA [SMD = −0.44, p = 0.05, 95% CI (−0.98, 0.09), I2 = 74%], and mSTA [SMD = −0.92, p = 0.005, 95% CI (−1.65, −0.19), I2 = 65%] also significantly reduced PWV but with higher heterogeneity. WBV and hSTA showed no significant effect on PWV compared to the CON (p > 0.1). Funnel plots and Begg's test identified publication bias in the RT and hSTA subgroups, while other subgroups showed no evidence of publication bias (Supplementary Appendix 6.1).
3.4.2 Secondary outcomes
The forest plot of secondary outcomes, including SBP and DBP, for exercise and statin categories is shown in Supplementary Appendix 7.2–7.3. The pairwise meta-analysis results indicated that INT, AE, CT, and mSTA significantly reduced SBP, while INT, AE, RT, and lSTA significantly decreased DBP (p < 0.01). Funnel plot analysis and Begg's test identified publication bias for RT, WBV, lSTA, and mSTA in SBP, and for INT, RT, and mSTA in DBP (p < 0.001). No publication bias was observed in other subgroups (Supplementary Appendix 6.2, 6.3).
3.5 Network meta-analysis
This study primarily focused on PWV as the main outcome and blood pressure parameters, specifically SBP and DBP, as secondary outcomes, all of which were analyzed using NMA. Supporting materials included network evidence plots, loop-specific approaches, node-splitting techniques, global inconsistency assessments, network forest plots, network contribution plots, funnel plots, and cumulative ranking plots. Figure 2 presents an annotated graphical abstract.
The network evidence plot compares the differential impact of various exercise interventions on PWV and secondary outcomes. Figure 2 illustrates the NMA chart for PWV, SBP, and DBP. The connecting lines between nodes represent direct relationships between interventions, with the size of each node and the thickness of the lines proportional to the number of studies. As shown in Figure 3, AE intervention studies are predominant, whereas hSTA intervention studies are relatively scarce.
Figure 3
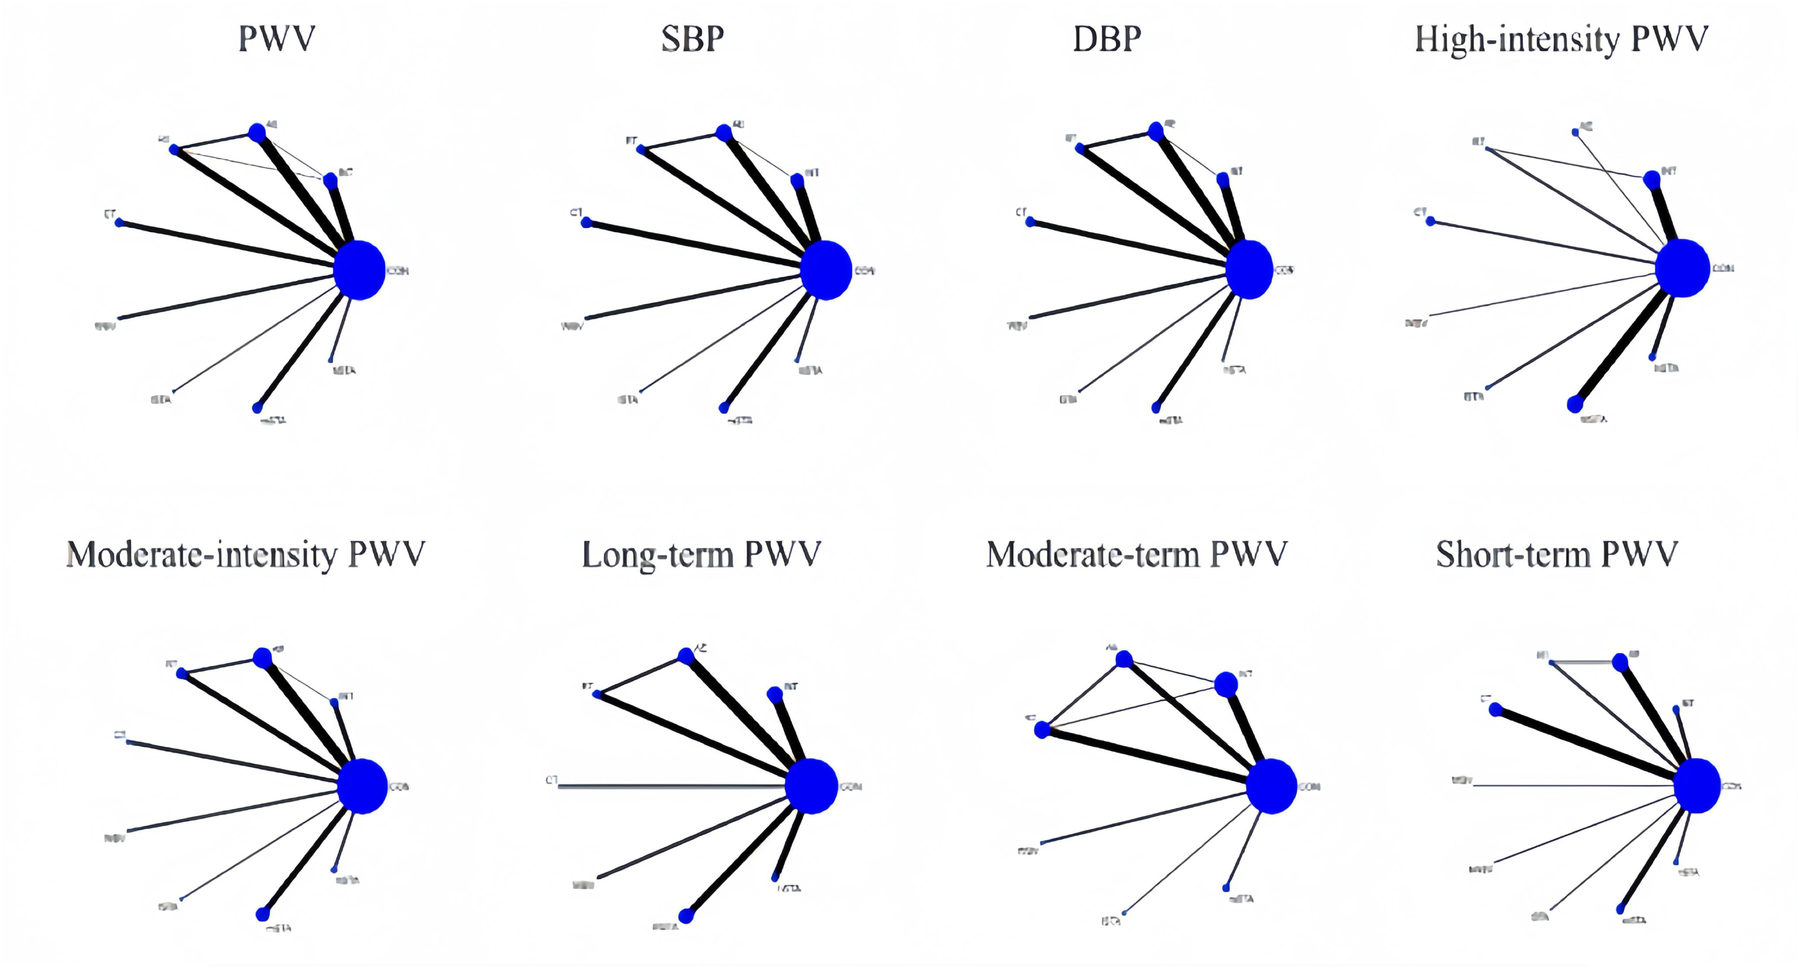
Network meta-analysis of eligible comparisons for PWV, SBP, and DBP, high-intensity PWV, moderate-intensity PWV, long-term PWV, moderate-term PWV, and short-term PWV.
The inconsistency test plots include the loop-specific approach, node-splitting, and global inconsistency tests, which assess the consistency of PWV, SBP, and DBP at the loop, local, and global levels, respectively (Supplementary Appendix 9). The results of the loop-specific approach indicate that all closed loops involving PWV, SBP, and DBP exhibit good consistency, which showed inconsistency in PWV. Global inconsistency was assessed using an inconsistency model, and the results demonstrated that the p-values for PWV, SBP, and DBP were all greater than 0.05, indicating overall good consistency. Furthermore, the node-splitting analysis revealed no significant difference between indirect and direct comparisons (p > 0.05), suggesting reliable results (Supplementary Appendix 9).
The network forest plots illustrate the differences in intervention effects between various exercise and statins (including CON) through pairwise comparisons. Supplementary Appendix 10 displays the network forest diagrams for PWV, SBP, and DBP with 95% confidence intervals and 95% prediction intervals.
The contribution of direct and indirect comparisons to NMA is illustrated in the Network Contribution Graph (Supplementary Appendix 8), which also shows the number of studies for each direct comparison.
Funnel plots were used to assess publication bias in NMA, with PWV, SBP, and DBP all showing high symmetry, indicating an absence of publication bias.
Cumulative ranking curves (SUCRA) were employed to rank and compare the intervention effects of different types of exercise on PWV, SBP, and DBP. Supplementary Appendix 12 (1–4) presents the SUCRA probability rank results for various exercise and statins.
3.5.1 Pooled estimates of primary outcomes
Table 2 presents the pooled estimates from the NMA of PWV. The interventions and their corresponding SMD, 95% CI, and p-values are as follows: hSTA [SMD = −1.39, 95% CI (−2.22, −0.56), p < 0.0001], mSTA [SMD = −0.96, 95% CI (−1.55, −0.36), p < 0.0001], WBV [SMD = −0.84, 95% CI (−1.51, −0.16), p < 0.0001], CT [SMD = −0.52, 95% CI (−1.02, −0.01), p < 0.0001], RT [SMD = −0.53, 95% CI (−0.96, −0.5), p < 0.0001], AE [SMD = −0.57, 95% CI (−0.93, −0.21), p < 0.0001], and INT [SMD = −0.77, 95% CI (−1.17, −0.36), p < 0.0001] all show significant improvements in PWV compared to CON. The SUCRA rankings in Table 3 reveal that hSTA (SUCRA = 92) is the most likely to be the best intervention for PWV, whereas lSTA (SUCRA = 38) is the least effective.
Table 2
| Classification type | Criteria |
|---|---|
| Frequency | |
| Low | 1–2 times/week |
| Moderate | 3–4 times/week |
| High | 3 ≥ 5 times/week |
| Duration per session | |
| Short | <30 min |
| Moderate-1 | 30–44 min |
| Moderate-2 | 45–59 min |
| long | ≥60 min |
| Length of intervention | |
| Short | <13 weeks (3 months) |
| Moderate long | 14–25 weeks (3 months-6 months) ≥60 min (≥6 months) |
| Intensity | |
| Low | Interval training: |
| < 75%HR max/ 65% V˙O2max/65% HRR | |
| Aerobic exercise: <60%HR max/ 60% V˙O2max Resistance training: <50% of 1 RM | |
| Moderate | Interval training: |
| 75%-90% HR max/65%–85% V˙O2max/65%–85% HRR | |
| Aerobic exercise: 60%-85% HR max/60%–80% V˙O2max Resistance training: 60%–80% of 1 RM | |
| High | Interval training: |
| >90% HR max/85% V˙O2max/85% V˙O2max | |
| Aerobic exercise: >85% HR max/80% V˙O2max, | |
| Resistance training: 80%–100% of 1 RM | |
The classifications for exercise according to the frequency, intensity, duration per session, and the length of intervention.
Table 3
| PWV in High intensity, m/s | ||||||||
| hSTA | 0.43 (−0.59,1.45) | 0.91 (−0.27,2.09) | 0.55 (−0.52,1.62) | 0.86 (−0.11,1.84) | 0.86 (−0.08,1.79) | 0.82 (−0.09,1.73) | 0.62 (−0.30,1.55) | 1.39 (0.56,2.22) |
| −0.43 (−1.45,0.59) | mSTA | 0.47 (−0.55,1.50) | 0.12 (−0.78,1.02) | 0.43 (−0.35,1.21) | 0.43 (−0.31,1.16) | 0.39 (−0.31,1.08) | 0.19 (−0.53,0.91) | 0.96 (0.36,1.55) |
| −0.91 (−2.09,0.27) | −0.47 (−1.50,0.55) | lSTA | −0.36 (−1.43,0.72) | −0.04 (−1.01,0.93) | −0.05 (−0.99,0.89) | −0.09 (−0.99,0.82) | −0.28 (−1.21,0.64) | 0.48 (−0.35,1.32) |
| −0.55 (−1.62,0.52) | −0.12 (−1.02,0.78) | 0.36 (−0.72,1.43) | WBV | 0.31 (−0.53,1.15) | 0.31 (−0.49,1.11) | 0.27 (−0.50,1.03) | 0.07 (−0.71,0.86) | 0.84 (0.16,1.51) |
| −0.86 (−1.84,0.11) | −0.43 (−1.21,0.35) | 0.04 (−0.93,1.01) | −0.31 (−1.15,0.53) | CT | −0.01 (−0.66,0.65) | −0.04 (−0.66,0.57) | −0.24 (−0.88,0.40) | 0.52 (0.03,1.02) |
| −0.86 (−1.79,0.08) | −0.43 (−1.16,0.31) | 0.05 (−0.89,0.99) | −0.31 (−1.11,0.49) | 0.01 (−0.65,0.66) | RT | −0.04 (−0.54,0.46) | −0.23 (−0.79,0.32) | 0.53 (0.11,0.96) |
| −0.82 (−1.73,0.09) | −0.39 (−1.08,0.31) | 0.09 (−0.82,0.99) | −0.27 (−1.03,0.50) | 0.04 (−0.57,0.66) | 0.04 (−0.46,0.54) | AE | −0.20 (−0.71,0.32) | 0.57 (0.21,0.93) |
| −0.62 (−1.55,0.30) | −0.19 (−0.91,0.53) | 0.28 (−0.64,1.21) | −0.07 (−0.86,0.71) | 0.24 (−0.40,0.88) | 0.23 (−0.32,0.79) | 0.20 (−0.32,0.71) | INT | 0.77 (0.36,1.17) |
| −1.39 (−2.22,−0.56) | −0.96 (−1.55,−0.36) | −0.48 (−1.32,0.35) | −0.84 (−1.51,−0.16) | −0.52 (−1.02,−0.03) | −0.53 (−0.96,−0.11) | −0.57 (−0.93,−0.21) | −0.77 (−1.17,−0.36) | CON |
| SBP, mm/Hg | ||||||||
| hSTA | −0.39 (−6.68,5.90) | 0.87 (−7.08,8.81) | −7.88 (−15.18,−0.58) | −1.92 (−8.14,4.31) | −0.35 (−6.65,5.95) | −3.71 (−9.72,2.31) | −6.85 (−12.95,−0.75) | 0.11 (−5.42,5.64) |
| 0.39 (−5.90,6.68) | mSTA | 1.26 (−5.18,7.69) | −7.49 (−13.13,−1.85) | −1.53 (−5.68,2.62) | 0.04 (−4.20,4.28) | −3.32 (−7.14,0.50) | −6.46 (−10.42,−2.51) | 0.50 (−2.47,3.48) |
| −0.87 (−8.81,7.08) | −1.26 (−7.69,5.18) | lSTA | −8.74 (−16.19,−1.30) | −2.78 (−9.18,3.61) | −1.22 (−7.67,5.24) | −4.57 (−10.76,1.61) | −7.72 (−13.99,−1.45) | −0.75 (−6.46,4.96) |
| 7.88 (0.58,15.18) | 7.49 (1.85,13.13) | 8.74 (1.30,16.19) | WBV | 5.96 (0.38,11.54) | 7.53 (1.88,13.18) | 4.17 (−1.17,9.51) | 1.03 (−4.41,6.47) | 7.99 (3.21,12.77) |
| 1.92 (−4.31,8.14) | 1.53 (−2.62,5.68) | 2.78 (−3.61,9.18) | −5.96 (−11.54,−0.38) | CT | 1.57 (−2.61,5.74) | −1.79 (−5.53,1.95) | −4.93 (−8.82,−1.05) | 2.03 (−0.85,4.92) |
| 0.35 (−5.95,6.65) | −0.04 (−4.28,4.20) | 1.22 (−5.24,7.67) | −7.53 (−13.18,−1.88) | −1.57 (−5.74,2.61) | RT | −3.36 (−6.85,0.14) | −6.50 (−10.47,−2.54) | 0.46 (−2.55,3.48) |
| 3.71 (−2.31,9.72) | 3.32 (−0.50,7.14) | 4.57 (−1.61,10.76) | −4.17 (−9.51,1.17) | 1.79 (−1.95,5.53) | 3.36 (−0.14,6.85) | AE | −3.15 (−6.58,0.29) | 3.82 (1.43,6.21) |
| 6.85 (0.75,12.95) | 6.46 (2.51,10.42) | 7.72 (1.45,13.99) | −1.03 (−6.47,4.41) | 4.93 (1.05,8.82) | 6.50 (2.54,10.47) | 3.15 (−0.29,6.58) | INT | 6.97 (4.37,9.57) |
| −0.11 (−5.64,5.42) | −0.50 (−3.48,2.47) | 0.75 (−4.96,6.46) | −7.99 (−12.77,−3.21) | −2.03 (−4.92,0.85) | −0.46 (−3.48,2.55) | −3.82 (−6.21,−1.43) | −6.97 (−9.57,−4.37) | CON |
| DBP, mm/Hg | ||||||||
| hSTA | −0.27 (−6.09,5.56) | −1.87 (−8.97,5.23) | −2.50 (−9.32,4.31) | −0.86 (−6.75,5.03) | 2.52 (−3.26,8.30) | −0.89 (−6.43,4.65) | −1.30 (−6.86,4.27) | 1.25 (−3.81,6.31) |
| 0.27 (−5.56,6.09) | mSTA | −1.60 (−7.36,4.15) | −2.23 (−7.63,3.16) | −0.59 (−4.77,3.58) | 2.79 (−1.23,6.80) | −0.63 (−4.29,3.03) | −1.03 (−4.72,2.67) | 1.51 (−1.37,4.40) |
| 1.87 (−5.23,8.97) | 1.60 (−4.15,7.36) | lSTA | −0.63 (−7.39,6.13) | 1.01 (−4.82,6.84) | 4.39 (−1.33,10.10) | 0.98 (−4.50,6.45) | 0.57 (−4.92,6.07) | 3.12 (−1.87,8.10) |
| 2.50 (−4.31,9.32) | 2.23 (−3.16,7.63) | 0.63 (−6.13,7.39) | WBV | 1.64 (−3.83,7.11) | 5.02 (−0.33,10.37) | 1.61 (−3.48,6.70) | 1.21 (−3.91,6.32) | 3.75 (−0.82,8.31) |
| 0.86 (−5.03,6.75) | 0.59 (−3.58,4.77) | −1.01 (−6.84,4.82) | −1.64 (−7.11,3.83) | CT | 3.38 (−0.73,7.48) | −0.03 (−3.80,3.73) | −0.44 (−4.24,3.37) | 2.11 (−0.91,5.13) |
| −2.52 (−8.30,3.26) | −2.79 (−6.80,1.23) | −4.39 (−10.10,1.33) | −5.02 (−10.37,0.33) | −3.38 (−7.48,0.73) | RT | −3.41 (−6.67,−0.15) | −3.81 (−7.42,−0.20) | −1.27 (−4.06,1.52) |
| 0.89 (−4.65,6.43) | 0.63 (−3.03,4.29) | −0.98 (−6.45,4.50) | −1.61 (−6.70,3.48) | 0.03 (−3.73,3.80) | 3.41 (0.15,6.67) | AE | −0.40 (−3.54,2.74) | 2.14 (−0.11,4.40) |
| 1.30 (−4.27,6.86) | 1.03 (−2.67,4.72) | −0.57 (−6.07,4.92) | −1.21 (−6.32,3.91) | 0.44 (−3.37,4.24) | 3.81 (0.20,7.42) | 0.40 (−2.74,3.54) | INT | 2.54 (0.23,4.86) |
| −1.25 (−6.31,3.81) | −1.51 (−4.40,1.37) | −3.12 (−8.10,1.87) | −3.75 (−8.31,0.82) | −2.11 (−5.13,0.91) | 1.27 (−1.52,4.06) | −2.14 (−4.40,0.11) | −2.54 (−4.86,−0.23) | CON |
Network meta-analysis matrix of PWV and secondary outcomes.
Effects are expressed as the effect size [95% CI] between interventions. Bold values indicate statistical significance (p < 0.05), light cyan areas indicate the effect of the longitudinal versus the lateral intervention, pink areas indicate the effect of the lateral versus the longitudinal intervention, grey areas represent the intervention category, and black areas represent the group. For example, “-0.77 (-1.17,-0.36)” (column 8, row 8), which indicates that INT (longitudinal intervention) significantly reduces PWV compared with CON (transverse intervention). CON, control group; INT, interval training; AE, aerobic exercise; RT, resistance training; CT, combined training; WBV, whole-body vibration training; lSTA, low doses of statins; mSTA, moderate doses of statins; hSTA, high doses of statins.
▪ Efficacy (response rate).
▪ Comparison.
▪ Acceptability (dropout rate).
▪ Group.
Effects are expressed as the effect size [95% CI] between interventions. Bold indicates that the data are significant, light cyan areas indicate the effect of the longitudinal vs. the lateral intervention, pink areas indicate the effect of the lateral vs. the longitudinal intervention, grey areas represent the intervention category, and black areas represent the group. For example, “−0.77 (−1.17, −0.36)” (column 8, row 8), which indicates that INT (longitudinal intervention) significantly reduces PWV compared with CON (transverse intervention).
CON, control group; INT, interval training; AE, aerobic exercise; RT, resistance training; CT, combined training; WBV, whole-body vibration training; lSTA, low doses of statins; mSTA, moderate doses of statins; hSTA, high doses of statins.
3.5.2 Pooled estimates of the secondary outcome
The secondary indicators of this study were DBP and SBP. As shown in Table 3, WBV [SMD = −7.99, 95% CI (−12.77, −3.21), p < 0.0001], AE [SMD = −3.82, 95% CI (−6.21, −1.43), p < 0.0001], and INT [SMD = −6.97, 95% CI (−9.57, −4.37), p < 0.0001] significantly reduce SBP compared to CON. WBV [SMD = −2.54, 95% CI (−4.86, −0.21), p < 0.0001] significantly reduces DBP compared to CON. The SUCRA probability rankings in Table 3 indicate that WBV (SUCRA = 94) is the most likely to be the best intervention for SBP, whereas lSTA (SUCRA = 23.1) is the least effective. For DBP, WBV (SUCRA = 77.3) is the most likely to be the best intervention, while RT (SUCRA = 8.4) is the least effective.
3.5.3 Subgroup NMA of primary outcome
We conducted subgroup analysis to assess the impact of intervention intensity and duration on PWV outcomes. Intervention intensity was categorized into high and medium-low groups, while intervention duration was classified into short, medium, and long cycles (Supplementary Appendix 15, 16).
Table 4 presents the results of subgroup analyses for intervention intensity and duration on PWV. The SUCRA probability rankings show that, at high intensity, WBV (SUCRA = 72.2) is the most effective sports intervention, excluding statins (lST, mSTA, hSTA) while CT (SUCRA = 23.1) is the least effective. At moderate intensity, CT (SUCRA = 69) is the most effective, and RT (SUCRA = 33.8) is the least effective. Regarding intervention duration, CT (SUCRA = 87.4) is the most effective in the short term, whereas AE (SUCRA = 29.6) is the least effective. In the medium term, INT (SUCRA = 90.5) is the most effective, while mSTA (SUCRA = 1.5) is the least effective. In the long term, hSTA (SUCRA = 83.3) is the most effective, and INT (SUCRA = 26.9) is the least effective.
Table 4
| Group | Studies | PWV(m/s) | |||||
|---|---|---|---|---|---|---|---|
| Rank | Reference | WMD (15% CI) | SUCRA | PrBest | MeanRank | ||
| Intervene intensity | |||||||
| High intensity | 1 | hSTA | (49,54,55, 58) | −1.43 (−2.20, −0.66) | 91.6 | 54.3 | 1.7 |
| 2 | mSTA | (47,48,50,52,53,56,57,58) | −0.98 (−1.53, −0.42) | 76.3 | 8.4 | 2.9 | |
| 3 | WBV | (44) | −1.10 (−2.85,0.65) | 72.2 | 34.2 | 3.2 | |
| 4 | INT | (4,5,6,8,10,11,12, 33) | −0.65 (−1.07, −0.23) | 58.9 | 0.4 | 4.3 | |
| 5 | lSTA | (51, 58) | −0.47 (−1.20,0.25) | 49.2 | 1.2 | 5.1 | |
| 6 | RT | (27,33,37,40,) | −0.47 (−1.12,0.18) | 48.7 | 0.8 | 5.1 | |
| 7 | AE | (22) | −0.06 (−1.06,0.94) | 28.8 | 0.6 | 6.7 | |
| 8 | CT | (42) | 0.71 (−0.14,1.56) | 3.2 | 0 | 8.7 | |
| Moderate intensity | 1 | hSTA | (49,54,55, 58) | −1.41 (−2.21, −0.61) | 89.5 | 61.9 | 1.8 |
| 2 | INT | (1,2,3,8,9,10,13) | −1.00 (−1.64, −0.36) | 69 | 12.9 | 3.5 | |
| 3 | CT | (34,35,36,38,39,41) | −0.97 (−1.51, −0.42) | 66.6 | 8.8 | 3.7 | |
| 4 | mSTA | (47,48,50,52,53,56,57,58) | −0.97 (−1.54, −0.40) | 66.5 | 9.2 | 3.7 | |
| 5 | WBV | (42,43,45,46) | −0.80 (−1.48, −0.12) | 52.8 | 5.1 | 4.8 | |
| 6 | AE | (1,14,15,16,17,18,20,21, 23,24,25,28,29,30) | −0.63 (−0.99, −0.27) | 38.8 | 0.2 | 5.9 | |
| 7 | RT | (19,25,28,29,30,31,) | −0.55 (−1.04, −0.07) | 33.8 | 0.3 | 6.3 | |
| 8 | lSTA | (51, 58) | −0.48 (−1.25,0.30) | 31.3 | 1.5 | 6.5 | |
| Intervene duration | |||||||
| Short term | 1 | CT | (36) | −1.37 (−2.00, −0.74) | 87.4 | 44.5 | 1.9 |
| 2 | mSTA | (50,56) | −0.92 (−1.75, −0.10) | 66.2 | 10.6 | 3.4 | |
| 3 | hSTA | (49,55) | −0.84 (−2.26,0.58) | 60 | 18.2 | 3.8 | |
| 4 | INT | (2,3,13) | −0.67 (−1.70,0.37) | 52.7 | 6.4 | 4.3 | |
| 5 | RT | (31,29) | −0.64 (−1.53,0.26) | 52 | 3.8 | 4.4 | |
| 6 | WBV | (46) | −0.20 (−2.84,2.44) | 37.7 | 16.4 | 5.4 | |
| 7 | AE | (14,21,29) | −0.24 (−0.92,0.44) | 29.6 | 0.1 | 5.9 | |
| Medium term | 1 | INT | (1,4,8,9,10,11,12,33) | −0.89 (−1.25, −0.53) | 90.5 | 56.4 | 1.6 |
| 2 | WBV | (43,45) | −0.75 (−1.32, −0.18) | 77.6 | 31.1 | 2.3 | |
| 3 | RT | (25,26,28,30,32,33) | −0.54 (−0.94, −0.13) | 61 | 3.3 | 3.3 | |
| 4 | AE | (1,17,24,25,30) | −0.51 (−1.04,0.03) | 58.7 | 5.9 | 3.5 | |
| 5 | lSTA | (51) | −0.23 (−0.93,0.47) | 39.6 | 3.2 | 4.6 | |
| 6 | mSTA | (47,53) | 1.29 (−0.16,2.74) | 1.5 | 0.1 | 6.9 | |
| Long term | 1 | hSTA | (54,58) | −1.58 (−2.66, −0.51) | 83.3 | 30.3 | 2.5 |
| 2 | mSTA | (48,52,57,58) | −1.49 (−2.35, −0.63) | 81.9 | 21.2 | 2.6 | |
| 3 | lWBV | (42) | −1.20 (−2.99,0.59) | 66.6 | 21.9 | 4 | |
| 4 | hWBV | (44) | −1.10 (−3.05,0.85) | 62.1 | 19.8 | 4.4 | |
| 5 | lSTA | (58) | −0.79 (−2.18,0.60) | 53 | 6.4 | 5.2 | |
| 6 | AE | (15,16,19,20,22,23,24) | −0.67 (−1.21, −0.13) | 50.3 | 0.1 | 5.5 | |
| 7 | CT | (34,35,37,38,39,40,41) | −0.34 (−0.96,0.27) | 32.8 | 0 | 7.1 | |
| 8 | RT | (27,19) | −0.30 (−1.23,0.62) | 30.8 | 0.2 | 7.2 | |
| 9 | INT | (5,6,7) | −0.20 (−1.22,0.82) | 26.9 | 0.2 | 7.6 | |
Subgroup analyses assessing potential moderating factors for PWV.
Note: WMD, weighted mean difference; SUCRA, cumulative probability ranking; Intervention durations are classified as Short (< 1,000 min), Medium (1,000–2,000 minutes), and Long (> 2,000minutes). For vibration training, these correspond to 60, 180, and 360 min, respectively. Medication durations are < 12 weeks, 12–24 weeks, and > 24 weeks for short, medium, and long cycles, respectively. In the intensity subgroup, STA is the reference variable and is not ranked.
3.5.4 GRADE assessment
Supplementary Appendix 14.3.1 presents the GRADE evaluation results for PWV, demonstrating high performance with most comparisons achieving low to moderate confidence. SBP and DBP were also assessed using the GRADE framework (see Supplementary Appendix 14). The results indicated low to moderate confidence for most SBP comparisons and low to moderate confidence for most DBP comparisons. Overall, PWV, SBP, and DBP were rated with moderate confidence in the GRADE assessment.
4 Discussion
4.1 Primary outcome
We assessed the impact of lSTA, mSTA, hSTA, WBV, INT, AE, RT, and CT on PWV in individuals at high risk for CVD. Our analysis found that all these interventions—hSTA, mSTA, WBV, INT, AE, RT, and CT—significantly reduced PWV and were clinically relevant (SMD > 0.5). SUCRA probability rankings identified hSTA as the most likely optimal intervention, WBV as the best non-pharmacological option, and INT as the most effective exercise intervention.
These findings align with previous research. In a subsequent meta-analysis, a different group concluded that statin therapy might be more effective than exercise for reducing AS (41). This supports our results showing a greater impact of statins compared to exercise. Variations in participant populations likely contribute to differences observed between studies comparing interventions. Limited research also suggests that WBV can significantly reduce AS (21).
However, our analysis suggests WBV may be a promising non-pharmacological intervention. While WBV appears to improve AS through enhanced systemic circulation and vascular function (42, 43), its lower intensity relative to traditional exercises warrants further investigation regarding cardiovascular benefits. Figure 2 indicates WBV effectively improves blood pressure, which may contribute to its impact on AS. These findings should be interpreted with caution given the limited number of WBV studies included in our meta-analysis.
Moreover, our study identifies INT as the most effective exercise intervention for improving AS. INT's alternating high and low intensity likely provides a highly efficient workout, maximizing cardiovascular adaptation through enhanced endothelial shear stress and nitric oxide bioavailability within shorter durations (44). In contrast, other forms of exercise may require longer durations to achieve similar results (6).
4.2 Secondary outcome
This study investigated the effects of various interventions on blood pressure (BP) in high-risk CVD populations. Our results demonstrated that WBV, AE, and INT significantly reduced SBP, while INT also lowered DBP. SUCRA rankings identified WBV as the optimal intervention for both SBP and DBP reduction (SUCRA = 94.0 and 77.3, respectively), whereas ISTA and RT were the least effective for SBP and DBP, respectively (Table 5).
Table 5
| PWV (65 studies, N=2,931) | |||
|---|---|---|---|
| Treatment | SUCRA | PrBest (%) | Mean Rank |
| hSTA | 92 | 69.7 | 1.6 |
| mSTA | 73.9 | 14.1 | 3.1 |
| WBV | 64.1 | 9.3 | 3.9 |
| INT | 60.9 | 2.4 | 4.1 |
| AE | 41.8 | 0.2 | 5.7 |
| RT | 39 | 0.5 | 5.9 |
| CT | 38.2 | 0.6 | 5.9 |
| lSTA | 38 | 3.2 | 6 |
| CON | 2 | 0 | 8.8 |
| SBP (55 studies, N=2,438) | |||
| Treatment | SUCRA | PrBest (%) | Mean Rank |
| WBV | 94 | 63.4 | 1.5 |
| INT | 91.2 | 35.1 | 1.7 |
| AE | 70.7 | 0.7 | 3.3 |
| CT | 52.1 | 0.1 | 4.8 |
| mSTA | 32.6 | 0 | 6.4 |
| RT | 32.5 | 0 | 6.4 |
| hSTA | 29.9 | 0.4 | 6.6 |
| CON | 23.9 | 0 | 7.1 |
| lSTA | 23.1 | 0.2 | 7.2 |
| DBP (54 studies, N=2,373) | |||
| Treatment | SUCRA | PrBest (%) | Mean Rank |
| WBV | 77.3 | 39.1 | 2.8 |
| lSTA | 68.4 | 28.2 | 3.5 |
| INT | 66.2 | 8.3 | 3.7 |
| AE | 59.6 | 4.5 | 4.2 |
| CT | 58.1 | 7.4 | 4.4 |
| mSTA | 47.7 | 3.1 | 5.2 |
| hSTA | 44.8 | 9.4 | 5.4 |
| CON | 19.6 | 0 | 7.4 |
| RT | 8.4 | 0 | 8.3 |
Ranking of exercise interventions in order of effectiveness.
These findings align with prior evidence cited in the Introduction regarding the efficacy of AE and INT on BP. As noted, AE improves vascular function through modulation of vasodilatory agents (e.g., Ca2+, K+, H+, CO₂) (5), while INT's superiority over continuous AE may stem from its high-low intensity alternation, which enhances cardiovascular adaptation efficiency (6). Notably, WBV's leading role in BP management corroborates its proposed mechanism of action: mechanical vibrations stimulate muscle contractions, augmenting blood flow and endothelial function (12–14). This effect may be particularly advantageous for high-risk populations due to WBV's low-impact nature and time efficiency (14).
While WBV showed significant BP reduction, its long-term sustainability requires further validation, as highlighted in prior studies (45). Importantly, WBV's dual benefit on both AS (primary outcome) and BP supports the interplay between arterial stiffness and hypertension pathophysiology (4, 15). As emphasized in the Introduction, AS exacerbates BP elevation via endothelial dysfunction and inflammatory pathways (1, 2), suggesting that WBV's mechanical stimulation may concurrently ameliorate both processes.
4.3 Subgroup NMA of primary outcome
Subgroup analyses assessed how intervention intensity (high vs. moderate-low) and duration (short, medium, long) modulated PWV improvements (Table 4). Key findings included: Intensity: Higher intensity enhanced efficacy for WBV (SUCRA = 72.2 under high intensity) and RT, whereas AE performed better at moderate intensity (SUCRA = 38.8). Duration: Short-term effects were optimal for CT (SUCRA = 87.4), medium-term for INT (SUCRA = 90.5), and long-term for hSTA (SUCRA = 83.3). WBV and AE required longer durations for maximal benefit.
These intensity-dependent variations resonate with controversies outlined in the Introduction. For instance, while high-intensity RT may acutely increase BP (7), our data indicate it ultimately reduces PWV more effectively than lower intensities—consistent with its role in promoting arterial remodeling (9). Conversely, AE's superiority at moderate intensity aligns with evidence that vigorous AE may not further improve AS in obese populations (46), supporting tailored intensity prescriptions.
The duration-dependent efficacy underscores distinctions between rapid-acting (e.g., CT/INT in short/medium term) and sustained (e.g., hSTA/WBV in long term) interventions. INT's medium-term dominance (SUCRA = 90.5) reflects its efficiency in inducing rapid vascular adaptations (6), while WBV's reliance on longer exposure aligns with its proposed mechanism of gradual endothelial enhancement (12–14). This complements the Introduction's emphasis on CT's sensitivity to exercise sequence (10, 11): our results extend this by demonstrating CT's acute efficacy (short-term SUCRA = 87.4), likely due to synergistic AE-RT sequencing.
4.4 Strengths and limitations
This study used a network meta-analysis approach to simultaneously compare multiple intervention methods. This approach not only provides a broader perspective but also significantly enhances the value of the findings. We focused on High-risk populations for CVD, which have been relatively underexplored in past research. Since AS is a common complication of CVD, investigating this group is crucial for assessing the benefits of exercise in preventing and treating AS. We compared the effects of different statin intensities and various types of exercise on AS and BP in High-risk populations for CVD. Our analysis also included subgroup evaluations based on intervention intensity and duration, leading to significant findings. We recommend that High-risk populations for CVD prioritize WBV for improving AS and INT as the preferred exercise method. Additionally, moderate-intensity AE may be more effective over a longer intervention period.
However, this study has several limitations. First, we cannot confirm whether all possible intervention methods were considered. Future research should explore additional pharmacological treatments and exercise interventions. Second, while we focused on PWV, SBP, and DBP as key indicators of AS, other relevant measures such as ALX, blood lipids, and blood sugar were not included due to concerns about their validity. Addressing these limitations in future research with larger sample sizes and diverse interventions will be important. Challenges may include variability in study populations, differences in study designs, and unmeasured confounding factors.
5 Conclusion
This systematic review and network meta-analysis provide clear evidence on the most effective interventions for managing AS and BP in High-risk populations for CVD. hSTA is identified as the most effective treatment for reducing AS, while WBV is recognized as the leading non-pharmacological option for improving AS. INT emerges as the most effective exercise intervention for both reducing AS and lowering BP.
The analysis highlights that INT delivers significant cardiovascular benefits quickly due to its alternating high and low intensity, which maximizes cardiovascular adaptation. WBV and AE provide better results with longer durations, whereas CT, RT, and INT are more effective with shorter durations.
In managing BP, WBV, AE, and INT are all effective, with INT showing notable benefits in reducing DBP. Despite its lower intensity, WBV significantly impacts BP, underscoring its overall efficacy.
Future research should further explore the long-term effects of WBV and investigate additional pharmacological and exercise interventions. Standardizing study protocols and addressing variability among participants will enhance the accuracy and reliability of these findings.
In summary, hSTA and INT are highly effective for improving AS and cardiovascular health, while WBV and AE offer significant benefits for BP management. Choosing the appropriate type and duration of intervention is crucial for optimizing outcomes in High-risk populations for CVD.
Statements
Data availability statement
The datasets used and/or analyzed during the current study are available from the corresponding author on reasonable request.
Author contributions
J-LC: Writing – original draft, Data curation, Visualization. J-TZ: Writing – original draft, Data curation, Investigation. X-HL: Data curation, Writing – original draft. R-SW: Writing – original draft, Software. H-TM: Conceptualization, Writing – review & editing, Supervision.
Funding
The author(s) declare that no financial support was received for the research and/or publication of this article.
Conflict of interest
The authors declare that the research was conducted in the absence of any commercial or financial relationships that could be construed as a potential conflict of interest.
Generative AI statement
The authors declare that no Gen AI was used in the creation of this manuscript.
Publisher’s note
All claims expressed in this article are solely those of the authors and do not necessarily represent those of their affiliated organizations, or those of the publisher, the editors and the reviewers. Any product that may be evaluated in this article, or claim that may be made by its manufacturer, is not guaranteed or endorsed by the publisher.
Supplementary material
The Supplementary Material for this article can be found online at: https://www.frontiersin.org/articles/10.3389/fcvm.2025.1617799/full#supplementary-material
Abbreviations
AE, aerobic exercise; AS, arterial stiffness; baPWV, brachial arteries pulse wave velocity; cfPWV, carotid–femoral pulse wave velocity; CON, control group; CT, combined exercise; CVD, cardiovascular disease; DBP, diastolic blood pressure; HIIT, high interval training; HRmax, maximum heart rate; HRR, heart rate reserve; hSTA, high doses of statins; INT, interval training; lSTA, low doses of statins; MIIT, moderate interval training; mSTA, moderate doses of statins; RCT, randomized controlled trial; RM, repetition maximum; RT, resistance exercise; SBP, systolic blood pressure; STA, statins; VO2max, maximal oxygen uptake; WBV, whole-body vibration training.
References
1.
Vlachopoulos C Aznaouridis K Stefanadis C . Prediction of cardiovascular events and all-cause mortality with arterial stiffness: a systematic review and meta-analysis. J Am Coll Cardiol. (2010) 55(13):1318–27. 10.1016/j.jacc.2009.10.061
2.
Robbie L Libby P . Inflammation and atherothrombosis. Ann N Y Acad Sci. (2001) 947:167–79. discussion 179–80. 10.1111/j.1749-6632.2001.tb03939.x
3.
Threapleton DE Greenwood DC Evans CE Cleghorn CL Nykjaer C Woodhead C et al Dietary fibre intake and risk of cardiovascular disease: systematic review and meta-analysis. Br Med J. (2013) 347:f6879. 10.1136/bmj.f6879
4.
Zhang Y Qi L Xu L Sun X Liu W Zhou S et al Effects of exercise modalities on central hemodynamics, arterial stiffness and cardiac function in cardiovascular disease: systematic review and meta-analysis of randomized controlled trials. PLoS One. (2018) 13(7):e0200829. 10.1371/journal.pone.0200829
5.
Saz-Lara A Cavero-Redondo I Álvarez-Bueno C Notario-Pacheco B Reina-Gutiérrez S Sequí-Domínguez I et al What type of physical exercise should be recommended for improving arterial stiffness on adult population? A network meta-analysis. Eur J Cardiovasc Nurs. (2021) 20(7):696–716. 10.1093/eurjcn/zvab022
6.
Ramos JS Dalleck LC Tjonna AE Beetham KS Coombes JS . The impact of high-intensity interval training versus moderate-intensity continuous training on vascular function: a systematic review and meta-analysis. Sports Med. (2015) 45(5):679–92. 10.1007/s40279-015-0321-z
7.
Okamoto T Masuhara M Ikuta K . Effects of eccentric and concentric resistance training on arterial stiffness. J Hum Hypertens. (2006) 20(5):348–54. 10.1038/sj.jhh.1001979
8.
Miyachi M . Effects of resistance training on arterial stiffness: a meta-analysis. Br J Sports Med. (2013) 47(6):393–6. 10.1136/bjsports-2012-090488
9.
Li P Liu Z Wan K Wang K Zheng C Huang J . Effects of regular aerobic exercise on vascular function in overweight or obese older adults: a systematic review and meta-analysis. J Exerc Sci Fit. (2023) 21(4):313–25. 10.1016/j.jesf.2023.06.002
10.
Marzolini S Oh PI Brooks D . Effect of combined aerobic and resistance training versus AE alone in individuals with coronary artery disease: a meta-analysis. Eur J Prev Cardiol. (2012) 19(1):81–94. 10.1177/1741826710393197
11.
Montero D Vinet A Roberts CK . Effect of combined aerobic and resistance training versus AE on arterial stiffness. Int J Cardiol. (2015) 178:69–76. 10.1016/j.ijcard.2014.10.147
12.
Figueroa A Kalfon R Madzima TA Wong A . Whole-body vibration exercise training reduces arterial stiffness in postmenopausal women with prehypertension and hypertension. Menopause. (2014) 21(2):131–6. 10.1097/GME.0b013e318294528c
13.
Marín PJ Rhea MR . Effects of vibration training on muscle strength: a meta-analysis. J Strength Cond Res. (2010) 24(2):548–56. 10.1519/JSC.0b013e3181c09d22
14.
Sitjà-Rabert M Rigau D Fort Vanmeerghaeghe A Romero-Rodríguez D Bonastre Subirana M Bonfill X . Efficacy of whole-body vibration exercise in older people: a systematic review. Disabil Rehabil. (2012) 34(11):883–93. 10.3109/09638288.2011.626486
15.
Hongo M Tsutsui H Mawatari E Hidaka H Kumazaki S Yazaki Y et al Fluvastatin improves arterial stiffness in patients with coronary artery disease and hyperlipidemia A 5-year follow-up study. Circ J. (2008) 72(5):722–8. 10.1253/circj.72.722
16.
Sahebkar A Pećin I Tedeschi-Reiner E Derosa G Maffioli P Reiner Ž . Effects of statin therapy on augmentation index as a measure of arterial stiffness: a systematic review and meta-analysis. Int J Cardiol. (2016) 212:160–8. 10.1016/j.ijcard.2016.03.010
17.
Upala S Wirunsawanya K Jaruvongvanich V Sanguankeo A . Effects of statin therapy on arterial stiffness: a systematic review and meta-analysis of randomized controlled trial. Int J Cardiol. (2017) 227:338–41. 10.1016/j.ijcard.2016.11.073
18.
Wang ZG Chen BW Lü NQ Cheng YM Dang AM . Relationships between use of statins and arterial stiffness in normotensive and hypertensive patients with coronary artery disease. Chin Med J. (2013) 126(16):3087–92. 10.3760/cma.j.issn.0366-6999.20130789
19.
Mizuguchi Y Oishi Y Miyoshi H Iuchi A Nagase N Oki T . Impact of statin therapy on left ventricular function and carotid arterial stiffness in patients with hypercholesterolemia. Circ J. (2007) 72(4):538–44. 10.1253/circj.72.538
20.
Birk GK Dawson EA Atkinson C Haynes A Cable NT Thijssen DH et al Brachial artery adaptation to lower limb exercise training: role of shear stress. J Appl Physiol (1985). (2012) 112(10):1653–8. 10.1152/japplphysiol.01489.2011
21.
Ashor AW Lara J Siervo M Celis-Morales C Mathers JC . Effects of exercise modalities on arterial stiffness and wave reflection: a systematic review and meta-analysis of randomized controlled trials. PLoS One. (2014) 9(10):e110034. 10.1371/journal.pone.0110034
22.
Shin JH Lee Y Kim SG Choi BY Lee HS Bang SY . The beneficial effects of tai chi exercise on endothelial function and arterial stiffness in elderly women with rheumatoid arthritis. Arthritis Res Ther. (2015) 17:380. 10.1186/s13075-015-0893-x
23.
Hutton B Salanti G Caldwell DM Chaimani A Schmid CH Cameron C et al The PRISMA extension statement for reporting of systematic reviews incorporating network meta-analyses of health care interventions: checklist and explanations. Ann Intern Med. (2015) 162(11):777–84. 10.7326/M14-2385
24.
Loimaala A Groundstroem K Rinne M Nenonen A Huhtala H Parkkari J . Effect of long-term endurance and strength training on metabolic control and arterial elasticity in patients with type 2 diabetes mellitus. Am J Cardiol. (2009) 103(7):972–7. 10.1016/j.amjcard.2008.12.026
25.
O'Donoghue G Blake C Cunningham C Lennon O Perrotta C . What exercise prescription is optimal to improve body composition and cardiorespiratory fitness in adults living with obesity? A network meta-analysis. Obes Rev. (2021) 22(2):e13137. 10.1111/obr.13137
26.
Collette M Palombo C Morizzo C Sbragi S Kozakova M Leftheriotis G . Carotid–femoral pulse wave velocity assessed by ultrasound: a study with echotracking technology. Ultrasound Med Biol. (2017) 43(6):1187–94. 10.1016/j.ultrasmedbio.2017.01.010
27.
Flack JM Calhoun D Schiffrin EL . The new ACC/AHA hypertension guidelines for the prevention, detection, evaluation, and management of high blood pressure in adults. Am J Hypertens. (2018) 31(2):133–5. 10.1093/ajh/hpx207
28.
Higgins JP Altman DG Gøtzsche PC Jüni P Moher D Oxman AD et al The Cochrane collaboration’s tool for assessing risk of bias in randomised trials. Br Med J. (2011) 343:d5928. 10.1136/bmj.d5928
29.
Salanti G Del Giovane C Chaimani A Caldwell DM Higgins JPT . Evaluating the quality of evidence from a network meta-analysis. PLoS One. (2014) 9(7):e99682. 10.1371/journal.pone.0099682
30.
Salanti G Ades AE Ioannidis JPA . Graphical methods and numerical summaries for presenting results from multiple-treatment meta-analysis: an overview and tutorial. J Clin Epidemiol. (2011) 64(2):163–71. 10.1016/j.jclinepi.2010.03.016
31.
Jackson D Riley R White IR . Multivariate meta-analysis: potential and promise. Stat Med. (2011) 30(20):2481–98. 10.1002/sim.4172
32.
Higgins JPT Thompson SG Deeks JJ Altman DG . Measuring inconsistency in meta-analyses. Br Med J. (2003) 327(7414):557–60. 10.1136/bmj.327.7414.557
33.
Salanti G . Indirect and mixed-treatment comparison, network, or multiple-treatments meta-analysis: many names, many benefits, many concerns for the next generation evidence synthesis tool. Res Synth Methods. (2012) 3(2):80–97. 10.1002/jrsm.1037
34.
Chaimani A Higgins JPT Mavridis D Spyridonos P Salanti G . Graphical tools for network meta-analysis in STATA. PLoS One. (2013) 8(10):e76654. 10.1371/journal.pone.0076654
35.
White IR Barrett JK Jackson D Higgins JPT . Consistency and inconsistency in network meta-analysis: model estimation using multivariate meta-regression. Res Synth Methods. (2012) 3(2):111–25. 10.1002/jrsm.1045
36.
Jansen JP Naci H . Is network meta-analysis as valid as standard pairwise meta-analysis? It all depends on the distribution of effect modifiers. BMC Med. (2013) 11:1–8. 10.1186/1741-7015-11-159
37.
Rücker G Schwarzer G . Ranking treatments in frequentist network meta-analysis works without resampling methods. BMC Med Res Methodol. (2015) 15:1–9. 10.1186/s12874-015-0060-8
38.
Mbuagbaw L Rochwerg B Jaeschke R Heels-Andsell D Alhazzani W Thabane L et al Approaches to interpreting and choosing the best treatments in network meta-analyses. Syst Rev. (2017) 6:1–5. 10.1186/s13643-017-0473-z
39.
Asmar R Benetos A Topouchian J Laurent P Pannier B Brisac A-M et al Assessment of arterial distensibility by automatic pulse wave velocity measurement: validation and clinical application studies. Hypertension. (1995) 26(3):485–90. 10.1161/01.HYP.26.3.485
40.
Cavero-Redondo I Deeks JJ Alvarez-Bueno C Howard B Rodriguez-Artalejo F Lopez-Munoz P et al Comparative effect of physical exercise versus statins on improving arterial stiffness in patients with high cardiometabolic risk: a network meta-analysis. PLoS Med. (2021) 18(2):e1003543. 10.1371/journal.pmed.1003543
41.
Verschueren SM Roelants M Delecluse C Swinnen S Vanderschueren D Boonen S . Effect of 6-month whole body vibration training on hip density, muscle strength, and postural control in postmenopausal women: a randomized controlled pilot study. J Bone Miner Res. (2004) 19(3):352–9. 10.1359/JBMR.0301245
42.
Figueroa A Gil R Sanchez-Gonzalez MA . Whole-body vibration attenuates the increase in leg arterial stiffness and aortic systolic blood pressure during post-exercise muscle ischemia. Eur J Appl Physiol. (2011) 111(7):1261–8. 10.1007/s00421-010-1746-6
43.
Sowa PW Winzer EB Hommel J Männel A van Craenenbroeck EM Wisløff U et al Impact of different training modalities on high-density lipoprotein function in HFpEF patients: a substudy of the OptimEx trial. ESC Heart Fail. (2022) 9(5):3019–30. 10.1002/ehf2.14032
44.
Miller CS Mitchell RJ . Long-Term effects of whole-body vibration training on blood pressure and cardiovascular risk factors: a randomized controlled trial. J Hypertens. (2019) 37(6):1263–71. 10.1097/HJH.0000000000001958
45.
Williams J Thompson C . Comparative effectiveness of low-intensity versus high-intensity interval training on arterial stiffness in obese individuals. Obes Res & Clin Pract. (2020) 14(4):399–406. 10.1016/j.orcp.2020.03.002
46.
Sequí-Domínguez I Cavero-Redondo I Álvarez-Bueno C Pozuelo-Carrascosa DP Nuñez de Arenas-Arroyo S Martínez-Vizcaíno V . Accuracy of pulse wave velocity predicting cardiovascular and all-cause mortality. A systematic review and meta-analysis. J Clin Med. (2020) 9(7):2080. 10.3390/jcm9072080
Summary
Keywords
arterial stiffness, high-risk populations for cardiovascular diseases, statins, exercise intervention, network meta-analysis, Whole-Body vibration training
Citation
Chen J-L, Zhang J-T, Li X-H, Wu R-S and Ma H-T (2025) Comparative effectiveness of statins and exercise in high-risk individuals: systematic review and network meta-analysis. Front. Cardiovasc. Med. 12:1617799. doi: 10.3389/fcvm.2025.1617799
Received
25 April 2025
Accepted
23 June 2025
Published
11 July 2025
Volume
12 - 2025
Edited by
Federico Biscetti, Agostino Gemelli University Polyclinic (IRCCS), Italy
Reviewed by
Dario Leone, University of Turin, Italy
Ashril Yusof, University of Malaya, Malaysia
Updates
Copyright
© 2025 Chen, Zhang, Li, Wu and Ma.
This is an open-access article distributed under the terms of the Creative Commons Attribution License (CC BY). The use, distribution or reproduction in other forums is permitted, provided the original author(s) and the copyright owner(s) are credited and that the original publication in this journal is cited, in accordance with accepted academic practice. No use, distribution or reproduction is permitted which does not comply with these terms.
* Correspondence: Hong-Tao Ma mm9094@sina.com
† Present Address: Jin-Tao Zhang,School of Physical Education, Tianjin University of Finance and Economics, Tianjin, China
Disclaimer
All claims expressed in this article are solely those of the authors and do not necessarily represent those of their affiliated organizations, or those of the publisher, the editors and the reviewers. Any product that may be evaluated in this article or claim that may be made by its manufacturer is not guaranteed or endorsed by the publisher.