 Jonathan Gavrysh1,2,3
 Philine Reisdorf1,2,3
 Thomas Hadler1,2,3
 Thomas Mayr1
 Clemens Ammann1,2,3,4
 Jan Gröschel1,2,3,5
 Johanna Kuhnt1,2,3
 Florian von Knobelsdorff-Brenkenhoff6Fabian Muehlberg1,2,4,7Carsten Schwenke8
 Maximilian Fenski1,2,3,†
 Jeanette Schulz-Menger1,2,3,4*†
- 1Working Group on CMR, Experimental and Clinical Research Center, a cooperation between the Max Delbrück Center for Molecular Medicine in the Helmholtz Association and Charité—Universitätsmedizin Berlin, Berlin, Germany
- 2Charité—Universitätsmedizin Berlin, corporate member of Freie Universität Berlin and Humboldt-Universität zu Berlin, Berlin, Germany
- 3DZHK (German Centre for Cardiovascular Research), partner site Berlin, Berlin, Germany
- 4Department of Cardiology and Nephrology, HELIOS Hospital Berlin-Buch, Berlin, Germany
- 5Department of Cardiology, Angiology and Intensive Care Medicine, Deutsches Herzzentrum der Charité, Berlin, Germany
- 6KIZ—Kardiologie im Zentrum and Ludwig-Maximilians-University Munich, Munich, Germany
- 7MSB Medical School Berlin, Berlin, Germany
- 8SCO:SSiS Statistical Consulting, Minden, Germany
Background: Late gadolinium enhancement (LGE) assessed by cardiovascular magnetic resonance (CMR) is an established metric for risk stratification and therapeutic guidance. However, consensus on the optimal technique for quantifying left ventricular (LV) LGE extent remains lacking. This study aimed to identify the most reliable method for quantifying LGE in chronic myocardial infarction (CMI), hypertrophic cardiomyopathy (HCM), and inflammatory heart disease (IHD).
Methods: A retrospective analysis was conducted on 285 prospectively enrolled patients (CMI: n = 98; HCM: n = 91; IHD: n = 96). LV LGE images in short-axis orientation were analyzed twice by the same reader. The most reliable LGE quantification technique was defined as the one achieving the highest intra-observer reproducibility. A two-step study design was implemented: in the pilot phase (n = 90), three quantification methods were compared: full width at half maximum (FWHM), signal threshold vs. reference mean using 2–6 standard deviations (n-SD), and manual thresholding. Techniques demonstrating the lowest variability were then applied in a validation cohort (n = 195). A mixed model for repeated measures was used to estimate mean differences. Equivalence was confirmed if the 95% confidence interval (CI) for the mean difference remained within predefined margins.
Results: In CMI, FWHM demonstrated the highest reproducibility, with a mean difference of 0.47% (95% CI: −0.40 to 1.35). In HCM, both the 5-SD and 6-SD techniques showed the highest reproducibility, with mean differences of 0.06% (95% CI: −1.28 to 1.39) and −0.16% (95% CI: −1.50 to 1.17), respectively. In IHD, the 5-SD and 6-SD techniques achieved the highest reproducibility, with mean differences of −0.72% (95% CI: −1.54 to 0.11) and −0.71% (95% CI: −1.54 to 0.11).
Conclusion: The distribution and pattern of LGE influence the reproducibility of its quantification. FWHM provided the highest intra-observer reproducibility for sharply demarcated scars, as seen in CMI. For more diffuse fibrosis patterns, such as in HCM and IHD, both the 5-SD and 6-SD techniques offered similarly reproducible performance.
Background
Late gadolinium enhancement (LGE) imaging is the reference standard in cardiovascular magnetic resonance (CMR) for detecting myocardial scar and fibrosis (1). A growing body of evidence supports the prognostic value of LGE extent in improving patient risk stratification and guiding therapy across various patient cohorts, including chronic myocardial infarction (CMI), hypertrophic cardiomyopathy (HCM) and inflammatory heart disease (IHD) (2–8).
Several techniques are available to quantify the left ventricular (LV) extent of LGE, including manual thresholding and semi-automated approaches such as full width at half maximum (FWHM) and signal threshold vs. reference mean, which applies a threshold of n standard deviations from remote normal myocardium (n-SD). These methods differ significantly in how they define pathologically hyper-enhanced voxels (9). While LGE imaging is well established for fibrosis detection, no consensus exists regarding the optimal technique for quantifying LV LGE extent in ischemic and non-ischemic cardiomyopathies (1).
In the absence of a universal reference standard, the technical performance of quantification methods can be assessed by their measurement precision (variability) (10, 11). As a key determinant of reliability, precision can be operationalized through intra-observer reproducibility, which reflects the consistency of repeated measurements by the same observer (10). Techniques which yield lower intra-observer variability are potentially more reliable for clinical and research use.
Although previous studies have evaluated inter- and intra-observer reproducibility of various LGE quantification techniques (12–14), uncertainties remain regarding the applicability across different disease entities. Available data do not clarify whether a) a single LGE quantification technique achieves the highest intra-observer reliability across different disease entities or b) different techniques perform best depending on the underlying disease.
The objective of this study was to identify the most reliable LGE quantification methods by assessing intra-observer reproducibility across three disease entities: CMI, HCM, IHD.
Methods
Study design and population
This study is a retrospective analysis of prospectively enrolled patient data collected between 2013 and 2022 at a single center. A total of 713 patients who had undergone short-axis LGE imaging were initially screened, from which 577 met diagnostic criteria for CMI, HCM, and IHD as outlined in the Supplementary Material. The IHD cohort comprised cases of acute and chronic myocarditis, defined according to the original and updated Lake Louise criteria (15, 16). Inclusion criteria further required the presence of a disease-typical LGE pattern and sufficient image quality as described in Supplementary Material for quantitative analysis. Cases presenting with microvascular obstruction were categorized as (sub)acute myocardial infarction and excluded from the study.
This study was conducted in accordance with the declaration of Helsinki, local legislation, and institutional requirements. Data was retrospectively acquired from prospective studies. Studies were originally approved by the local ethics committee of Charité—Universitätsmedizin Berlin and according to local legislation. Ethics approval ID and Trial registration ID of the source studies: EA2/077/10, EA1/305/14 (ISRCTN48802295), EA1/076/18, EA1/111/18 (ISRCTN16766375), EA1/087/21, EA1/088/21, EA1/198/21, EA1/042/22. Written informed consent was prospectively obtained from participants at that time.
Image acquisition
All CMR examinations were performed on a 1.5 T scanner (AvantoFit®, Siemens Healthineers, Erlangen, Germany). LGE images were acquired 10–20 min after administration of 0.1, 0.15, or 0.2 mmol/kg of gadolinium-based contrast agent, using a 2D phase-sensitive inversion recovery (PSIR) sequence. Detailed acquisition parameters are provided in Supplementary Table S2.
Study workflow
Given the high variability in LGE quantification results reported in previous literature (10–13), a two-step study design was implemented (Figure 1). In the first step (Pilot Study), 30 cases per disease entity (CMI, HCM, IHD, n = 90 in total) were analyzed using all quantification techniques. Intra-observer variability was assessed to identify the techniques demonstrating the least variability within each disease group. Pilot study results subsequently informed the sample size calculation for the validation cohort.
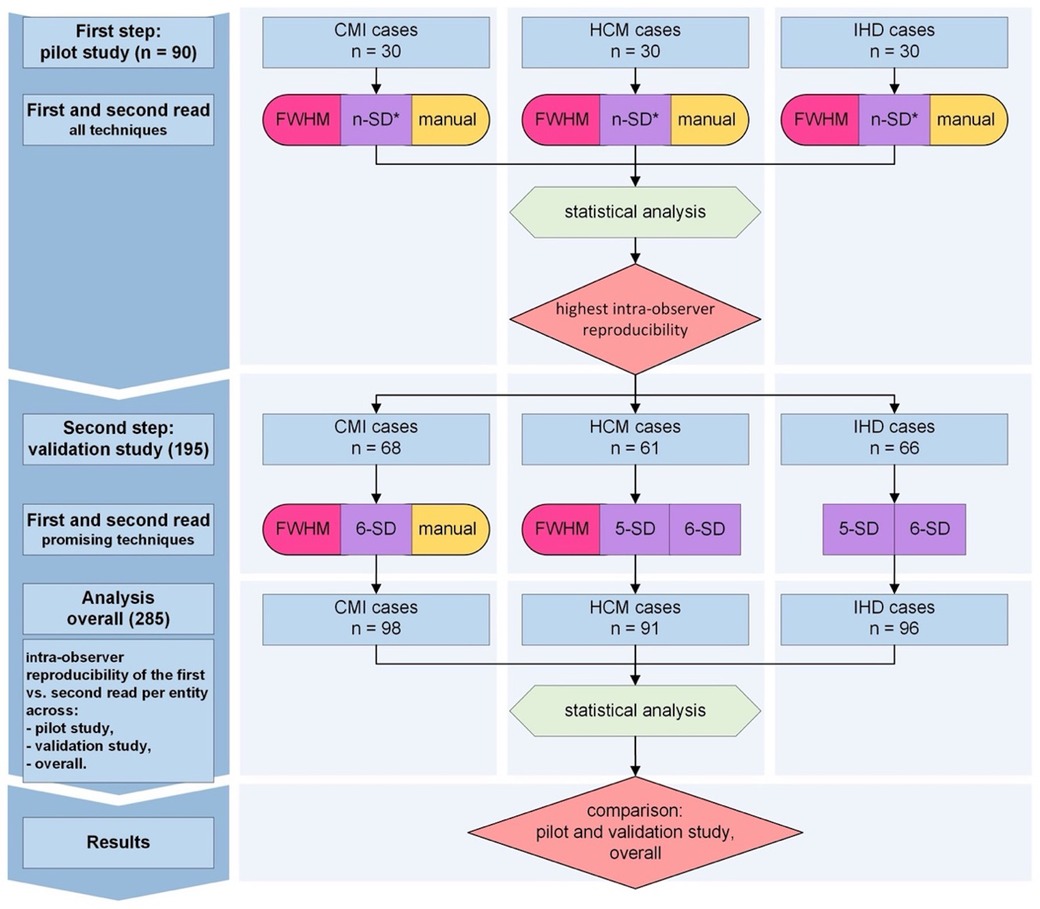
Figure 1. Study protocol. Intra-observer analysis followed a two-step approach. In the first step (pilot study, n = 90), intra-observer variability and sample size estimates were derived. LGE was quantified using seven techniques per entity: FWHM, n-SD with 2–6 standard deviations from remote normal myocardium, and manual thresholding. In the second step (validation study, n = 195), techniques with the lowest variability were applied in separate patient cohorts (CMI: FWHM, 6-SD, manual thresholding; HCM: FWHM, 5-SD, 6-SD; IHD: 5-SD, 6-SD). Final statistical analysis (mixed model for repeated measures) identified the techniques with the highest intra-observer reproducibility, based on results from the pilot, validation, and pooled cohorts (overall analysis). CMI, chronic myocardial infarction; HCM, hypertrophic cardiomyopathy; IHD, inflammatory heart disease; LGE, late gadolinium enhancement; FWHM, full width at half maximum; n-SD, signal threshold at n standard deviations from remote myocardium. 5-SD, signal threshold at 5 standard deviations from remote myocardium. 6-SD, signal threshold at 6 standard deviations from remote myocardium. *During the pilot study, all cases were analyzed using 2-, 3-, 4-, 5-, and 6-SD techniques.
In the second step (Validation Study, n = 195), only the best-performing quantification techniques from the pilot study were applied. Cases for both pilot and validation studies were randomly selected from all available eligible cases using a custom MATLAB tool (MathWorks, Natick, MA, USA), preserving proportional representation according to the size of the original source studies. LGE quantification was performed twice per case to confirm intra-observer reproducibility. In total, 759 LGE quantification analyses were completed across the two study phases.
LGE quantification protocol
Image analysis was performed exclusively on short-axis PSIR LGE images using commercially available software (cvi42, version 5.13.7, Circle Cardiovascular Imaging, Calgary, Canada). A reader with three years of CMR experience (J.G.) conducted two separate analyses per case, blinded to previous results and separated by an interval of more than two months. A consensus read was performed with a reader with 7 years' experience (M.F.) During the pilot study, each case was analyzed using: Manual thresholding, FWHM and n-SD applying thresholds from 2 to 6 standard deviations.
Myocardial annotation procedure
Epicardial and endocardial borders were manually contoured once per read. For the FWHM technique, a region of interest (ROI) was placed around the most signal-intense voxel within the scar area on each slice (1). For the n-SD technique, a reference ROI was drawn in remote myocardium [preferably within the septum, covering two American Heart Association [AHA] (17) segments and 45% of myocardial circumference where possible] to determine 2-, 3-, 4-, 5-, and 6-SD thresholds. Manual quantification involved manually setting a threshold for each slice visually matching the extent of annotated scar areas to the area of hyperintense myocardium. Artefacts, partial volume effects, and spurious voxels (18) were manually corrected through exclusion ROIs or contour adjustments. The FWHM technique was always applied first, and myocardial contours were subsequently reused without modification for n-SD and manual thresholding analyses. Representative annotation examples are shown in Figure 2.
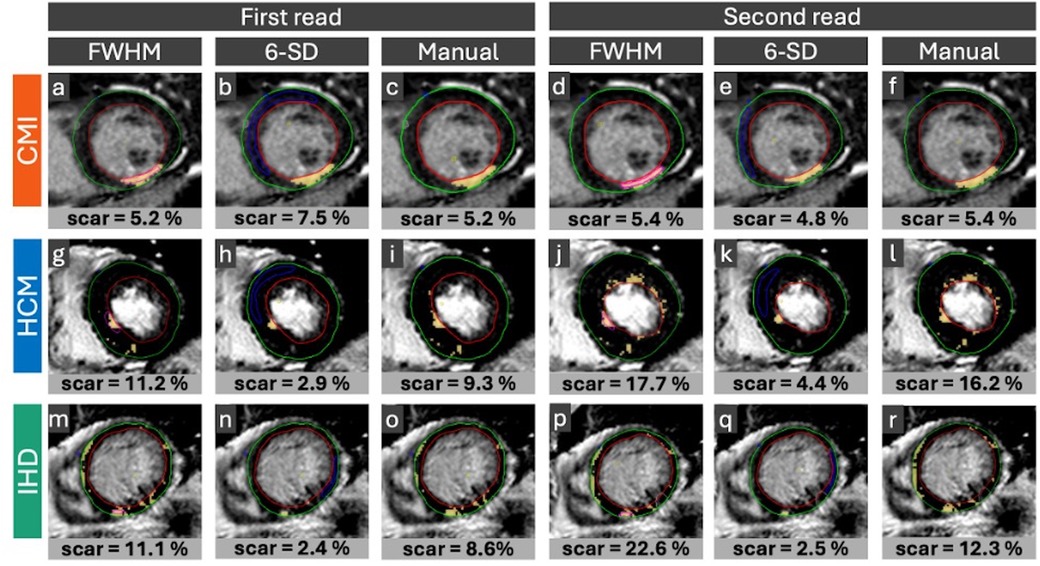
Figure 2. Representative LGE images and annotations. Representative cases of CMI (a–f), HCM: (g–l) and IHD: (m–r) with disease-typical LGE distribution: Sharply demarcated subendocardial LGE distribution in CMI cases, patchy intramural pattern in HCM cases and subepicardial pattern in IHD cases. Horizontal rows display reader annotations in the same patient for the first and second image analysis. Vertical columns indicate LGE quantification technique applied: FWHM (a,g,m,d,j,p), 6-SD (b,h,n,e,k,q), and manual thresholding (c,i,o,f,l,r). Endo- (red line) and epicardial (green line) borders were annotated. For FWHM the reference ROI (pink contour) was drawn around the visually brightest myocardial area, covering the most signal intense voxel. For the n-SD technique, the remote ROI (blue contour) was drawn in remote myocardium. Yellow marking indicates hyper-enhanced myocardium. CMI, chronic myocardial infarction; HCM, hypertrophic cardiomyopathy; IHD, inflammatory heart disease; LGE, late gadolinium enhancement; FWHM, full width at half maximum. 5-SD, signal threshold at 5 standard deviations from remote myocardium. 6-SD, signal threshold at 6 standard deviations from remote myocardium. ROI, region of interest.
Statistical analysis
In the absence of sufficient preliminary data on intra-observer variability for LGE quantification techniques, a two-step study design was implemented. A pilot study first estimated intra-observer variability in LV LGE extent, expressed as a percentage of LV mass, for each quantification method within each disease entity. These data informed sample size calculations for a subsequent validation cohort, designed to formally test intra-observer equivalence to zero within predefined clinical margins.
Sample size calculations assumed 80% power and a two-sided significance level of 5%, with equivalence defined by the 95% confidence interval (CI) for intra-observer differences lying entirely within the chosen margins. Based on pilot-derived standard deviations, a sample size of n = 67 patients was required for CMI (6-SD technique, SD = 2.04, margin ±2%), n = 89 for HCM (FWHM technique, SD = 9.44, margin ±4%), and n = 35 for IHD (6-SD technique, SD = 4.67, margin ±4%). A conservative sample size estimate was used to ensure sufficient power across all groups. To increase robustness, we aimed to maintain consistent group sizes in the final analysis and therefore targeted the largest required sample size (n ≥ 89) for all three groups.
Intra-observer reproducibility was assessed using a mixed model for repeated measures. Point estimates (PE) were calculated as the mean differences between first and second reads, with 95% CIs reported to quantify measurement precision. Bland–Altman plots were generated to visualize mean differences and 95% limits of agreement.
Results are reported separately for the pilot and validation steps and for the pooled cohort including all cases. Sample size calculations were performed using PASS 2019 (NCSS, LLC, Kaysville, Utah, USA). Statistical analyses were conducted in SAS version 9.4 (SAS Institute Inc., Cary, NC, USA). Figures were generated using GraphPad Prism version 10 (GraphPad Software, San Diego, CA), Microsoft Visio, PowerPoint version 16.79.2, and Excel version 14.7.7 (Microsoft Corporation, Redmond, WA, USA).
Results
Out of the initially screened 713 cases, 577 cases met disease criteria, from which 464 were eligible for inclusion. Of these, 285 patients were randomly selected for the final analysis, slightly exceeding the minimum sample sizes for sufficient power in each group (CMI: n = 98; HCM: n = 91; IHD: n = 96). Reasons for exclusion were absence of a disease-specific LGE pattern (n = 136), no LGE short axis stack available (n = 41), poor image quality or insufficient image slices (n = 70), and presence of microvascular obstruction (n = 2). Patient characteristics are summarized in Table 1.
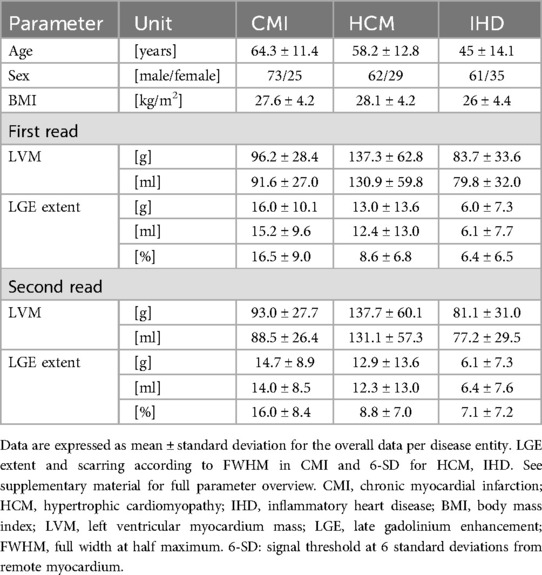
Table 1. Patient characteristics and myocardial parameters.
CMI cases: pilot and validation studies
In the pilot study, the FWHM technique demonstrated a PE (mean ± standard error) of −0.94 ± 0.48 with a 95% CI ranging from −1.90 to 0.02, showing the most favorable intra-observer reproducibility compared to other techniques. The 6-SD technique [PE = 1.32 ± 0.48, 95% CI (0.36, 2.28)] and manual thresholding [PE = −1.47 ± 0.48, 95% CI (−2.43, −0.51)] also exhibited lower variability compared to the remaining methods, although FWHM performed best (p < 0.001).
For the validation study, FWHM, 6-SD and manual thresholding were included. FWHM again demonstrated the lowest variability [PE = 1.10 ± 0.60, 95% CI (−0.08, 2.28); p = 0.039]. See Figure 3 for Bland-Altman plots of agreement and Figure 4 for total LV LGE in the first and second read. Detailed results are provided in the Supplementary Material.
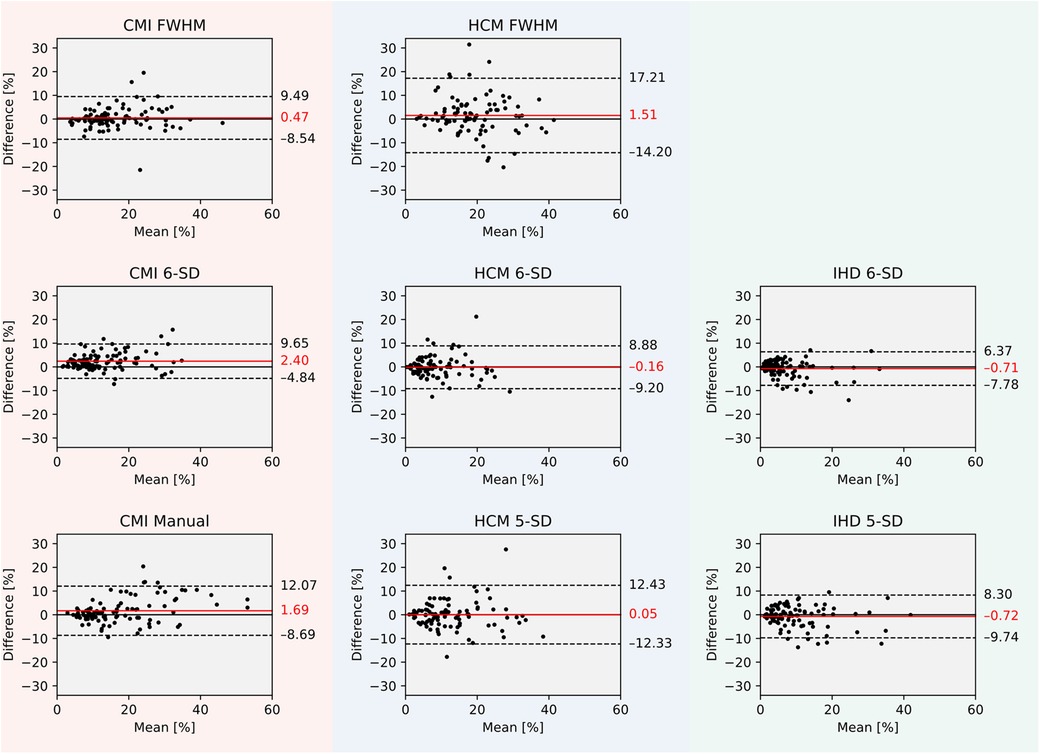
Figure 3. Bland–Altman plots of agreement between first and second read LGE extent in percent for all cases per quantification technique and disease entity. CMI, chronic myocardial infarction; HCM, hypertrophic cardiomyopathy; IHD, inflammatory heart disease; LGE, late gadolinium enhancement; FWHM, full width at half maximum. 5-SD, signal threshold vs. reference mean at 5 standard deviations from remote myocardium. 6-SD, signal threshold vs. reference mean at 6 standard deviations from remote myocardium.
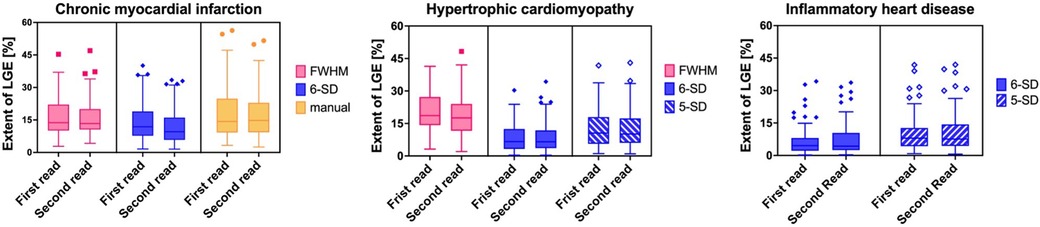
Figure 4. Boxplot figures of LGE extent expressed in median [%] with interquartile range (25th to 75th percentile) during first and second read per LGE quantification technique per disease entity. Whiskers depict 1.5 times interquartile range. CMI: chronic myocardial infarction. HCM, hypertrophic cardiomyopathy; IHD, inflammatory heart disease; LGE, late gadolinium enhancement; FWHM, full width at half maximum. 5-SD, signal threshold vs. reference mean at 5 standard deviations from remote myocardium. 6-SD, signal threshold vs. reference mean at 6 SD from remote myocardium.
HCM cases: pilot and validation studies
In the pilot study, both 5-SD [PE = −1.62 ± 1.15, 95% CI (−3.91, 0.67)] and 6-SD [PE = −1.22 ± 1.15, 95% CI (−3.51, 1.07)] techniques demonstrated lower intra-observer variability compared to other methods, including FWHM [PE = 1.49 ± 1.15, 95% CI (−0.80, 3.77)]. No significant difference was observed between 5-SD and 6-SD (p = 0.122).
In the validation cohort, 5-SD [PE = 0.88 ± 0.84, 95% CI (−0.77, 2.54)] and 6-SD [PE = 0.36 ± 0.84, 95% CI (−1.30, 2.01)] remained the techniques with the lowest intra-observer variability (p = 0.655).
ICD cases: pilot and validation studies
In the pilot study for IHD, the 5-SD technique demonstrated a PE of −1.99 ± 0.76 with a 95% CI ranging from −3.50 to −0.47, while the 6-SD technique showed a PE of −1.31 ± 0.76 [95% CI (−2.83, 0.20)]. Both techniques exhibited considerably lower intra-observer variability compared to other methods, with no significant difference between them (p = 0.531).
In the validation study, reproducibility remained consistent. The 5-SD technique achieved a PE of −0.14 ± 0.50 [95% CI (−1.13, 0.85)], and the 6-SD technique a PE of −0.44 ± 0.50 [95% CI (−1.43, 0.56)]. Again, no significant difference was observed between the two methods (p = 0.679).
Pooled results across all disease entities
When analyzing pooled results from both pilot and validation cohorts, the highest intra-observer reproducibility in patients with CMI was observed with the FWHM technique, which achieved a PE of 0.47 ± 0.44 and a 95% CI ranging from −0.40 to 1.35.
In HCM and IHD cohorts, both the 5-SD and 6-SD techniques demonstrated similarly high reproducibility. For HCM, the 5-SD method achieved a PE of 0.06 ± 0.68 [95% CI (−1.28, 1.39)] and the 6-SD method a PE of −0.16 ± 0.68 [95% CI (−1.50, 1.17)], with no significant difference between them (p = 0.251). In the IHD cohort, the 5-SD technique showed a PE of −0.72 ± 0.42 [95% CI (−1.54, 0.11)], while the 6-SD technique achieved a PE of −0.71 ± 0.42 [95% CI (−1.54, 0.11)], again without a significant difference (p = 0.463).
The techniques demonstrating the highest intra-observer reproducibility across all disease groups are illustrated in Figure 5.
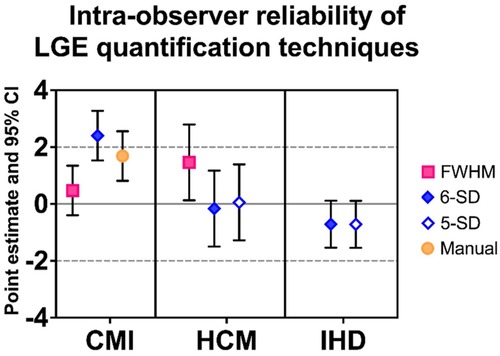
Figure 5. Most reliable LGE quantification techniques per entity across pilot (n = 90) and validation study (n = 195). Data are expressed as PE along with 95% CI for the overall analysis (n = 285). CMI, chronic myocardial infarction; HCM, hypertrophic cardiomyopathy; IHD, inflammatory heart disease; LGE, late gadolinium enhancement; PE, point estimate; CI, confidence interval; FWHM, full width at half maximum. 5-SD: signal threshold vs. reference mean at 5 standard deviations from remote myocardium. 6-SD: signal threshold vs. reference mean at 6 standard deviations from remote myocardium.
Analysis time
The average time required for LGE quantification, including manual contour tracing and application of all techniques, was as follows: Pilot study (n = 90): 27 min 51 s per case; Validation study (n = 195): 23 min 46 s per case. The most pronounced differences in analysis time were observed in HCM cases: Pilot study first read: 37 min 25 s, Pilot study second read: 25 min 57 s; Validation study first read: 23 min 21 s; Validation study second read: 19 min 57 s. Further details are provided in the Supplementary Material.
Discussion
This single-center study assessed intra-observer reproducibility of three LGE quantification techniques (FWHM, n-SD, manual thresholding) across CMI, HCM, IHD. Our findings suggest that intra-observer reproducibility depends on scar pattern and LGE distribution. For sharply demarcated scars, as seen in CMI, FWHM achieved the highest intra-observer reproducibility. In contrast, when LGE was less well-defined, as typically observed in HCM and IHD, the 5-SD and 6-SD techniques demonstrated better reproducibility compared with FWHM.
Consistent with previous studies, FWHM had the highest reproducibility in cases with high image contrast and distinct scarring, where the most signal-intense voxel can be reliably identified (13, 19). In chronic ischemic scars, this method benefits from sharp differences in image signal intensity, allowing robust thresholding at half-maximum (13). However, in non-ischemic diseases, FWHM reproducibility decreased due to methodological challenges: less distinct scar regions, smaller differences in signal intensities between healthy and diseased myocardium, and difficulty reliably identifying the brightest voxels. Additionally, manual ROI placement and the need to exclude spurious voxels at myocardial borders contribute to higher observer dependency and time consumption.
In IHD and HCM, where fibrosis and scarring are often diffuse or patchy rather than sharply demarcated (8), n-SD techniques (5-SD and 6-SD) offered better reproducibility. Although theoretically applicable across different scar patterns, n-SD performed less reliably in CMI, likely due to difficulties in consistently positioning reference ROIs across repeated annotations. These findings align with previous studies showing n-SD's limitations for infarct quantification (18).
Our results have clinical implications. In HCM, where risk stratification thresholds such as 15% LGE extent are clinically relevant (20–22), reproducibility is critical, particularly when considering longitudinal follow-up examinations to detect meaningful increases in LGE extent, or in interventional research trials, measuring the effect of therapies over time.
Manual thresholding showed lower reproducibility across all cohorts, underlining the inherent subjectivity of human annotation (14). Even with quality assurance and systematic exclusion of artefacts, manual methods add observer bias that cannot be fully eliminated.
Interestingly, in dilated cardiomyopathy (DCM), several studies have demonstrated the prognostic value of LGE extent, most frequently quantified using the FWHM technique (23–25). A recent meta-analysis confirmed that both the presence and extent of LGE are associated with adverse outcomes, while also highlighting the need for standardized quantification protocols (26). Notably, adequately powered studies investigating intra- and inter-reader reproducibility in DCM are still lacking. In cardiac amyloidosis, LGE is primarily assessed visually based on characteristic enhancement patterns. Although transmural LGE has been shown to predict mortality (27), semi-automatic quantification is rarely used. Threshold-based techniques such as n-SD or FWHM are often not applicable due to diffuse infiltration and the absence of a clear reference myocardium.
As shown in our study, manual LGE quantification is tedious and time-consuming, hindering broader clinical application. Future work should therefore focus on automated solutions. Deep learning algorithms have demonstrated success in cine image segmentation (28, 29) and could potentially improve LGE quantification. Initiatives like the Evaluation of Myocardial Infarction from Delayed-Enhancement Cardiac MRI (EMIDEC) challenge highlight the potential of AI, although variability in the underlying manual annotations remains a hurdle (30).
Limitations
Although this is currently the largest study examining the intra-observer reproducibility of different LGE quantification approaches, there are limitations. While our study focused on prevalent diseases with distinct LGE characteristics, uncertainties remain for diseases with other LGE patterns, such as cardiac sarcoidosis, and for cases exhibiting multiple or mixed LGE patterns within the same patient. Additional limitations of our study include the single-center and single-reader design. Further research is necessary to assess the techniques' inter-observer reproducibility and result variability across different centers with varying scanner setups and protocols.
In our study, datasets were drawn from multiple prior studies with different contrast agents, doses, and post-contrast timing. While investigating dose-, and agent-specific effects would be of scientific interest, the current study was not powered for stratified analyses by contrast dose, timing or type. Moreover, acute and chronic myocarditis may exhibit different LGE characteristics but could not be meaningfully stratified due to nonuniform scan timing in relation to disease onset in the original studies. However, both stages frequently present with similar diffuse or patchy enhancement patterns and this study focused on intra-observer reproducibility rather than pathophysiological distinction.
Conclusions
In summary, FWHM is preferable for well-defined infarcts, while 5-SD and 6-SD techniques perform better in diffuse and/or patchy fibrosis patterns (Figure 6). Visual assessment of scar pattern should guide technique selection to maximize reproducibility in both clinical and research settings.
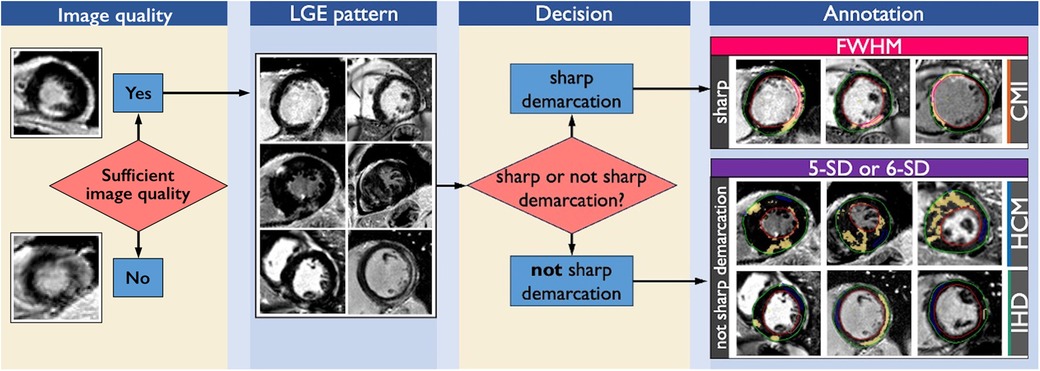
Figure 6. Decision tree for the first step of visual inspection. After establishing sufficient image quality, visual inspection of LGE distribution and myocardial fibrosis is the primary step. In cases with CMI, HCM and IHD LGE distribution and scar pattern can present either with sharp demarcation (CMI) or no sharp demarcation (HCM, IHD). In cases of fibrosis with sharp demarcation, that are often observed in CMI patients, FWHM is the technique with the highest intra-observer reproducibility to quantify LGE extent. In cases with focal fibrosis with not sharp demarcation as associated with HCM and IHD, 5-SD and 6-SD are equally well suited to quantify LGE extent. CMI, chronic myocardial infarction; HCM, hypertrophic cardiomyopathy; IHD, inflammatory heart disease; LGE, late gadolinium enhancement; FWHM, full width at half maximum. 5-SD: signal threshold vs. reference mean at 5 standard deviations from remote myocardium. 6-SD: signal threshold vs. reference mean at 6 standard deviations from remote myocardium.
Data availability statement
The data analyzed in this study is subject to the following licenses/restrictions: availability of analyzed datasets is limited by German data protection laws. Patient data is not publicly available. Requests to access these datasets should be directed to Jeanette Schulz-Menger,amVhbmV0dGUuc2NodWx6LW1lbmdlckBjaGFyaXRlLmRl.
Ethics statement
The studies involving humans were approved by local ethics committee of Charité—Universitätsmedizin Berlin. The studies were conducted in accordance with the local legislation and institutional requirements. Written informed consent for participation was not required from the participants or the participants' legal guardians/next of kin in accordance with the national legislation and institutional requirements.
Author contributions
JGa: Conceptualization, Data curation, Formal analysis, Funding acquisition, Investigation, Methodology, Visualization, Writing – original draft. PR: Software, Writing – review & editing. TH: Software, Writing – review & editing. TM: Writing – review & editing, Data curation. CA: Writing – review & editing, Data curation. JGr: Writing – review & editing, Data curation. JK: Writing – review & editing, Data curation. FvK-B: Writing – review & editing, Data curation. FM: Writing – review & editing, Data curation. CS: Formal analysis, Writing – review & editing. MF: Conceptualization, Funding acquisition, Methodology, Project administration, Writing – review & editing, Data curation. JS-M: Conceptualization, Funding acquisition, Methodology, Supervision, Writing – review & editing.
Funding
The author(s) declare that financial support was received for the research and/or publication of this article. JG, PR and TH received funding from the German Research Foundation (GRK2260, BIOQIC). MF received funding from the German Heart Foundation (S/09/23).
Conflict of interest
CS was employed by SCO:SSiS Statistical Consulting.
The remaining authors declare that the research was conducted in the absence of any commercial or financial relationships that could be construed as a potential conflict of interest.
The handling editor [AZ] declared a past co-authorship with the author [JSM].
Generative AI statement
The author(s) declare that no Generative AI was used in the creation of this manuscript.
Publisher's note
All claims expressed in this article are solely those of the authors and do not necessarily represent those of their affiliated organizations, or those of the publisher, the editors and the reviewers. Any product that may be evaluated in this article, or claim that may be made by its manufacturer, is not guaranteed or endorsed by the publisher.
Supplementary material
The Supplementary Material for this article can be found online at: https://www.frontiersin.org/articles/10.3389/fcvm.2025.1621292/full#supplementary-material
References
1. Schulz-Menger J, Bluemke DA, Bremerich J, Flamm SD, Fogel MA, Friedrich MG, et al. Standardized image interpretation and post-processing in cardiovascular magnetic resonance—2020 update: society for cardiovascular magnetic resonance (SCMR): board of trustees task force on standardized post-processing. J Cardiovasc Magn Reson. (2020) 22(1):19. doi: 10.1186/s12968-020-00610-6
2. Kiaos A, Daskalopoulos GN, Kamperidis V, Ziakas A, Efthimiadis G, Karamitsos TD. Quantitative late gadolinium enhancement cardiac magnetic resonance and sudden death in hypertrophic cardiomyopathy: a meta-analysis. JACC Cardiovasc Imaging. (2024) 17(5):489–97. doi: 10.1016/j.jcmg.2023.07.005
3. Aquaro GD, De Gori C, Faggioni L, Parisella ML, Cioni D, Lencioni R, et al. Diagnostic and prognostic role of late gadolinium enhancement in cardiomyopathies. Eur Heart J Suppl. (2023) 25(Suppl C):C130–6. doi: 10.1093/eurheartjsupp/suad015
4. Georgiopoulos G, Figliozzi S, Sanguineti F, Aquaro GD, di Bella G, Stamatelopoulos K, et al. Prognostic impact of late gadolinium enhancement by cardiovascular magnetic resonance in myocarditis: a systematic review and meta-analysis. Circ Cardiovasc Imaging. (2021) 14(1):e011492. doi: 10.1161/CIRCIMAGING.120.011492
5. Halliday BP, Baksi AJ, Gulati A, Ali A, Newsome S, Izgi C, et al. Outcome in dilated cardiomyopathy related to the extent, location, and pattern of late gadolinium enhancement. JACC Cardiovasc Imaging. (2019) 12(8P2):1645–55. doi: 10.1016/j.jcmg.2018.07.015
6. Popa A, Cionca C, Agoston R, Rusu F, Tarcau BM, Negru A, et al. The role of magnetic resonance imaging in risk stratification of patients with acute myocarditis. Diagnostics (Basel). (2024) 14(13):1426. doi: 10.3390/diagnostics14131426
7. Helali J, Ramesh K, Brown J, Preciado-Ruiz C, Nguyen T, Silva LT, et al. Late gadolinium enhancement on cardiac MRI: a systematic review and meta-analysis of prognosis across cardiomyopathies. Int J Cardiol. (2025) 419:132711. doi: 10.1016/j.ijcard.2024.132711
8. Gräni C, Eichhorn C, Bière L, Murthy VL, Agarwal V, Kaneko K, et al. Prognostic value of cardiac magnetic resonance tissue characterization in risk stratifying patients with suspected myocarditis. (2017).
9. Benjamin MM, Shah P, Munir MS, Kinno M, Syed MA. Comparison of LGE quantitation methods in cardiac sarcoidosis to predict clinical outcomes. Int J Cardiovasc Imaging. (2023) 39(3):641–50. doi: 10.1007/s10554-022-02751-4
10. Kessler LG, Barnhart HX, Buckler AJ, Choudhury KR, Kondratovich MV, Toledano A, et al. The emerging science of quantitative imaging biomarkers terminology and definitions for scientific studies and regulatory submissions. Stat Methods Med Res. (2015) 24(1):9–26. doi: 10.1177/0962280214537333
11. Bunting KV, Steeds RP, Slater K, Rogers JK, Gkoutos GV, Kotecha D. A practical guide to assess the reproducibility of echocardiographic measurements. J Am Soc Echocardiogr. (2019) 32(12):1505–15. doi: 10.1016/j.echo.2019.08.015
12. Klem I, Heiberg E, Van Assche L, Parker MA, Kim HW, Grizzard JD, et al. Sources of variability in quantification of cardiovascular magnetic resonance infarct size—reproducibility among three core laboratories. J Cardiovasc Magn Reson. (2017) 19(1):62. doi: 10.1186/s12968-017-0378-y
13. Flett AS, Hasleton J, Cook C, Hausenloy D, Quarta G, Ariti C, et al. Evaluation of techniques for the quantification of myocardial scar of differing etiology using cardiac magnetic resonance. JACC Cardiovasc Imaging. (2011) 4(2):150–6. doi: 10.1016/j.jcmg.2010.11.015
14. Gräni C, Eichhorn C, Bière L, Kaneko K, Murthy VL, Agarwal V, et al. Comparison of myocardial fibrosis quantification methods by cardiovascular magnetic resonance imaging for risk stratification of patients with suspected myocarditis. J Cardiovasc Magn Reson. (2019) 21(1):1–11. doi: 10.1186/s12968-019-0520-0
15. Ferreira VM, Schulz-Menger J, Holmvang G, Kramer CM, Carbone I, Sechtem U, et al. Cardiovascular magnetic resonance in nonischemic myocardial inflammation: expert recommendations. J Am Coll Cardiol. (2018) 72(24):3158–76. doi: 10.1016/j.jacc.2018.09.072
16. Friedrich MG, Sechtem U, Schulz-Menger J, Holmvang G, Alakija P, Cooper LT, et al. Cardiovascular magnetic resonance in myocarditis: a JACC white paper. J Am Coll Cardiol. (2009) 53(17):1475–87. doi: 10.1016/j.jacc.2009.02.007
17. American Heart Association Writing Group on Myocardial Segmentation and Registration for Cardiac Imaging, Cerqueira MD, Weissman NJ, Dilsizian V, Jacobs AK, Kaul S, et al. Standardized myocardial segmentation and Nomenclature for tomographic imaging of the heart: a statement for healthcare professionals from the cardiac imaging committee of the council on clinical cardiology of the American Heart Association. Circulation. (2002) 105(4):539–42. doi: 10.1161/hc0402.102975
18. Heiberg E, Engblom H, Carlsson M, Erlinge D, Atar D, Aletras AH, et al. Infarct quantification with cardiovascular magnetic resonance using “standard deviation from remote” is unreliable: validation in multi-centre multi-vendor data. J Cardiovasc Magn Reson. (2022) 24:53. doi: 10.1186/s12968-022-00888-8
19. Baritussio A, Scatteia A, Bucciarelli-Ducci C. Role of cardiovascular magnetic resonance in acute and chronic ischemic heart disease. Int J Cardiovasc Imaging. (2018) 34(1):67–80. doi: 10.1007/s10554-017-1116-0
20. Arbelo E, Protonotarios A, Gimeno JR, Arbustini E, Barriales-Villa R, Basso C, et al. 2023 ESC guidelines for the management of cardiomyopathies: developed by the task force on the management of cardiomyopathies of the European Society of Cardiology (ESC). Eur Heart J. (2023) 44(37):3503–626. doi: 10.1093/eurheartj/ehad194
21. Zeppenfeld K, Tfelt-Hansen J, de Riva M, Winkel BG, Behr ER, Blom NA, et al. 2022 ESC guidelines for the management of patients with ventricular arrhythmias and the prevention of sudden cardiac death. Eur Heart J. (2022) 43(40):3997–4126. doi: 10.1093/eurheartj/ehac262
22. von Knobelsdorff-Brenkenhoff F, Schulz-Menger J. Cardiovascular magnetic resonance in the guidelines of the European Society of Cardiology: a comprehensive summary and update. J Cardiovasc Magn Reson. (2023) 25(1):42. doi: 10.1186/s12968-023-00950-z
23. Elming MB, Hammer-Hansen S, Voges I, Nyktari E, Raja AA, Svendsen JH, et al. Myocardial fibrosis and the effect of primary prophylactic defibrillator implantation in patients with non-ischemic systolic heart failure—DANISH-MRI. Am Heart J. (2020) 221:165–76. doi: 10.1016/j.ahj.2019.10.020
24. Gulati A, Jabbour A, Ismail TF, Guha K, Khwaja J, Raza S, et al. Association of fibrosis with mortality and sudden cardiac death in patients with nonischemic dilated cardiomyopathy. JAMA. (2013) 309(9):896. doi: 10.1001/jama.2013.1363
25. Puntmann VO, Carr-White G, Jabbour A, Yu CY, Gebker R, Kelle S, et al. T1-mapping and outcome in nonischemic cardiomyopathy: all-cause mortality and heart failure. JACC Cardiovasc Imaging. (2016) 9(1):40–50. doi: 10.1016/j.jcmg.2015.12.001
26. Eichhorn C, Koeckerling D, Reddy RK, Ardissino M, Rogowski M, Coles B, et al. Risk stratification in nonischemic dilated cardiomyopathy using CMR imaging: a systematic review and meta-analysis. JAMA. (2024) 332(18):1535. doi: 10.1001/jama.2024.13946
27. Fontana M, Pica S, Reant P, Abdel-Gadir A, Treibel TA, Banypersad SM, et al. Prognostic value of late gadolinium enhancement cardiovascular magnetic resonance in cardiac amyloidosis. Circulation. 2015 132(16):1570–9. doi: 10.1161/CIRCULATIONAHA.115.016567
28. Bai W, Sinclair M, Tarroni G, Oktay O, Rajchl M, Vaillant G, et al. Automated cardiovascular magnetic resonance image analysis with fully convolutional networks. J Cardiovasc Magn Reson. (2018) 20(1):65. doi: 10.1186/s12968-018-0471-x
29. Ammann C, Hadler T, Gröschel J, Kolbitsch C, Schulz-Menger J. Multilevel comparison of deep learning models for function quantification in cardiovascular magnetic resonance: on the redundancy of architectural variations. Front Cardiovasc Med. (2023) 10:1118499. doi: 10.3389/fcvm.2023.1118499
Keywords: late gadolinium enhancement, myocardial scar, fibrosis, ischemic heart disease, inflammatory heart disease, hypertrophic cardiomyopathy, cardiovascular magnetic resonance, quantification technique
Citation: Gavrysh J, Reisdorf P, Hadler T, Mayr T, Ammann C, Gröschel J, Kuhnt J, von Knobelsdorff-Brenkenhoff F, Muehlberg F, Schwenke C, Fenski M and Schulz-Menger J (2025) Reproducibility of late gadolinium enhancement quantification techniques in ischemic and non-ischemic heart diseases (ReLate study). Front. Cardiovasc. Med. 12:1621292. doi: 10.3389/fcvm.2025.1621292
Received: 30 April 2025; Accepted: 15 July 2025;
Published: 1 August 2025.
Edited by:
Alessandro Zorzi, University Hospital of Padua, ItalyReviewed by:
Hajnalka Vago, Semmelweis University, HungaryFrancesca Graziano, University of Padova, Italy
Copyright: © 2025 Gavrysh, Reisdorf, Hadler, Mayr, Ammann, Gröschel, Kuhnt, von Knobelsdorff-Brenkenhoff, Muehlberg, Schwenke, Fenski and Schulz-Menger. This is an open-access article distributed under the terms of the Creative Commons Attribution License (CC BY). The use, distribution or reproduction in other forums is permitted, provided the original author(s) and the copyright owner(s) are credited and that the original publication in this journal is cited, in accordance with accepted academic practice. No use, distribution or reproduction is permitted which does not comply with these terms.
*Correspondence: Jeanette Schulz-Menger, amVhbmV0dGUuc2NodWx6LW1lbmdlckBjaGFyaXRlLmRl
†These authors have contributed equally to this work and share last authorship