 Soohyun Kim1
 Kwan Yong Lee2,3*
 Kyung An Kim1
 Jaeho Byeon1
 Sanghoon Shin2Byung-Hee Hwang2Jin Jin Kim2
 Eun Ho Choo2Chan Joon Kim4Young Kyoung Sa5Mahn-Won Park6
 Sangho Hyun7Andrew H. Yoon3
 Youngkeun Ahn8Kiyuk Chang2
- 1Cardiovascular Center and Cardiology Division, Incheon St. Mary’s Hospital, Catholic University of Korea, Seoul, Republic of Korea
- 2Cardiovascular Center and Cardiology Division, Seoul St. Mary’s Hospital, Catholic University of Korea, Seoul, Republic of Korea
- 3Cardiovascular Research Institute for Intractable Disease, College of Medicine, Catholic University of Korea, Seoul, Republic of Korea
- 4Cardiovascular Center and Cardiology Division, Uijeongbu St. Mary’s Hospital, Catholic University of Korea, Uijeonbu, Republic of Korea
- 5Cardiovascular Center and Cardiology Division, Yeouido St. Mary’s Hospital, Catholic University of Korea, Seoul, Republic of Korea
- 6Cardiovascular Center and Cardiology Division, Daejeon St. Mary’s Hospital, Catholic University of Korea, Daejeon, Republic of Korea
- 7College of Medicine, Catholic University of Korea, Seoul, Republic of Korea
- 8Department of Cardiology, Cardiovascular Center, Chonnam National University Hospital, Gwangju, Republic of Korea
Background: Heart failure with preserved ejection fraction (HFpEF) is defined as presenting with clinical symptoms and signs of heart failure with a concomitant left ventricular ejection fraction ≥50%. However, the prognostic role of serum uric acid in HFpEF is not well understood.
Methods: In total, 757 patients with HFpEF and acute myocardial infarction were included in the analysis. Hyperuricemia was defined as a serum uric acid level >6.9 mg/dL in men and >5.4 mg/dL in women at the time of diagnosis of acute myocardial infarction. The primary outcome was all-cause mortality.
Results: Among the enrolled patients, 164 and 593 were placed into the high uric acid and normal uric acid groups, respectively. After a median follow up of 4.8 years [interquartile range: 3.2–7.1], 54 (32.9%) in the high serum uric acid group and 92 (15.5%) in the normal serum uric acid group had died. Hyperuricemia was independently associated with all-cause mortality (p < 0.001) and cardiovascular death [73 (12.3%) vs. 44 (26.8%); p < 0.001]. The increased risk of mortality remained consistent in the multivariate Cox proportional hazards model (hazard ratio: 1.5; 95% confidence interval: 1.03–2.19; p = 0.033). After classifying the enrolled patients according to their Heart Failure Association-Pre-test assessment, Echocardiography and natriuretic peptide, Functional testing, and Final etiological work-up (HFA-PEFF) score (366 with a HFA-PEFF score <3 and 391 with a HFA-PEFF score ≥3), hyperuricemia was also found to be associated with all-cause mortality in patients with a score greater than the intermediate score (≥3 points) (p < 0.001).
Conclusions: In a cohort with acute myocardial infarction, hyperuricemia was independently associated with all-cause mortality in patients with HFpEF.
Clinical Trial Registration: ClinicalTrials.gov, COREA-AMI NCT02806102.
Introduction
Heart failure (HF) is a complex clinical syndrome that consists of cardinal symptoms and signs that are a result of structural or functional abnormalities of the heart, and can be divided into distinct phenotypes based on the measurement of the left ventricular ejection fraction (LVEF) (1). Heart failure with preserved ejection fraction (HFpEF) is defined by symptoms and signs of heart failure with an LVEF of 50% or greater and a structural or functional abnormality of the heart with the presence of left ventricular diastolic dysfunction or raised filling pressure (1). HFpEF is heterogenous and caused by multiple mechanisms, including cardiac aging and cardiometabolic disorders, and the incidence of HFpEF has increased due to population aging and coexisting conditions (2). Despite the increasing incidence and prevalence of HFpEF, no therapeutic approach has been established to modify disease progression or reduce mortality in HFpEF. In this context, plasma natriuretic peptide (BNP) and N-terminal plasma natriuretic peptide (NT-proBNP) remain the only biomarkers with both diagnostic and prognostic value. Hence, a novel method of screening and evaluating underlying cardiovascular diseases and cardiovascular risk factors is necessary because an appropriate strategy for HFpEF has not yet been established (3).
Serum uric acid (SUA) has been validated for its association with cardiovascular disease. Various studies have demonstrated a correlation between hyperuricemia and other comorbidities, including hypertension, diabetes mellitus, metabolic syndrome, chronic kidney disease, coronary artery disease, and heart failure (4–6). However, the prognostic role of SUA in HF has not been well investigated, and its relationship with HFpEF has scarcely been investigated.
Ischemic heart disease and myocardial infarction (MI) are the most common etiologies of HF, especially heart failure with reduced ejection fraction (HFrEF), but they also contribute to the development of HFpEF (7). In addition, to aid in making the challenging diagnosis of HFpEF, a few score-based algorithms [Heavy (BMI >30), Hypertensive (≥2 antihypertensive meds), atrial Fibrillation, Pulmonary hypertension (PASP >35 mmHg), Elder (age >60), Filling pressure (E/e′ > 9) (H2FPEF) and Heart Failure Association-Pre-test assessment, Echocardiography and natriuretic peptide, Functional testing, and Final etiological work-up (HFA-PEFF)] have emerged as diagnostic tools (8, 9). We investigated the prognostic role of SUA in patients with HFpEF after an acute MI. In addition, we used SUA and the HFA-PEFF score to predict the mortality and cardiovascular outcomes in patients with HFpEF related to an acute MI.
Methods
Study protocols and population selection
The Convergent REgistry of cAtholic and chonnAm University for Acute Myocardial Infarction (COREA-AMI) was designed to evaluate real-world, long-term clinical outcomes in all consecutive patients with an acute MI at nine major cardiac centers in Korea. The COREA-AMI is a single registry that prospectively enrolled patients with an acute MI undergoing percutaneous coronary intervention (PCI). It was organized in two phases: COREA-AMI I (January 2004–December 2009) and COREA-AMI II (January 2010–August 2014). The latter phase not only extended the follow-up of the former cohort but also included additional patient enrollment. In this study, both phases were analyzed as one integrated registry. The clinical, angiographic, and follow-up data of all patients with an acute MI were consecutively registered in the electronic, web-based case report system. The COREA-AMI study was conducted in accordance with the Declaration of Helsinki. This observational study was approved by the institutional review board of our institution (IRB No. XC15RSMI0089K) and performed in accordance with the Strengthening the Reporting of Observational Studies in Epidemiology (STROBE) guidelines (10). The COREA-AMI registry is registered on ClinicalTrials.gov (study ID: NCT02806102).
Of the 10,719 patients with an acute MI who underwent PCI with drug-eluting stents (DES) in this registry, we excluded any patients who did not undergo serum uric acid testing (N = 4,377) or echocardiography (N = 454) at baseline. Patients with an LVEF <50% in their baseline echocardiography (N = 1,363) were also excluded. Among the remaining patients, we excluded those who did not fulfill the following HFpEF criteria for left ventricular diastolic dysfunction or increased left ventricular filling pressure according to the 2021 European Society of Cardiology (ESC) HF guideline: E/eʹ at rest over 9, left atrial volume index (LAVI) over 34, left ventricular mass index (LVMI) ≥95 g/m2 for women and ≥115 g/m2 for men, NT-proBNP >125 pg/mL, pulmonary arterial systolic pressure ≥35, and tricuspid regurgitation (TR) velocity ≥2.8 m/s (N = 3,786). The size of the final enrolled study population was 757. The study flow chart is depicted in Figure 1. The patients were divided into a high SUA group (uric acid >6.9 mg/dL for men and >5.4 mg/dL for women) or a normal SUA group using their initial serum uric acid level measured at the time of the acute MI. Transthoracic echocardiography was performed at each center and descriptions of the measured values were left by the physicians at each center. Guideline-directed medical therapy was conducted by each physician. The HFA-PEFF diagnostic algorithm is a stepwise scoring system that incorporates functional, morphological, and biomarker domains, with a total score ranging from 0 to 6. When the score is higher than 5 points, an immediate diagnosis of HFpEF is recommended. With a score of 2–4 points, a diastolic stress test or invasive hemodynamic measurements are recommended for a definitive diagnosis of HFpEF, whereas a score of ≤1 makes HFpEF very unlikely (8). In our study, the patients were categorized using an HFA-PEFF score cutoff of ≥3 as an intermediate-to-high probability of HFpEF. The HFA-PEFF score was calculated retrospectively for risk stratification purposes and not as a primary inclusion criterion.
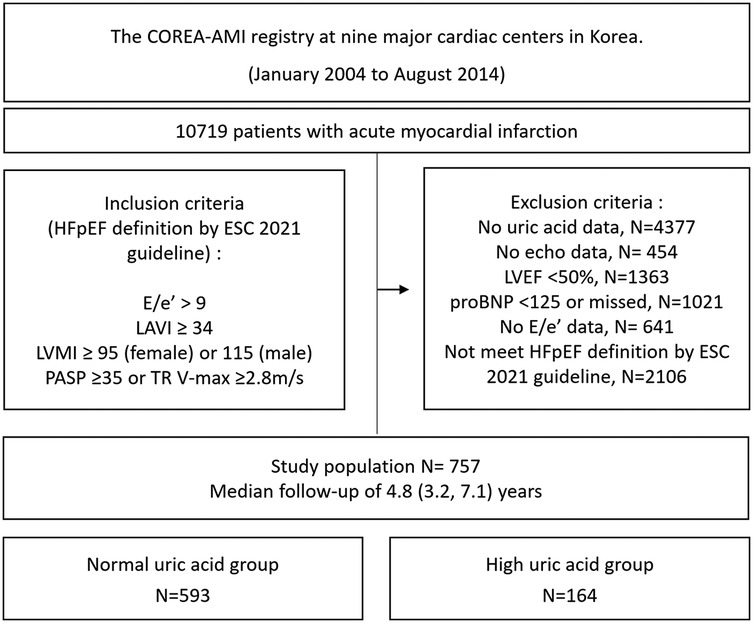
Figure 1. Study flow chart. HFpEF, heart failure with preserved ejection fraction; LAVI, left atrial volume index; LVMI, left ventricular mass index; PASP, pulmonary artery systolic pressure; TR, tricuspid regurgitation; LVEF, left ventricular ejection fraction; NT-proBNP, N-terminal pro B-type natriuretic peptide.
Study outcomes
The primary endpoint of the study was all-cause mortality. The secondary outcome was all-cause mortality according to the HFA-PEFF score.
Statistical analysis
The baseline demographics, medications at discharge, laboratory results, and angiographic characteristics are presented as mean ± standard deviation (SD) or median and interquartile range (IQR), based on the normal distribution of these continuous variables. Differences in the continuous variables between the groups were evaluated using Student's t-test for independent samples or the Mann–Whitney U test. The categorical data are presented as frequencies and proportions and were compared using the chi-squared (χ2) test (or Fisher's exact test when any expected count was <5 for a 2 × 2 table). The optimal cut-off SUA value in our study was determined using receiver operating characteristic (ROC) curve analysis with the Youden index. The thresholds for hyperuricemia in our study were >6.9 mg/dL for men and >5.4 mg/dL for women (Supplementary Figure 1).
The cumulative event rates in each group were calculated using a Kaplan–Meier estimator and compared using the log-rank statistic. Because differences in the baseline characteristics could significantly affect outcomes, sensitivity analyses were performed to adjust for confounders as much as possible. As a sensitivity analysis, propensity score (PS)-matched cohorts were constructed for patients with normal vs. high uric acid using 1:1 matching and the nearest-neighbor method without replacement on the propensity scores obtained from logistic regression with a caliper width of 0.1. In accordance with established guidelines for propensity score analysis, matching was conducted using all available baseline covariates to ensure adequate control for potential confounding (11). To identify predictors of events, we used a multivariable Cox proportional hazards model. We predefined the covariates by including both clinically relevant factors known to be important based on prior studies and the baseline characteristics that were significantly different between the two groups (those with a p-value of <0.05 in the univariable analysis). The adjusted variables for the multivariate Cox proportional hazards regression analysis were age ≥65, sex, diabetes mellitus (DM), hypertension, history of stroke, Killip class, estimated glomerular filtration rate (eGFR) <30, chronic lung disease, angiotensin-converting enzyme (ACE) inhibitors or angiotensin Ⅱ receptor blocker (ARB), oral anticoagulants, hemoglobin, creatinine, triglyceride, high-density lipoprotein (HDL), and multivessel disease. The balance between the two groups after PS-matching or inverse probability treatment weighted (IPTW) adjustment was assessed by calculating the percent standardized mean differences with a threshold of 0.2. The percent standardized mean differences after propensity-score matching were within ±10% across all the matched covariates, demonstrating successful achievement of balance between the comparative groups. Each measure was conducted using R version 4.5 (R Foundation for Statistical Computing, Vienna, Austria). Statistical significance was indicated by a two-tailed p-value < 0.05.
Results
Baseline characteristics
The baseline clinical characteristics of the 757 patients are listed in Table 1. The mean age among the enrolled patients was 63.5 ± 12.2 years, whereas 355 (46.9%) were older than 65 years and 220 (29.1%) were female. Of the enrolled patients, 164 (21.7%) were classified into the high SUA group, while 593 (78.3%) were classified into the normal SUA group. The mean SUA level obtained at baseline was 8.0 ± 2.9 mg/dL in the high SUA group and 4.7 ± 1.1 mg/dL in the normal SUA group. The prevalence of DM, dyslipidemia, atrial fibrillation on baseline electrocardiogram, and previous stroke was similar in both groups. High SUA was associated with a higher Global Registry of Acute Coronary Events (GRACE) score, higher NT-proBNP, lower HDL cholesterol, lower hemoglobin, higher serum creatinine, and renal dysfunction. Among the enrolled patients, 453 (59.8%) had been diagnosed with an ST-segment elevation myocardial infarction (STEMI). More than 50% of the patients had multivessel coronary artery disease that included more than two vessels. Regarding the characteristics of the PCI procedures, neither the total stent number nor the length or generation of the stent was different between the two groups (Table 2). The mean HFA-PEFF score was significantly higher in the high SUA group (2.8 ± 1.2 in the high SUA group vs. 2.5 ± 1.2 in the normal SUA group; p = 0.001) and the proportion of patients with a HFA-PEFF score ≥3 was higher in the high SUA group [100 (61.0%) vs. 291 (49.1%); p = 0.009]. Echocardiographic measures are presented in Table 3. The mean LVEF was 59.6 ± 6.0% in the high SUA group and 58.7 ± 6.0% in the normal SUA group (p = 0.088). There were no statistical differences in the other echocardiographic values between the groups. The PS distribution and the baseline characteristics after PS-matching and the IPTW analysis are presented in Supplementary Tables 1–2.
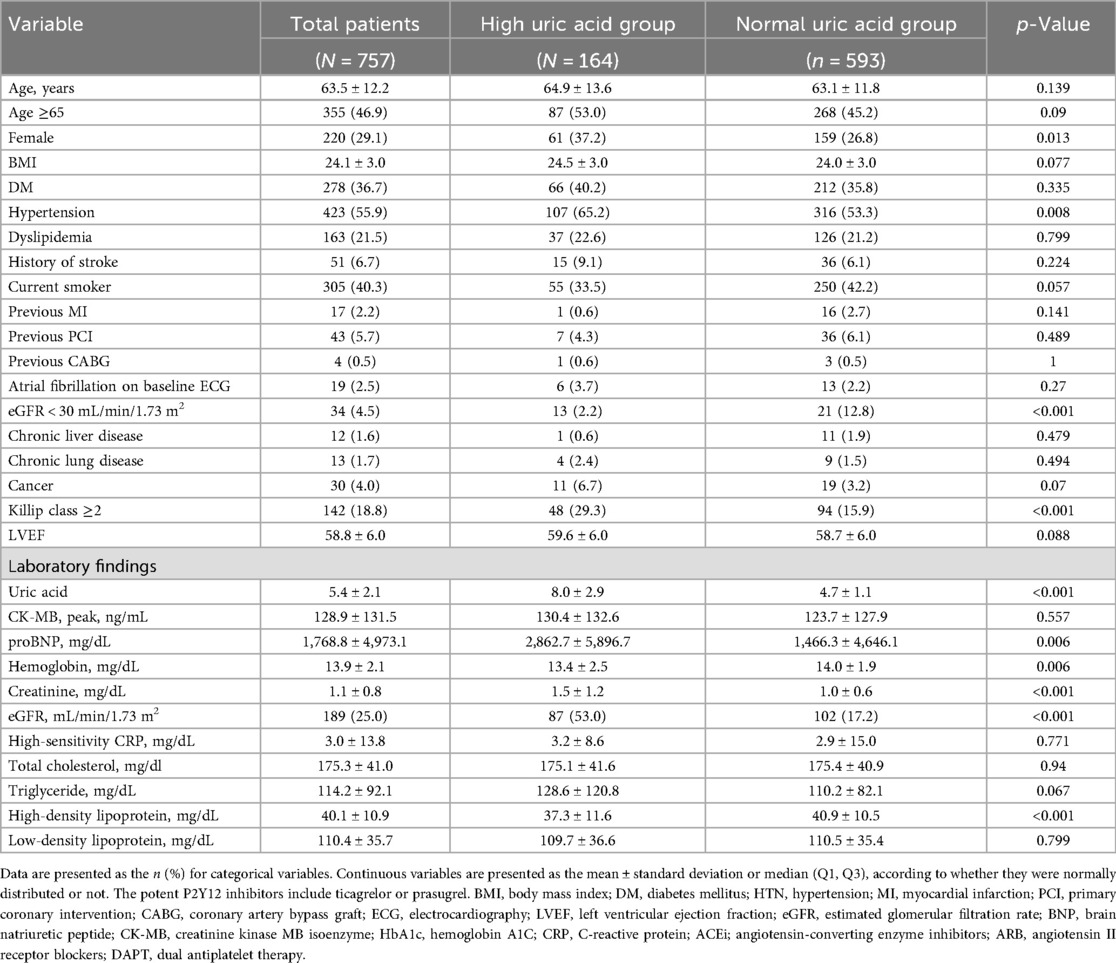
Table 1. Baseline clinical and laboratory characteristics.
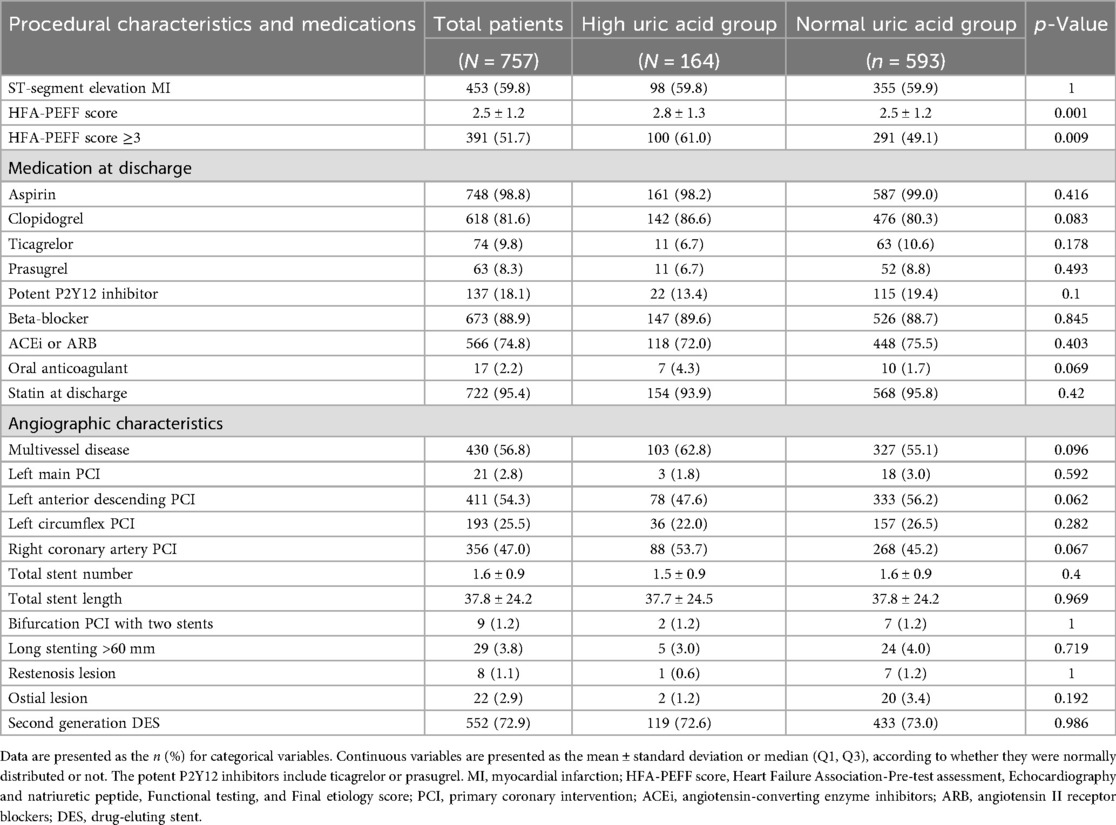
Table 2. Procedural characteristics and medications prescribed after percutaneous coronary intervention.
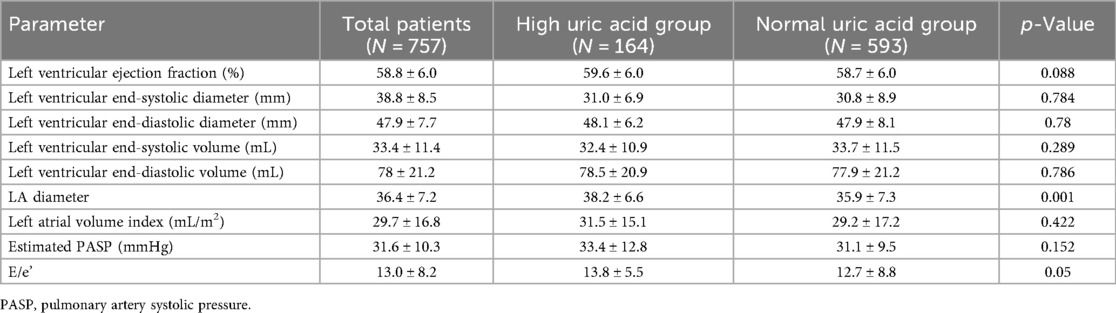
Table 3. Baseline echocardiographic parameters.
Clinical outcomes
During the median follow-up time of 4.8 years [IQR 3.2; 7.1], 92 and 54 patients died in the normal SUA and high SUA groups, respectively. The Kaplan–Meier analysis showed that hyperuricemia was associated with increased risk for all-cause mortality [92 (15.5%) vs. 54 (32.9%); p < 0.001] (Figure 2). The difference in the result was mainly driven by a higher number of cardiac deaths in the high SUA group [73 (12.3%) vs. 44 (26.8%); p < 0.001]. The multivariate Cox proportional hazards model showed increased risk of all-cause mortality in the high SUA group [hazard ratio (HR): 1.5; 95% confidence interval (CI): 1.03–2.19; p = 0.033] (Supplementary Table 3). High SUA was also associated with increased risk of readmission for heart failure in the multivariate analysis (HR: 3.74; 95% CI: 1.33–10.5; p = 0.012). There were no significant differences in the event rates of readmission for unstable angina, recurrent MI, stent thrombosis, revascularization, and ischemic stroke (p = 0.394, 0.239, 0.322, 0.631, and 0.633, respectively). Concordant results were shown in the sensitivity analyses, including multivariate adjustment, PS matching, and IPTW adjustment (Table 4). The multivariate Cox regression demonstrated that age ≥65, diabetes mellitus, cancer, and NT-proBNP were significant predictors of all-cause mortality after adjustment (p < 0.05, respectively) (Supplementary Table 3).
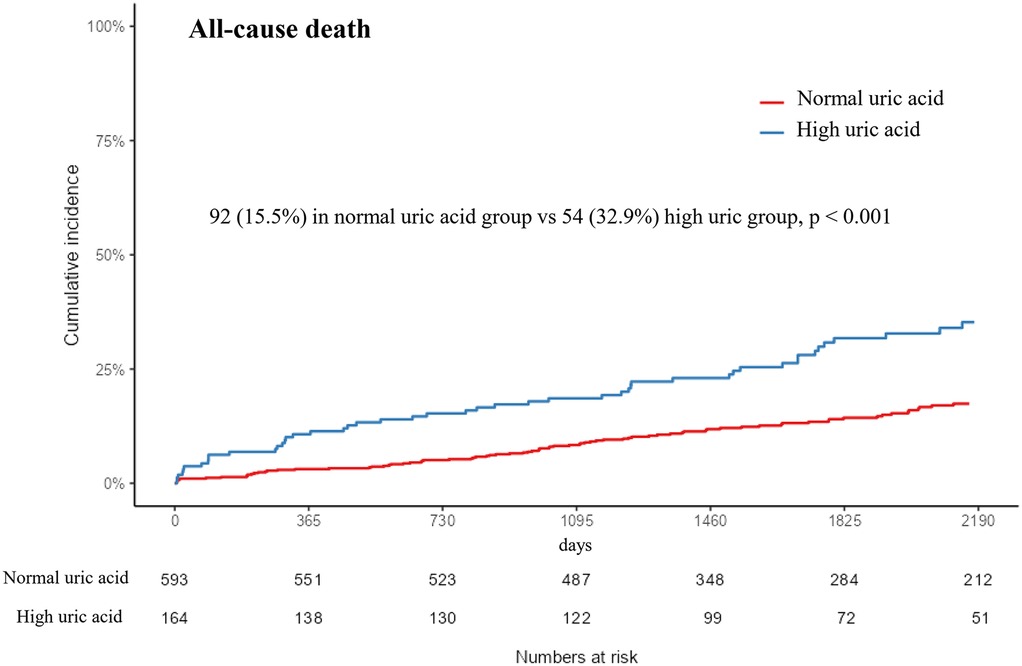
Figure 2. Kaplan–Meier event curve of the cumulative incidence of all-cause mortality according to uric acid level. SUA, serum uric acid.
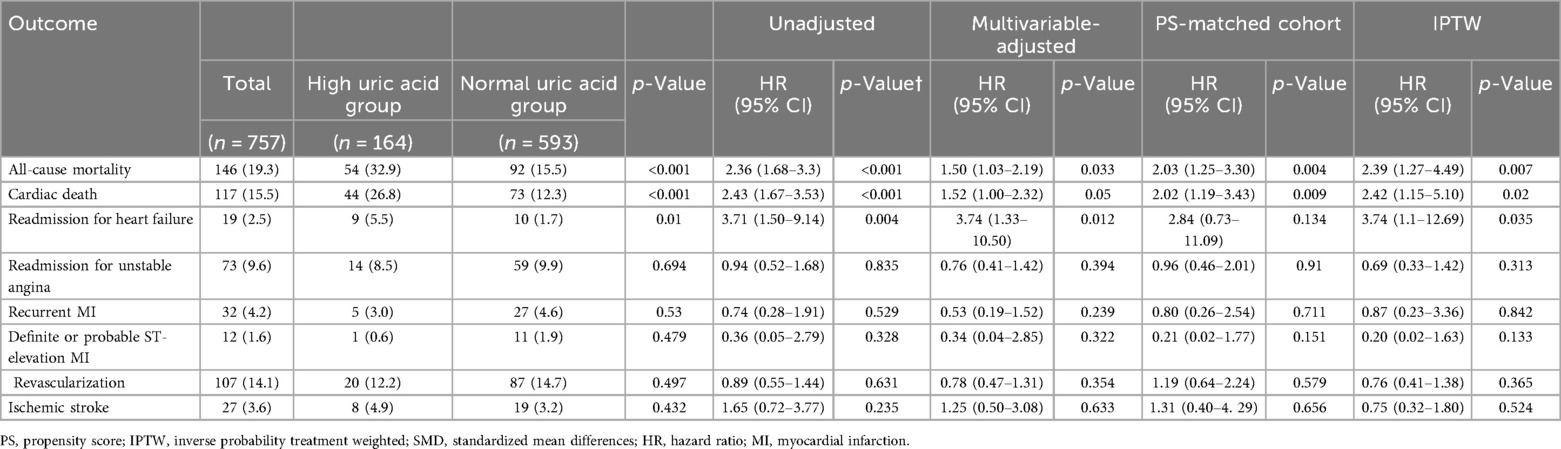
Table 4. Cumulative outcomes according to uric acid level in patients with HFpEF and AMI.
Risk prediction and stratification
A ROC curve analysis was performed to evaluate the ability of the serum uric acid level to predict mortality in patients with acute MI and HFpEF. The optimal cutoff value in our study was determined using a ROC curve analysis with the Youden index, and the association with long-term mortality was evaluated in a large multicenter acute MI cohort. The sensitivity and specificity of the serum uric acid levels at a cutoff of >6.9 mg/dL (410.41 µmol/L) were 34.94% and 83.7% for men, respectively, and, at a cut-off of >5.4 mg/dL (321.19 µmol/L), 39.68% and 77.07% for women, respectively. The addition of a high SUA to age >65, sex, and eGFR <30, which are well-validated conventional cardiovascular risk factors in acute MI, significantly increased the discriminant ability of the model to predict mortality compared with the conventional risk factors alone with an area under the curve (AUC) of 0.754 (95% CI: 0.713–0.797, p = 0.007) (Figure 3). The addition of high SUA to the conventional risk factors enabled significantly higher discrimination and reclassification abilities for all-cause mortality than the conventional risk factors alone.
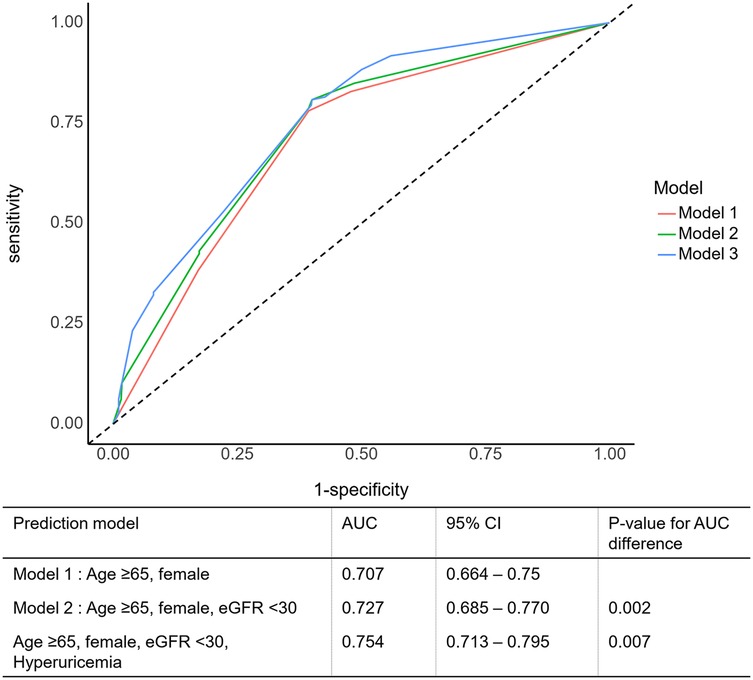
Figure 3. Prognostic impact of serum uric acid level in patients with an acute myocardial infarction. AUC, area under the ROC curve; CI, confidence interval; eGFR, estimated glomerular filtration rate.
Subgroup analysis
In the subgroup analysis, high uric acid levels were significantly associated with increased mortality across the majority of the groups (Figure 4). This association was particularly evident in the patients aged 65 and older (HR = 2.11; 95% CI 1.44–3.10), men (HR = 2.44; 95% CI 1.55–3.83), those with diabetes (HR = 3.16; 95% CI 1.98–5.03), patients with relatively preserved renal function (eGFR ≥ 30; HR = 2.27; 95% CI 1.57–3.28), and those with HFA-PEFF scores of 3 or higher (HR = 2.48; 95% CI 1.68–3.67). Conversely, no significant association between uric acid levels and mortality was observed in the high-risk groups, such as those with eGFR below 30 or those in Killip class III/IV.
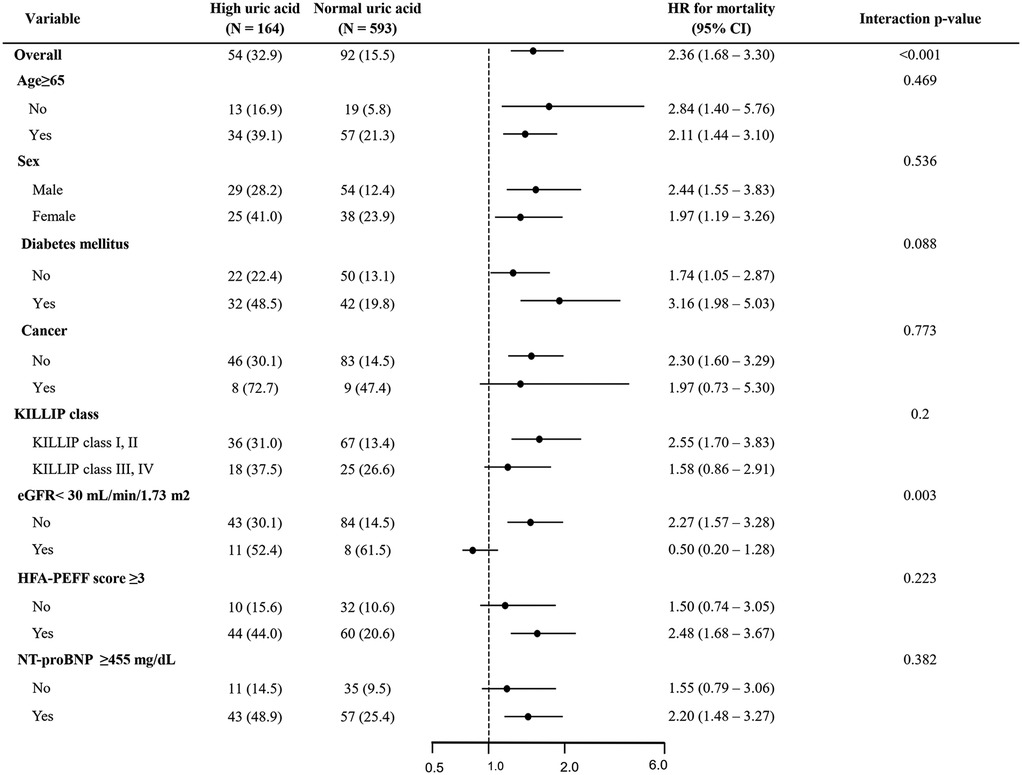
Figure 4. Forest plot for all-cause death. HR, hazard ratio; CI, confidence interval; eGFR, estimated glomerular filtration rate; NT-pro BNP, N-terminal pro B-type natriuretic peptide.
Discussion
In this large, nationwide registry-based study, we investigated the prognostic role of SUA in patients with HFpEF after an acute MI. The main findings of our study were that (i) elevated SUA levels were independently associated with increased all-cause mortality, primarily driven by cardiac death; (ii) the optimal SUA cut-off for mortality in patients with HFpEF and an acute MI was >6.9 mg/dL in men and >5.4 mg/dL in women; (iii) the predictive power of SUA was enhanced when added to the conventional risk factors, supporting its incremental prognostic role; (iv) in our subgroup analysis, a high SUA level was strongly associated with increased mortality, especially in patients with higher HFA-PEFF scores (≥3), while the association was attenuated in the patients with advanced renal dysfunction (eGFR <30). These results suggest that SUA is a biomarker that provides valuable prognostic information in patients with HFpEF and an acute MI, although its utility may not be applicable in patients with advanced chronic kidney disease (CKD).
The potential prognostic role of SUA is supported by several mechanisms. Serum uric acid is the end-product of purine metabolism and is metabolized by xanthine oxidase. An elevated serum uric acid level reflects increased xanthine oxidase activity, which is associated with enhanced oxidative stress, endothelial dysfunction, and microvascular inflammation, leading to systemic hypertension with vascular dysfunction and ultimately contributing to HF progression (12–15). These processes are central to the pathophysiology of HFpEF, which is characterized by cardiac remodeling with impaired ventricular relaxation and diastolic dysfunction (16, 17).
Although SUA has been recognized as a biomarker that is associated with cardiovascular morbidity and mortality, most prior studies have focused on general heart failure populations or those with reduced ejection fraction. Hyperuricemia has been consistently linked to oxidative stress, endothelial dysfunction, and adverse hemodynamic effects in HFrEF, and an elevated SUA level has been correlated with cardiovascular outcomes. Previous studies showed a correlation between uric acid level and HF. However, HFpEF is a heterogeneous syndrome with a complex pathophysiology distinct from HFrEF, and therefore, findings from studies on HFrEF cannot be generalized to HFpEF populations. A meta-analysis of nearly 42,000 patients from 28 studies on the association between SUA and HF outcomes found that every 1 mg/dL increase in SUA level was associated with a 19% higher odds of developing HF and a 4% higher risk of all-cause mortality (18). However, these studies did not distinguish between HF phenotypes. Prior research from our group of more than 5,000 patients also demonstrated that a high SUA level is an independent risk factor for all-cause mortality in patients with an acute MI, with better prognostic value than conventional risk factors, without differentiating HFpEF (19).
HFpEF is highly prevalent, accounting for up to 50% of HF etiology, and is associated with significant morbidity and mortality, and while the total incidence of HF has decreased, the incidence of HFpEF has increased (20). To date, only a few studies have examined the prognostic role of SUA in HFpEF, and these studies have been limited by short follow-up durations or a lack of clinical outcomes. Little has been revealed about the association between HFpEF and SUA. Carnicelli et al. found that hyperuricemia was associated with adverse biomarker profiles, including NT-proBNP and impaired cardiac function measured by exercise capacity during 24 weeks of a relatively short-term follow-up (21). In a retrospective study of 1,009 patients with hypertension and echocardiographic signs of diastolic dysfunction, an elevated SUA level was independently associated with an incident of new-onset HFpEF over a median of 7.2 years, suggesting a role for SUA in the development of this disease, with each 1 mg/dL increase predicting a 10.7% higher risk (22). Our study, with more than 700 well-characterized patients followed for approximately 5 years, is one of the first large-scale analyses to establish a significant long-term association between SUA and mortality specifically in patients with HFpEF after an MI.
One of the important findings of our study is the distinction between SUA as a prognostic marker in general HFpEF populations vs. in patients with advanced CKD. The PARAGON-HF trial showed that hyperuricemia was associated with increased risk of HF hospitalization and cardiovascular death; however, patients with eGFR <30 were excluded (23). In our cohort, although fewer than 5% of the patients had eGFR <30, this subgroup showed no significant association between SUA and mortality. Co-existence of CKD and HFpEF has been widely investigated, with CKD affecting half of HFpEF patients due to their similar underlying morbidities and sharing co-risk factors and microvascular dysfunction (24). Since SUA levels often increase due to impaired renal clearance, this complicates the interpretation of this finding in patients with HFpEF, in whom renal dysfunction is common. In patients with advanced CKD, competing risk factors and impaired clearance may outweigh the effect of SUA on mortality. In contrast, in patients with preserved renal function, SUA appears to reflect systemic metabolic and inflammatory pathways that directly contribute to adverse outcomes in HFpEF. This distinction emphasizes the need to interpret SUA levels in the context of renal function and indicates that patients with eGFR <30 should be regarded as a distinct subgroup with unique pathophysiology and competing risks. The interplay between SUA, renal function, and cardiovascular risk remains complex. Our findings may help clarify this relationship by showing that elevated SUA levels predicted higher mortality in patients with eGFR ≥30, while the association was absent in patients with advanced renal dysfunction.
Our study has several important clinical implications. SUA is an inexpensive, widely available laboratory measure that can be easily incorporated into routine practice. Due to HFpEF being challenging to diagnose, several diagnostic scoring systems, including the HFA-PEFF score, have been suggested for risk stratification. It has been shown that in patients with an acute MI, a higher HFA-PEFF score was associated with adverse clinical outcomes (25). In our study, SUA levels were significantly associated with increased mortality across the majority of the groups, with this trend being particularly pronounced in the patients with higher HFA-PEFF scores (≥3). As a higher HFA-PEFF score indicates a greater likelihood of HFpEF, our findings provided additional prognostic information beyond the conventional risk factors. The mean HFA-PEFF score in our study was 2.5 ± 1.2, indicating that some of the patients may have had a score of 1, which could imply the exclusion of HFpEF. However, HFpEF was diagnosed based on guideline-directed echocardiographic and biomarker criteria at baseline. This discrepancy reflects the heterogeneity of diagnostic algorithms in real-world practice. Furthermore, our study findings suggest that SUA could serve as a useful adjunctive biomarker for identifying high-risk patients with HFpEF after an MI, especially in settings where advanced biomarkers or imaging may not be readily available. Nevertheless, whether lowering SUA improves outcomes in patients with HFpEF remains uncertain. Information regarding uric acid-lowering therapies, such as allopurinol, was not available in our registry, and prior trials on HFrEF have been largely neutral, with no evidence of better outcomes in patients with HFpEF. Sacubitril/valsartan, which has uricosuric properties, was associated with reduced HF hospitalization in PARAGON-HF, but it is unclear whether this effect was mediated by uric acid lowering. Sub-analyses suggested improved quality of life and renal function after lowering SUA levels, but causality remains unproven (26, 27). Another novel HF medication, sodium-glucose cotransporter-2 (SGLT2) inhibitors, lowers serum uric acid levels by suppressing its production and enhancing excretion. However, the association between the uric acid-lowering effect and the cardioprotection of SGLT2 inhibitors does not appear to be causal, but rather reflects an independent process that shares a common pathophysiological mechanism (28, 29). In this context, our findings indicate that an elevated SUA level can serve as a prognostic biomarker, but its reduction alone may not necessarily have clinical implications. Future studies are warranted to incorporate SUA into clinical decision-making and clarify whether interventions targeting SUA directly can modify outcomes in patients with HFpEF.
Study limitations
Several limitations of our study should be acknowledged. First, this was an observational registry-based study, where confounding cannot be excluded despite adjustment and propensity-score matching. Second, the patients’ SUA levels were only measured at baseline, and we lacked data on temporal changes or treatment of hyperuricemia. Third, information on gout and uric acid-lowering medications was not available, preventing any evaluation of the therapeutic implications. Fourth, our study cohort was derived from an acute MI population rather than an HFpEF registry, where symptoms of HF were not collected. This also raises the possibility that our findings may not be fully generalizable to non-ischemic patients with HFpEF. Nevertheless, the patients fulfilled the echocardiographic criteria for HFpEF as recommended by current guidelines. Fifth, we excluded approximately 40% of eligible patients for whom baseline SUA measurements were missing, which could have led to selection bias. Finally, the proportion of women in our cohort was relatively low compared with other studies on HFpEF, which conflicts with the fact that HFpEF is more prevalent in women. This may be attributable to the fact that our study was derived from an AMI cohort, which was primarily composed of patients with ischemic heart disease.
Conclusion
In conclusion, our study demonstrated that an elevated serum uric acid level is independently associated with increased long-term all-cause mortality in patients with HFpEF following an acute MI. The association was most pronounced in the patients with higher HFA-PEFF scores and preserved renal function, while no significant relationship was observed in those with advanced CKD, highlighting the importance of patient characteristics when interpreting serum uric acid levels. Our study also underscores the potential role of serum uric acid as an easily accessible prognostic biomarker in HFpEF and provides a basis for future research on whether targeting uric acid may improve outcomes in select patient populations.
Data availability statement
The datasets are not readily available because they contain patient-level clinical information that is restricted under institutional and ethical regulations. Requests to access these datasets should be directed to Kwan Yong Lee,Y3ljbGUwMjEwQGdtYWlsLmNvbQ==.
Ethics statement
This study involving humans was approved by the Catholic Medical Center Central Institutional Review Board. This study was conducted in accordance with the local legislation and institutional requirements. Written informed consent for participation was not required from the participants or the participants' legal guardians/next of kin. Written informed consent for participation was not required for this study in accordance with the national legislation and the institutional requirements.
Author contributions
SK: Writing – original draft, Formal analysis, Methodology, Conceptualization, Writing – review & editing, Validation, Investigation. KL: Investigation, Conceptualization, Supervision, Data curation, Visualization, Project administration, Writing – review & editing. KK: Writing – review & editing, Data curation. JB: Data curation, Writing – review & editing. SS: Writing – review & editing, Data curation. B-HH: Writing – review & editing, Validation, Formal analysis. JK: Writing – review & editing, Formal analysis, Validation. EC: Writing – review & editing, Validation, Formal analysis. CK: Writing – review & editing, Investigation, Methodology. YK: Investigation, Methodology, Writing – review & editing. M-WP: Investigation, Writing – review & editing, Methodology. SH: Software, Writing – review & editing, Resources. AY: Resources, Software, Writing – review & editing. YA: Writing – review & editing, Conceptualization, Supervision. KC: Writing – review & editing, Conceptualization, Supervision.
Funding
The author(s) declare that no financial support was received for the research and/or publication of this article.
Conflict of interest
The authors declare that the research was conducted in the absence of any commercial or financial relationships that could be construed as a potential conflict of interest.
Generative AI statement
The author(s) declare that no Generative AI was used in the creation of this manuscript.
Any alternative text (alt text) provided alongside figures in this article has been generated by Frontiers with the support of artificial intelligence and reasonable efforts have been made to ensure accuracy, including review by the authors wherever possible. If you identify any issues, please contact us.
Publisher's note
All claims expressed in this article are solely those of the authors and do not necessarily represent those of their affiliated organizations, or those of the publisher, the editors and the reviewers. Any product that may be evaluated in this article, or claim that may be made by its manufacturer, is not guaranteed or endorsed by the publisher.
Supplementary material
The Supplementary Material for this article can be found online at: https://www.frontiersin.org/articles/10.3389/fcvm.2025.1622275/full#supplementary-material
Abbreviations
SUA, serum uric acid; HF, heart failure; HFpEF, heart failure with preserved ejection fraction; HFrEF, heart failure with reduced ejection fraction; MI, myocardial infarction; PCI, percutaneous coronary intervention; DES, drug-eluting stent; HFA-PEFF, Heart Failure Association-Pre-test assessment, Echocardiography and natriuretic peptide, Functional testing, and Final etiological work-up; H2FPEF, Heavy (BMI >30), Hypertensive (≥2 antihypertensive meds), atrial Fibrillation, Pulmonary hypertension (PASP >35 mmHg), Elder (age >60), Filling pressure (E/e′ > 9); LV, left ventricle; LVEF, left ventricular ejection fraction; NT-proBNP, N-terminal pro-brain natriuretic peptide; eGFR, estimated glomerular filtration rate; Hs-CRP, high sensitivity C-reactive protein; HDL, high-density lipoprotein; DM, diabetes mellitus; CKD, chronic kidney disease; STEMI, ST-segment elevation myocardial infarction; ARB, angiotensin II receptor blocker; ACE inhibitor, angiotensin-converting enzyme inhibitor; LVMI, left ventricular mass index; TR, tricuspid regurgitation; LAVI, left atrial volume index; SD, standard deviation; IQR, interquartile range; HR, hazard ratio; CI, confidence interval.
References
1. McDonagh TA, Metra M, Adamo M, Gardner RS, Baumbach A, Böhm M, et al. 2021 ESC guidelines for the diagnosis and treatment of acute and chronic heart failure: developed by the task force for the diagnosis and treatment of acute and chronic heart failure of the European Society of Cardiology (ESC) with the special contribution of the Heart Failure Association (HFA) of the ESC. Eur Heart J. (2021) 42(36):3599–726.34447992
2. Cannata A, McDonagh TA. Heart failure with preserved ejection fraction. N Engl J Med. (2025) 392(2):173–84. doi: 10.1056/NEJMcp2305181
3. Borlaug BA, Sharma K, Shah SJ, Ho JE. Heart failure with preserved ejection fraction: JACC scientific statement. J Am Coll Cardiol. (2023) 81(18):1810–34. doi: 10.1016/j.jacc.2023.01.049
4. Katsiki N, Dimitriadis GD, Mikhailidis DP. Serum uric acid and diabetes: from pathophysiology to cardiovascular disease. Curr Pharm Des. (2021) 27(16):1941–51. doi: 10.2174/1381612827666210104124320
5. Saito Y, Tanaka A, Node K, Kobayashi Y. Uric acid and cardiovascular disease: a clinical review. J Cardiol. (2021) 78(1):51–7. doi: 10.1016/j.jjcc.2020.12.013
6. Carluccio E, Coiro S, Ambrosio G. Unraveling the relationship between serum uric acid levels and cardiovascular risk. Int J Cardiol. (2018) 253:174–5. doi: 10.1161/CIR.0000000000001062
7. Heidenreich PA, Bozkurt B, Aguilar D, Allen LA, Byun JJ, Colvin MM, et al. 2022 AHA/ACC/HFSA guideline for the management of heart failure: a report of the American College of Cardiology/American Heart Association joint committee on clinical practice guidelines. J Am Coll Cardiol. (2022) 79(17):e263–421. doi: 10.1016/j.jacc.2021.12.012
8. Pieske B, Tschope C, de Boer RA, Fraser AG, Anker SD, Donal E, et al. How to diagnose heart failure with preserved ejection fraction: the HFA-PEFF diagnostic algorithm: a consensus recommendation from the Heart Failure Association (HFA) of the European Society of Cardiology (ESC). Eur Heart J. (2019) 40(40):3297–317. doi: 10.1093/eurheartj/ehz641
9. Reddy YNV, Carter RE, Obokata M, Redfield MM, Borlaug BA. A simple, evidence-based approach to help guide diagnosis of heart failure with preserved ejection fraction. Circulation. (2018) 138(9):861–70. doi: 10.1161/CIRCULATIONAHA.118.034646
10. Vandenbroucke JP, Ev E, Altman DG, Gøtzsche PC, Mulrow CD, Pocock SJ, et al. Strengthening the reporting of observational studies in epidemiology (STROBE): explanation and elaboration. Ann Intern Med. (2007) 147(8):W-163–94. doi: 10.7326/0003-4819-147-8-200710160-00010-w1
11. Austin PC. An Introduction to propensity score methods for reducing the effects of confounding in observational studies. Multivariate Behav Res. (2011) 46(3):399–424. doi: 10.1080/00273171.2011.568786
12. Cicero AF, Fogacci F, Cincione RI, Tocci G, Borghi C. Clinical effects of xanthine oxidase inhibitors in hyperuricemic patients. Med Princ Pract. (2021) 30(2):122–30. doi: 10.1159/000512178
13. Kattoor AJ, Pothineni NVK, Palagiri D, Mehta JL. Oxidative stress in atherosclerosis. Curr Atheroscler Rep. (2017) 19(11):42. doi: 10.1007/s11883-017-0678-6
14. Hare JM, Johnson RJ. Uric acid predicts clinical outcomes in heart failure: insights regarding the role of xanthine oxidase and uric acid in disease pathophysiology. Am Heart Assoc. (2003) 107(15):1951–3. doi: 10.1161/01.CIR.0000066420.36123.35
15. Sikora J, Wybranowski T, Karczmarska-Wódzka A, Sobczak P, Kruszewski S, Włodarczyk Z. Exploring the interplay of uric acid and advanced oxidation protein products following myocardial infarction. Appl Sci. (2024) 14(5):1983. doi: 10.3390/app14051983
16. Paulus WJ, Tschöpe C. A novel paradigm for heart failure with preserved ejection fraction: comorbidities drive myocardial dysfunction and remodeling through coronary microvascular endothelial inflammation. J Am Coll Cardiol. (2013) 62(4):263–71. doi: 10.1016/j.jacc.2013.02.092
17. Shah SJ, Kitzman DW, Borlaug BA, Van Heerebeek L, Zile MR, Kass DA, et al. Phenotype-specific treatment of heart failure with preserved ejection fraction: a multiorgan roadmap. Circulation. (2016) 134(1):73–90. doi: 10.1161/CIRCULATIONAHA.116.021884
18. Huang H, Huang B, Li Y, Huang Y, Li J, Yao H, et al. Uric acid and risk of heart failure: a systematic review and meta-analysis. Eur J Heart Fail. (2014) 16(1):15–24. doi: 10.1093/eurjhf/hft132
19. Kim S, Hwang BH, Lee KY, Kim CJ, Choo EH, Lim S, et al. High uric acid levels in acute myocardial infarction provide better long-term prognosis predictive power when combined with traditional risk factors. J Clin Med. (2022) 11(19):5531. doi: 10.3390/jcm11195531
20. Heidenreich PA, Bozkurt B, Aguilar D, Allen LA, Byun JJ, Colvin MM, et al. 2022 AHA/ACC/HFSA guideline for the management of heart failure: executive summary: a report of the American College of Cardiology/American Heart Association joint committee on clinical practice guidelines. Circulation. (2022) 145(18):e876–94. doi: 10.1161/CIR.0000000000001062
21. Carnicelli AP, Sun J-L, Alhanti B, Bjursell M, Perl S, Lytle B, et al. Elevated uric acid prevalence and clinical outcomes in patients with heart failure with preserved ejection fraction: insights from RELAX. Am J Med. (2020) 133(12):e716–21. doi: 10.1016/j.amjmed.2020.03.054
22. Gu J, Fan YQ, Zhang HL, Zhang JF, Wang CQ. Serum uric acid is associated with incidence of heart failure with preserved ejection fraction and cardiovascular events in patients with arterial hypertension. J Clin Hypertens (Greenwich). (2018) 20(3):560–7. doi: 10.1111/jch.13210
23. Selvaraj S, Claggett BL, Pfeffer MA, Desai AS, Mc Causland FR, McGrath MM, et al. Serum uric acid, influence of sacubitril–valsartan, and cardiovascular outcomes in heart failure with preserved ejection fraction: PARAGON-HF. Eur J Heart Fail. (2020) 22(11):2093–101. doi: 10.1002/ejhf.1984
24. van de Wouw J, Broekhuizen M, Sorop O, Joles JA, Verhaar MC, Duncker DJ, et al. Chronic kidney disease as a risk factor for heart failure with preserved ejection fraction: a focus on microcirculatory factors and therapeutic targets. Front Physiol. (2019) 10:1108. doi: 10.3389/fphys.2019.01108
25. Lee KY, Hwang B-H, Kim CJ, Sa YK, Choi Y, Kim J-J, et al. Prognostic impact of the HFA-PEFF score in patients with acute myocardial infarction and an intermediate to high HFA-PEFF score. J Clin Med. (2022) 11(15):4589. doi: 10.3390/jcm11154589
26. Solomon SD, McMurray JJV, Anand IS, Ge J, Lam CSP, Maggioni AP, et al. Angiotensin-neprilysin inhibition in heart failure with preserved ejection fraction. N Engl J Med. (2019) 381(17):1609–20. doi: 10.1056/NEJMoa1908655
27. Mogensen UM, Kober L, Jhund PS, Desai AS, Senni M, Kristensen SL, et al. Sacubitril/valsartan reduces serum uric acid concentration, an independent predictor of adverse outcomes in PARADIGM-HF. Eur J Heart Fail. (2018) 20(3):514–22. doi: 10.1002/ejhf.1056
28. Fitchett D, Inzucchi SE, Zinman B, Wanner C, Schumacher M, Schmoor C, et al. Mediators of the improvement in heart failure outcomes with empagliflozin in the EMPA-REG OUTCOME trial. ESC Heart Fail. (2021) 8(6):4517–27. doi: 10.1002/ehf2.13615
Keywords: heart failure with preserved ejection fraction (HFpEF), uric acid, hyperuricemia, acute myocardial infarction, heart failure
Citation: Kim S, Lee KY, Kim KA, Byeon J, Shin S, Hwang B-H, Kim JJ, Choo EH, Kim CJ, Kyoung Sa Y, Park M-W, Hyun S, Yoon AH, Ahn Y and Chang K (2025) The role of serum uric acid in survival prediction in patients with acute myocardial infarction accompanied by heart failure with preserved ejection fraction. Front. Cardiovasc. Med. 12:1622275. doi: 10.3389/fcvm.2025.1622275
Received: 13 May 2025; Accepted: 13 October 2025;
Published: 10 November 2025.
Edited by:
Gaetano Ruocco, Regina Montis Regalis Hospital, ItalyReviewed by:
Stefano Coiro, Hospital of Santa Maria della Misericordia in Perugia, ItalyRafal Adam Januszek, Andrzej Frycz Modrzewski Krakow University, Poland
Joanna Sikora, Nicolaus Copernicus University in Toruń, Poland
Copyright: © 2025 Kim, Lee, Kim, Byeon, Shin, Hwang, Kim, Choo, Kim, Kyoung Sa, Park, Hyun, Yoon, Ahn and Chang. This is an open-access article distributed under the terms of the Creative Commons Attribution License (CC BY). The use, distribution or reproduction in other forums is permitted, provided the original author(s) and the copyright owner(s) are credited and that the original publication in this journal is cited, in accordance with accepted academic practice. No use, distribution or reproduction is permitted which does not comply with these terms.
*Correspondence: Kwan Yong Lee, Y3ljbGUwMjEwQGdtYWlsLmNvbQ==