 Xiaoyang Zhou
 Hanyuan Fang2,†
 Jianneng Pan
 Tao Pan
 Bixin Chen
- 1Department of Intensive Care Medicine, Ningbo No.2 Hospital, Ningbo, Zhejiang, China
- 2Department of Emergency, Ningbo Yinzhou No.2 Hospital, Ningbo, Zhejiang, China
Introduction: Fluid-induced variations in central venous oxygen saturation (ΔScvO2) and central venous-to-arterial carbon dioxide tension difference [ΔP(cv-a)CO2] have been proposed to define fluid responsiveness. This study aimed to determine whether their diagnostic accuracies are affected by baseline values or oxygen consumption (VO2) responsiveness.
Materials and methods: This prospective observational study enrolled mechanically ventilated patients with circulatory shock. Hemodynamic variables and blood gas analysis were measured before and after a fluid challenge. Fluid responsiveness and VO2 responsiveness were defined as a ≥10% increase in cardiac index and VO2, respectively. The Spearman's rank correlation coefficient (rho) was computed to evaluate the association between variables. The diagnostic accuracy was assessed using the area under the receiver operating characteristic curve (AUC), with subgroup analyses based on baseline ScvO2 and P(cv-a)CO2 values and VO2 responsiveness.
Results: Out of 58 patients enrolled, 30 were fluid responders. The fluid-induced changes in cardiac index were significantly correlated with ΔScvO2 (rho = 0.36, P = 0.006) and ΔP(cv-a)CO2 (rho = −0.35, P = 0.006). ΔScvO2 and ΔP(cv-a)CO2 defined fluid responsiveness with AUC values of 0.76 [95% confidence interval (CI): 0.63–0.86, P < 0.001] and 0.72 (95% CI: 0.59–0.83, P < 0.001), respectively. A cutoff value of 5% for ΔScvO2 and −2 mmHg for ΔP(cv-a)CO2 yielded positive predictive values of 88% and 75%, and negative predictive values of 63% and 61%, respectively. The gray zones for ΔScvO2 (−3 to 4.6%) and ΔP(cv-a)CO2 (−2.7 to 1 mmHg) comprised 51.7% and 48.3% of the patients, respectively. In the subgroup analyses, ΔScvO2 potentially exhibited better accuracy for assessing fluid responsiveness in VO2 non-responders (AUC of 0.91, 95% CI: 0.78–0.98; 40 patients) and patients with a baseline ScvO2 < 70% (AUC of 0.84, 95% CI: 0.67–0.95; 32 patients). Meanwhile, the diagnostic accuracy of ΔP(cv-a)CO2 was slightly improved in VO2 non-responders (AUC of 0.78, 95% CI: 0.62–0.90; 40 patients) and patients with a baseline P(cv-a)CO2 ≥ 6 mmHg (AUC of 0.78, 95% CI: 0.62–0.90; 39 patients).
Conclusion: ΔScvO2 and ΔP(cv-a)CO2 are potential indicators of fluid responsiveness in mechanically ventilated patients with circulatory shock, especially those with abnormal baseline values or VO2 unresponsiveness.
Introduction
In the intensive care unit (ICU), volume expansion represents the most commonly used measure to correct hypotension and hypoperfusion, aiming to improve oxygen delivery (DO2) by increasing cardiac output (CO), thereby ameliorating tissue perfusion. Whether volume expansion can elevate CO depends on whether the heart functions on the steep portion of the Frank-Starling curve, indicating fluid responsiveness (1). In recent years, the study of oxygen and carbon dioxide (CO2) metabolism has gained attention for assessing fluid responsiveness (2–4). From a physiological perspective, oxygen and CO2 metabolism are closely related to blood flow, as it provides oxygen to the tissues and removes CO2 produced by them (5, 6).
In recent studies, variations in central venous oxygen saturation (ScvO2) (ΔScvO2) and central venous-to-arterial carbon dioxide tension difference (P(cv-a)CO2) [ΔP(cv-a)CO2] during volume expansion have been confirmed to assess fluid responsiveness (2–4). Indeed, according to the Fick principle, ΔScvO2 during volume expansion can track changes in CO if oxygen content and oxygen consumption (VO2) remain stable, and ΔP(cv-a)CO2 during volume expansion is inversely proportional to the CO changes under consistent CO2 production (5–8). However, VO2 and CO2 production may not always remain unchanged during volume expansion due to the VO2/DO2 dependency phenomenon and anaerobic CO2 production (9–11). Furthermore, whether the diagnostic accuracies of ΔScvO2 and ΔP(cv-a)CO2 depend on their baseline values remains unknown, even though the baseline ScvO2 and P(cv-a)CO2 seem unable to identify fluid responsiveness (2). This study aimed to determine whether their diagnostic accuracies are affected by baseline ScvO2 and P(cv-a)CO2 values or the fluid-induced VO2 responsiveness.
Materials and methods
This prospective observational study was conducted in the ICU of Ningbo No. 2 Hospital from January 2024 to December 2024. It was part of a study program registered with the Chinese Clinical Trial Registry (ChiCTR2100053665) and approved by the local institutional ethics committee (YJ-NBEY-KY-2022-147-01). This manuscript adheres to the applicable STROBE guidelines (12). Written informed consent was obtained from the patients’ relatives. This study was conducted in compliance with the Declaration of Helsinki.
Patients
The eligible subjects were mechanically ventilated adults (age ≥ 18 years) with circulatory shock and without spontaneous respiratory efforts, for whom the attending physician decided to perform a fluid challenge, where circulatory shock was defined as the presence of one or more of the following signs: 1) systolic arterial pressure < 90 mmHg, mean arterial pressure < 65 mmHg, or requiring vasopressor administration; 2) skin mottling; 3) urine output < 0.5 mL/kg/h for ≥ 2 h; 4) lactate level > 2 mmol/L. Patients would be excluded if they met the following criteria: no indwelling arterial or central venous catheterization, aortic valve surgery, equipped with extracorporeal membrane oxygenation or a pacemaker, contraindications to fluid challenge, poor echogenicity, atrial fibrillation, refractory shock expected to die within 24 h, or decline to participate.
Study protocol
All eligible patients received invasive radial arterial monitoring and central venous catheterization, with the catheter tip positioned in the superior vena cava or the right atrium. Pressure calibration was performed in the supine position, with pressure transducers zeroed at the phlebostatic axis, a position corresponding to the right atrium's level (the midpoint of the fourth intercostal space at the midaxillary line) (13). A pressure-controlled ventilation mode was set, and sedative and analgesic medications were continuously administered to avoid spontaneous breathing efforts. Once enrollment was confirmed, a baseline set of hemodynamic variables was measured, and transthoracic echocardiography (TTE) was performed. Meanwhile, arterial and central venous blood gases were simultaneously sampled and analyzed using a GEM Premier 3,500 blood gas analyzer (Instrumentation Laboratory Company, Bedford, MA, USA). Immediately after that, a fluid challenge test was conducted by administering a pressurized bolus of 500 mL of Ringer's solution over 15 min in the 45° semi-recumbent position. Immediately after the fluid challenge, a second set of the above measurements was taken. During the study period, no adjustments were made to body position, ventilator settings, vasopressors, inotropes, or sedative and analgesic drugs. Figure 1 illustrates the detailed process of this study.
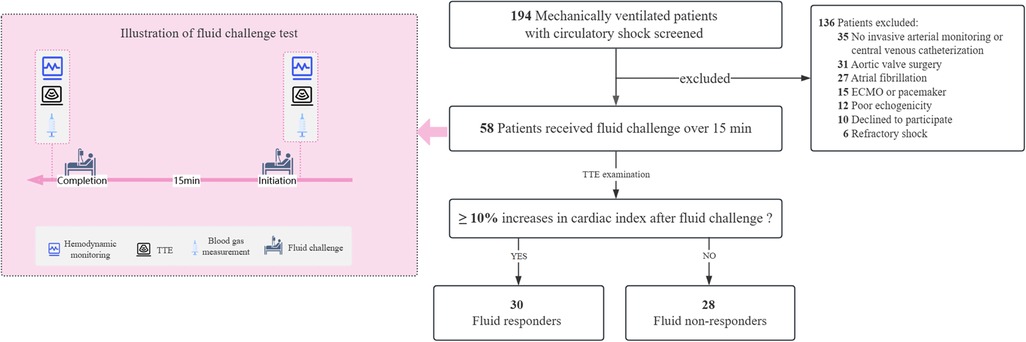
Figure 1. Illustration of study selection and fluid challenge test. ECMO, extracorporeal membrane oxygenation; TTE, transthoracic echocardiography.
Data collection
We collected demographic information (including age, gender, body mass index, and comorbidities), causes of shock, ventilator-related parameters (including tidal volume, positive end-expiratory pressure, driving pressure, respiratory rate, and fraction of inspired oxygen), acute physiology and chronic health evaluation II score, sequential organ failure assessment score, sedative and analgesic drugs, and vasoactive agents at the time of enrollment. We measured and recorded hemodynamic variables [including heart rate (HR), central venous pressure, systolic arterial pressure, diastolic arterial pressure, and mean arterial pressure], echocardiographic parameters [including stroke volume (SV), cardiac index, and velocity-time integral (VTI)], arterial and central venous blood gases parameters (including potential of hydrogen (PH), arterial lactate level, arterial partial pressure of carbon dioxide (PaCO2), arterial oxygen saturation (SaO2), central venous partial pressure of carbon dioxide (PcvCO2), and ScvO2), and oxygen-CO2 derived variables (including DO2, VO2, and P(cv-a)CO2) at baseline and after the fluid challenge. The hemoglobin (Hb) concentration was measured together with arterial blood gas analysis using the GEM Premier 3,500 blood gas analyzer (Instrumentation Laboratory Company, Bedford, MA, USA). Patients were followed up until ICU discharge.
SV was computed as: VTI × LVOT area, where VTI was measured via continuous Doppler transaortic flow on an apical five-chamber view, and LVOT area was calculated as π × (LVOT diameter/2)2 (LVOT refers to the left ventricular outflow tract). Then, cardiac index was calculated as (SV × HR)/body surface area. TTE examination was conducted with the CX50 ultrasound system (Philips Medical System, Suresnes, France), which was performed by an independent ICU physician who was blinded to the study outcomes. The representative value of echocardiographic parameters was obtained by averaging three consecutive measurements, regardless of the respiratory cycle.
Definition
ΔScvO2 and ΔP(cv–a)CO2 induced by volume expansion were calculated as absolute changes, that is, subtracting the baseline value from the value after volume expansion. The fluid-induced changes in cardiac index and VO2 were calculated as relative changes: (the value after fluid infusion – the baseline value)/ the baseline value×100%. Fluid responsiveness and VO2 responsiveness were defined by a ≥10% increase in cardiac index and VO2 in response to volume expansion, respectively. According to the Fick principle, DO2 was calculated as (SV × HR) × (1.34 × Hb × SaO2 + 0.003 × PaO2), and VO2 was calculated as (SV × HR) × [(1.34 × Hb × SaO2 + 0.003 × PaO2) − (1.34 × Hb × ScvO2 + 0.003 × PcvO2)], where PaO2 is the arterial oxygen tension, and PcvO2 is the central venous oxygen tension.
Statistical analysis
Statistical analyses were performed using SPSS version 17.0 (IBM, New York, USA). The normal distribution of continuous variables was assessed using the Kolmogorov–Smirnov test. Normally distributed variables are presented as means ± standard deviation (SD), and skewed variables are reported as medians with interquartile ranges (IQR). Categorical variables are described as frequencies and percentages. For the continuous data, either the Student's t-test or the Mann–Whitney test was used for inter-group comparison, depending on the data distribution, and the Student's paired t-test was applied for the intra-group comparisons. The Chi-squared test or Fisher's exact test was utilized to compare categorical variables. The Spearman's rank correlation coefficient (rho) was computed to evaluate the association between the fluid-induced changes in cardiac index and ΔScvO2 and ΔP(cv–a)CO2.
The MedCalc Statistical Software (MedCalc Software bvba, Ostend, Belgium) was employed to construct ROC curves for assessing the diagnostic accuracy of ΔScvO2 and ΔP(cv–a)CO2 for fluid responsiveness. The optimal cutoff value was determined by maximizing the Youden index, while taking into account the smallest detectable differences (SDD) of ScvO2 (±3%) and P(cv–a)CO2 (±2 mmHg), as previously reported (14). Additionally, the gray zone approach was used to avoid the binary constraint of a “black-or-white” decision of the optimal cutoff value (15). We calculated the gray zone for ΔScvO2 and ΔP(cv–a)CO2 based on values that did not allow for having 10% of diagnosis tolerance (i.e., a sensitivity of <90% or a specificity of <90%) (15). To identify potential factors affecting the diagnostic accuracy, we performed subgroup analyses based on baseline ScvO2 value (≥70% or <70%), baseline P(cv–a)CO2 value (≥6 mmHg or <6 mmHg), and fluid-induced VO2 responsiveness (yes or no). The DeLong's test was used to determine the difference in AUC between subgroups with a minimum calculated sample size (16).
The Power Analysis and Sample Size software (NCSS, LLC, Kaysville, UT, USA) was utilized to determine the statistical power. Previous studies indicated that both ΔScvO2 and ΔP(cv–a)CO2 had an area under the receiver operating characteristic (ROC) curve (AUC) of approximately 0.8 (2, 3). To achieve a power of 80% with an alpha risk of 0.05, it was determined that 26 subjects would be sufficient. Therefore, at least 52 patients were required to ensure adequate statistical power for each arm in the subgroup analyses. In addition, we randomly selected 10 patients to calculate the coefficient of variation (CV) and the least significant change (LSC) to assess the intra-operator reproducibility for VTI. A two-tailed P-value of less than 0.05 was considered statistically significant.
Results
A total of 58 consecutive patients were enrolled over one year, and 30 (51.7%) of them were classified as fluid responders (Figure 1). Distributive shock represented the primary cause of hypotension in this study (79.3%, 46/58), and the baseline characteristics and clinical outcomes were comparable between the responders and non-responders. Of note, all patients but one received norepinephrine infusion during the study period, and the intra-operator reproducibility for VTI was deemed acceptable with a CV of 4.0% [95% confidence interval (CI): 1.4%–6.6%] and a LSC of 6.4% (95% CI: 2.2%–10.5%). Table 1 presents the baseline characteristics of the patients.
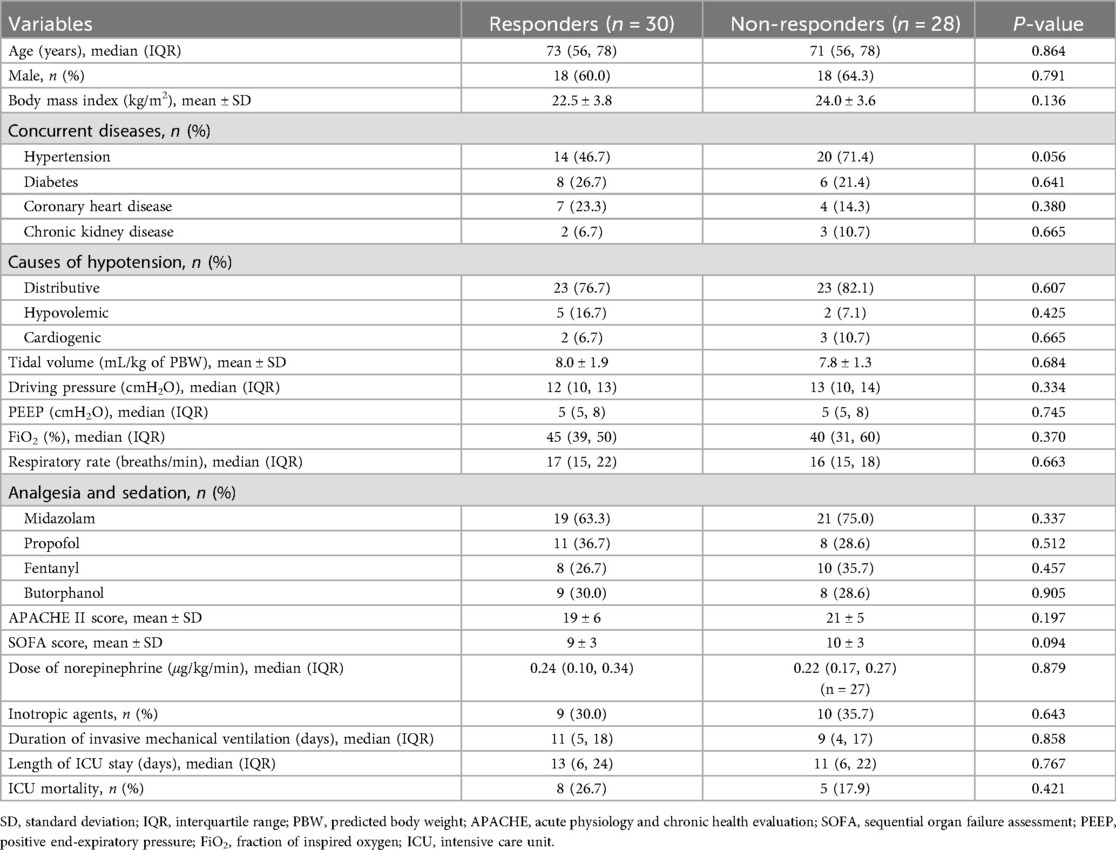
Table 1. Baseline characteristics.
Hemodynamic changes induced by fluid expansion
Before the fluid challenge, no significant differences in the baseline hemodynamic variables were observed between the responders and non-responders. After the fluid challenge, SV, cardiac index, and DO2 were remarkably increased in the responders, but not in the non-responders. Hemoglobin was significantly decreased after fluid expansion in both groups. In the responders, volume expansion led to an elevated ScvO2 and a reduced P(cv–a)CO2, whereas these values remained unchanged in the non-responders. Table 2 shows the fluid-induced changes in hemodynamic variables in detail.
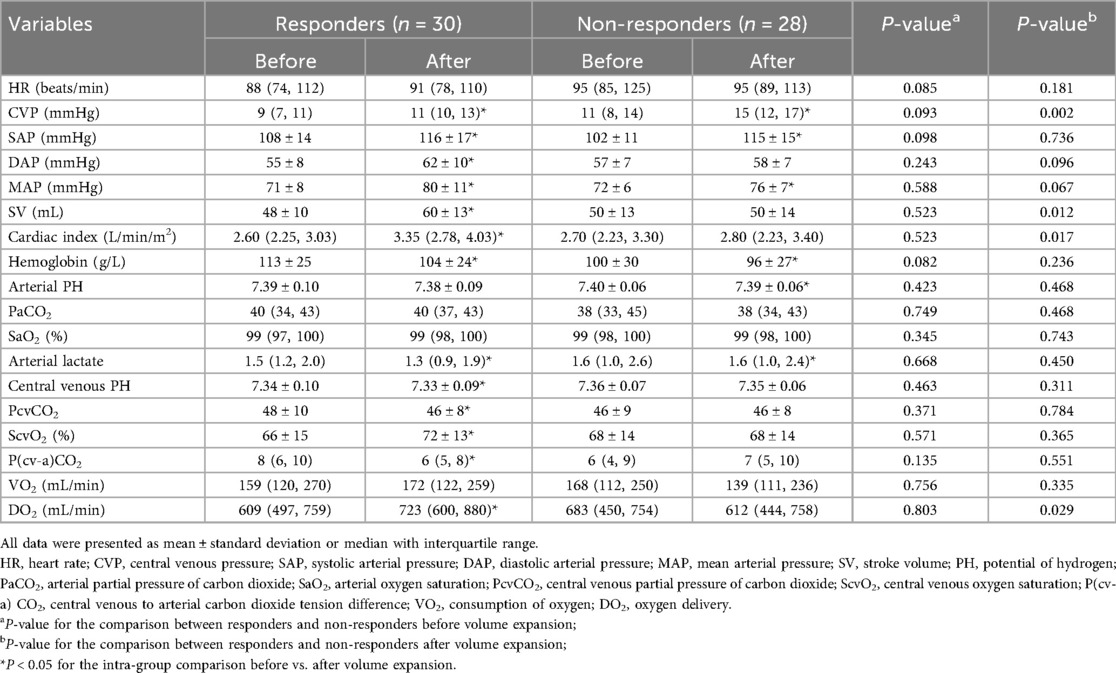
Table 2. Changes in hemodynamic variables induced by volume expansion.
Relationship between fluid responsiveness and ΔScvO2, and Δp(cv–a)CO2
Spearman correlation analyses revealed that the fluid-induced changes in cardiac index were positively correlated with ΔScvO2 (rho = 0.36, P = 0.006) and were negatively correlated with ΔP(cv–a)CO2 (rho = −0.35, P = 0.006) (Figure 2).
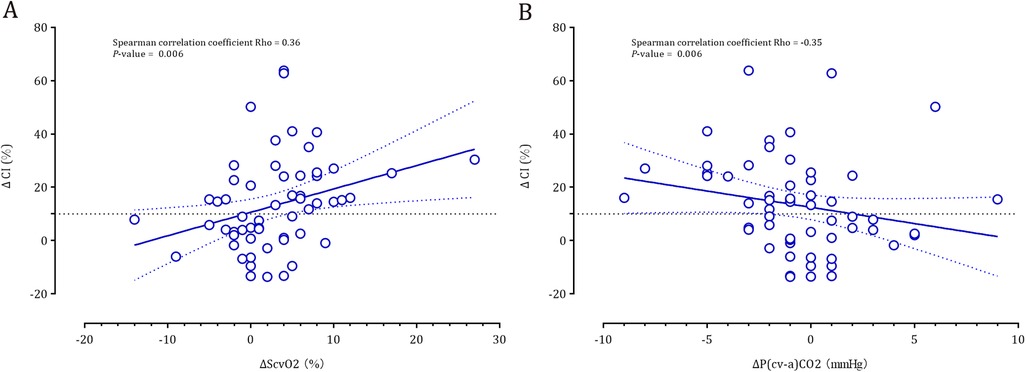
Figure 2. Correlation between the fluid-induced cardiac index and ΔScvO2 (panel A) and ΔP(cv-a)CO2 (panel B).
ΔScvO2 and ΔP(cv-a)CO2 defined fluid responsiveness with AUC values of 0.76 (95% CI: 0.63–0.86; P < 0.001) and 0.72 (95% CI: 0.59–0.83; P < 0.001) (Figure 3), respectively. Based on the Youden index, the optimal cutoff value of ΔScvO2 was 2%, with a sensitivity of 76.7% and a specificity of 75.0%. However, considering the repeatability of ScvO2 (a SDD of ±3%), the optimal cutoff value was 5%, yielding a sensitivity of 50%, a specificity of 92.9%, a positive predictive value (PPV) of 88%, and a negative predictive value (NPV) of 63%. The gray zone approach identified a ΔScvO2 range of −3% to 4.6%, which included 51.7% of the patients (Figure 3). According to the Youden index, the optimal cutoff value of ΔP(cv-a)CO2 was −2 mmHg, which exceeded the SDD of P(cv-a)CO2 (±2 mmHg). Thus, the optimal cutoff value of −2 mmHg yielded a sensitivity of 50%, a specificity of 82.1%, a PPV of 75%, and an NPV of 61%. A range of −2.7 mmHg to 1 mmHg represented the gray zone for ΔP(cv-a)CO2 that comprised 48.3% of patients (Figure 3).
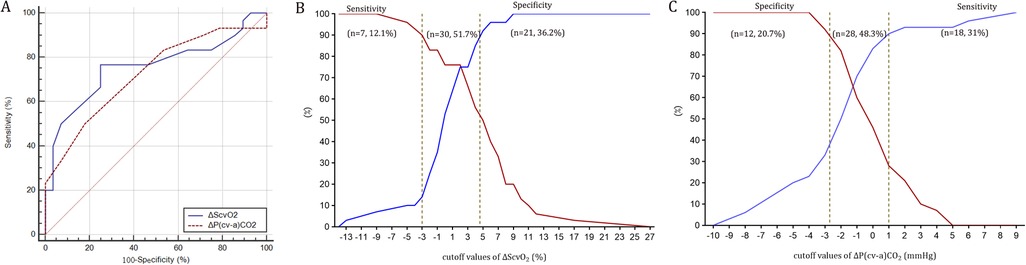
Figure 3. Receiver operating characteristic curves (panel A) and the gray zone for ΔScvO2 (panel B) and ΔP(cv-a)CO2 (panel C).
Subgroup analyses
Given the minimum calculated sample size, the findings from the subgroup analysis with a sample size of 26 cases or more were considered statistically valid. Subgroup analyses demonstrated that ΔScvO2 potentially exhibited better accuracy for assessing fluid responsiveness in VO2 non-responders and patients with a baseline ScvO2 < 70%. Meanwhile, the diagnostic accuracy of ΔP(cv-a)CO2 was slightly improved in VO2 non-responders and patients with a baseline P(cv-a)CO2 ≥ 6 mmHg (Table 3). The AUC of ΔScvO2 in the subgroup with a baseline ScvO2 < 70% was slightly higher than that in the subgroup with a baseline ScvO2 ≥ 70%, despite no statistical significance (P = 0.219). However, the comparisons of AUC in other subgroups were not conducted because the minimum sample size in some subgroups was not reached.
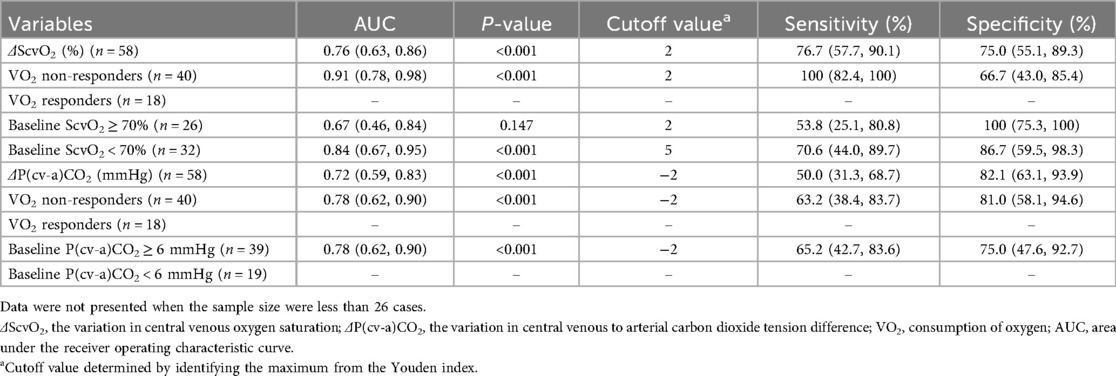
Table 3. Subgroup analyses for diagnostic accuracies of ΔScvO2 and ΔP(cv-a)CO2 in assessing fluid responsiveness.
Discussion
In this perspective observational study, the principal findings demonstrated that ΔScvO2 and ΔP(cv-a)CO2 during volume expansion possessed an acceptable diagnostic accuracy for identifying fluid responsiveness, and the diagnostic accuracies of ΔScvO2 and ΔP(cv-a)CO2 were likely associated with their baseline values and the fluid-induced VO2 responsiveness.
Consistent with the optimal CI of ΔScvO2 (3% to 5%) identified in our recent meta-analysis (3), we determined the optimal cutoff value for ΔScvO2 as 5% in the current study, yielding a high PPV (88%) and a relatively low NPV (63%). Thus, we can almost confirm that a patient can benefit from volume expansion if the measured ΔScvO2 is greater than 5%. However, we cannot make any decisions if the measured ΔScvO2 is less than 5%, due to the low NPV. Indeed, a low ΔScvO2 does not necessarily indicate a small change in CO induced by fluid challenge. According to the Fick principle, the close relationship between ScvO2 and CO depends on stable oxygen content and VO2 during volume expansion (7). However, a potential decrease in Hb concentration could somewhat reduce oxygen content. We observed a median reduction in Hb of 5.9% after volume expansion across the entire population studied, which was consistent with a recent meta-analysis (17). Furthermore, VO2 does not always remain constant during volume expansion because of the VO2/DO2 dependency phenomenon. The VO2/DO2 dependency phenomenon refers to a linear correlation between DO2 and VO2 when DO2 decreases below the critical value (18), which implies that VO2 will change linearly with DO2, thus resulting in a relatively constant oxygen extraction and ScvO2 (3). In these situations, ScvO2 would not change significantly (i.e., a low ΔScvO2) despite a noticeable increase in CO and DO2. This could explain why the diagnostic accuracy of ΔScvO2 was improved considerably after excluding the VO2 responders. Additionally, subgroup analysis revealed that the AUC of ΔScvO2 was increased after excluding patients with a baseline ScvO2 ≥ 70% (see Table 3), which suggested that the baseline ScvO2 may be a determinant of the diagnostic accuracy of ΔScvO2, even though the baseline ScvO2 seems unable to identify fluid responsiveness (2, 19). Indeed, a normal or supranormal ScvO2 value typically indicates an adequate CO to provide sufficient oxygen delivery and/or mitochondrial dysfunction or microcirculatory shunting. In this case, the magnitude of ΔScvO2 induced by volume expansion may be limited and may not be parallel to the fluid-induced increases in CO.
In addition, we also confirmed the ability of ΔP(cv-a)CO2 to define fluid responsiveness. However, the diagnostic accuracy of ΔP(cv-a)CO2 (AUC of 0.72) in our study appears to be lower than that in a previous study (AUC of 0.831) (2). This discrepancy is not surprising given the complex relationship between ΔP(cv-a)CO2 and CO. It should be recognized that the close association between ΔP(cv-a)CO2 and CO relies on a stable CO2 content-CO2 partial pressure relationship, as well as a stable relationship between P(cv-a)CO2 and CO (5, 20). However, the curvilinear CO2 content-CO2 partial pressure relationship can be influenced by metabolic acidosis, hematocrit, or the Haldane effect, which refers to the effect of oxygen saturation on CO2 transport (5, 20). Consequently, varying baseline values for these variables may result in differing diagnostic accuracies of ΔP(cv-a)CO2 across various studies. Furthermore, the relationship between P(cv-a)CO2 and CO is also curvilinear. This means that for a constant total CO2 production, fluid-induced changes in CO can cause a more significant alteration in P(cv-a) CO2 at a low CO value than at a normal or high CO value (5). This may explain why ΔP(cv-a)CO2 was more effective in defining fluid responsiveness in patients with a baseline P(cv-a)CO2 ≥ 6 mmHg, as a high P(cv-a)CO2 level typically indicates a low baseline CO. Similarly, a previous study found that fluid-induced CO increases engendered a reduction in P(cv-a) CO2 only in patients with elevated baseline P(cv-a)CO2 values (≥6 mmHg), but not in those with normal baseline levels (21). The subgroup analysis also revealed an improved diagnostic accuracy of ΔP(cv-a)CO2 when excluding patients with VO2 responsiveness. This finding aligns with the study conducted by Nassar et al. (4). Specifically, CO2 production associated with anaerobic metabolism tends to occur at the VO2/DO2 dependency stage (5, 6). This phenomenon may attenuate the relationship between ΔP(cv-a)CO2 and fluid-induced CO increases.
Our findings provide a clinical implication: when the CO measurement is not available, measuring ScvO2 or P(cv-a)CO2 before and after volume expansion can help identify which patients are likely to benefit from fluid therapy, particularly for patients with abnormal baseline values or with VO2 unresponsiveness. However, several limitations in this study should be highlighted. First, the limited sample size in this study could overestimate the effect sizes, especially hampering us from drawing a firm conclusion in the subgroup analysis. Second, ScvO2 was measured in this study instead of the mixed venous oxygen saturation. As ScvO2 primarily reflects the DO2-VO2 relationship in the upper side of the body, it may not inform about the local perfusion disturbances in regional septic conditions (5). Despite this, the changes in ScvO2 can track the global DO2 changes, given the equivalent changing trend of ScvO2 and the mixed venous oxygen saturation (22). Finally, there may be mathematical coupling issues in the estimation of DO2 and VO2 based on the Fick method, which may introduce bias in the results of subgroup analysis.
Conclusion
In mechanically ventilated patients, ΔScvO2 and ΔP(cv-a)CO2 induced by volume expansion are potential indicators for assessing fluid responsiveness and may be routinely measured to indicate fluid responsiveness in the absence of CO measurement. The diagnostic accuracies of ΔScvO2 and ΔP(cv-a)CO2 were likely associated with the baseline ScvO2 and P(cv-a)CO2 values and the fluid-induced VO2 responsiveness.
Data availability statement
The original contributions presented in the study are included in the article/Supplementary Material, further inquiries can be directed to the corresponding authors.
Ethics statement
The studies involving humans were approved by the institutional ethics committee of Ningbo No.2 Hospital (YJ-NBEY-KY-2022-147-01). The studies were conducted in accordance with the local legislation and institutional requirements. The participants provided their written informed consent to participate in this study.
Author contributions
XZ: Methodology, Supervision, Writing – original draft, Funding acquisition, Conceptualization, Formal analysis. HF: Formal analysis, Writing – original draft, Methodology. CX: Formal analysis, Writing – original draft, Data curation, Methodology, Investigation. JP: Data curation, Methodology, Investigation, Formal analysis, Writing – original draft. HW: Investigation, Data curation, Writing – original draft, Formal analysis, Methodology. TP: Writing – review & editing, Funding acquisition, Methodology, Formal analysis, Conceptualization. ZX: Conceptualization, Writing – review & editing, Funding acquisition, Formal analysis. BC: Writing – review & editing, Methodology, Supervision, Conceptualization, Formal analysis.
Funding
The author(s) declare financial support was received for the research and/or publication of this article. This study was supported by grants from the Zhejiang Medicine and Health Science and Technology Project (No. 2023KY1084), the Project of Ningbo Health Youth Backbone Talent Training (No. 2025QNJS-22, 2025JSPT-42), and the Project of Hospital-level Key Discipline of Ningbo No.2 Hospital (No. 2023-Y06). The funders had no role in the design of the study or collection, analysis, or interpretation of data, or writing the manuscript.
Conflict of interest
The authors declare that the research was conducted without any commercial or financial relationships that could be construed as a potential conflict of interest.
Generative AI statement
The author(s) declare that no Generative AI was used in the creation of this manuscript.
Any alternative text (alt text) provided alongside figures in this article has been generated by Frontiers with the support of artificial intelligence and reasonable efforts have been made to ensure accuracy, including review by the authors wherever possible. If you identify any issues, please contact us.
Publisher's note
All claims expressed in this article are solely those of the authors and do not necessarily represent those of their affiliated organizations, or those of the publisher, the editors and the reviewers. Any product that may be evaluated in this article, or claim that may be made by its manufacturer, is not guaranteed or endorsed by the publisher.
Abbreviations
ICU, intensive care unit; CO, cardiac output; DO2, oxygen delivery; VO2, oxygen consumption; CO2, carbon dioxide; ScvO2, central venous oxygen saturation; P(cv-a)CO2, central venous-to-arterial carbon dioxide tension difference; ΔScvO2, the variation in ScvO2; ΔP(cv-a)CO2, the variation in P(cv-a)CO2; PaCO2, arterial partial pressure of carbon dioxide; PcvCO2, central venous partial pressure of carbon dioxide; TTE, transthoracic echocardiography; VTI, aortic velocity-time integral; LVOT, left ventricular outflow tract; SV, stroke volume; HR, heart rate; SaO2, arterial oxygen saturation, Hb, hemoglobin, PaO2, arterial oxygen tension; PcvO2, central venous oxygen tension; SDD, smallest detectable differences; CV, coefficient of variation; LSC, least significant change; ROC, receiver operating characteristic; AUC, area under the ROC curve; SD, standard deviation; IQR, interquartile range; CI, confidence interval; PPV, positive predictive value; NPV, negative predictive value.
References
1. Monnet X, Malbrain MLNG, Pinsky MR. The prediction of fluid responsiveness. Intensive Care Med. (2023) 49(1):83–6. doi: 10.1007/s00134-022-06900-0
2. Mallat J, Abou-Arab O, Lemyze M, Saleh D, Guinot PG, Fischer MO. Changes in central venous-to-arterial PCO2 difference and central venous oxygen saturation as markers to define fluid responsiveness in critically ill patients: a post-hoc analysis of a multi-center prospective study. Crit Care. (2024) 28(1):360. doi: 10.1186/s13054-024-05156-y
3. Pan J, Sun Y, Xu Z, Dong P, Zhou X. Variation in central venous oxygen saturation to evaluate fluid responsiveness: a systematic review and meta-analysis. Crit Care. (2023) 27(1):203. doi: 10.1186/s13054-023-04480-z
4. Nassar B, Badr M, Van Grunderbeeck N, Temime J, Pepy F, Gasan G, et al. Central venous-to-arterial PCO2 difference as a marker to identify fluid responsiveness in septic shock. Sci Rep. (2021) 11(1):17256. doi: 10.1038/s41598-021-96806-6
5. Mallat J, Lemyze M, Tronchon L, Vallet B, Thevenin D. Use of venous-to-arterial carbon dioxide tension difference to guide resuscitation therapy in septic shock. World J Crit Care Med. (2016) 5(1):47–56. doi: 10.5492/wjccm.v5.i1.47
6. Cousin VL, Joye R, Wacker J, Beghetti M, Polito A. Use of CO2-derived variables in cardiac intensive care unit: pathophysiology and clinical implications. J Cardiovasc Dev Dis. (2023) 10(5):208. doi: 10.3390/jcdd10050208
7. Squara P. Central venous oxygenation: when physiology explains apparent discrepancies. Crit Care. (2014) 18(6):579. doi: 10.1186/s13054-014-0579-9
8. Mallat J, Benzidi Y, Salleron J, Lemyze M, Gasan G, Vangrunderbeeck N, et al. Time course of central venous-to-arterial carbon dioxide tension difference in septic shock patients receiving incremental doses of dobutamine. Intensive Care Med. (2014) 40(3):404–11. doi: 10.1007/s00134-013-3170-y
9. Monnet X, Julien F, Ait-Hamou N, Lequoy M, Gosset C, Jozwiak M, et al. Lactate and venoarterial carbon dioxide difference/arterial-venous oxygen difference ratio, but not central venous oxygen saturation, predict increase in oxygen consumption in fluid responders. Crit Care Med. (2013) 41(6):1412–20. doi: 10.1097/CCM.0b013e318275cece
10. Mallat J, Lemyze M, Meddour M, Pepy F, Gasan G, Barrailler S, et al. Ratios of central venous-to-arterial carbon dioxide content or tension to arteriovenous oxygen content are better markers of global anaerobic metabolism than lactate in septic shock patients. Ann Intensive Care. (2016) 6(1):10. doi: 10.1186/s13613-016-0110-3
11. Vallet B, Teboul JL, Cain S, Curtis S. Venoarterial CO(2) difference during regional ischemic or hypoxic hypoxia. J Appl Physiol. (2000) 89:1317–21. doi: 10.1152/jappl.2000.89.4.1317
12. von Elm E, Altman DG, Egger M, Pocock SJ, Gøtzsche PC, Vandenbroucke JP; STROBE Initiative. The strengthening the reporting of observational studies in epidemiology (STROBE) statement: guidelines for reporting observational studies. Lancet. (2007) 370(9596):1453–7. doi: 10.1016/S0140-6736(07)61602-X
13. Baldetti L, Cosenza M, Galdieri C, Gallone G, Ricchetti G, Gaspardone C, et al. Invasive hemodynamic monitoring in acute heart failure and cardiogenic shock. Rev Cardiovasc Med. (2025) 26(6):27034. doi: 10.31083/RCM27034
14. Mallat J, Lazkani A, Lemyze M, Pepy F, Meddour M, Gasan G, et al. Repeatability of blood gas parameters, PCO2 gap, and PCO2 gap to arterial-to-venous oxygen content difference in critically ill adult patients. Medicine (Baltimore). (2015) 94(3):e415. doi: 10.1097/MD.0000000000000415
15. Cannesson M, Le Manach Y, Hofer CK, Goarin JP, Lehot JJ, Vallet B, et al. Assessing the diagnostic accuracy of pulse pressure variations for the prediction of fluid responsiveness: a “gray zone” approach. Anesthesiology. (2011) 115(2):231–41. doi: 10.1097/ALN.0b013e318225b80a
16. DeLong ER, DeLong DM, Clarke-Pearson DL. Comparing the areas under two or more correlated receiver operating characteristic curves: a nonparametric approach. Biometrics. (1988) 44(3):837–45. doi: 10.2307/2531595
17. Quispe-Cornejo AA, Alves da Cunha AL, Njimi H, Mongkolpun W, ValleMartins AL, Arébalo-López M, et al. Effects of rapid fluid infusion on hemoglobin concentration: a systematic review and meta-analysis. Crit Care. (2022) 26(1):324. doi: 10.1186/s13054-022-04191-x
18. Vincent JL, De Backer D. My paper 20 years later: effects of dobutamine on the VO₂/DO₂ relationship. Intensive Care Med. (2014) 40(11):1643–8. doi: 10.1007/s00134-014-3472-8
19. Velissaris D, Pierrakos C, Scolletta S, De Backer D, Vincent JL. High mixed venous oxygen saturation levels do not exclude fluid responsiveness in critically ill septic patients. Crit Care. (2011) 15(4):R177. doi: 10.1186/cc10326
20. Teboul JL, Scheeren T. Understanding the Haldane effect. Intensive Care Med. (2017) 43(1):91–3. doi: 10.1007/s00134-016-4261-3
21. Mecher CE, Rackow EC, Astiz ME, Weil MH. Venous hypercarbia associated with severe sepsis and systemic hypoperfusion. Crit Care Med. (1990) 18(6):585–9. doi: 10.1097/00003246-199006000-00001
Keywords: central venous oxygen saturation, central venous-to-arterial carbon dioxide tension difference, fluid responsiveness, volume expansion, oxygen consumption, oxygen delivery, mechanical ventilation, hypotension
Citation: Zhou X, Fang H, Xu C, Pan J, Wang H, Pan T, Xu Z and Chen B (2025) Variations in central venous oxygen saturation and central venous-to-arterial carbon dioxide tension difference to define fluid responsiveness: a prospective observational study. Front. Cardiovasc. Med. 12:1628380. doi: 10.3389/fcvm.2025.1628380
Received: 14 May 2025; Accepted: 31 October 2025;
Published: 13 November 2025.
Edited by:
Danica Momcicevic, University Clinical Centre of the Republic of Srpska, Bosnia and HerzegovinaReviewed by:
Sasa Dragic, University Clinical Centre of the Republic of Srpska, Bosnia and HerzegovinaJorge Alvarado, Fundación Santa Fe de Bogotá, Colombia
Copyright: © 2025 Zhou, Fang, Xu, Pan, Wang, Pan, Xu and Chen. This is an open-access article distributed under the terms of the Creative Commons Attribution License (CC BY). The use, distribution or reproduction in other forums is permitted, provided the original author(s) and the copyright owner(s) are credited and that the original publication in this journal is cited, in accordance with accepted academic practice. No use, distribution or reproduction is permitted which does not comply with these terms.
*Correspondence: Tao Pan, cGFudGFvMDkyNEAxNjMuY29t; Zhaojun Xu, bmJleV9pY3VAMTYzLmNvbQ==; Bixin Chen, bmJzZGV5eWljdUAxNjMuY29t
†These authors have contributed equally to this work and share first authorship