Abstract
Background:
This study aimed to create a nomogram to predict a double-zero score for obstructive coronary artery disease (CAD) in a hospital-based cohort initially scoring zero. We compared its diagnostic performance with the Framingham risk score (FRS) and models for atherosclerotic cardiovascular disease (ASCVD).
Methods:
We retrospectively reviewed the clinical features and laboratory profiles of 634 participants with baseline zero coronary artery calcium scores. The target population consisted of individuals with a double-zero score. The primary endpoint was the diagnosis of obstructive CAD, defined as CAD-RADS ≥3 or vulnerable plaque formation on the second cardiac CT. The control group had a double-zero score, with no or less than 50% coronary stenosis. We developed a nomogram using a least absolute shrinkage and selection operation-derived logistic model. We assessed the models’ discrimination and calibration abilities using the Hosmer–Lemeshow test.
Results:
Participants were monitored for an average period of 4.26 ± 2.30 years and were randomly allocated to training and validation sets at a ratio of 2.8:1. The study results indicated that 5.13% (24 of 467) in the training cohort and 4.19% (7 of 167) in the validation cohort developed a double-zero score with obstructive CAD progression. This nomogram incorporated four predictors: “systolic blood pressure,” “hypertension,” “body fat percentage,” and “HbA1c.” The nomogram demonstrated superior diagnostic performance compared to the FRS and ASCVD models, with lower values of Akaike information criterion and Bayesian information criterion values. The nomogram's discriminative ability, measured by the area under the curve, was 0.792 in the training cohort and 0.824 in the validation cohort.
Conclusions:
The validated nomogram provides valuable predictive potential for identifying high-risk subclinical coronary atherosclerosis, thereby supporting personalized primary prevention and education strategies.
1 Introduction
In recent years, coronary computed tomography angiography (CTA) has been widely employed in the diagnostic evaluation of coronary artery disease (CAD) in intermediate-to-high-risk populations. Its use for the subclinical assessment of coronary atherosclerosis in low-to-intermediate-risk populations is also rising (1–5). As per a literature review, a calcium score of zero could serve as a gatekeeper to safely exclude the possibility of CAD in patients with low-to-intermediate risk, who also have a very low risk of cardiovascular events and mortality over a 10-year period (6–11). Recent studies have shown that while the mortality rate is low, nonfatal major adverse cardiovascular events (MACEs) are prevalent in low-to-intermediate-risk populations with zero calcium scores (5, 12, 13). Therefore, individuals with low-to-intermediate risk and zero calcium scores may exhibit early signs of CAD and bear a high risk of subclinical atherosclerosis (14–16).
Therefore, it is crucial to identify subclinical atherosclerosis, such as obstructive CAD or high-risk plaques, in patients with low-to-intermediate risk and double-zero scores during a series of CAC scans. These patients are potential candidates for medical therapy in preventive cardiology.
The effectiveness of the well-known Framingham risk score (FRS) or atherosclerotic cardiovascular disease (ASCVD) model in predicting the outcome of a double-zero score for obstructive CAD in patients with a baseline zero score remains uncertain. In a previous retrospective study, only moderate diagnostic performance of the FRS model was reported for the prediction of a double-zero score with obstructive CAD events (17). No previous studies have explored early preventive models to predict the risk of double-zero scores for obstructive CAD in Asian populations with a baseline zero score. With the widespread use of cardiac CT, certain populations may initially exhibit zero coronary scores in series scans, yet subsequently develop vulnerable soft plaques and obstructive coronary stenosis ≥50%. While existing literature shows that CAC = 0 does not rule out early CAD, the introduction could better emphasize the clinical significance, such as the risk of nonfatal cardiovascular events and missed chances for early preventive interventions.
As a double-zero score can be misinterpreted as low cardiovascular risk, it is crucial to identify this specific population in preventive medicine. Therefore, we aimed to develop and validate a least absolute shrinkage and selection operator (LASSO)-based risk model for predicting a double-zero score in obstructive CAD, with an initial score of zero, in the hospital-based cohort with low-to-intermediate risk. We also compared its discriminatory ability with the well-known FRS and ASCVD scores to determine its clinical utility.
2 Methods
2.1 Study design and population characteristics
A total of 634 consecutive patients from April 2005 to January 2022 were enrolled using the inclusion criteria mentioned in previous studies (17, 18). This study was designed as a retrospective cohort study conducted. Individuals with baseline zero calcium scores who underwent both baseline and follow-up CAC and coronary CT scans were included. At follow-up, participants were classified into two groups: those with obstructive CAD (≥50% stenosis or vulnerable plaque) and those without CAD. Inclusion criteria were individuals who underwent both baseline and follow-up CAC and coronary CT scans, with a baseline score of zero and a double-zero score on follow-up. Patients were categorized by the presence or absence of obstructive CAD (≥50% stenosis) or vulnerable plaques on follow-up scans. Exclusion criteria were those lacking the required scans or presenting non-zero baseline scores. Follow-up duration was not predefined and varied among participants. Repeat cardiac CT scans were performed based on clinical indications and physician judgment, without a standardized interval, reflecting real-world practice patterns in our setting. The prediction task was to develop a model identifying individuals at risk of developing obstructive CAD despite having a double-zero score. The primary endpoint was obstructive CAD, defined as ≥50% stenosis or the presence of vulnerable plaque, detected on the second cardiac CT scan. The time horizon for prediction extended from the baseline scan (with a zero calcium score) to the follow-up scan (double-zero score). All predictors, including demographic characteristics, clinical risk factors, and imaging features, were collected at baseline before the follow-up cardiac CT. As per the Declaration of Helsinki, the study protocol was approved by Kaohsiung Veterans General Hospital (IRB: VGHKS19-CT6–02, KSVGH21-CT7-22). The procedures undertaken in this study were conducted in compliance with institutional guidelines, and all methodologies adhered to the relevant regulations and guidelines. The requirement for patient consent was waived due to the retrospective study design. The primary endpoint of the study was to construct a LASSO-derived model to predict obstructive CAD with ≥50% stenosis with double-zero score events (defined as CAD-RADS ≥3 or vulnerable plaque formation in the second round of the CT exam, as described in our previous study) in the second round of the cardiac CT scan, and to assess its discriminatory power in comparison to other prediction models, such as the FRS and ASCVD score (17, 18). CAD-RADS ≥3 indicates significant coronary artery disease, denoting atherosclerotic plaque resulting in moderate stenosis or more, suggesting increased cardiovascular risks and necessitating precise management and treatment interventions. The control group had a double-zero score, with no coronary stenosis or stenosis <50%. We derived and internally validated the nomogram in 634 patients with a baseline zero score who were randomly assigned to the training (N = 467) and validation (N = 167) datasets at a ratio of 2.8:1. Figure 1 presents a flowchart of the study.
Figure 1
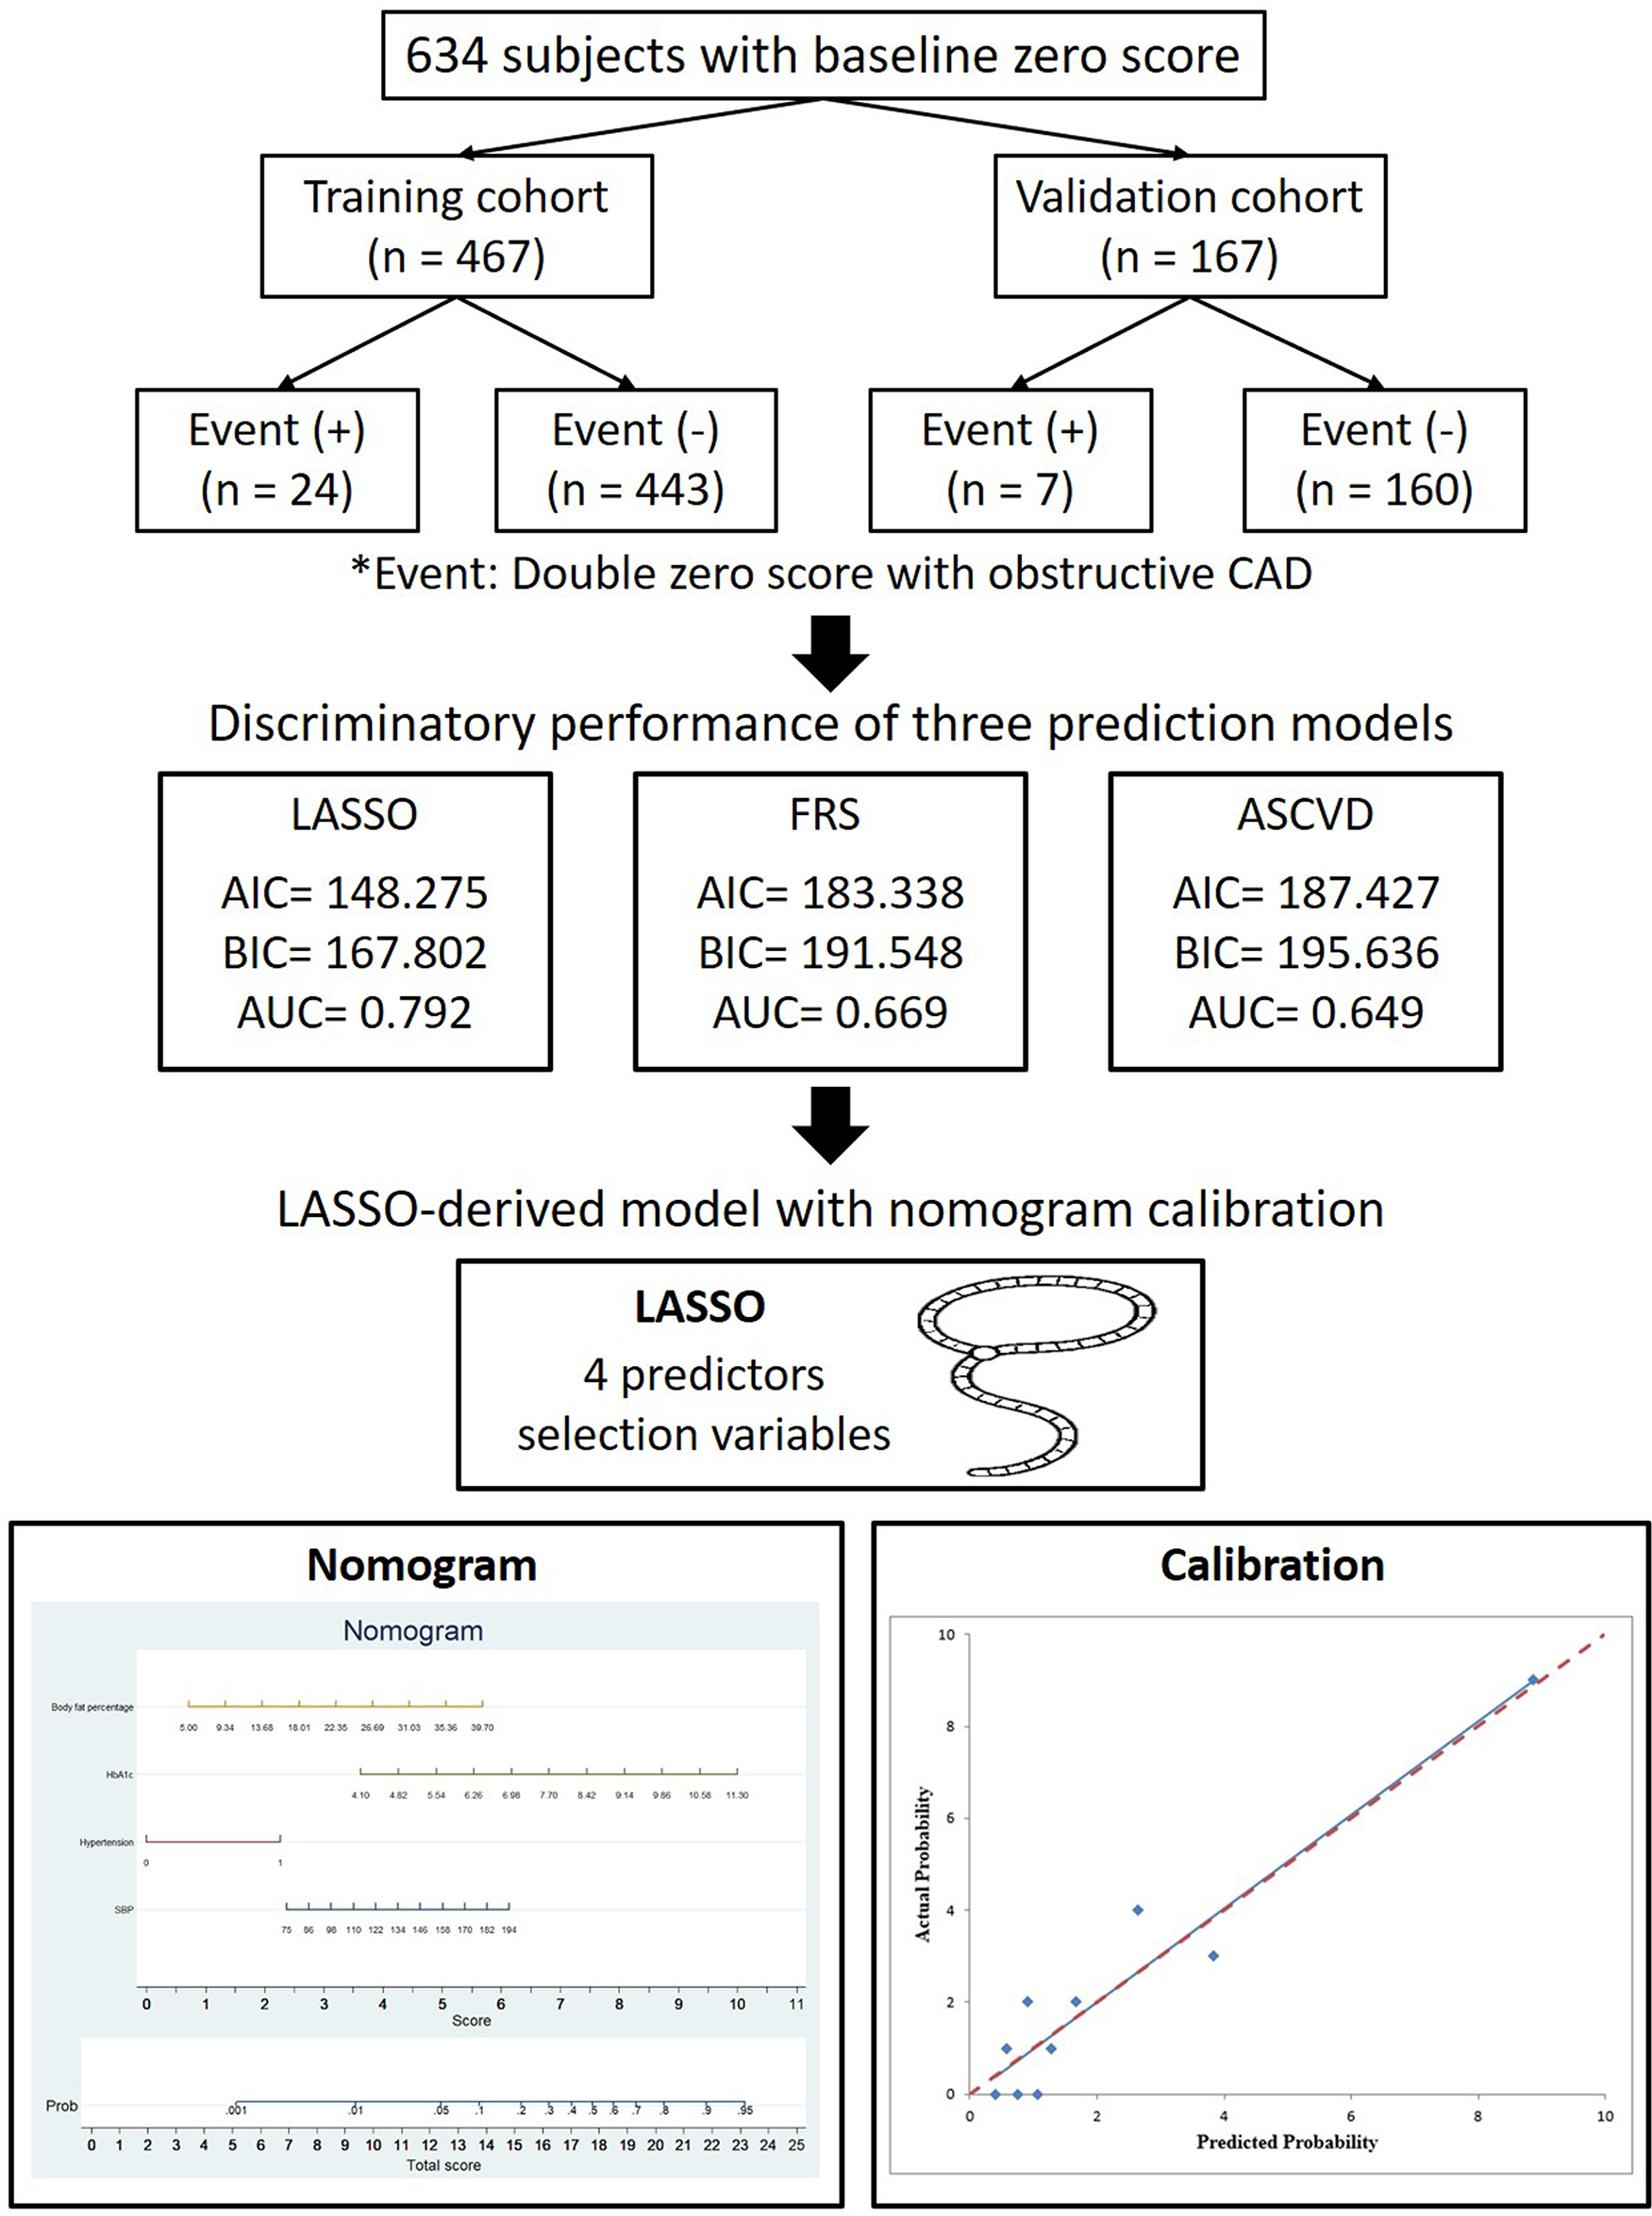
Flowchart depicting the selection process of patients for the training and validation cohorts in this study, focusing on the primary outcome of a double zero score with obstructive CAD.
2.2 Data collection
Clinical and laboratory data were obtained from our hospital's electronic medical records using standardized forms. We included demographic variables such as age, sex, current smoking status, pack-year, hypertension, diabetes mellitus (DM), and follow-up period. Laboratory variables from blood, collected at the same time as the baseline scan, included uric acid, fasting glucose, C-reactive protein (CRP), gamma-glutamyl transferase (GGT), hemoglobin A1c (HbA1c), low-density lipoprotein cholesterol, total cholesterol, high-density lipoprotein cholesterol, and triglyceride levels. Additionally, a physical examination was conducted to collect anthropometric measurements of body mass index, body fat percentage, and waist circumference. Hypertension was defined as a systolic blood pressure (SBP) > 140 mmHg, diastolic blood pressure above 90 mmHg, or the use of hypertension medications.
DM was diagnosed in individuals receiving oral antidiabetic medications or insulin, which aligns with previous studies (17, 18).
2.3 Cardiac CT imaging acquisition and analysis
All patients underwent two consecutive scans employing a 256 × 0.625-mm detector row CT scanner, using either a 64 × 0.5-mm detector row CT vendor system (Aquilion 64; Toshiba Medical Systems) or a 256 × 0.625-mm detector row CT system (Revolution CT, GE Healthcare, Milwaukee, USA), as previously described.
The CT image acquisition protocol consisted of two sequential steps of imaging acquisition. The first step was a non-contrast coronary artery calcium (CAC) scan with the following acquisition settings: a fixed tube voltage of 120-kV and a 3 mm slice thickness reconstruction. The second step was a prospective ECG-triggered cardiac CTA with a fixed tube voltage of 120 kV and tube current modulation (mA modulation). CAC scores were calculated applying the Agatston method along with GE AW analysis software (version 3.2). The classification of coronary artery stenosis/vulnerable plaque characteristics with standardized reporting of individual patients was reported according to the Coronary Artery Disease Reporting and Data System (CAD-RADS™) (19).
2.4 Three prediction models for double-zero scores with obstructive CAD
We used a LASSO-derived regression model to build a new prediction model with an optimal lambda value that reduces the cross-validation error. Candidate predictors included demographics, risk factors, and imaging features; continuous variables retained linearity, missing data imputed, and LASSO used for variable selection. Four features were selected from the clinical and laboratory data in the training dataset: hypertension, SBP, HbA1c, and body fat percentage. We proposed a LASSO-derived model to predict the outcome of a double-zero score with obstructive CAD in patients with a baseline zero score and compared it to two well-known models for CAD risk prediction (FRS and ASCVD). The discriminative ability of the model fitness was tested for each model individually based on c-statistics, Akaike information criterion (AIC), and Bayesian information criterion (BIC) differences. A more discriminative model with better fitting performance was characterized by higher c-statistic values and lower AIC and BIC values, as per the interpretation of the study. The FRS was originally developed to assess an individual's 10-year risk likelihood of developing coronary heart disease. The FRS uses clinical and laboratory information on age, sex, total and HDL cholesterol levels, smoking status, systolic blood pressure, and DM (20).
The ASCVD risk model was originally designed to estimate the 10-year risk of the first fatal cardiovascular outcome in individuals aged 40–65 years. It uses clinical and laboratory information such as age, sex, race, smoking status, diastolic blood pressure, systolic blood pressure, and DM (21). Based on the estimated risk stratification in a 10-year ASCVD risk assessment, individuals are categorized as low-risk if <5%, borderline risk if 5%–7.5%, intermediate risk if 7.5%–20%, and high-risk if ≥20% (22).
2.5 Statistical analysis
Statistical analyses were conducted using Stata version 13.0 (Stata Corp., College Station, TX, USA) and SPSS for Windows (version 22.0; SPSS Inc., Chicago, IL, USA). Sample size was calculated for the primary endpoint assuming a 5% event rate, α = 0.05, 80% power, 10% attrition. The determined sample size was considered adequate to achieve the desired power and significance level given the assumed event rate and attrition. Variables with <5% missing values were analyzed using complete-case analysis, while those with 5%–20% missingness were addressed using multiple imputation. LASSO logistic regression was performed using the LASSOPACK package (including lasso2, cvlasso, and rlasso) in Stata 13.0 (23). The significance levels reported were two-tailed, and statistical significance was defined as p < 0.05. Missing data were handled using multiple imputations to ensure that the analysis included all available information without introducing bias. A fixed random seed was used to ensure reproducibility. Random numbers were generated for each patient using the runiform function, and patients were then allocated into validation (26.3%) and training (73.7%) sets using the split command based on the predefined 1:2.8 ratio. The clinical data of the study participants in the training and validation cohorts were compared using Student's t-test for continuous variables and the chi-square test for categorical variables. The primary goal of this study was to create a prediction nomogram using the LASSO-based methodology with optimal lambda selection, which could predict the risk of a double-zero score with obstructive CAD in participants with a baseline zero score (23). LASSO Logistic Regression was deemed the most appropriate method for balancing predictive accuracy and interpretability. The optimal penalty parameter (lambda) in the LASSO regression was selected using tenfold cross-validation via the lasso select command in Stata. The lambda value corresponding to the minimum cross-validation mean squared error (MSE) was chosen to ensure an optimal balance between model sparsity and predictive accuracy. The study used a multivariate logistic regression model involving multiple predictors to determine the 95% confidence interval (CI) and odds ratio (OR), which were subsequently used to create a nomogram based on the LASSO-derived parameters in the training cohort. Multicollinearity was evaluated using the variance inflation factor (VIF). All VIF values were lower than 10, indicating that multicollinearity is not a concern in this model. We evaluated and compared the discriminatory abilities of the three models using the C-statistic, BIC, and AIC (24). Receiver operating curve (ROC) analysis was conducted to evaluate the performance of the three predictive models. We compared the c-statistics of the three models using the method described by DeLong et al. (25).
The AUC, specificity, sensitivity, negative predictive value (NPV), positive predictive value (PPV), positive likelihood ratio (LR), and negative LR were calculated. The c-statistic ranged from 0.5, indicating no discriminatory ability, to 1.0, indicating complete discriminatory ability. Calibration was assessed using the Hosmer–Lemeshow test and by calibration plotting the predicted double-zero score with obstructive CAD against the actual rates in deciles of predicted risk (26). To assess model performance and ensure parsimony, we calculated the Akaike Information Criterion (AIC) and Bayesian Information Criterion (BIC) for model comparison and selection. Model discrimination was evaluated using the area under the receiver operating characteristic curve (AUC), with 95% confidence intervals derived from bootstrap resampling.
3 Results
In total, 634 eligible participants were included in the analysis and followed up for a mean duration of 4.26 ± 2.30 years. The prevalence of a double-zero score for obstructive CAD events in the study cohort was 5.13%. The participants were randomly allocated to either the training or validation datasets at a ratio of 2.8:1. Figure 1 illustrates that the study included 467 participants with zero baseline scores in the training cohort and 167 participants in the validation cohort. In the training dataset, 24/467 participants (5.13%) developed the events of double-zero score with obstructive CAD during the follow-up time of 4.31 ± 2.31 years, while in the validation dataset, 7/167 participants (4.19%) developed the events of double-zero score with obstructive CAD during the follow-up period of 4.12 ± 2.25 years. The basic clinical characteristics of the training cohort (467 participants, mean age 50.69 ± 8.35, 289/467 or 61.9% male) and the validation cohort (167 participants, mean age 50.68 ± 8.40, 109/167 or 65.3% male) are listed in Table 1. The participants in the training and validation datasets were similar in terms of clinical characteristics, physical examination results, and laboratory profiles.
Table 1
| Variable | Total patient cohort (n = 634) | Training set (n = 467) | Validation set (n = 167) | P-value |
|---|---|---|---|---|
| Age (years) | 50.69 ± 8.36 | 50.69 ± 8.35 | 50.68 ± 8.40 | 0.990 |
| Sex, n (%) | 0.437 | |||
| Male | 398 (62.8%) | 289 (61.9%) | 109 (65.3%) | |
| Female | 236 (37.2%) | 178 (38.1%) | 58 (34.7%) | |
| BMI (kg/m2) | 24.48 ± 3.46 | 24.65 ± 3.48 | 24.01 ± 3.38 | 0.041 |
| SBP (mmHg) | 123.36 ± 16.95 | 123.54 ± 16.89 | 122.85 ± 17.16 | 0.660 |
| DBP (mmHg) | 77.66 ± 10.98 | 77.75 ± 10.92 | 77.42 ± 11.20 | 0.739 |
| Hypertension, n (%) | 171 (27.9%) | 128 (28.4%) | 43 (26.5%) | 0.644 |
| Smoking, n (%) | 193 (32%) | 137 (30.7%) | 56 (35.4%) | 0.274 |
| DM, n (%) | 75 (12.3%) | 58 (12.9%) | 17 (10.6%) | 0.454 |
| Uric acid (mg/dl) | 6.20 ± 1.53 | 6.19 ± 1.51 | 6.21 ± 1.60 | 0.896 |
| GGT (U/L) | 38.10 ± 45.97 | 39.17 ± 51.12 | 35.21 ± 27.54 | 0.413 |
| Fasting glucose (mg/dl) | 100.17 ± 22.99 | 100.47 ± 23.15 | 99.30 ± 22.58 | 0.577 |
| CRP (mg/dl) | 0.19 ± 0.26 | 0.20 ± 0.26 | 0.18 ± 0.24 | 0.446 |
| LDL-C (mg/dl) | 115.21 ± 28.74 | 115.72 ± 28.81 | 113.79 ± 28.58 | 0.460 |
| HDL-C (mg/dl) | 48.00 ± 13.58 | 48.13 ± 13.74 | 47.64 ± 13.17 | 0.694 |
| Cholesterol (mg/dl) | 204.33 ± 37.03 | 205.88 ± 36.97 | 199.99 ± 36.98 | 0.081 |
| Triglycerides (mg/dl) | 149.03 ± 101.91 | 151.08 ± 101.05 | 143.29 ± 104.38 | 0.401 |
| HbA1c (%) | 5.86 ± 0.80 | 5.87 ± 0.84 | 5.82 ± 0.70 | 0.450 |
| Body fat percentage (%) | 24.02 ± 6.02 | 24.27 ± 5.91 | 23.35 ± 6.27 | 0.122 |
| Waist circumference (cm) | 84.90 ± 9.37 | 85.21 ± 9.37 | 84.08 ± 9.37 | 0.227 |
| Follow-up period (year) | 4.26 ± 2.30 | 4.31 ± 2.31 | 4.12 ± 2.25 | 0.377 |
Characteristics of the clinical data in the training and validation sets.
BMI, body mass index; CRP, c-reactive protein; DM, diabetes mellitus; DBP, diastolic blood pressure; GGT, gamma-glutamyl transferase; HbA1c, hemoglobin A1c; HDL-C, high-density lipoprotein cholesterol; LDL-C, low-density lipoprotein cholesterol; SBP, systolic blood pressure.
Missing data: BMI, n = 4 (0.63%); SBP, n = 18 (2.84%); DBP, n = 18 (2.84%); Uric acid, n = 33 (5.21%); GGT, n = 174 (27.44%); Fasting glucose, n = 14 (2.21%); CRP, n = 34 (5.36%); LDL-C, n = 11 (1.74%); HDL-C, n = 11 (1.74%); Cholesterol, n = 11 (1.74%); Triglycerides, n = 11 (1.74%); HbA1c, n = 18 (2.84%); Body fat percentage, n = 120 (18.93%); Waist circumference, n = 126 (19.87%).
3.1 LASSO-derived predictive model for double zero score with obstructive CAD
To select the most important features and reduce dimensionality, we utilized LASSO regression with penalization and conducted a 10-fold cross-validation. We constructed a LASSO-derived prediction model, which selected four variables from the candidate variables in the training dataset for a double-zero score with obstructive CAD prediction in patients with low-to-intermediate risk. The final LASSO model with optimal lambda included four non-zero variables: hypertension, SBP, HbA1c, and body fat percentage. Table 2 summarizes the results obtained from the multivariate logistic regression analysis.
Table 2
| Variable | Coefficient | OR | 95% CI | P-value |
|---|---|---|---|---|
| SBP | 0.033 | 1.034 | 1.010–1.057 | 0.004 |
| Hypertension | 1.526 | 4.601 | 1.959–10.809 | <0.001 |
| HbA1c | 0.604 | 1.83 | 1.335–2.508 | <0.001 |
| Body fat percentage | −0.064 | 0.937 | 0.874–1.005 | 0.072 |
| LASSO-derived model | ||||
| Prediction model | 7.034 | 1,135.098 | 55.119–23,375.57 | <0.001 |
Predicting double zero score in obstructive CAD events via LASSO-based logistic regression model.
CI, confidence interval; HbA1c, hemoglobin A1c; LASSO, least absolute shrinkage and selection operator; OR, odds ratio; SBP, systolic blood pressure.
3.2 Development and validation of LASSO-derived nomogram
We analyzed the probability of a double-zero score for obstructive CAD in the training dataset with a baseline zero score using a multivariable logistic regression model that included four predictors: hypertension, SBP, HbA1c, and body fat percentage. A nomogram was generated to predict the double-zero score for obstructive CAD based on the multivariate logistic regression results shown in Figure 2. The nomogram showed favorable performance in predicting the double-zero score with obstructive CAD event, with an AUC of 0.792 (95% CI, 0.688–0.895) in the training dataset, which could also accurately classify participants into low-risk or high-risk subgroups. By summing the scores determined on the point scale for each selected predictor, we could calculate the estimated individual probability of a double-zero score with obstructive CAD using a straightforward line-drawing method in the training dataset with a baseline zero score. For instance, to provide a clearer explanation of the nomogram model, if a male patient with the selected predictor profile had hypertension (+), SBP = 158 mmHg, HbA1c = 11.30%, and body fat percentage = 35.36%, the probability of obstructive CAD with a double-zero score was estimated to be 93%. The Hosmer–Lemeshow test was applied to assess and validate the goodness-of-fit of the LASSO-derived prediction model/nomogram using the 10-fold cross-validation method. The pooled area under the ROC curve of the nomogram was 0.792 (95% CI: 0.688–0.895) in the training dataset and 0.824 (95% CI: 0.621–1.000) in the validation dataset. The ROC curve demonstrated that the resulting model had a favorable discrimination ability for both the training and validation datasets. The Hosmer–Lemeshow test yielded p-values of 0.732 and 0.966 in the training and validation datasets, respectively, indicating strong calibration performance, as illustrated by the calibration curves in Figures 3, 4.
Figure 2
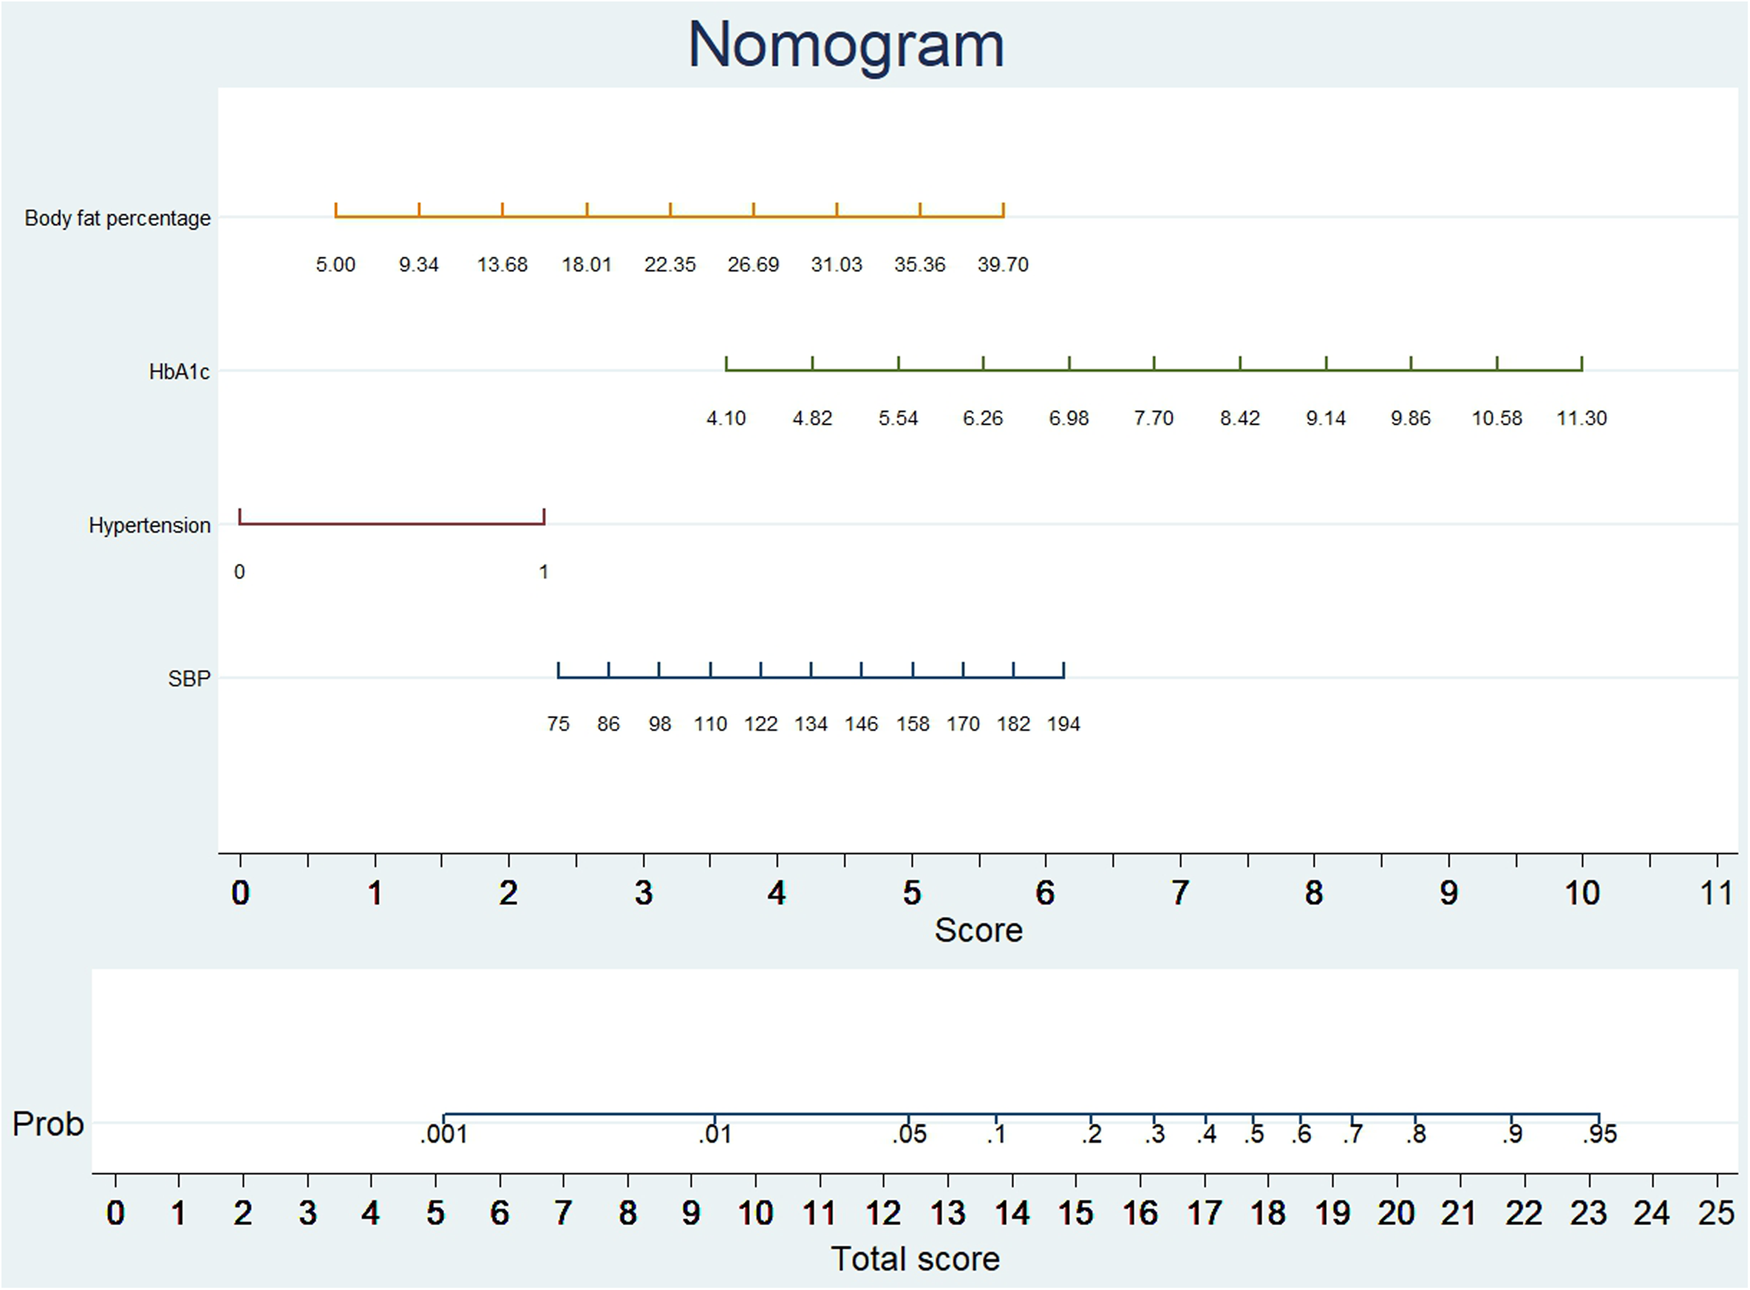
A nomogram was developed to predict obstructive CAD in individuals with a double-zero score. To use the nomogram, locate the value for each variable on its respective axis, and draw a line upwards to determine the corresponding number of points. The total number of points is then positioned on the total points axis to assess the likelihood of the primary outcome of a double-zero score with obstructive CAD.
Figure 3
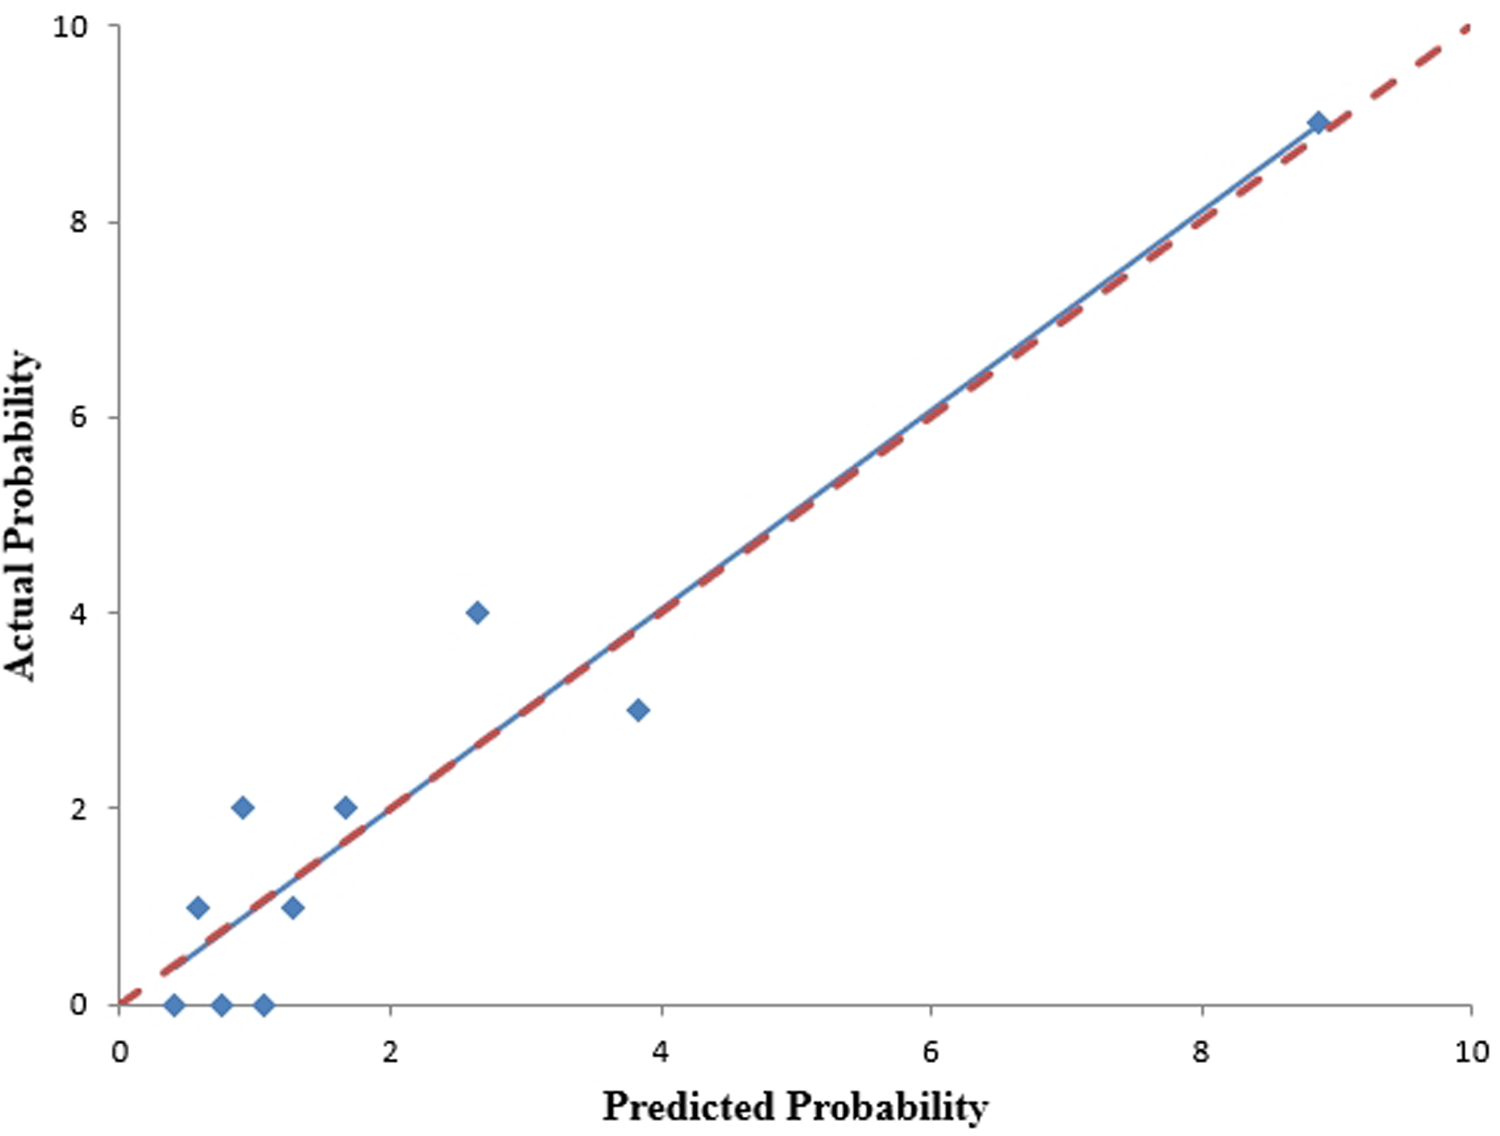
The nomogram's calibration curves, predicting the occurrence of a double-zero score with obstructive CAD, were generated using the training cohort. The Hosmer-Lemeshow test yielded a p-value of 0.732, indicating good calibration.
Figure 4
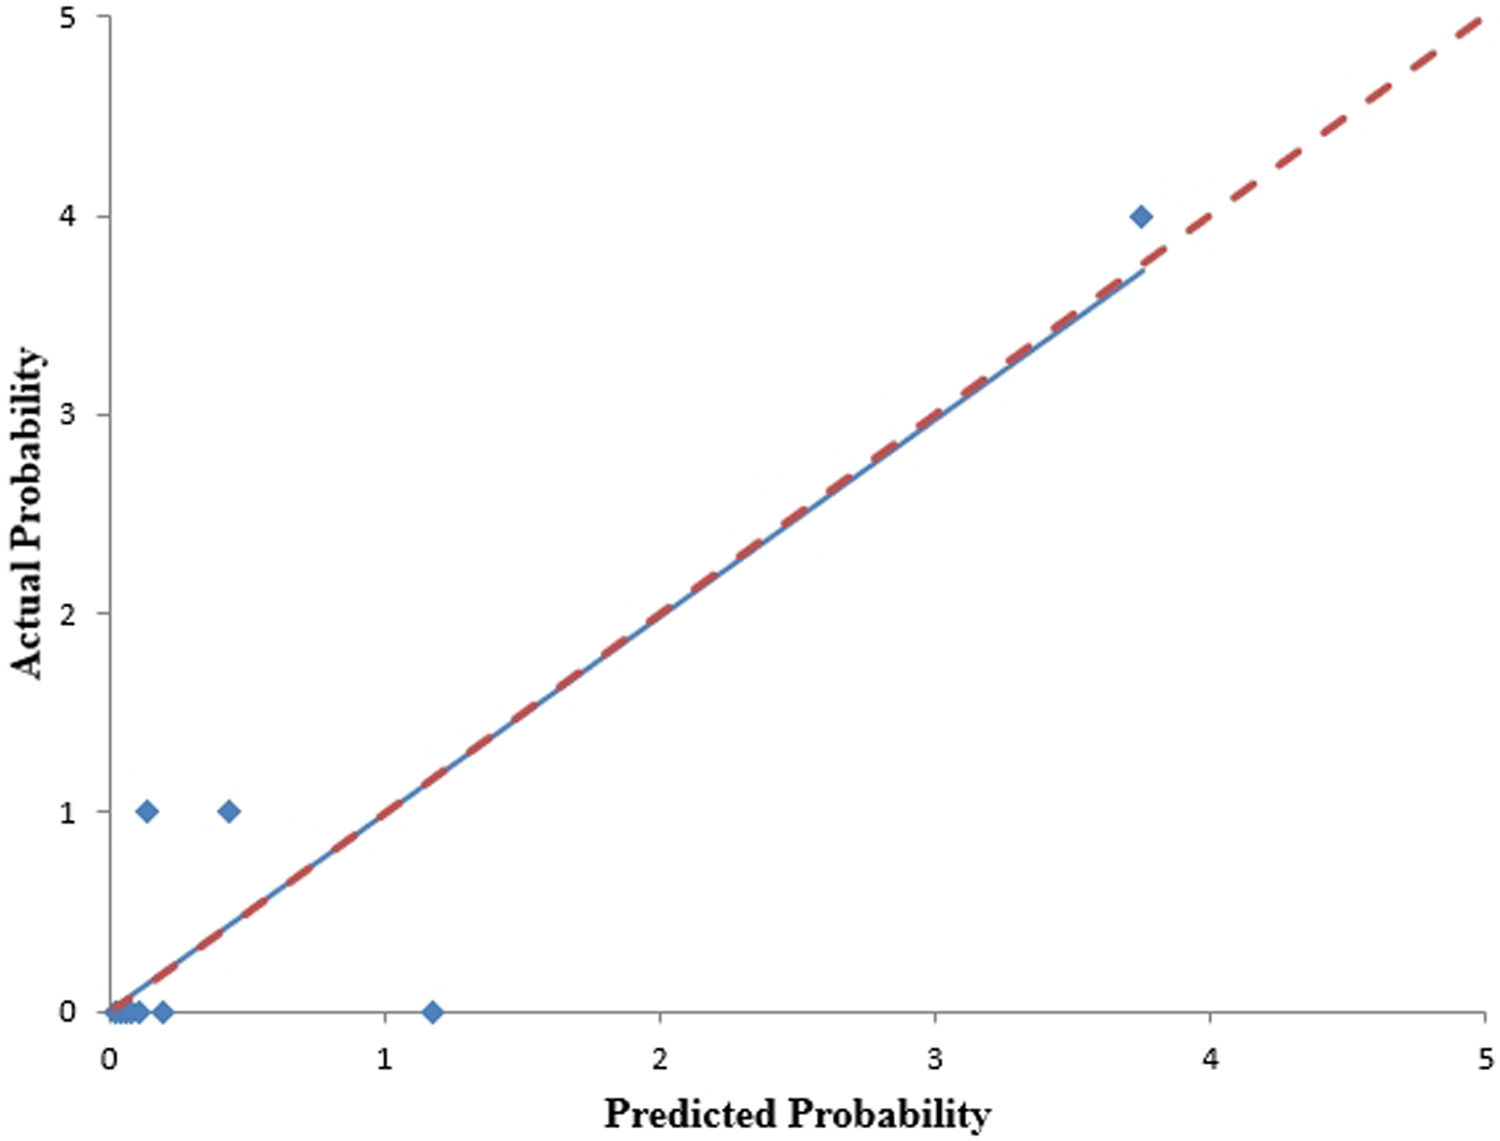
The calibration curves for the nomogram, predicting the occurrence of a double-zero score with obstructive CAD, were generated using the validation cohort. The Hosmer-Lemeshow test yielded a p-value of 0.966, indicating good calibration.
3.3 Comparison of LASSO-derived, FRS, and ASCVD models
We assessed the diagnostic performances of the three predictive models using ROC curve analysis (Table 3). In addition, the comparison and model fitting of the three predictive models are depicted based on the C-statistics, AIC, and BIC model selection criteria in Table 4. The results of our study indicated that the LASSO-based model outperformed the other two predictive models, with significantly higher c-statistics, better discriminatory ability, and lower AIC and BIC values. Compared with the FRS and ASCVD models, the LASSO-derived nomogram model showed significantly superior diagnostic performance with an AUC of 0.792 (95% CI, 0.688–0.895) for the detection of a double-zero score with obstructive CAD in an Asian population with a baseline zero score, with high sensitivity (81.82%) and low specificity (69.28%) (LASSO model vs. FRS model: AUC: 0.792 vs. 0.669, p = 0.030; LASSO model vs. ASCVD model: 0.792 vs. 0.649, p = 0.036).
Table 3
| Models | AIC | BIC | AUC (95% CI) | Cut-point | Sensitivity | 95% CI | Specificity | 95% CI | +LR | 95% CI | −LR | 95% CI | +PV | 95% CI | −PV | 95% CI |
|---|---|---|---|---|---|---|---|---|---|---|---|---|---|---|---|---|
| LASSO model | 148.2756 | 167.8024 | 0.792 (0.688–0.895) | >0.0447 | 81.82 | 59.7–94.8 | 69.28 | 64.1–74.1 | 2.66 | 2.2–3.3 | 0.26 | 0.1–0.6 | 14.5 | 8.8–22.0 | 98.4 | 95.8–99.5 |
| FRS model | 183.3386 | 191.5482 | 0.669 (0.557–0.780) | >16.9 | 54.17 | 32.8–74.4 | 76.18 | 71.8–80.2 | 2.27 | 1.6–3.3 | 0.6 | 0.4–1.0 | 11.4 | 6.2–18.7 | 96.7 | 94.2–98.3 |
| ASCVD model | 187.4271 | 195.6367 | 0.649 (0.532–0.765) | >8 | 54.17 | 32.8–74.4 | 72.88 | 68.4–77.1 | 2 | 1.4–2.9 | 0.63 | 0.4–1.0 | 10.2 | 5.5–16.7 | 96.6 | 93.9–98.3 |
Comparison of prediction performance among the LASSO, FRS, and ASCVD models., n = 467.
AIC, Akaike information criterion; ASCVD, atherosclerotic cardiovascular disease; AUC, area under the ROC curve; BIC, Bayesian information criterion; CI, confidence interval; FRS, Framingham risk score; LASSO, least absolute shrinkage and selection operator; LR, likelihood ratio; PV, predictive value.
Table 4
| Model comparison | Difference between areas | SE | 95% CI | P-value |
|---|---|---|---|---|
| LASSO vs. FRS | 0.104 | 0.057 | 0.008–0.215 | 0.030 |
| LASSO vs. ASCVD | 0.13 | 0.0622 | 0.008–0.252 | 0.036 |
| FRS vs. ASCVD | 0.0267 | 0.0151 | −0.002 to 0.056 | 0.076 |
Comparing the ability to discriminate among three predictive models.
ASCVD, atherosclerotic cardiovascular disease; CI, confidence interval; FRS, Framingham risk score; LASSO, least absolute shrinkage and selection operator; SE, standard error.
In addition, the LASSO-derived model had smaller AIC and BIC than the other FRS and ASCVD models, suggesting superior goodness-of-fit among the three predictive models.
4 Discussion
This study constructed and validated a new prediction model for a double-zero score with obstructive CAD prediction in patients with baseline zero scores, using four easily available clinical variables. The nomogram showed sufficient diagnostic accuracy and discrimination. This retrospective study is the first, to the best of our knowledge, to build a LASSO-derived prediction model to investigate the natural course of the subclinical coronary atherosclerosis burden in an asymptomatic Asian individuals with a baseline CAC score of zero in terms of a double-zero score with obstructive CAD. This study had three main findings. First, we developed a LASSO-derived novel nomogram prediction model based on four easily available predictors (hypertension, SBP, HbA1c, and body fat percentage) to predict double-zero scores with obstructive CAD events. We demonstrated that it provides a favorable diagnostic performance for predicting these events in an Asian cohort. Adopting the LASSO model facilitates the selection of pertinent clinical risk factors, therefore enabling the more efficient establishment of a new model for predicting double-zero scores in obstructive CAD. The effective predictive capabilities of HbA1c and body fat percentage in specific populations with coronary artery stenosis can aid the precise characterization of high-risk features within this specific group. Second, compared with the FRS and ASCVD models, the LASSO-derived model showed significantly better discriminatory ability and lower AIC and BIC. Third, the risk prediction model derived from the LASSO showed good calibration performance in both the training and validation cohorts. Finally, for a double-zero score with obstructive CAD prediction, the LASSO-derived model with an optimum cutoff value of <0.0447 (probability) may help confirm patients at low risk for ruling out these clinical scenarios and discriminate high-risk from low-risk patients in the low-to-intermediate-risk population (sensitivity, 81.82%; specificity, 69.28%).
This LASSO-derived model demonstrates low PPV and high NPV, highlighting its strong ability to rule out obstructive CAD safely and its value in guiding risk stratification among low-to-intermediate-risk patients.
Recent studies have shown a high variation rate of 7%–32% in significant CAD in patients with zero CAC scores (15, 16, 27–29). According to previous studies, a calcium score of zero is associated with a high negative predictive value for obstructive CAD, particularly in low-to-intermediate-risk populations, although its rule-out capability remains limited. However, the prognostic outcome of obstructive CAD in patients with a zero CAC score is relatively good (7–10, 14–16).
Previous studies have reported a good prognosis with a very low cardiac event rate (<1%) in an asymptomatic population with a zero score (6, 10, 30, 31). However, it is important to note that low-to-intermediate risk symptomatic/asymptomatic patients with a zero score may have early signs of CAD or vulnerable soft plaque formation. This carries a high risk of subclinical atherosclerosis and should not be “downgraded” and stratified as patients with true zero or double-zero scores without subclinical coronary atherosclerosis (5, 17, 32). To highlight the increased cardiovascular risk associated with CAD-RADS 3 with a double-zero score, vigilant monitoring and tailored management strategies are required to mitigate disease progression and potential adverse events. Therefore, developing an accurate prediction model to identify high-risk patients with double-zero scores and obstructive CAD is important.
For double-zero scores with obstructive CAD prediction, the LASSO-derived model with an optimal cutoff value of <0.0447 (probability score) may be an ideal screening tool, offering a high negative predictive value (NPV = 98.4%) to help rule out these clinical scenarios in the middle-aged Asian population with low to intermediate risk (sensitivity, 81.82%; specificity, 69.28%). Therefore, our proposed LASSO-derived model/nomogram may help confirm patients at low risk of double-zero scores with obstructive coronary artery atherosclerosis to enhance cardiovascular risk stratification and reclassification. The nomogram can guide clinical decision-making by identifying patients at higher risk, informing the need for additional imaging, preventive interventions, or lifestyle modifications, and supporting shared decision-making between clinicians and patients, thereby enhancing personalized risk stratification and management in preventive subclinical period. Our previous study showed that the FRS model has a poor to fair discrimination performance for individuals with a double-zero score for obstructive CAD (17). In this study, the LASSO-derived model demonstrated significantly superior performance, with an AUC of 0.792 (95% CI, 0.688–0.895) for the detection of subclinical atherosclerosis progression in terms of obstructive CAD, with a double-zero score in the Asian population, compared with the FRS and ASCVD models. The findings of this study are consistent with those of previous studies regarding the relatively low rate of early CAD findings demonstrated on cardiac CTA in populations with zero or double-zero scores (7, 9, 31). In addition, our LASSO-derived model was feasible for predicting obstructive CAD with double-zero score events and had high sensitivity to rule out this clinical scenario in the study cohort. Therefore, early identification of high-risk subgroups and detection of coronary atherosclerosis progression in its subclinical stage using cardiac CT could affect the prevention of cardiovascular events at an early stage and guide ASCVD primary prevention and management through health promotion/education strategies such as lifestyle changes, diet control, exercise plans, or medication adherence (33–35). In addition, a shared decision-making plan using this novel risk stratification nomogram for subclinical atherosclerosis prevention could guide personalized medicine management toward holistic medicine.
5 Limitations
Our study has some limitations. First, this retrospective study was based in one hospital with a self-referral Asian population at low to intermediate risk. Although this study also demonstrated a low rate of early CAD signs in a population with a double-zero score, the findings showed that conventional cardiovascular models, such as the FRS or ASCVD models, could not correctly predict and identify high-risk candidates with a double-zero score. Moreover, the generalizability of the prediction model results to Western populations is limited because this study was conducted in an Asian cohort. The model was internally validated only. Future work should include external validation in diverse, unselected populations to confirm generalizability and enhance real-world clinical applicability. Second, we did not investigate cardiovascular events or mortality in the primary endpoint analysis. However, our study design primarily aimed to identify high-risk candidates for subclinical atherosclerosis based on a double-zero score for obstructive CAD. This LASSO-derived model is a useful screening tool for excluding mostly low-risk patients with a double-zero score, and further, cardiac CTA is warranted for high-risk candidates to confirm the diagnosis. Third, we investigated a distinct type of subclinical coronary atherosclerosis associated with high-risk soft plaques and obstructive CAD. Therefore, this study did not investigate other types of subclinical atherosclerosis, such as mixed or calcified plaques. The study population was highly selected, including only individuals undergoing serial CAC and CTA scans. This introduces a selection bias and limits the generalizability of the findings. Further studies are needed to elucidate other forms of subclinical atherosclerosis that may help prevent specific plaque progression. Specifically, we recognize the need for further research to integrate the model's predictions with tailored intervention strategies, including optimizing medication selection and dosage adjustments for high-risk patients, as well as refining follow-up schedules for low-risk patients. Future studies should incorporate intervention trials to evaluate the effectiveness of these strategies and provide more actionable recommendations for clinical practice. Third, future studies should incorporate cross-validation and larger datasets to improve model reliability, minimize bias, and ensure robust generalizability across diverse populations, mitigating small sample size limitations. Forth, a high false positive rate (30.72%) may raise concerns, but since this study aims to identify subclinical high-risk groups without leading to harmful interventions, its impact on practical application is minimal. The focus remains on risk stratification rather than immediate treatment.
6 Conclusion
To summarize, a prediction model based on four simple clinical parameters was successfully developed and validated using LASSO, conveniently including “hypertension,” “SBP,” “HbA1c,” and “body fat percentage,” and demonstrated that it provides a favorable level of performance for predicting double-zero score with obstructive CAD in patients with a baseline zero score. This nomogram could assist clinicians in identifying high-risk subclinical coronary atherosclerosis subtypes in low-to-intermediate-risk populations and provide a valuable tool for personalized primary prevention in preventive cardiology.
Statements
Data availability statement
The raw data supporting the conclusions of this article will be made available by the authors, without undue reservation.
Ethics statement
The studies involving humans were approved by Kaohsiung Veterans General Hospital. The studies were conducted in accordance with the local legislation and institutional requirements. The participants provided their written informed consent to participate in this study.
Author contributions
C-HL: Software, Writing – review & editing. Y-CH: Data curation, Formal analysis, Writing – review & editing. H-HC: Data curation, Writing – review & editing, Formal analysis. Y-JW: Visualization, Writing – review & editing, Formal analysis. S-CY: Writing – review & editing, Supervision. W-HW: Writing – review & editing, Resources. F-ZW: Conceptualization, Writing – original draft, Funding acquisition, Resources, Writing – review & editing, Formal analysis, Supervision, Data curation.
Funding
The author(s) declare that financial support was received for the research and/or publication of this article. This study was supported by grants from Kaohsiung Veterans General Hospital, KSVGH 114-062; KSVGH-114-D03-1, Taiwan, R.O.C, NSTC113-2314-B-075B-005, National Science and Technology Council, NSTC114-2314-B-075B-002-.
Conflict of interest
The authors declare that the research was conducted in the absence of any commercial or financial relationships that could be construed as a potential conflict of interest.
Generative AI statement
The author(s) declare that no Generative AI was used in the creation of this manuscript.
Any alternative text (alt text) provided alongside figures in this article has been generated by Frontiers with the support of artificial intelligence and reasonable efforts have been made to ensure accuracy, including review by the authors wherever possible. If you identify any issues, please contact us.
Publisher’s note
All claims expressed in this article are solely those of the authors and do not necessarily represent those of their affiliated organizations, or those of the publisher, the editors and the reviewers. Any product that may be evaluated in this article, or claim that may be made by its manufacturer, is not guaranteed or endorsed by the publisher.
Supplementary material
The Supplementary Material for this article can be found online at: https://www.frontiersin.org/articles/10.3389/fcvm.2025.1628622/full#supplementary-material
Abbreviations
CTA, coronary computed tomography angiography; CAD, coronary artery disease; MACE, major adverse cardiovascular event; FRS, Framingham risk; ASCVD, atherosclerotic cardiovascular disease; GGT, Gamma-Glutamyl Transferase; HbA1c, Hemoglobin A1; CRP, C-reactive protein; LDL-C, low-density lipoprotein cholesterol; HDL-C, high-density lipoprotein cholesterol; BMI, body mass index; SBP, systolic blood pressure; DBP, diastolic blood pressure; DM, diabetes mellitus; CAD-RADS™, Coronary Artery Disease Reporting and Data System; OR, odds ratio; BIC, Bayesian information criterion; AIC, Akaike information criterion; ROC, receiver operating curve; AUC, area under the curve; LASSO, least absolute shrinkage and selection operator; PPV, positive predictive value; NPV, negative predictive value; LR, likelihood ratio.
References
1.
Gaemperli O Valenta I Schepis T Husmann L Scheffel H Desbiolles L et al Coronary 64-slice CT angiography predicts outcome in patients with known or suspected coronary artery disease. Eur Radiol. (2008) 18(6):1162–73. 10.1007/s00330-008-0871-7
2.
Hadamitzky M Distler R Meyer T Hein F Kastrati A Martinoff S et al Prognostic value of coronary computed tomographic angiography in comparison with calcium scoring and clinical risk scores. Circ Cardiovasc Imaging. (2011) 4(1):16–23. 10.1161/CIRCIMAGING.110.955351
3.
Ostrom MP Gopal A Ahmadi N Nasir K Yang E Kakadiaris I et al Mortality incidence and the severity of coronary atherosclerosis assessed by computed tomography angiography. J Am Coll Cardiol. (2008) 52(16):1335–43. 10.1016/j.jacc.2008.07.027
4.
Pundziute G Schuijf JD Jukema JW Boersma E de Roos A van der Wall EE et al Prognostic value of multislice computed tomography coronary angiography in patients with known or suspected coronary artery disease. J Am Coll Cardiol. (2007) 49(1):62–70. 10.1016/j.jacc.2006.07.070
5.
Senoner T Plank F Beyer C Langer C Birkl K Steinkohl F et al Does coronary calcium score zero reliably rule out coronary artery disease in low-to-intermediate risk patients? A coronary CTA study. J Cardiovasc Comput Tomogr. (2020) 14(2):155–61. 10.1016/j.jcct.2019.09.009
6.
Blaha MJ Cainzos-Achirica M Greenland P McEvoy JW Blankstein R Budoff MJ et al Role of coronary artery calcium score of zero and other negative risk markers for cardiovascular disease: the multi-ethnic study of atherosclerosis (MESA). Circulation. (2016) 133(9):849–58. 10.1161/CIRCULATIONAHA.115.018524
7.
Kim YJ Hur J Lee H-J Chang H-J Nam JE Hong YJ et al Meaning of zero coronary calcium score in symptomatic patients referred for coronary computed tomographic angiography. Eur Heart J Cardiovasc Imaging. (2012) 13(9):776–85. 10.1093/ehjci/jes060
8.
Mittal TK Pottle A Nicol E Barbir M Ariff B Mirsadraee S et al Prevalence of obstructive coronary artery disease and prognosis in patients with stable symptoms and a zero-coronary calcium score. Eur Heart J Cardiovasc Imaging. (2017) 18(8):922–9. 10.1093/ehjci/jex037
9.
Villines TC Hulten EA Shaw LJ Goyal M Dunning A Achenbach S et al Prevalence and severity of coronary artery disease and adverse events among symptomatic patients with coronary artery calcification scores of zero undergoing coronary computed tomography angiography: results from the CONFIRM (coronary CT angiography evaluation for clinical outcomes: an international multicenter) registry. J Am Coll Cardiol. (2011) 58(24):2533–40. 10.1016/j.jacc.2011.10.851
10.
Sarwar A Shaw LJ Shapiro MD Blankstein R Hoffman U Cury RC et al Diagnostic and prognostic value of absence of coronary artery calcification. JACC Cardiovasc Imaging. (2009) 2(6):675–88. 10.1016/j.jcmg.2008.12.031
11.
Yang S-C Wu Y-J Wang W-H Wu F-Z . Gender differences in subclinical coronary atherosclerosis in the Asian population with a coronary artery calcium score of zero. Am J Cardiol. (2023) 203:29–36. 10.1016/j.amjcard.2023.06.074
12.
Gabriel FS Gonçalves LFG Melo EVd Sousa ACS Pinto IMF Santana SMM et al Atherosclerotic plaque in patients with zero calcium score at coronary computed tomography angiography. Arq Bras Cardiol. (2018) 110(5):420–7. 10.5935/abc.20180063
13.
German CA Nicolazzi Do JT Gjini Bs P Mehta V Stacey RB . Obstructive coronary artery disease with a coronary artery calcium score of 0: a case report. Echocardiography. (2020) 37(6):976–8. 10.1111/echo.14745
14.
Truong Q Kallianos K Cannon C . Coronary artery disease. Calcium score of zero: not a gatekeeper to rule out coronary artery disease. Rev Cardiovasc Med. (2010) 11:271–3. 10.3909/ricm0568
15.
Rubinshtein R Gaspar T Halon DA Goldstein J Peled N Lewis BS . Prevalence and extent of obstructive coronary artery disease in patients with zero or low calcium score undergoing 64-slice cardiac multidetector computed tomography for evaluation of a chest pain syndrome. Am J Cardiol. (2007) 99(4):472–5. 10.1016/j.amjcard.2006.08.060
16.
Gottlieb I Miller JM Arbab-Zadeh A Dewey M Clouse ME Sara L et al The absence of coronary calcification does not exclude obstructive coronary artery disease or the need for revascularization in patients referred for conventional coronary angiography. J Am Coll Cardiol. (2010) 55(7):627–34. 10.1016/j.jacc.2009.07.072
17.
Shen Y-W Wu Y-J Hung Y-C Hsiao C-C Chan S-H Mar G-Y et al Natural course of coronary artery calcium progression in Asian population with an initial score of zero. BMC Cardiovasc Disord. (2020) 20(1):212. 10.1186/s12872-020-01498-x
18.
Wu Y-J Mar G-Y Wu M-T Wu F-Z . A LASSO-derived risk model for subclinical CAC progression in Asian population with an initial score of zero. Front Cardiovasc Med. (2021) 7(385):619798; 1–10. 10.3389/fcvm.2020.619798
19.
Cury RC Abbara S Achenbach S Agatston A Berman DS Budoff MJ et al CAD-RADS(TM) coronary artery disease - reporting and data system. An expert consensus document of the Society Of Cardiovascular Computed Tomography (SCCT), the American College of Radiology (ACR) and the North American Society for Cardiovascular Imaging (NASCI). Endorsed by the American College of Cardiology. J Cardiovasc Comput Tomogr. (2016) 10(4):269–81. 10.1016/j.jcct.2016.04.005
20.
D’Agostino RB Vasan RS Pencina MJ Wolf PA Cobain M Massaro JM et al General cardiovascular risk profile for use in primary care. Circulation. (2008) 117(6):743–53. 10.1161/CIRCULATIONAHA.107.699579
21.
Gluckman TJ Kovacs RJ Stone NJ Damalas D Mullen JB Oetgen WJ . The ASCVD risk estimator app: from concept to the current state. J Am Coll Cardiol. (2016) 67(3):350–2. 10.1016/j.jacc.2015.10.068
22.
Goff DC Lloyd-Jones DM Bennett G Coady S D’Agostino RB Gibbons R et al 2013 ACC/AHA guideline on the assessment of cardiovascular risk. Circulation. (2014) 129(25_suppl_2):S49–73. 10.1161/01.cir.0000437741.48606.98
23.
Tibshirani R . Regression shrinkage and selection via the LASSO. J R Stat Soc B (Methodol). (1996) 58:267–88. 10.1111/j.2517-6161.1996.tb02080.x
24.
Molodianovitch K Faraggi D Reiser B . Comparing the areas under two correlated ROC curves: parametric and non-parametric approaches. Biom J. (2006) 48:745–57. 10.1002/bimj.200610223
25.
DeLong ER DeLong DM Clarke-Pearson DL . Comparing the areas under two or more correlated receiver operating characteristic curves: a nonparametric approach. Biometrics. (1988) 44:837–45. 10.2307/2531595
26.
Lemeshow S Hosmer DW Jr . A review of goodness of fit statistics for use in the development of logistic regression models1. Am J Epidemiol. (1982) 115:92–106. 10.1093/oxfordjournals.aje.a113284
27.
Haberl R Tittus J Böhme E Czernik A Richartz BM Buck J et al Multislice spiral computed tomographic angiography of coronary arteries in patients with suspected coronary artery disease: an effective filter before catheter angiography? Am Heart J. (2005) 149:1112–9. 10.1016/j.ahj.2005.02.048
28.
Cademartiri F Maffei E Palumbo A Martini C Seitun S Tedeschi C et al Diagnostic accuracy of computed tomography coronary angiography in patients with a zero calcium score. Eur Radiol. (2010) 20:81–7. 10.1007/s00330-009-1529-9
29.
Akram K O’Donnell RE King S Superko HR Agatston A Voros S . Influence of symptomatic status on the prevalence of obstructive coronary artery disease in patients with zero calcium score. Atherosclerosis. (2009) 203:533–7. 10.1016/j.atherosclerosis.2008.07.008
30.
Budoff MJ McClelland RL Nasir K Greenland P Kronmal RA Kondos GT et al Cardiovascular events with absent or minimal coronary calcification: the multi-ethnic study of atherosclerosis (MESA). Am Heart J. (2009) 158:554–61. 10.1016/j.ahj.2009.08.007
31.
Wang X Le EPV Rajani NK Hudson-Peacock NJ Pavey H Tarkin JM et al A zero coronary artery calcium score in patients with stable chest pain is associated with a good prognosis, despite risk of non-calcified plaques. Open Heart. (2019) 6:e000945. 10.1136/openhrt-2018-000945
32.
Alshahrani AM Mahmood H Wells GA Hossain A Rybicki FJ Achenbach S et al Point of care clinical risk score to improve the negative diagnostic utility of an Agatston score of zero. Circ Cardiovasc Imaging. (2019) 12:e008737. 10.1161/CIRCIMAGING.118.008737
33.
Gatto L Prati F . Subclinical atherosclerosis: how and when to treat it?Eur Heart J Suppl. (2020) 22:E87–90. 10.1093/eurheartj/suaa068
34.
Shah PK . Screening asymptomatic subjects for subclinical atherosclerosis: can we, does it matter, and should we?J Am Coll Cardiol. (2010) 56:98–105. 10.1016/j.jacc.2009.09.081
35.
Mitchell JD Fergestrom N Gage BF Paisley R Moon P Novak E et al Impact of statins on cardiovascular outcomes following coronary artery calcium scoring. J Am Coll Cardiol. (2018) 72:3233–42. 10.1016/j.jacc.2018.09.051
Summary
Keywords
zero score, LASSO, coronary CTangiography, obstructive CAD, plaque
Citation
Liang C-H, Hung Y-C, Chen H-H, Wu Y-J, Yang S-C, Wang W-H and Wu F-Z (2025) A LASSO-based predictive nomogram for obstructive coronary artery disease in double zero score patients: validation and cardiovascular education strategies. Front. Cardiovasc. Med. 12:1628622. doi: 10.3389/fcvm.2025.1628622
Received
14 May 2025
Accepted
22 September 2025
Published
15 October 2025
Volume
12 - 2025
Edited by
Nikos Stalikas, Cardiovascular Center, Belgium
Reviewed by
Pakpoom Wongyikul, Chiang Mai University, Thailand
Juan Costabel, Instituto Cardiovascular de Buenos Aires, Argentina
Updates
Copyright
© 2025 Liang, Hung, Chen, Wu, Yang, Wang and Wu.
This is an open-access article distributed under the terms of the Creative Commons Attribution License (CC BY). The use, distribution or reproduction in other forums is permitted, provided the original author(s) and the copyright owner(s) are credited and that the original publication in this journal is cited, in accordance with accepted academic practice. No use, distribution or reproduction is permitted which does not comply with these terms.
* Correspondence: Fu-Zong Wu cmvwu1029@gmail.com
†These authors have contributed equally to this work and share first authorship
ORCID Fu-Zong Wu orcid.org/0000-0003-2556-6118
Disclaimer
All claims expressed in this article are solely those of the authors and do not necessarily represent those of their affiliated organizations, or those of the publisher, the editors and the reviewers. Any product that may be evaluated in this article or claim that may be made by its manufacturer is not guaranteed or endorsed by the publisher.