Abstract
Background:
Identifying and understanding different dyslipidemia patterns is crucial for maintaining the cardiovascular health of older adults. Therefore, this study aimed to investigate the dyslipidemia profiles of the elderly population from communities in an Eastern Chinese province, focusing on dyslipidemia subtypes and patterns, and exploring the associated demographic and health-related factors.
Methods:
A cross-sectional survey was conducted in communities in an Eastern Chinese province. Dyslipidemia patterns were defined using 4-digit binary codes for abnormal TC, TG, LDL-C, and HDL-C. Correspondence analysis explored subtype-pattern associations to reveal common combinations. Binary and multinomial logistic regressions, with Bonferroni correction, examined relationships between factors and dyslipidemia patterns.
Results:
Among 44,304 participants (31.5% dyslipidemia), correspondence analysis delineated patterns across Hyper_TC, Hyper_TG, Hyper_LDL, and Hypo_HDL subtypes, including Hyper_TC/LDL co-occurrence and Hyper_TG/Hypo_HDL independence, varying by gender. Multifactorial analyses revealed gender-based effects of age, education, income, and lifestyle, but consistent risks from comorbidities and urban-rural factors. Dyslipidemia subtype patterns and risk factor associations are thus gender- and pattern-specific.
Conclusion:
This study provided an in-depth analysis of dyslipidemia subtype patterns among community-dwelling elderly in Eastern China. The findings emphasized that considering gender- and pattern-specific risk factors is crucial in the prevention and management of dyslipidemia among older adults.
Introduction
Dyslipidemia, involving abnormal levels of total cholesterol (TC), triglycerides (TG), low-density lipoprotein cholesterol (LDL-C), or high-density lipoprotein cholesterol (HDL-C), is a major global health issue linked to cardiovascular disease and other adverse outcomes like type 2 diabetes and non-alcoholic fatty liver disease (1–4). Multiple lipid abnormalities often coexist, amplifying health risks (5, 6).
Community-dwelling elderly individuals are particularly vulnerable due to age-related metabolic changes, comorbidities, and socioeconomic factors, especially in regions like China (4, 7–9). In contrast to older patients in hospitals who are often treated for sudden conditions, this community-based population could be in earlier stages of chronic disease management, offering a crucial window for timely treatments to control dyslipidemia and reduce heart risks, possibly leading to different patterns of lipid profiles (10, 11). Therefore, in-depth, pattern-based studies in this group of elderly people living in the community are important for creating specific management.
However, traditional dyslipidemia research focusing on single lipid subtypes (e.g., high TC or low HDL-C) overlooks the complexity of combined lipid abnormalities (12–14). While these subtype-specific studies have certainly contributed to our comprehension of single lipid abnormalities and their corresponding risk factors, they simultaneously possess limitations when considering combinations of lipid problems (13). Furthermore, the influence of risk factors like socioeconomic status (SES), lifestyle (smoking, alcohol), and gender often yields conflicting results in observational studies (15–18). There are differences in risk profiles of dyslipidemia between males and females (19, 20). The roles of smoking and alcohol are also complicated and not agreed upon (18, 21). These conflicting findings point to the requirement for more detailed approaches. Understanding which risk factors are linked to specific dyslipidemia patterns is crucial to developing more targeted ways to prevent and manage dyslipidemia.
To address these gaps, a pattern-based approach considering combinations of dyslipidemia subtypes is needed. This study utilizes correspondence analysis and multinomial logistic regression (22, 23) to analyze data from community-dwelling elderly (65–75 years) in Eastern China. Our aims are to: (1) identify prevalent dyslipidemia patterns; (2) determine demographic, socioeconomic, lifestyle, and health factors associated with these patterns; and (3) explore gender-specific differences. This pattern-focused analysis seeks to inform targeted dyslipidemia management strategies for this population.
Methods
Population and data collection
This study used data from the China PEACE-MPP (China Patient-centered Evaluative Assessment of Cardiac Events Million Persons Project), a large-scale cardiovascular disease screening program (2016–2023) (17, 24). Community-dwelling residents aged 35–75 years residing in project areas for ≥6 months were recruited via community mobilization. Written informed consent was obtained, and the Fuwai Hospital Ethics Committee approved the protocol. Data included face-to-face interviews using a standardized questionnaire (demographics, lifestyle, medical history), anthropometrics (height, weight for Body Mass Index calculation), and fasting finger-prick blood lipid measurements (TC, TG, LDL-C, HDL-C) using the CardioChek analyzer (a widely used and reliable analyser in epidemiological investigations) (25). This analysis includes 44,304 elderly individuals (65–75 years) from Jiangsu Province communities who completed examinations and interviews.
Dyslipidemia subtypes and patterns
Subtypes of dyslipidemia
Dyslipidemia subtypes followed Chinese Guidelines (2023) (
4):
Hyper_TC: TC levels ≥6.2 mmol/L.
Hyper_TG: TG levels ≥2.3 mmol/L.
Hyper_LDL: LDL-C levels ≥4.1 mmol/L.
Hypo_HDL: HDL-C levels <1.0 mmol/L.
Participants with ≥1 abnormality were considered dyslipidemic.
Patterns of dyslipidemia
Represented combinations of these abnormalities using a 4-digit binary code (TC, TG, LDL-C, HDL-C order; 1 = abnormal, 0 = normal). E.g., “1 0 0 1” indicates high TC and low HDL-C. Patterns were classified as Simple (1 abnormality), Mixed (2 abnormalities), or Complex (≥3 abnormalities).
Characteristic variables
Demographics
Age (continuous), gender, residence (rural/urban), marital status (unmarried/married), annual family income (<50 k/≥50 k yuan), insurance (uninsured/insured), education (primary/below, junior high, senior high, college/above).
Health-related factors
BMI (body mass index) was categorized: Underweight/Normal weight (≤23.9 kg/m2), Overweight (24.0–27.9 kg/m2), and Obesity (≥28.0 kg/m2); Smoking status was categorized as never, <3 cigarettes/week, and ≥3 cigarettes/week. Alcohol consumption was classified into four groups: ≤1 time/month, 2–4 times/month, 2–3 times/week, and ≥4 times/week. Comorbidity number was defined as the total number of coexisting chronic diseases. Participants were asked if they had a diagnosis of any of these chronic conditions: hypertension, diabetes, angina pectoris, myocardial infarction, stroke, chronic obstructive pulmonary disease, kidney or ureteral stones, and cancer.
Statistical analysis
Analyses used R 4.3.2. Descriptive statistics summarized participant characteristics by dyslipidemia subtype [mean ± SD or median [IQR] for continuous; n (%) for categorical; Chi-square tests for group differences]. To address missing data, multiple imputation by chained equations (MICE) was utilized. Correspondence analysis (CA) explored associations between dyslipidemia subtypes and patterns (22). Binary logistic regression assessed factors associated with overall dyslipidemia (any abnormality). Multinomial logistic regression (MLR) identified factors associated with specific dyslipidemia patterns (reference: no dyslipidemia) (23). Odds ratios (ORs) with 95% Confidence Intervals (CIs) were calculated. MLR P-values were Bonferroni-adjusted. Forest plots visualized associations (protective green, risk red). Results for patterns with n < 100 (“Other patterns”) are in Supplementary Figure and considered exploratory. Gender-stratified subgroup analyses were performed for CA and logistic regressions.
Odds ratios (ORs) and their corresponding 95% confidence intervals (CIs) were calculated to quantify the associations between variables and both overall dyslipidemia and the specific dyslipidemia patterns. To control for the family-wise Type I error rate arising from multiple comparisons, P-values generated from the MLR were adjusted using the Bonferroni correction method. Forest plots were generated for all patterns to visually represent these associations, clearly indicating protective factors in green and risk factors in red. Results for less prevalent patterns (n < 100), which were grouped as “Other patterns”, are presented in the Supplementary Figure. Logistic regression models require a minimum of approximately 10 events per predictor variable to ensure stable parameter estimates and adequate statistical power (23). Due to the limited sample size, these results should be considered exploratory.
Subgroup analysis
We performed gender-based analyses for both correspondence analysis and two types of logistic regressions to examine gender-specific risk factors associated with dyslipidemia patterns. These analyses allowed us to explore the influence of dyslipidemia subtypes, demographic characteristics, and health status within each gender.
Results
Characteristics of individuals included
Among 44,304 participants, 13,960 (31.5%) had dyslipidemia. Prevalence rates for subtypes were: Hyper_TC 7.2%, Hyper_TG 14.6%, Hyper_LDL 4.1%, and Hypo_HDL 16.5%. Table 1 details participant characteristics stratified by subtype. Females were more prevalent in Hyper_TC, Hyper_TG, and Hyper_LDL groups, while males predominated in the Hypo_HDL group. Significant differences (P < 0.05) between dyslipidemic and non-dyslipidemic groups were observed for residence, income, education, smoking, alcohol use, BMI level, and comorbidity number, but not insurance status. Lipid levels (TC, TG, LDL-C, HDL-C) and BMI also differed significantly across subtypes.
Table 1
| Variables | Total (N, %) 44,304 (100) | Dyslipidemia (n, %) 13,960 (31.5) | P 1 | Hyper_TC (n, %) 3,177 (7.2) | P 2 | Hyper_TG (n, %) 6,481 (14.6) | P 3 | Hyper_LDL (n, %) 1,834 (4.1) | P 4 | Hypo_HDL (n, %) 7,316 (16.5) | P 5 |
|---|---|---|---|---|---|---|---|---|---|---|---|
| Age (years) | 69.00 [66.00, 71.00] | 69.00 [66.00, 71.00] | 0.76 | 69.00 [67.00, 71.00] | 0.44 | 68.00 [66.00, 71.00] | <0.05 | 69.00 [67.00, 71.00] | 0.58 | 69.00 [66.00, 71.00] | 0.44 |
| Gender (%) | 0.49 | <0.05 | <0.05 | <0.05 | <0.05 | ||||||
| Male | 20,293 (45.8) | 6,360 (45.6) | 751 (23.6) | 2,251 (34.7) | 545 (29.7) | 4,594 (62.8) | |||||
| Female | 24,011 (54.2) | 7,600 (54.4) | 2,426 (76.4) | 4,230 (65.3) | 1,289 (70.3) | 2,722 (37.2) | |||||
| Area (%) | <0.05 | <0.05 | <0.05 | <0.05 | <0.05 | ||||||
| Rural | 21,547 (48.6) | 5,983 (42.9) | 1,361 (42.8) | 2,810 (43.4) | 690 (37.6) | 3,018 (41.3) | |||||
| Urban | 22,757 (51.4) | 7,977 (57.1) | 1,816 (57.2) | 3,671 (56.6) | 1,144 (62.4) | 4,298 (58.7) | |||||
| Marital_status (%) | <0.05 | <0.05 | 0.46 | 0.50 | <0.05 | ||||||
| Unmarried | 4,861 (11.0) | 1,423 (10.2) | 398 (12.5) | 728 (11.2) | 209 (11.4) | 608 (8.3) | |||||
| Married | 39,443 (89.0) | 12,537 (89.8) | 2,779 (87.5) | 5,753 (88.8) | 1,625 (88.6) | 6,708 (91.7) | |||||
| Income (%) | 0.08 | <0.05 | 0.68 | 0.05 | <0.05 | ||||||
| <50, 000 yuan | 34,861 (78.7) | 10,914 (78.2) | 2,618 (82.4) | 5,092 (78.6) | 1,477 (80.5) | 5,557 (76.0) | |||||
| ≥50,000 yuan | 9,443 (21.3) | 3,046 (21.8) | 559 (17.6) | 1,389 (21.4) | 357 (19.5) | 1,759 (24.0) | |||||
| Insurance (%) | 0.29 | 0.63 | 0.72 | 0.86 | 0.52 | ||||||
| Uninsured | 595 (1.3) | 175 (1.3) | 39 (1.2) | 84 (1.3) | 24 (1.3) | 92 (1.3) | |||||
| Insured | 43,709 (98.7) | 13,785 (98.7) | 3,138 (98.8) | 6,397 (98.7) | 1,810 (98.7) | 7,224 (98.7) | |||||
| Education (%) | <0.05 | <0.05 | 0.41 | <0.05 | <0.05 | ||||||
| Primary school and below | 31,763 (71.9) | 9,586 (68.9) | 2,474 (78.0) | 4,625 (71.5) | 1,354 (73.9) | 4,568 (62.7) | |||||
| Junior high school | 8,886 (20.1) | 3,000 (21.6) | 507 (16.0) | 1,294 (20.0) | 322 (17.6) | 1,837 (25.2) | |||||
| Senior high school | 2,753 (6.2) | 1,025 (7.4) | 158 (5.0) | 435 (6.7) | 122 (6.7) | 653 (9.0) | |||||
| College degree and above | 761 (1.7) | 310 (2.2) | 34 (1.1) | 111 (1.7) | 35 (1.9) | 230 (3.2) | |||||
| Smoking (%) | 0.013 | <0.05 | <0.05 | <0.05 | <0.05 | ||||||
| Never | 34,701 (78.3) | 11,049 (79.1) | 2,768 (87.1) | 5,354 (82.6) | 1,551 (84.6) | 5,331 (72.9) | |||||
| <3 cigarettes/week | 1,838 (4.1) | 543 (3.9) | 90 (2.8) | 202 (3.1) | 53 (2.9) | 364 (5.0) | |||||
| ≥3 cigarettes/week | 7,765 (17.5) | 2,368 (17.0) | 319 (10.0) | 925 (14.3) | 230 (12.5) | 1,621 (22.2) | |||||
| Alcohol (%) | <0.05 | <0.05 | <0.05 | <0.05 | <0.05 | ||||||
| ≤1 time/month | 34,110 (77.3) | 1,1,083 (79.7) | 2,657 (83.9) | 5,218 (80.7) | 1,489 (81.4) | 5,651 (77.7) | |||||
| 2–4 times/month | 1,867 (4.2) | 638 (4.6) | 112 (3.5) | 284 (4.4) | 85 (4.6) | 394 (5.4) | |||||
| 2–3 times/week | 1,453 (3.3) | 435 (3.1) | 63 (2.0) | 165 (2.6) | 51 (2.8) | 282 (3.9) | |||||
| ≥4 times/week | 6,676 (15.1) | 1,747 (12.6) | 334 (10.5) | 800 (12.4) | 205 (11.2) | 949 (13.0) | |||||
| BMI_Level (%) | <0.05 | 0.09 | <0.05 | <0.05 | <0.05 | ||||||
| ≤23.9 kg/m2 | 16,415 (37.2) | 3,670 (26.3) | 1,120 (35.3) | 1,456 (22.5) | 603 (33.0) | 1,691 (23.2) | |||||
| 24.0–27.9 kg/m2 | 18,754 (42.4) | 6,534 (46.9) | 1,379 (43.5) | 3,105 (48.0) | 845 (46.2) | 3,545 (48.6) | |||||
| ≥28.0 kg/m2 | 9,014 (20.4) | 3,727 (26.8) | 670 (21.1) | 1,907 (29.5) | 382 (20.9) | 2,064 (28.3) | |||||
| Comorbidity number (%) | <0.05 | <0.05 | <0.05 | <0.05 | <0.05 | ||||||
| 0 | 9,870 (22.3) | 2,242 (16.1) | 480 (15.1) | 846 (13.1) | 269 (14.7) | 1,233 (16.9) | |||||
| 1 | 23,256 (52.5) | 7,130 (51.1) | 1,703 (53.6) | 3,231 (49.9) | 975 (53.2) | 3,659 (50.0) | |||||
| 2 | 8,700 (19.6) | 3,578 (25.6) | 791 (24.9) | 1,973 (30.4) | 460 (25.1) | 1,834 (25.1) | |||||
| 3 | 1,448 (3.3) | 541 (3.9) | 110 (3.5) | 218 (3.4) | 69 (3.8) | 320 (4.4) | |||||
| 4 | 814 (1.8) | 344 (2.5) | 80 (2.5) | 159 (2.5) | 56 (3.1) | 185 (2.5) | |||||
| 5 | 179 (0.4) | 100 (0.7) | 12 (0.4) | 42 (0.6) | 5 (0.3) | 67 (0.9) | |||||
| 6 | 33 (0.1) | 21 (0.2) | 1 (0.0) | 11 (0.2) | 0 (0.0) | 15 (0.2) | |||||
| 7 | 4 (0.0) | 4 (0.0) | 0 (0.0) | 1 (0.0) | 0 (0.0) | 3 (0.0) | |||||
| BMI (kg/m2) | 24.97 [22.82, 27.23] | 25.81 [23.78, 27.97] | <0.05 | 25.07 [22.98, 27.32] | <0.05 | 26.14 [24.09, 28.25] | <0.05 | 25.08 [23.31, 27.33] | <0.05 | 26.08 [24.06, 28.11] | <0.05 |
| TC (mmol/L) | 4.53 [3.87, 5.23] | 4.73 [3.78, 6.06] | <0.05 | 6.70 [6.41, 7.25] | <0.05 | 5.03 [4.31, 5.85] | <0.05 | 6.73 [6.28, 7.29] | <0.05 | 3.94 [3.34, 4.64] | <0.05 |
| TG(mmol/L) | 1.30 [0.94, 1.86] | 2.16 [1.35, 2.91] | <0.05 | 1.86 [1.30, 2.75] | <0.05 | 2.97 [2.56, 3.70] | <0.05 | 1.65 [1.22, 2.32] | <0.05 | 1.67 [1.17, 2.46] | <0.05 |
| LDL (mmol/L) | 2.43 [1.89, 3.02] | 2.55 [1.88, 3.51] | <0.05 | 4.13 [3.69, 4.58] | <0.05 | 2.47 [1.81, 3.21] | <0.05 | 4.54 [4.29, 4.99] | <0.05 | 2.21 [1.69, 2.78] | <0.05 |
| HDL (mmol/L) | 1.37 [1.13, 1.67] | 1.03 [0.92, 1.37] | <0.05 | 1.60 [1.31, 1.94] | <0.05 | 1.17 [0.98, 1.40] | <0.05 | 1.44 [1.19, 1.71] | <0.05 | 0.93 [0.84, 0.99] | <0.05 |
Characteristics of demographic and health-related factors Among elderly population included.
Hyper_TC, total cholesterol (TC) levels ≥6.2 mmol/L; Hyper_TG, triglycerides (TG) levels ≥2.3 mmol/L; Hyper_LDL, low-density lipoprotein cholesterol (LDL-C) levels ≥4.1 mmol/L; Hypo_HDL, high-density lipoprotein cholesterol (HDL-C) levels <1.0 mmol/L. Data are presented as median [interquartile range] for age, BMI, TC, TG, LDL, and HDL. And n (percentage) for categorical variables. P-values were calculated using the Kruskal–Wallis test for age, BMI, TC, TG, LDL-C, and HDL-C, and the Chi-square test for categorical variables.
P1, Comparison of the Dyslipidemia group with its negative control group. P2, Comparison of the Hyper_TC group with its negative control group. P3, Comparison of the Hyper_TG group with its negative control group. P4, Comparison of the Hyper_LDL group with its negative control group. P5: Comparison of the Hypo_HDL group with its negative control group.
Dyslipidemia subtypes & patterns
Table 2 shows pattern distributions. The most common overall patterns were “0 0 0 1” (Hypo_HDL, 36.5%) and “0 1 0 0” (Hyper_TG, 24.6%), followed by “0 1 0 1” (Hyper_TG & Hypo_HDL, 13.2%). Major patterns differed by gender: “0001” (Hypo_HDL) was most common in males (54.6%), while “0 1 0 0” (Hyper_TG) led in females (31.9%). Females had proportionally more Hyper_TC patterns (“1 X X X”), whereas males had a substantially higher proportion of the “0 0 0 1” pattern.
Table 2
| Dyslipidemia Patterns | N (Composition %)a | |||
|---|---|---|---|---|
| Overall | Males | Females | ||
| Single Abnormality | 0 0 0 1 | 5,094 (36.5) | 3,474 (54.6) | 1,620 (21.3) |
| 0 1 0 0 | 3,431 (24.6) | 1,006 (15.8) | 2,425 (31.9) | |
| 1 0 0 0 | 963 (6.9) | 201 (3.2) | 762 (10.0) | |
| 0 0 1 0 | 233 (1.7) | 93 (1.5) | 140 (1.8) | |
| Mixed Abnormality | 0 1 0 1 | 1,849 (13.2) | 946 (14.9) | 903 (11.9) |
| 1 0 1 0 | 1,025 (7.3) | 257 (4.0) | 768 (10.1) | |
| 1 1 0 0 | 664 (4.8) | 140 (2.2) | 524 (6.9) | |
| 0 0 1 1 | 78 (0.6) | 46 (0.7) | 32 (0.4) | |
| 1 0 0 1 | 49 (0.4) | 21 (0.3) | 28 (0.4) | |
| 0 1 1 0 | 39 (0.3) | 12 (0.2) | 27 (0.4) | |
| Complex Abnormality | 1 1 1 0 | 289 (2.1) | 57 (0.9) | 232 (3.1) |
| 1 1 0 1 | 76 (0.5) | 27 (0.4) | 49 (0.6) | |
| 0 1 1 1 | 59 (0.4) | 32 (0.5) | 27 (0.4) | |
| 1 0 1 1 | 37 (0.3) | 17 (0.3) | 20 (0.3) | |
| 1 1 1 1 | 74 (0.5) | 31 (0.5) | 43 (0.6) | |
| Total | 13,960 (100) | 6,360 (100) | 7,600 (100) | |
Distribution of dyslipidemia patterns.
These three columns in the table show the sample size and subtype composition of dyslipidemia patterns in the total population, males, and females, respectively. The columns add up to 100%.
Dyslipidemia patterns are defined by a 4-digit binary code representing the presence (1) or absence (0) of abnormal levels of total cholesterol (TC), triglycerides (TG), low-density lipoprotein cholesterol (LDL-C), and high-density lipoprotein cholesterol (HDL-C), in that order. Dyslipidemia patterns were classified into three levels: Simple (isolated abnormalities in TC, TG, LDL-C, and HDL-C), Mixed (combinations of two abnormalities), and Complex (three or more concurrent abnormalities).
Correspondence analysis (Figure 1) revealed pattern structures. Hypo_HDL and Hyper_TG contributed most to simple patterns (Figure 1A). Dimensions 1 and 2 explained >80% of the association (Figure 1C). Hyper_TC and Hyper_LDL clustered together, strongly associated with mixed and complex patterns (Figure 1D). Hyper_LDL, in particular, showed low contribution to simple patterns (<15%) and higher contribution to complex ones, suggesting more complex metabolic dysregulation when LDL-C is high (Figures 1A,B). Gender differences were observed: males showed stronger tendencies towards “0001” and complex patterns involving Hyper_LDL or Hyper_TC compared to females (detailed breakdown in Supplementary Figures S1.1, S1.2).
Figure 1
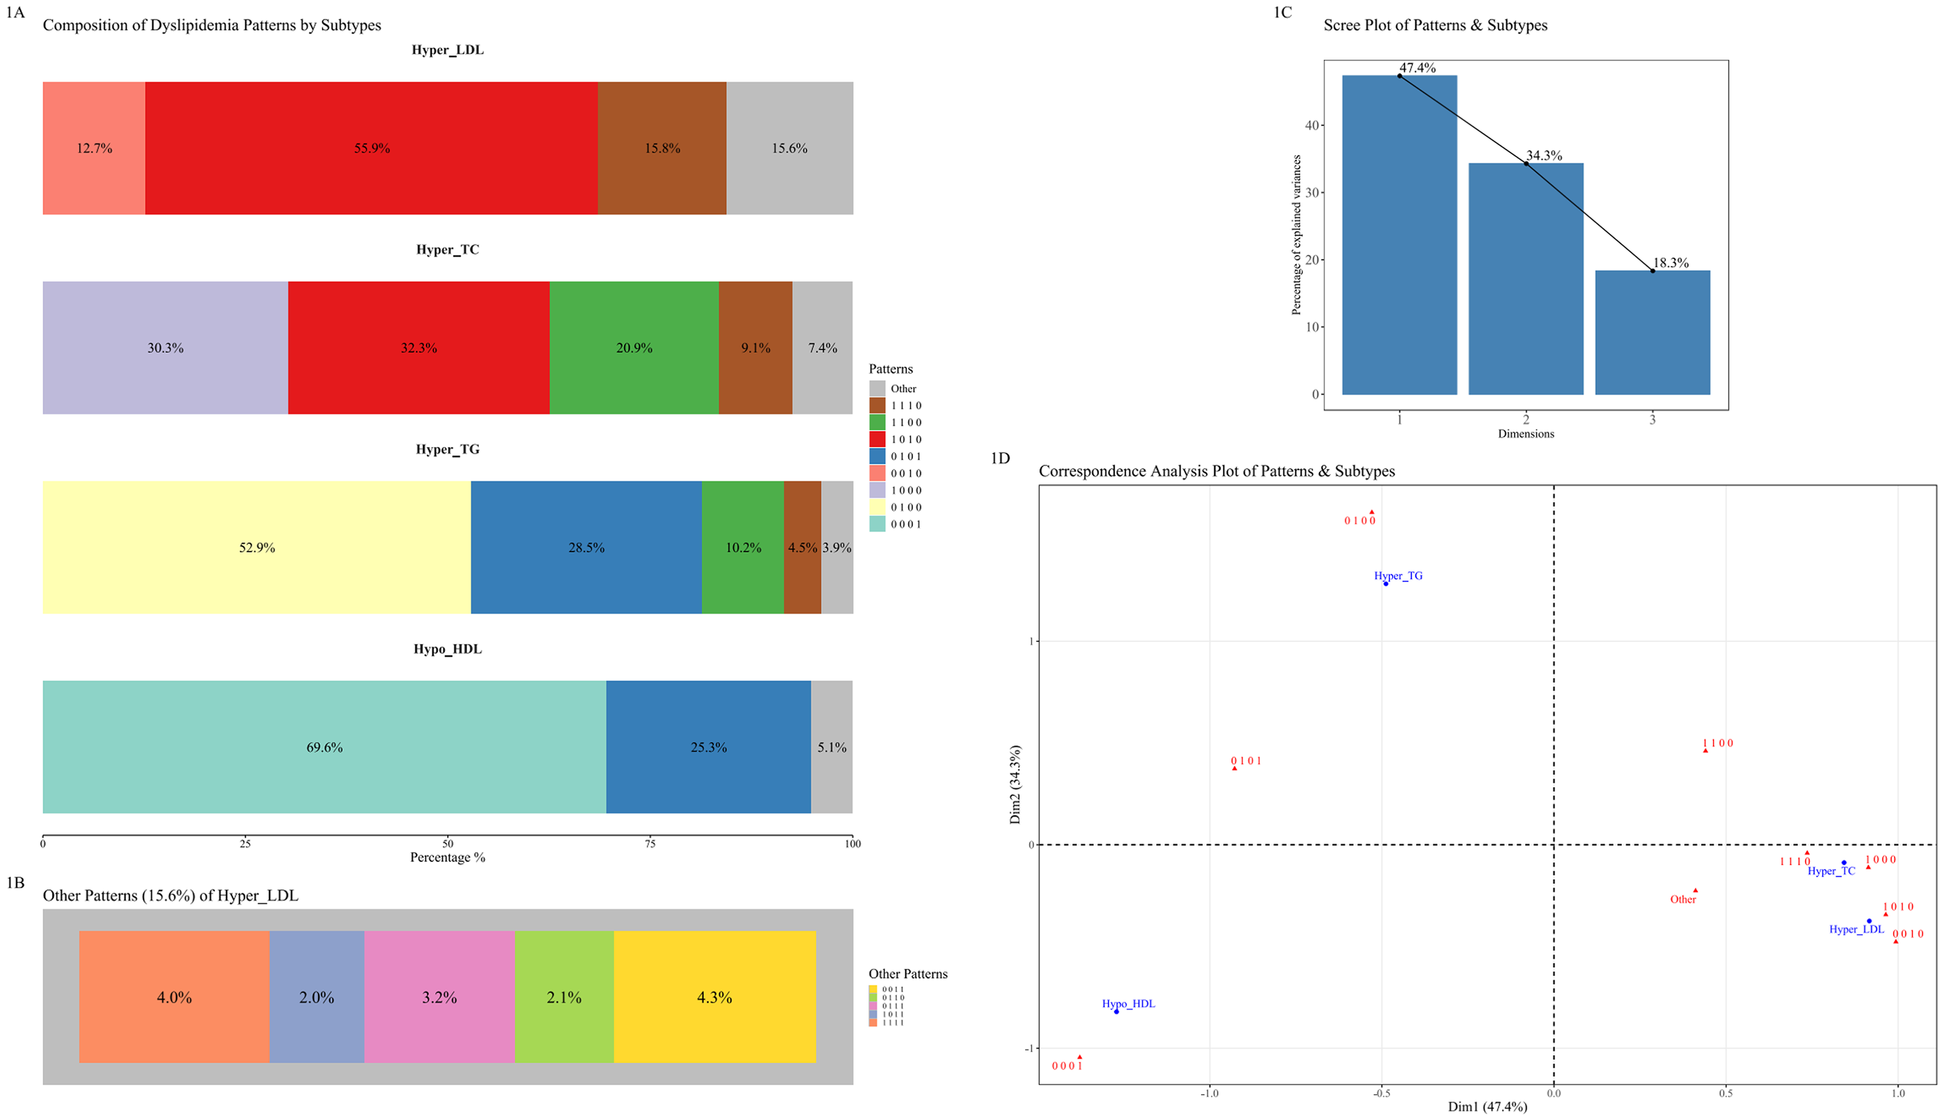
Correspondence analysis of dyslipidemia subtypes and patterns. (A) Composition of dyslipidemia patterns for each of the four main subtypes. Each bar illustrates the percentage distribution of different patterns within Hyper_LDL, Hyper_TC, Hyper_TG, and Hypo_HDL subtypes. (B) A detailed breakdown of the “Other Patterns” category for the Hyper_LDL subtype. (C) Scree plot showing the percentage of inertia (variance) explained by the first two dimensions of the correspondence analysis. (D) Correspondence analysis plot illustrating the associations between dyslipidemia subtypes (in red) and specific patterns (in blue). Proximity between points indicates a stronger association.
Logistic regression analysis (overall dyslipidemia)
Neither age nor gender was associated with overall dyslipidemia risk in this 65–75 age group (ORs = 1.00, 0.96; P > 0.05). Insurance and income were also not associated with overall dyslipidemia. However, being married, urban residence, higher education (junior high+), frequent smoking (≥3/week), higher BMI (≥24.0 kg/m2), and more comorbidities were significantly associated with higher odds of dyslipidemia (P < 0.05), while frequent alcohol consumption was protective (Supplementary Figure S2). Gender-specific differences emerged: age and frequent alcohol use conferred protection only in males; higher income was associated with increased dyslipidemia odds in males but with reduced odds in females. Moreover, higher education elevated dyslipidemia odds solely in males, and being married raised the odds exclusively in females (Supplementary Figures S3.1, S3.2).
Multinomial logistic regression analysis (specific dyslipidemia patterns)
Associations for the eight most prevalent patterns are shown in Figures 2, 3 (less prevalent patterns in Supplementary Figures S4, S5).
Figure 2
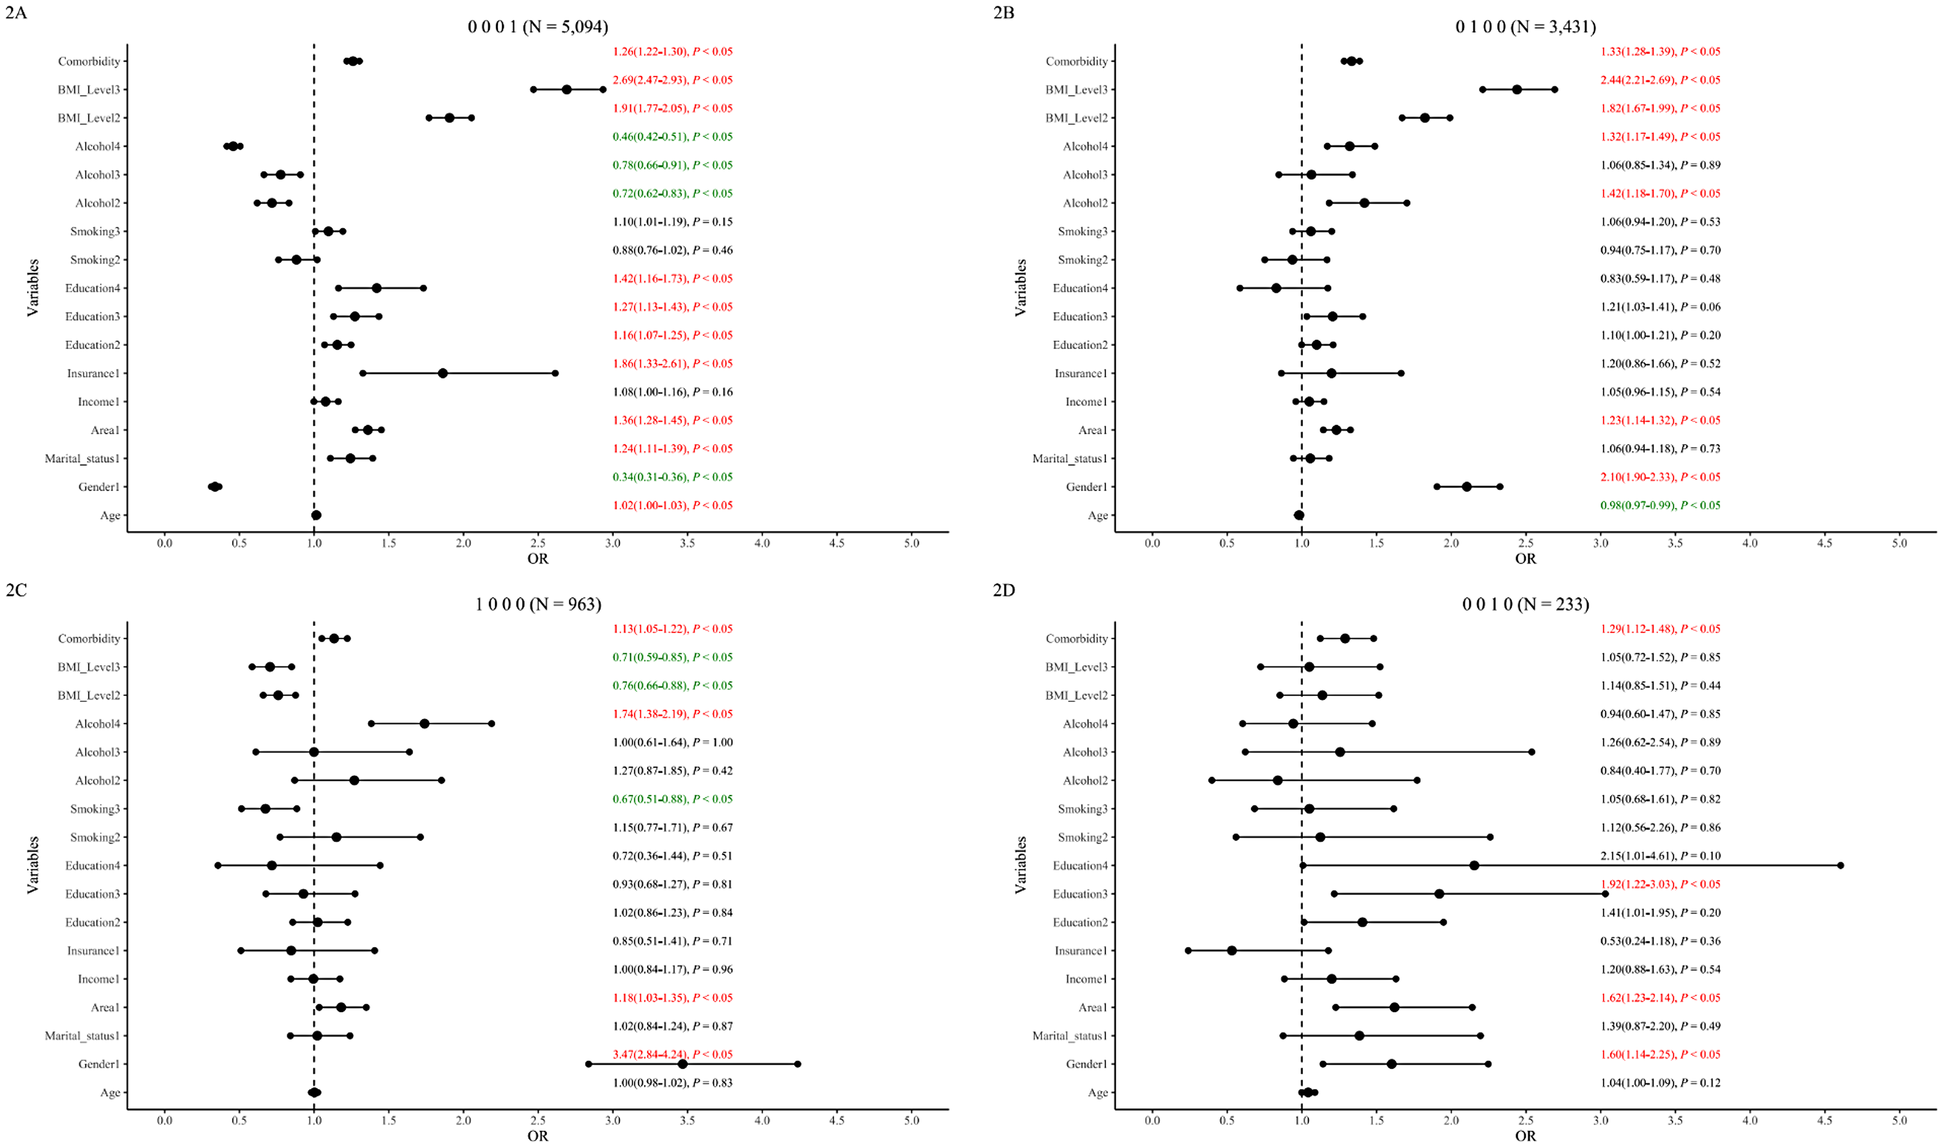
Single dyslipidemia patterns and associated factors in the 65–75 age group. The figure displays forest plots for the four most prevalent single dyslipidemia patterns: (A) isolated hypo_HDL (“0001”), (B) Isolated Hyper_TG (“0100”), (C) isolated hyper_TC (“1000”), and (D) isolated hyper_LDL (“0010”). Odds ratios (ORs) with 95% confidence intervals (CIs) are shown. For clarity, factors associated with lower odds are represented in green, and factors associated with higher odds are in red.
Figure 3
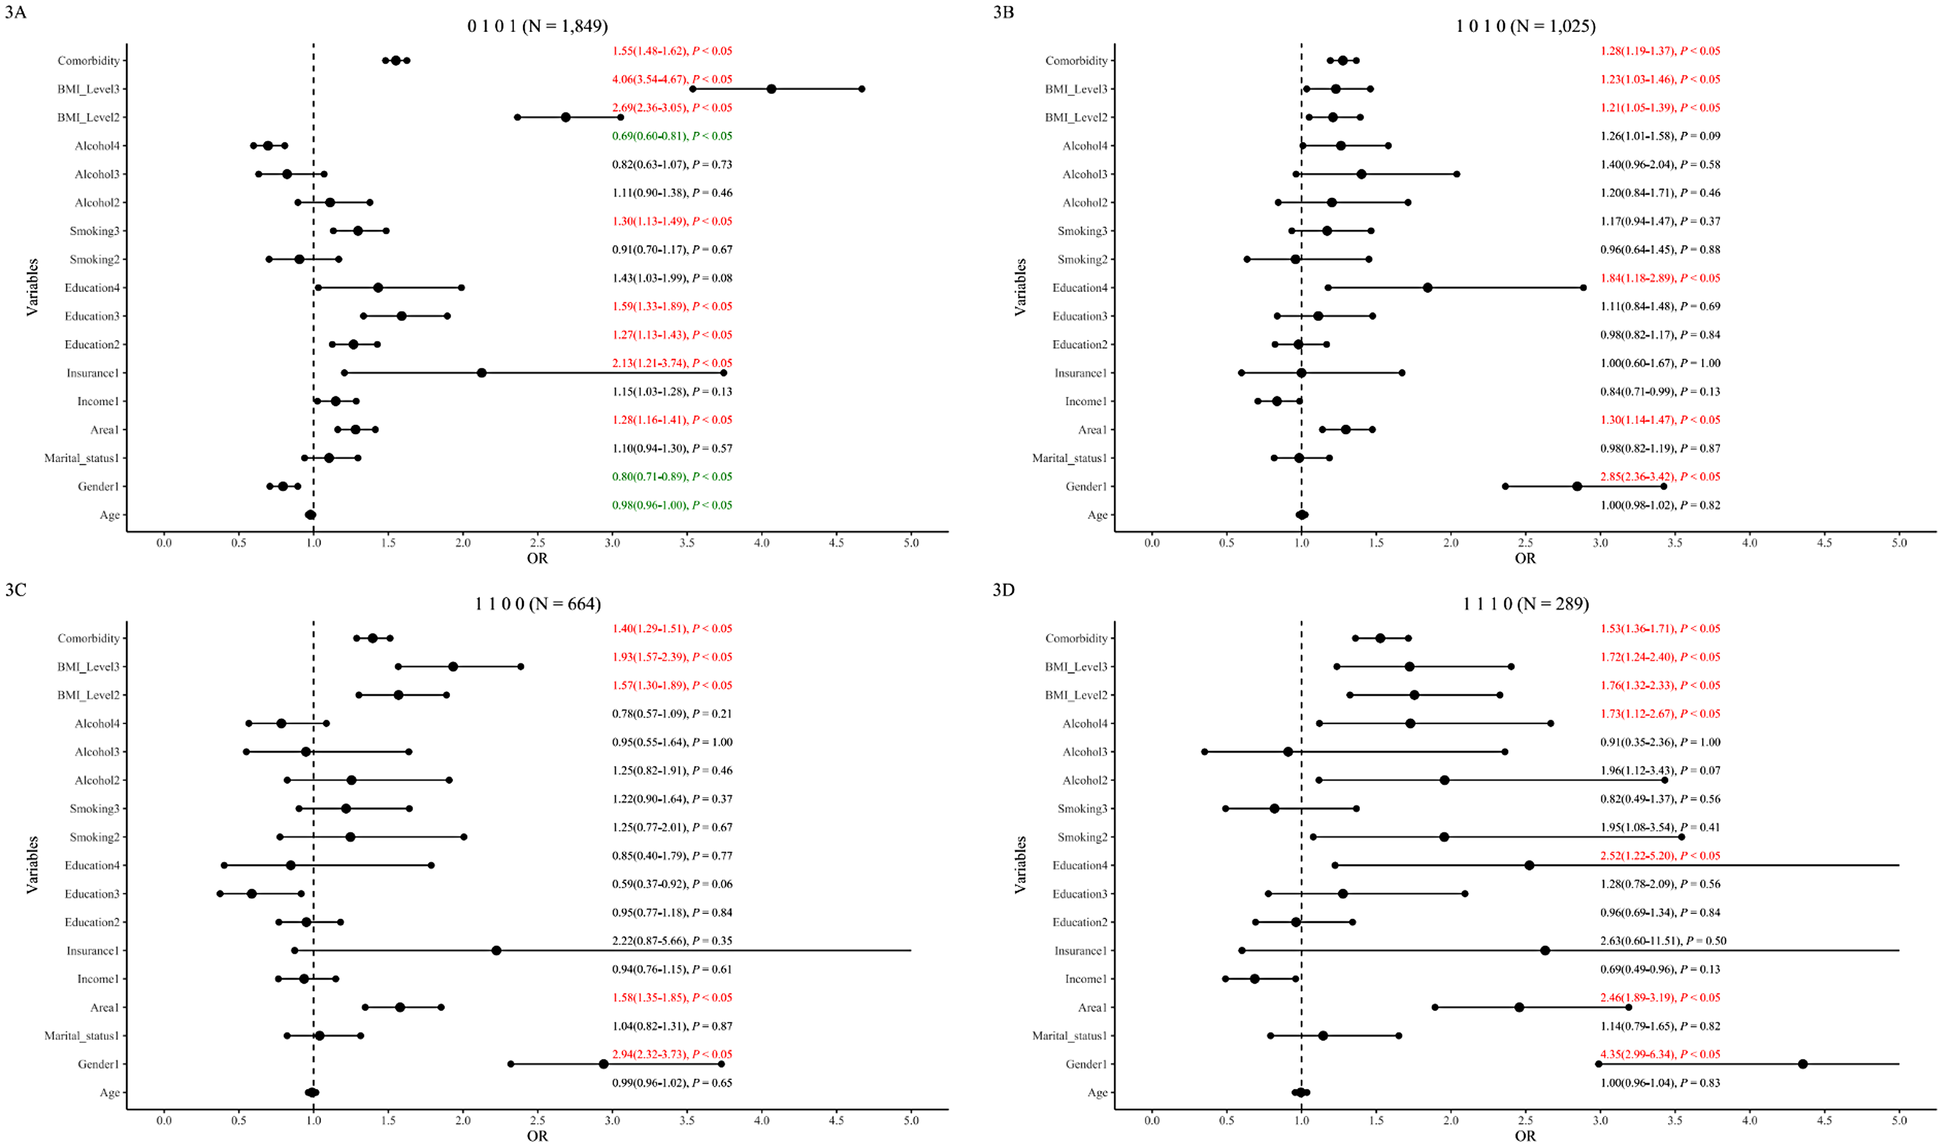
Mixed & Complex dyslipidemia patterns and associated factors in the 65–75 age group. The figure displays forest plots for prevalent mixed and complex dyslipidemia patterns: (A) hyper_TG & hypo_HDL (“0101”), (B) hyper_TC & hyper_LDL (“1010”), (C) hyper_TC & hyper_TG (“1100”), and (D) hyper_TC& hyper_TG & hyper_LDL (“1110”). Odds ratios (ORs) with 95% confidence intervals (CIs) are shown. For clarity, factors associated with lower odds are represented in green, and factors associated with higher odds are in red.
Demographics
Age was associated with lower odds of TG-related patterns (“0 1 0 0”, “0 1 0 1”) overall and significantly so in males (Supplementary Figures S4.1, S5.1). High income was not significantly associated overall but was associated with higher odds of “0001” in males and showed a protective trend for “1 0 1 0” in females (P = 0.07 adjusted). Insurance status was associated with higher odds of “0 0 0 1” and “0 1 0 1” overall but not significantly associated in gender subgroups. Urban residence was consistently associated with higher odds across most patterns in overall and male analyses, but not associated with “1 0 0 0” and “1 0 1 0” in females. Higher education was associated with dose-dependently higher odds for Hypo_HDL patterns (“0 0 0 1”, “0 1 0 1”) overall, significant only in males.
Health-related factors
Frequent smoking was associated with higher odds of “0 1 0 1” and lower odds of “1 0 0 0” overall. Gender-stratified: associated with higher odds of “0 0 0 1” and “0 1 0 1” in males, and lower odds of “1 0 0 0” in females. Frequent alcohol use showed complex associations: associated with higher odds for TG/TC patterns (“0 1 0 0”, “1 0 0 0”, “1 1 1 0”) but lower odds for Hypo_HDL patterns (“0 0 0 1”, “0 1 0 1”) overall and similarly in males; no significant associations in females. Overweight/obesity was generally associated with incrementally higher odds for most patterns but lower odds for “1 0 0 0” (overall and females). Comorbidities were associated with higher odds across patterns, though significance varied slightly by pattern and gender (Further details: Figures 2, 3; Supplementary Figures 4, 5).
Discussion
Our study confirms a high dyslipidemia prevalence (31.5%) among community-dwelling older Chinese adults, emphasizing the need for pattern-specific risk analysis. The Hypo_HDL pattern (“0 0 0 1”) was most common overall and particularly in males, whereas the Hyper_TG pattern (“0 1 0 0”) predominated in females. These stark gender differences, alongside findings that urban residence and higher education were associated with higher odds of dyslipidemia, underscore the complex interplay of biological, socioeconomic, and lifestyle factors in shaping dyslipidemia profiles in this population.
Gender dimorphism in dyslipidemia profiles: subtype and pattern differences
Marked gender dimorphism was evident. Females showed higher prevalence of patterns involving elevated TC, TG, and LDL-C, potentially linked to post-menopausal hormonal changes (16, 19, 26), while males predominantly exhibited Hypo_HDL patterns, possibly related to androgens or lifestyle factors like historically higher smoking rates and lower healthcare engagement (27–29). Interestingly, overweight/obesity paradoxically protected against the isolated Hyper_TC (“1 0 0 0”) pattern, an effect primarily seen in females, perhaps reflecting metabolically healthy obesity phenotypes or associated higher HDL_C levels (30).
Lifestyle paradoxes: different impacts of alcohol on dyslipidemia
Lifestyle factors showed complex associations. Frequent alcohol consumption demonstrated a dual association, particularly in males, being associated with lower odds of Hypo_HDL related patterns (“0 0 0 1”, “0 1 0 1”) but associated with higher odds for others involving Hyper_TG or Hyper_TC (“0 1 0 0”, “1 0 0 0”, “1 1 1 0”). No protective association was observed in females; instead, less frequent drinking was associated with the “1 0 1 0” pattern. The two-way link between alcohol and dyslipidemia is well-known (17, 18). Drinking alcohol in normal amounts is often related to higher HDL-C (“good” cholesterol), but drinking too much could lead to higher triglycerides and other lipid problems (21). Literature suggests alcohol elevates HDL-C through pathways like stimulating ApoA-I synthesis, enhancing reverse cholesterol transport, inhibiting CETP, and augmenting lipoprotein lipase activity (31). While these mechanisms explain HDL's functionality and its response to moderate alcohol, the overall benefit of HDL-C remains debated (32). Given alcohol's known health risks, our finding is an epidemiological observation, not a public health recommendation.
Socioeconomic paradoxes: wealth and dyslipidemia in elderly population
This study, conducted in Jiangsu Province –a province in China with a GDP per capita exceeding $20,000 USD –revealed notable associations between socioeconomic status and dyslipidemia in this elderly Chinese population. Socioeconomic status also revealed paradoxes. Urban living and higher education were associated with higher odds of dyslipidemia, especially in males (“0 0 0 1”, “0 1 0 1”), possibly reflecting adverse lifestyle shifts (diet, activity) accompanying urbanization despite potentially better healthcare access (8, 33–35). A notable observation was the elevated odds of low HDL-C (Hypo_HDL, pattern “0 0 0 1”) among men with higher education, likely stemming from increased sedentary behavior. This is supported by researches indicating that highly educated individuals tend to engage more frequently in sedentary activities, such as reading (36, 37). While occupational type was not collected in our dataset, this unmeasured factor could potentially mediate the observed association. Annual family income showed opposing associations by gender: higher income was associated with higher odds for the male-dominant “0 0 0 1” pattern but was associated with lower odds for the “1 0 1 0” pattern in females. These disparities might stem from gender differences in health prioritization and healthcare utilization influenced by economic standing. A research conducted in Guangdong Province, China, (economically strong province) has shown that individuals with higher incomes prioritize their health, especially in accessing chronic disease healthcare (38). And females' greater willingness to seek healthcare, compared to men, might be one contributing factor to this difference. These complicated associations, observed in elderly residents of a high-GDP Chinese province, highlighted the critical need to consider the specific socioeconomic and cultural context when assessing dyslipidemia risk in the elderly.
Key limitations include: First, the cross-sectional design, preventing causal inference, and the focus on a specific elderly (65–75 years) Chinese population, which may limit generalizability to other demographics. Second, POCT devices (the CardioChek analyzer) offer advantages for field screening, their accuracy/precision may differ somewhat from standard venous blood laboratory testing methods (25). Third, our “comorbidity number” variable relied on self-reported disease history, which is susceptible to recall bias and potential under-reporting.
The value of this research lies in revealing novel health paradoxes and association patterns that may emerge in regions at the forefront of economic transition and development, rather than aiming to provide generalizable conclusions for the entirety of East China. Our findings offer important insights into the health characteristics of economically advanced regions in China and lay the groundwork for future inter-regional comparative studies across a broader and more diverse East China.
Conclusion
This study provided an in-depth analysis of dyslipidemia subtype patterns among elderly Chinese individuals in community settings. The findings emphasized that considering gender- and pattern-specific risk factors is crucial in the prevention and management of dyslipidemia among older adults.
Statements
Data availability statement
The raw data supporting the conclusions of this article will be made available by the authors, without undue reservation.
Ethics statement
The studies involving humans were approved by The project was reviewed by the Ethics Committee of Fu Wai Hospital (National Center for Cardiovascular Diseases, Chinese Academy of Medical Sciences) (2014-574). The studies were conducted in accordance with the local legislation and institutional requirements. Written informed consent for participation in this study was provided by the participants' legal guardians/next of kin.
Author contributions
XM: Writing – original draft, Writing – review & editing. SX: Writing – original draft, Writing – review & editing. WX: Writing – review & editing, Resources, Supervision. FY: Resources, Writing – review & editing, Supervision. JH: Writing – review & editing, Resources. LC: Resources, Writing – review & editing. YQ: Writing – review & editing, Resources. JS: Writing – review & editing, Resources. WX: Writing – review & editing, Resources. RT: Resources, Writing – review & editing. JZ: Writing – review & editing, Resources, Funding acquisition.
Funding
The author(s) declare that financial support was received for the research and/or publication of this article. Open access funding provided by Scientific Research Project of Jiangsu Provincial Health and Wellness Commission (Y12023010), (Ym2023081); Young Talent Science and Technology Project of Changzhou Health and Wellness Commission (QN202335); Noncommunicable Chronic Diseases-National Science and Technology Major Project (2024ZD0524000); Clinical Project of Changzhou Medical Center of Nanjing Medical University (CMCC202205); Open Project of Higher Institute of Public Health of Changzhou, Nanjing Medical University (CPHM202304); Changzhou Municipal “Health and Wellness High-level Talents Training Project—Top Talents Project. Fourteenth Five-Year Plan” Health and Wellness High-level Talent Cultivation Project—Top Talent Project (2022CZBJ097); Program of Screening and Intervention Subjects with High Risk Cardiovascular Diseases.
Acknowledgments
The authors would like to thank all the subjects and staff who participated in PEACE and whose dedication was the foundation of the study.
Conflict of interest
The authors declare that the research was conducted in the absence of any commercial or financial relationships that could be construed as a potential conflict of interest.
Generative AI statement
The author(s) declare that no Generative AI was used in the creation of this manuscript.
Any alternative text (alt text) provided alongside figures in this article has been generated by Frontiers with the support of artificial intelligence and reasonable efforts have been made to ensure accuracy, including review by the authors wherever possible. If you identify any issues, please contact us.
Publisher’s note
All claims expressed in this article are solely those of the authors and do not necessarily represent those of their affiliated organizations, or those of the publisher, the editors and the reviewers. Any product that may be evaluated in this article, or claim that may be made by its manufacturer, is not guaranteed or endorsed by the publisher.
Supplementary material
The Supplementary Material for this article can be found online at: https://www.frontiersin.org/articles/10.3389/fcvm.2025.1634134/full#supplementary-material
References
1.
Liu T Zhao D Qi Y . Global trends in the epidemiology and management of dyslipidemia. J Clin Med. (2022) 11(21):6377. 10.3390/jcm11216377
2.
Pirillo A Casula M Olmastroni E Norata GD Catapano AL . Global epidemiology of dyslipidaemias. Nat Rev Cardiol. (2021) 18(10):689–700. 10.1038/s41569-021-00541-4
3.
Hu SS . Writing committee of the report on cardiovascular H, diseases in C. Cardiovascular risk factors in China. J Geriatr Cardiol. (2024) 21(2):153–99. 10.26599/1671-5411.2024.02.008
4.
Li JJ Zhao SP Zhao D Lu GP Peng DQ Liu J et al 2023 Chinese guideline for lipid management. Front Pharmacol. (2023) 14:1190934. 10.3389/fphar.2023.1190934
5.
Bays HE Jones PH Orringer CE Brown WV Jacobson TA . National lipid association annual summary of clinical lipidology 2016. J Clin Lipidol. (2016) 10(1 Suppl):S1–43. 10.1016/j.jacl.2015.08.002
6.
Writing Committee M Virani SS Newby LK Arnold SV Bittner V Brewer LC et al 2023 AHA/ACC/ACCP/ASPC/NLA/PCNA guideline for the management of patients with chronic coronary disease: a report of the American Heart Association/American College of Cardiology joint committee on clinical practice guidelines. J Am Coll Cardiol. (2023) 82(9):833–955. 10.1016/j.jacc.2023.04.003
7.
Hu Z Zaman MJ Wang J Peacock JL Chen R . Correlates of untreated hypercholesterolemia in older adults: a community-based household survey in China. PLoS One. (2015) 10(7):e0131318. 10.1371/journal.pone.0131318
8.
Lu Y Zhang H Lu J Ding Q Li X Wang X et al Prevalence of dyslipidemia and availability of lipid-lowering medications among primary health care settings in China. JAMA Netw Open. (2021) 4(9):e2127573. 10.1001/jamanetworkopen.2021.27573
9.
Li L Ouyang F He J Qiu D Luo D Xiao S . Associations of socioeconomic Status and healthy lifestyle with incidence of dyslipidemia: a prospective Chinese governmental employee cohort study. Front Public Health. (2022) 10:878126. 10.3389/fpubh.2022.878126
10.
Srikanth S Deedwania P . Management of dyslipidemia in patients with hypertension, diabetes, and metabolic syndrome. Curr Hypertens Rep. (2016) 18(10):76. 10.1007/s11906-016-0683-0
11.
Dou Y Chen B Yu X Ma D . Effectiveness of internet-based health management in patients with dyslipidemia: a four-year longitudinal study. Atherosclerosis. (2023) 376:34–42. 10.1016/j.atherosclerosis.2023.04.004
12.
Oda E . Associations between serum cholinesterase and incident hyper-LDL cholesterolemia, hypertriglyceridemia and hypo-HDL cholesterolemia as well as changes in lipid levels in a health screening population. Atherosclerosis. (2015) 241(1):1–5. 10.1016/j.atherosclerosis.2015.04.804
13.
Song S Paik HY Park M Song Y . Dyslipidemia patterns are differentially associated with dietary factors. Clin Nutr. (2016) 35(4):885–91. 10.1016/j.clnu.2015.06.002
14.
Lee JS Chang PY Zhang Y Kizer JR Best LG Howard BV . Triglyceride and HDL-C dyslipidemia and risks of coronary heart disease and ischemic stroke by glycemic dysregulation Status: the strong heart study. Diabetes Care. (2017) 40(4):529–37. 10.2337/dc16-1958
15.
Izadi N Yari-Boroujeni R Soofi M Niknam M Amiri P Najafi F . Socioeconomic inequalities and dyslipidaemia in adult population of the ravansar non-communicable disease cohort study: the role of sex and age. BMJ Open. (2024) 14(11):e085035. 10.1136/bmjopen-2024-085035
16.
Holven KB Roeters van Lennep J . Sex differences in lipids: a life course approach. Atherosclerosis. (2023) 384:117270. 10.1016/j.atherosclerosis.2023.117270
17.
Xi Y Niu L Cao N Bao H Xu X Zhu H et al Prevalence of dyslipidemia and associated risk factors among adults aged ≥35 years in northern China: a cross-sectional study. BMC Public Health. (2020) 20(1):1068. 10.1186/s12889-020-09172-9
18.
Li X Hur J Cao Y Song M Smith-Warner SA Liang L et al Moderate alcohol consumption, types of beverages and drinking pattern with cardiometabolic biomarkers in three cohorts of US men and women. Eur J Epidemiol. (2023) 38(11):1185–96. 10.1007/s10654-023-01053-w
19.
Gouni-Berthold I Laufs U . Special aspects of cholesterol metabolism in women. Dtsch Arztebl Int. (2024) 121(12):401–6. 10.3238/arztebl.m2024.0063
20.
Tabassum R Ruotsalainen S Ottensmann L Gerl MJ Klose C Tukiainen T et al Lipidome- and genome-wide study to understand sex differences in circulatory lipids. J Am Heart Assoc. (2022) 11(19):e027103. 10.1161/JAHA.122.027103
21.
Cho KH Nam HS Kang DJ Park MH Kim JH . Long-Term alcohol consumption caused a significant decrease in Serum high-density lipoprotein (HDL)-cholesterol and apolipoprotein A-I with the atherogenic changes of HDL in middle-aged Korean women. Int J Mol Sci. (2022) 23(15):8623. 10.3390/ijms23158623
22.
Martin J Anton-Ladislao A Padierna A Berjano B Quintana JM . Classification of subtypes of patients with eating disorders by correspondence analysis. World J Psychiatry. (2021) 11(7):375–87. 10.5498/wjp.v11.i7.375
23.
de Jong VMT Eijkemans MJC van Calster B Timmerman D Moons KGM Steyerberg EW et al Sample size considerations and predictive performance of multinomial logistic prediction models. Stat Med. (2019) 38(9):1601–19. 10.1002/sim.8063
24.
Teng H Gao Y Wu C Zhang H Zheng X Lu J et al Prevalence and patient characteristics of familial hypercholesterolemia in a Chinese population aged 35–75 years: results from China PEACE million persons project. Atherosclerosis. (2022) 350:58–64. 10.1016/j.atherosclerosis.2022.03.027
25.
Robert Lourdes TG Chong ZL Saminathan TA Hamid HAA Mat Rifin H Wan KS et al Diagnostic accuracy of Cardiochek® PA point-of-care testing (POCT) analyser with a 3-in-1 lipid panel for epidemiological surveys. Lipids Health Dis. (2024) 23(1):297. 10.1186/s12944-024-02270-2
26.
Sriprasert I Kim SS Mohammed IE Kono N Karim R Allayee H et al Effect of hormone therapy on lipoprotein subfractions in early and late postmenopausal women. J Clin Endocrinol Metab. (2025) 110(2):e301–e9. 10.1210/clinem/dgae171
27.
Alwhaibi M Balkhi B . Gender differences in potentially inappropriate medication use among older adults. Pharmaceuticals (Basel). (2023) 16(6):869. 10.3390/ph16060869
28.
Boden WE Miller MG McBride R Harvey C Snabes MC Schmidt J et al Testosterone concentrations and risk of cardiovascular events in androgen-deficient men with atherosclerotic cardiovascular disease. Am Heart J. (2020) 224:65–76. 10.1016/j.ahj.2020.03.016
29.
Espirito Santo LR Faria TO Silva CSO Xavier LA Reis VC Mota GA et al Socioeconomic status and education level are associated with dyslipidemia in adults not taking lipid-lowering medication: a population-based study. Int Health. (2022) 14(4):346–53. 10.1093/inthealth/ihz089
30.
Camhi SM Must A Gona PN Hankinson A Odegaard A Reis J et al Duration and stability of metabolically healthy obesity over 30 years. Int J Obes (Lond). (2019) 43(9):1803–10. 10.1038/s41366-018-0197-8
31.
Kunutsor SK Bhattacharjee A Connelly MA Bakker SJL Dullaart RPF . Alcohol consumption, high-density lipoprotein particles and subspecies, and risk of cardiovascular disease: findings from the PREVEND prospective study. Int J Mol Sci. (2024) 25(4):2290. 10.3390/ijms25042290
32.
Kunutsor SK Laukkanen JA . Further proof of a paradoxical relationship between high-density lipoprotein levels and adverse cardiovascular outcomes: are there implications for cardiovascular disease prevention?Eur J Prev Cardiol. (2023) 30(4):290–2. 10.1093/eurjpc/zwac272
33.
Opoku S Gan Y Fu W Chen D Addo-Yobo E Trofimovitch D et al Prevalence and risk factors for dyslipidemia among adults in rural and urban China: findings from the China national stroke screening and prevention project (CNSSPP). BMC Public Health. (2019) 19(1):1500. 10.1186/s12889-019-7827-5
34.
Zhao R Zhao L Yang F Ju L Li S Cheng X et al Dietary fat intake among Chinese adults and their relationships with blood lipids: findings from China nutrition and health surveillance and comparison with the PURE study. Nutrients. (2022) 14(24):5262. 10.3390/nu14245262
35.
Wang L Zhou B Zhao Z Yang L Zhang M Jiang Y et al Body-mass index and obesity in urban and rural China: findings from consecutive nationally representative surveys during 2004–2018. Lancet. (2021) 398(10294):53–63. 10.1016/S0140-6736(21)00798-4
36.
Liu S Li J Chen X Jiang X Tang R Lv Y . Factors related to sedentary behavior in older adult stroke patients in China: a study based on decision tree and logistic regression model. Front Public Health. (2024) 12:2024. 10.3389/fpubh.2024.1457151
37.
Moreno-Llamas A García-Mayor J De la Cruz-Sánchez E . The socioeconomic paradox of physical activity and sedentary behavior in Europe. J Phys Act Health. (2023) 20(3):193–203. 10.1123/jpah.2022-0036
38.
Elwell-Sutton TM Jiang CQ Zhang WS Cheng KK Lam TH Leung GM et al Inequality and inequity in access to health care and treatment for chronic conditions in China: the Guangzhou biobank cohort study. Health Policy Plan. (2013) 28(5):467–79. 10.1093/heapol/czs077
Summary
Keywords
dyslipidemia, dyslipidemia subtypes, dyslipidemia patterns, community-dwelling elderly Chinese, gender differences
Citation
Mi X, Xiong S, Xu W, Yao F, Huang J, Cui L, Qin Y, Su J, Xu W, Tao R and Zhou J (2025) Patterns and characteristics of dyslipidemia subtypes among community-dwelling elderly in Eastern China: a cross-sectional study. Front. Cardiovasc. Med. 12:1634134. doi: 10.3389/fcvm.2025.1634134
Received
08 July 2025
Accepted
04 August 2025
Published
22 August 2025
Volume
12 - 2025
Edited by
Mohamad Navab, UCLA Health System, United States
Reviewed by
Taoming Qian, Heilongjiang University of Chinese Medicine, China
Tongshuai Wang, Shanghai Jiao Tong University, China
Rong Zhang, Division for Chronic and Non-Communicable Disease Control and Prevention, China
Updates
Copyright
© 2025 Mi, Xiong, Xu, Yao, Huang, Cui, Qin, Su, Xu, Tao and Zhou.
This is an open-access article distributed under the terms of the Creative Commons Attribution License (CC BY). The use, distribution or reproduction in other forums is permitted, provided the original author(s) and the copyright owner(s) are credited and that the original publication in this journal is cited, in accordance with accepted academic practice. No use, distribution or reproduction is permitted which does not comply with these terms.
* Correspondence: Wenchao Xu xuwenchaoing@163.com Ran Tao 250466707@qq.com Jinyi Zhou 158694402@qq.com
†These authors have contributed equally to this work and share first authorship
‡These authors have contributed equally to this work
Disclaimer
All claims expressed in this article are solely those of the authors and do not necessarily represent those of their affiliated organizations, or those of the publisher, the editors and the reviewers. Any product that may be evaluated in this article or claim that may be made by its manufacturer is not guaranteed or endorsed by the publisher.