 Feng-Xia Wang1,†
 Shuai Liu1,†
 Hao-Qiang Guo2
 Jia-Qing Yu1Jun Cui1Qi Cheng1Nilupaer Aisikeer1Fen Liu1Ming-Jun Duan3
 Xiang Xie1*
 Yi-tong Ma1,4*
- 1First Affiliated Hospital of Xinjiang Medical University, Urumqi, Xinjiang, China
- 2Department of Human Anatomy, School of Basic Medical Sciences, Xinjiang Medical University, Urumqi, Xinjiang, China
- 3Animal Experimental Center, Xinjiang Medical University, Urumqi, Xinjiang, China
- 4Xinjiang Key Laboratory of Cardiovascular Disease Research, Urumqi, Xinjiang, China
Objective: Aortic stenosis (AS) is a critical risk factor for the development of structural heart disease, and identifying its pathogenic genes will provide new insights into cardiac pathology and treatment.
Methods: “edgeR” was used to calculate differentially expressed genes (DEGs) for bulk-RNAseq. GO, KEGG, and GSEA analyses were performed on the DEGs. Aortic valves from 8 AS patients and 8 non-AS patients were collected for proteomic sequencing. After DEG analysis, five algorithms were used to identify hub genes. ROC curves were constructed for the hub genes. Single-cell RNA sequencing (scRNAseq) was applied to systematically elaborate the mechanism in AS pathogenesis.
Results: Transcriptome data showed that AS was accompanied by high expression of genes such as MMP9, CXCL8, and SPP1, with significant activation of hypoxia, inflammatory response, and fibrosis. Proteomic sequencing of calcified AS revealed significantly enhanced hypoxic response, TNF-α signaling, and extracellular matrix (ECM) formation. Sixteen hub genes, including ITGB3, ITGAV, and MMP9, were identified by five algorithms, all with high diagnostic efficacy (AUC > 0.75). PCR experiments confirmed that MMP9 and PLAU were highly expressed in calcified aortic valves (P < 0.05). scRNAseq revealed that in highly calcified regions, MMP9 and PLAU were mainly distributed in endothelial cells, monocytes, and macrophages, participating in the differentiation of monocytes and macrophages and relating to lipid metabolism and proinflammatory responses.
Conclusion: The 16 hub genes can assist in the diagnosis of aortic stenosis, and MMP9 and PLAU may participate in AS development by regulating the proinflammatory effects of monocytes and macrophages.
Introduction
Aortic stenosis (AS) is a cardiac valvular disease caused by structural abnormalities of the aortic valve, leading to left ventricular outflow tract obstruction, primarily manifested as leaflet thickening, calcification, and limited mobility. In structural heart diseases, AS accounts for approximately 25%–30%, with a significantly increasing prevalence with age—the prevalence of severe AS in individuals over 75 years old reaches 3%–5% (1). The 5-year mortality rate of untreated severe AS patients exceeds 50%, and the 2-year mortality rate is as high as 50%–80% when combined with heart failure symptoms (2). Its pathological features include valvular fibrocalcification (calcium deposition in leaflets and annulus), congenital bicuspid aortic valve malformation (accounting for 30%–50% of AS cases), and inflammation-mediated extracellular matrix remodeling (3). Major risk factors include age, bicuspid aortic valve, hypertension, hyperlipidemia, chronic kidney disease, and metabolic syndrome (4).
The etiology of AS is complex, involving multi-level pathological mechanisms. At the tissue level, degenerative calcification is the most common cause (accounting for >80% of elderly patients), characterized by rupture of leaflet collagen fibers, lipid deposition, and abnormal aggregation of hydroxyapatite crystals, leading to valve thickening and stiffness (5). Congenital bicuspid aortic valve is an important inducer (30%–50% of AS cases), whose abnormal blood flow shear stress accelerates valve fibrosis and calcification (4). Stimulated by inflammatory factors and oxidative stress, valvular interstitial cells differentiate into osteoblast-like cells by activating the Runx2/BMP2 signaling pathway, promoting calcium nodule formation (6). Additionally, macrophage infiltration releases matrix metallo-proteinases (MMPs) that degrade the extracellular matrix (ECM), further exposing calcification sites (7).
Calcification in AS primarily occurs on the ventricular side of the leaflets and the fibrosa layer, with its distribution closely related to local biomechanics and molecular microenvironment. The latest histopathological study (8) shows that AS calcification originates in the collagen fiber rupture zone of the fibrosa layer, then spreads along stress-concentrated regions (ventricular side), forming multifocal hydroxyapatite deposits. High-resolution micro-CT reveals that calcification density on the ventricular side is 3–5 times higher than that on the aortic side. Especially in patients with bicuspid aortic valve (BAV), abnormal blood flow shear stress directly enhances endothelial injury on the ventricular side and activates the osteogenic phenotype of valvular interstitial cells (VICs) (9). Single-cell RNA sequencing further reveals that ventricular-side VICs highly express osteogenic differentiation markers (such as RUNX2, BMP2), accompanied by macrophage infiltration releasing IL-1β and TGF-β to drive the fibrocalcification cascade (10). Additionally, studies based on hydrodynamic simulations indicate that the ventricular side, subject to higher cyclic tensile stress (>50 kPa), promotes the expression of calcification-related genes through the integrin-ERK1/2 pathway (11).
This study first performed a combined analysis of RNA-seq data from two groups of aortic calcification patients, collected clinical patient samples for proteomic sequencing, identified hub genes using five algorithms and combined them with RNA-seq analysis, and finally used single-cell transcriptome sequencing data to explore the mechanism by which genes participate in the occurrence of aortic calcification.
Methods
Transcriptome data download and preprocessing
GSE51472 and GSE12644 were downloaded from the GEO database (12, 13). GSE51472 included 5 control, 5 sclerotic, and 5 calcified samples, while GSE12644 included 10 control and 10 calcified samples. In R software, Counts data were converted to FPKM and then log-normalized. Sample boxplots were plotted to assess the degree of normalization.
Differentially expressed gene analysis and GSEA
“edgeR” (14) was used to calculate gene expression changes, and DEGs were screened with the threshold of Log2|FC| ≥ 1 and adjusted P-value <0.05. “msigdbr” (15) was used for gene set enrichment analysis (GSEA) of DEGs, and “enrichplot” was used to plot the top-ranked terms.
PPI network construction, GO and KEGG analysis
The STRING database (16) was used to construct the protein-protein interaction (PPI) network of DEGs, and Cytoscape software (17) was used to visualize the interaction relationships between genes. “clusterProfiler” (18) was used for GO and KEGG pathway analysis using a significance cutoff of P < 0.05, and the SRPLOT platform (19) was used to visualize the relevant enriched terms.
Patient sample collection and proteomic sequencing
The aortic valve tissues of patients with aortic regurgitation (control) and AS in the hospital from January to April, 2024 were collected. Among them, the organization acquisition method is implemented in accordance with relevant guidelines and regulations, and it is confirmed that all subjects and/or their legal guardians have obtained informed consent. This project was approved by the Xinjiang Uygur Autonomous Region People's Hospital (KY2024030102). Aortic valve tissues were washed with pre-cooled saline within 10 min to remove blood residues. Leaflets were separated, tissues were cut into small pieces (<0.2 cm3), snap-frozen in liquid nitrogen, and stored at −80 °C. After thawing, tissues were soaked in decalcification solution (4 °C, 24–48 h), with fresh solution replaced every 6 h. After decalcification, tissues were ground into powder with liquid nitrogen, and interference was removed by differential centrifugation. Protein expression was detected by liquid chromatography-mass spectrometry (LC-MS/MS), and MaxQuant was used to match mass spectrometry data to the protein database.
HE staining and alizarin Red staining
The HE staining procedure for aortic valve tissues included: formalin fixation for 24–48 h, dehydration (gradient ethanol treatment), transparency (xylene), paraffin embedding, and sectioning; the staining process included dewaxing and rehydration, hematoxylin nuclear staining for 5–10 min, hydrochloric acid-ethanol differentiation, water reblueing, eosin cytoplasm staining for 1–2 min, followed by gradient ethanol dehydration, xylene transparency, and neutral gum sealing for microscopic observation of cell morphology and collagen fiber structure.
The alizarin red staining procedure for aortic valve tissues was: dewaxing sections to water, staining in alizarin red S solution for 5–10 min, washing with running water to remove floating color; counterstaining nuclei with hematoxylin for 30 s, hydrochloric acid-ethanol differentiation, water reblueing, gradient ethanol dehydration, xylene transparency, and neutral gum sealing.
Identification of key gene modules and Hub genes
The MCODE algorithm (20) was used to identify key modules in the PPI network. Five algorithms in Cytohubba (21) were used to detect the top 30 key genes in the PPI network. UpSet (22) was used to visualize the overlap of the five algorithms.
ROC curve, transcriptional regulation, and m6A modification prediction
The SRPLOT platform was used to construct ROC curves for proteomic sequencing data. The TRRUST database (23) was used to predict transcription factors of hub genes, and the M6A2Target database (24) was used to predict m6A-modified genes of hub genes.
PCR experiments
PCR experiments were performed to detect the mRNA expression levels of MMP9 and PLAU in aortic valve tissues. Specific steps: frozen tissues were ground in liquid nitrogen, lysed using an RNA extraction kit, centrifuged to remove impurities, and total RNA was purified by binding to an RNA adsorption column. Reverse transcription was performed according to the Takara PrimeScript RT Master Mix instructions (42 °C for 15 min, 85 °C for 5 s to inactivate), synthesizing cDNA; qPCR amplification was performed using Takara SYBR Premix Ex Taq (95 °C pre-denaturation for 30 s, 40 cycles: 95 °C for 5 s, 60 °C for 30 s). Melting curves were used to verify product specificity, and the relative expression of target genes was calculated. The primer sequences as shown in Table 1.
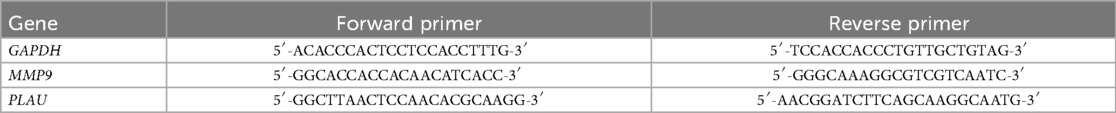
Table 1. Information on gene primer sequences.
Single-cell transcriptome data preprocessing and DEG analysis
Published single-cell transcriptome data (GSE220774) (25) from aortic calcification patients were collected, including single-cell transcriptome data from three regions (fibrosa layer, ventricular layer, and intermediate layer/remaining layer) of five patients. Data preprocessing strictly followed the Seurat official recommended pipeline (26), including filtering low-quality cells and noise genes, data normalization, identification of highly variable genes, principal component analysis for dimensionality reduction, Louvain clustering algorithm for cell subset identification, cell type annotation using “SingleR” and “Cellmarker” (27, 28), and finally “FindMarkers” for DEG analysis between different cell populations.
Cell pseudotime analysis
Cell pseudotime analysis maps single-cell transcriptome data to a low-dimensional space, constructs developmental or differentiation trajectories between cells, and infers dynamic changes in cell states. Monocle3 (29) was used to analyze the differentiation trajectories of monocytes and macrophages, which assigns a “pseudotime” value to each cell, identifies differential gene modules along the trajectory, reveals differentiation-driving genes and branching events, and finally visualizes time-dependent gene expression patterns through trajectory plots. The specific steps include using DDRTree to reduce dimensionality, sort and map cells, and the built-in Branched expression analysis modeling (BEAM) is used to assist in branch judgment.
Results
Activation of inflammatory and fibrosis in aortic sclerosis and calcification
After gene annotation and normalization of the GSE51472 dataset (Figure 1A), comparison of gene expression between the control group and aortic sclerosis group showed that aortic sclerosis had minimal impact on gene expression (Figure 1B), but activated proinflammatory signals (IL-6-STAT3, TNF-α, and IL-2-STAT5), hypoxic signals, and fibrosis (epithelial-mesenchymal transition) (Figure 1C). Compared with the control group, aortic calcification patients had significantly upregulated collagen molecules (COL1A1 and SPP1), proinflammatory molecules (CXCL13, TNFRSF17, and S100A8), and matrix metalloproteinase (MMP) family genes (Figure 1D). Meanwhile, GSEA results for aortic calcification and sclerosis were consistent (Figures 1C,E), and the PPI network of upregulated genes showed that integrins and proinflammatory factors played important roles (Figure 1F). Two key modules were identified by the MCODE algorithm (Figure 1G), both related to inflammatory responses such as cytokine production, Toll-like receptor pathway, cell chemotaxis, and NF-κB signaling pathway (Figures 1H,I). This suggests that the accumulation of extracellular matrix (ECM) and the local inflammatory microenvironment may jointly promote the formation of aortic calcification.
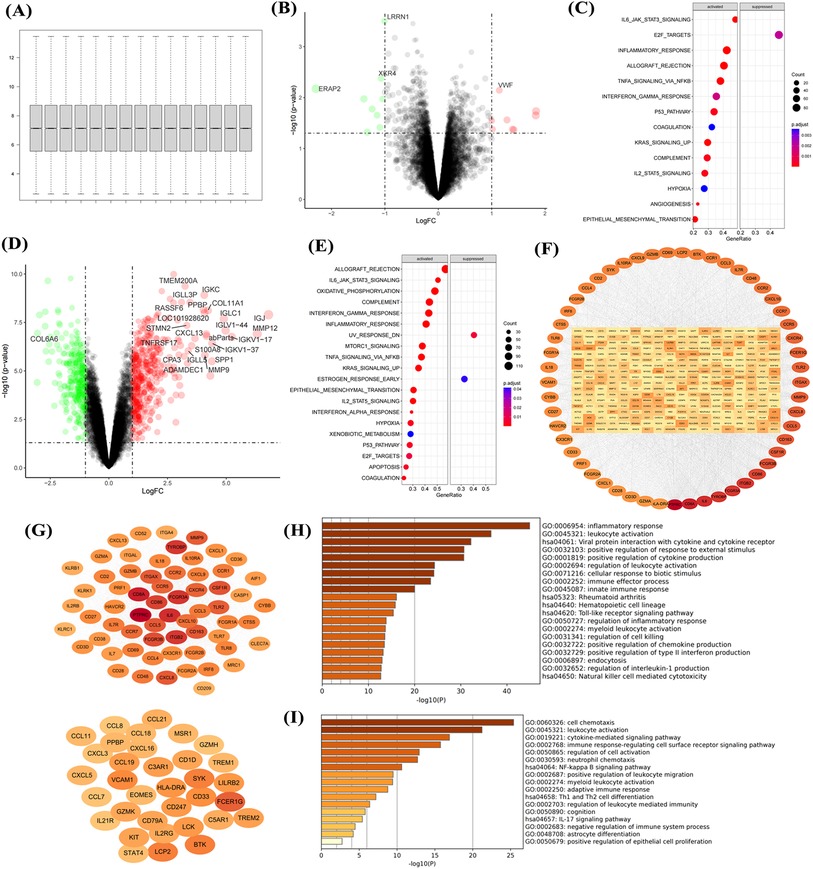
Figure 1. Transcriptional dysregulation in aortic calcification. Sample normalization of the GSE51472 dataset (A), DEGs in aortic sclerosis patients compared with controls (B), and gene set enrichment analysis (C); DEGs in aortic calcification patients (D), GSEA (E), PPI network (F), networks of the top two key gene modules (G), and enrichment analysis of key modules (H,I). Sample size: Control group (n = 5); AS group (n = 5).
Upregulation of cell chemotaxis and ECM formation in aortic calcification
Normalization of the GSE12644 dataset (Figure 2A) showed that aortic calcification significantly increased genes such as MMP9, MMP12, and SPP1 compared with the control group (Figure 2B), which are involved in inflammatory response and fibrosis progression (Figure 2C). Construction of the PPI network revealed that upregulated MMP9, SPP1, and COL3A1 were in central positions (Figure 2D). Similar to the GSE51472 dataset, these DEGs were mainly related to extracellular matrix formation, cell chemotaxis, and cytokine production (Figure 2E). Intersection analysis of the two datasets identified 31 genes significantly upregulated in aortic calcification (Figure 2F), with MMP9, CXCL8, SPP1, and PLAU ranking among the top (Figures 2G,H). GO and KEGG enrichment analyses showed that intersection genes were related to cell chemotaxis and ECM formation, consistent with the pathological changes in the overall valve tissue (Figure 2I).
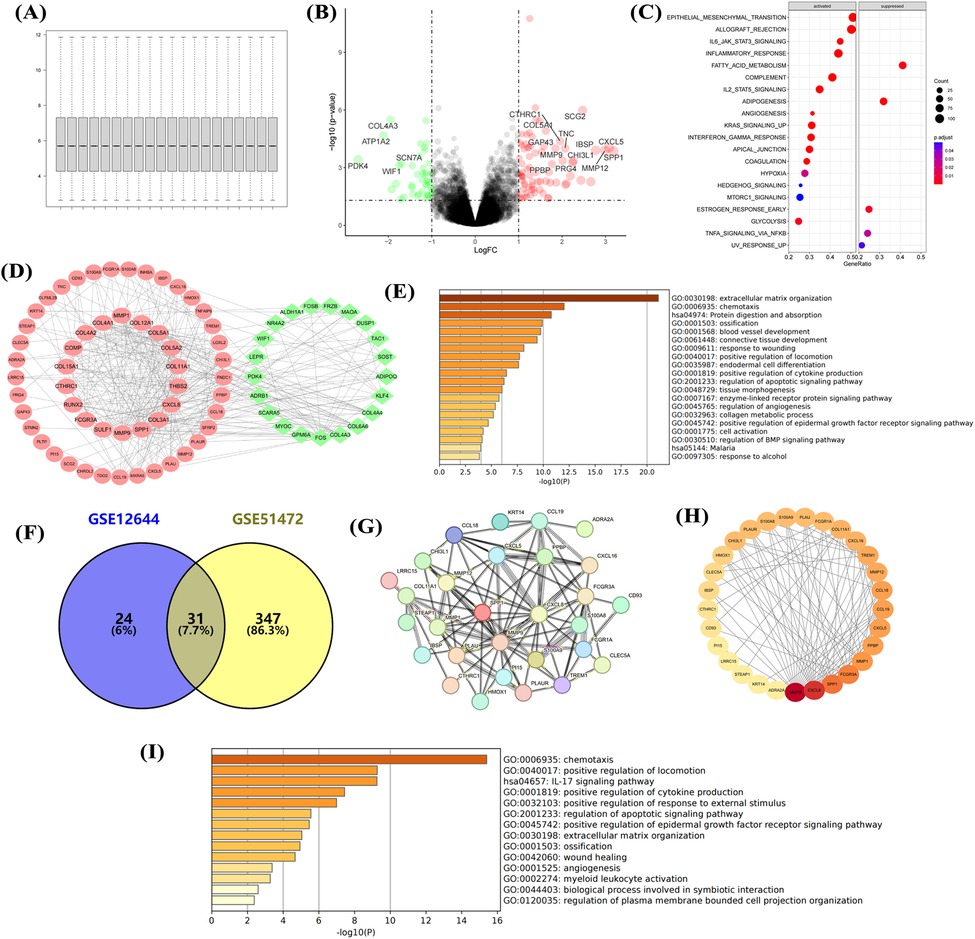
Figure 2. Transcriptional dysregulation in aortic calcification. Sample normalization of the GSE12644 dataset (A), DEGs in aortic calcification patients compared with control group (B), GSEA (C), PPI network (D), and GO/KEGG enrichment analysis (E); identification of intersection genes, PPI network (G,H), and GO/KEGG enrichment analysis (I). D: Red for upregulated genes, green for downregulated genes; H: Ranked by Degree, with darker colors indicating higher ranks. Sample size: Control group (n = 10); AS group (n = 10).
Collection of as patients and proteomic sequencing
Eight aortic valves from patients with aortic regurgitation (control) and eight from AS patients were collected, with basic information listed in Supplementary Table S1. HE staining of valve tissues showed that collagen fibers (red) in the control group were neatly arranged at 100× magnification (Figure 3A), while those in AS patients showed disorganized collagen fibers with extensive blue-violet calcium salt deposition (Figure 3B). Alizarin red staining showed that normal valve tissues had almost no red staining and aggregation (Figure 3C), while AS valves had abundant red complexes with minimal adhesion at junctions (Figure 3D). Aortic calcification is accompanied by the activation of tissue fibrosis, yet its driving factors remain to be comprehensively evaluated.
Figure 3. He and alizarin red staining. HE and alizarin red staining of tissues from non-stenotic (A,C) and stenotic (B,D) aortic valves.
Proteomic characteristics of AS
Since proteins are the primary executors of cellular functions, proteins were collected and subjected to proteomic sequencing in this study. After proteomic sequencing of 16 samples, gene annotation and normalization were performed (Figure 4A). DEGs showed significant upregulation of proteins such as COL10A1, THBS2, and S100A8 (Figure 4B). Heatmaps showed stable high expression of COL10A1, S100P, and ITGA2B in AS (Figure 4C), with these DEGs involved in inflammatory response, hypoxia, and fibrosis (Figure 4D), consistent with transcriptomic data. GO enrichment analysis showed these genes were related to ECM formation, interleukin and chemokine production (Figure 4E), as well as pathways such as complement and coagulation cascades, and ECM-receptor interaction (Figure 4F). The PPI network showed that dysregulated genes were primarily upregulated (Figure 4G), participating in processes such as wound healing response, ECM formation, and cell chemotaxis (Figure 4H). This further confirms that immune cell activation and fibrosis are risk factors for aortic calcification.
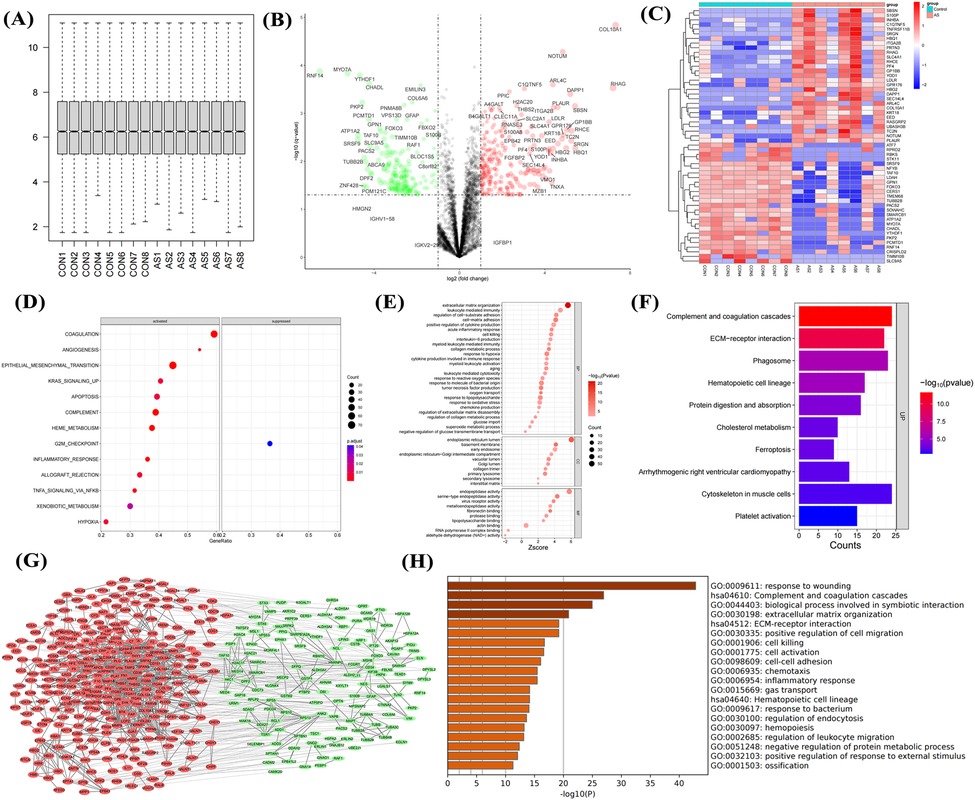
Figure 4. Proteomic sequencing analysis of aortic valves from non-stenotic and stenotic patients. Quality control (A), volcano plot (B) and heatmap (C) of DEGs, GSEA (D), GO (E) and KEGG analysis (F), PPI network (G), and enrichment analysis of upregulated genes (H) Sample size: Control group (n = 8); AS group (n = 8).
Identification and expression validation of hub genes
To identify the driving factors that drive aortic calcification, five algorithms were used to calculate the top 30 genes in the DEG network, with overlapping genes defined as hub genes. Sixteen hub genes were obtained (Figure 5A), significantly enriched in processes such as ECM-receptor interaction, damage response, and leukocyte migration (Figure 5B). Analysis of hub gene expression in proteomic data showed upregulation in AS (Figure 5C), while in datasets GSE12644 and GSE51472, only MMP9, PLAU, THBS2, and SERPINE1 had significantly increased mRNA expression in calcified aortic valves (P < 0.05, Figures 5D,E).
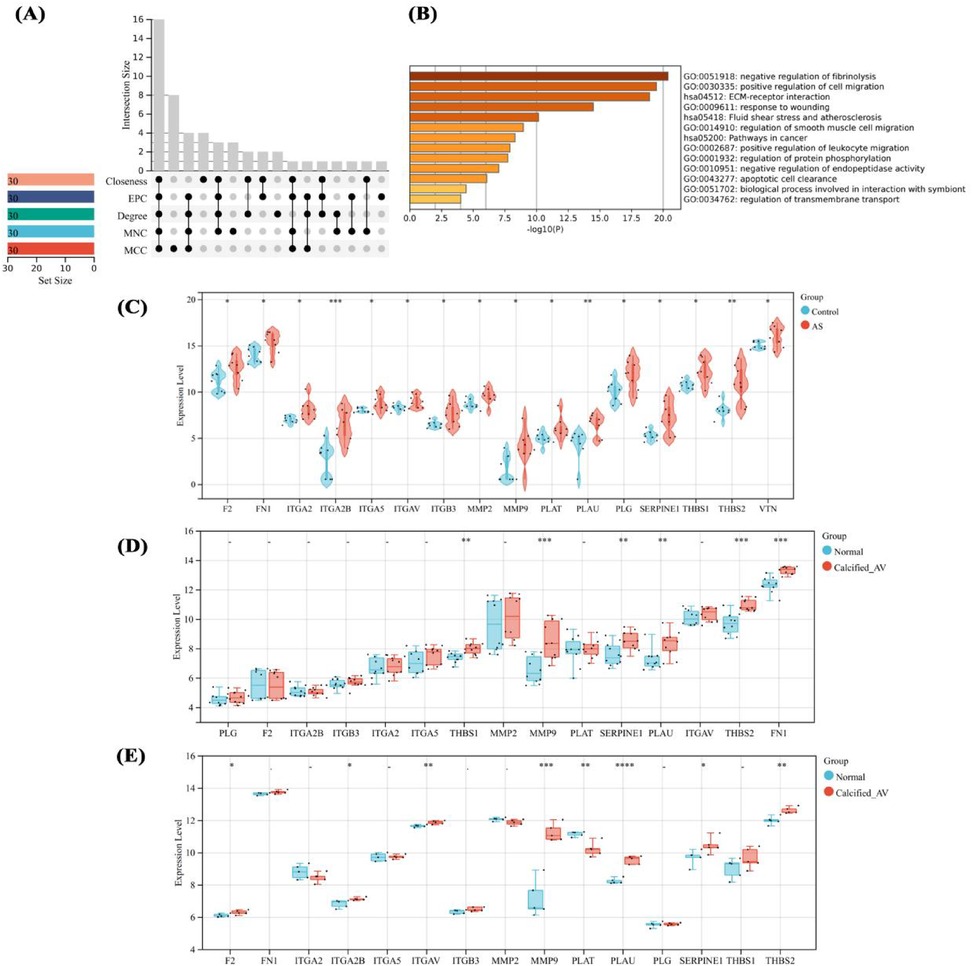
Figure 5. Identification and expression analysis of hub genes. Hub gene identification by multi-algorithms (A), enrichment analysis of hub genes (B), expression analysis of hub genes in proteomic sequencing (C), and their expression in GSE12644 and GSE51472 datasets (D,E). differences in mean values between the control group and AS group were analyzed using an independent samples t-test. Statistical significance was set at P < 0.05.
Diagnostic efficacy of hub genes and prediction of gene regulatory network
To clarify the important value of the identified genes, 16 hub genes were predicted AS in proteomic data. 13 hub genes including ITGA2B, THBS2, and MMP9 had ROC values >0.8, indicating good diagnostic efficacy in distinguishing AS (Figure 6A). To clarify the regulation of hub genes, transcription factors were predicted, identifying 33 TFs with regulatory relationships to hub genes (Figure 6B), but these TFs had no impact on the high expression of hub genes (Figure 6C). m6A modification prediction showed that hub genes such as MMP9 and PLAU were regulated by 29 m6A enzymes (Figure 6D), with significantly reduced protein expression levels of RBMX, YTHDF1, and HNRNPC (P < 0.05, Figure 6E). Intersection of aortic calcification intersection genes (transcriptome) and hub genes (proteome) yielded two genes, PLAU and MMP9 (Figure 6F). qPCR results showed significantly higher mRNA expression of PLAU and MMP9 in AS compared with controls (Figures 6G,H).
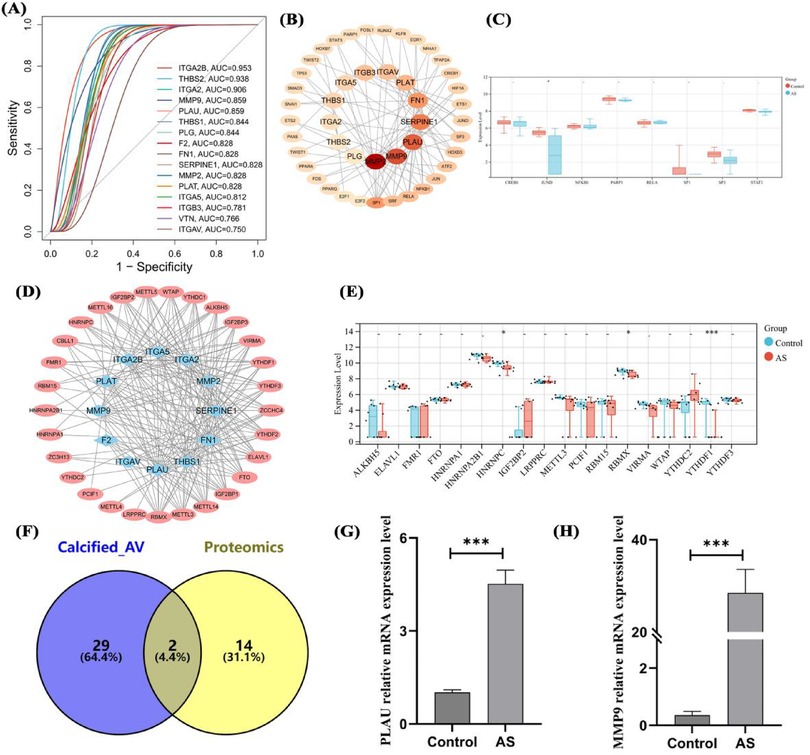
Figure 6. Diagnostic efficacy, transcriptional regulation, RNA modification, and expression validation of hub genes. ROC curves of hub genes in proteomics (A), transcriptional regulatory network (B) and expression analysis (C) of hub genes, m6A modification (D) and expression analysis (E) of hub genes, intersection analysis of transcriptomic DEGs and hub genes (F), and mRNA expression validation of overlapping genes (G,H). Sample size: Control group (n = 8); AS group (n = 8). differences in mean values between the control group and AS group were analyzed using an independent samples t-test. Statistical significance was set at P < 0.05.
Expression analysis of genes in different cells of aortic calcification patients
To clarify the molecular mechanism of PLAU and MMP9 in aortic calcification, published patient single-cell transcriptome data (GSE220774) were collected and characterized. In sequencing data, the number of RNAs showed no significant correlation with mitochondrial proportion (Figure 7A) but a high correlation with RNA features (Figure 7B), indicating high data quality. Cell annotation identified endothelial cells, macrophages, monocytes, smooth muscle cells, and T cells (Figure 7C), distributed across different fibro-calcification (FC) scores (Figure 7D). In total smooth muscle cells, PLAU and MMP9 expression had no obvious correlation with FC scores, with PLAU mainly highly expressed in ventricular-side smooth muscle cells of highly calcified regions (Figure 7E). In both overall and region-specific T cells, the two genes were mainly expressed in T cells of moderately calcified regions (Figure 7F). In endothelial cells, PLAU was highly expressed in ventricular-side endothelial cells of calcified regions (Figure 7G). In both overall and regional analyses, PLAU and MMP9 were significantly highly expressed in macrophages of highly calcified regions (Figure 7H), and monocytes, similar to endothelial cells, had PLAU highly expressed in ventricular-side monocytes of calcified regions (Figure 7I). This suggests that the high expression of the two genes may be associated with the immune cell activation identified in the bulk-RNA data.
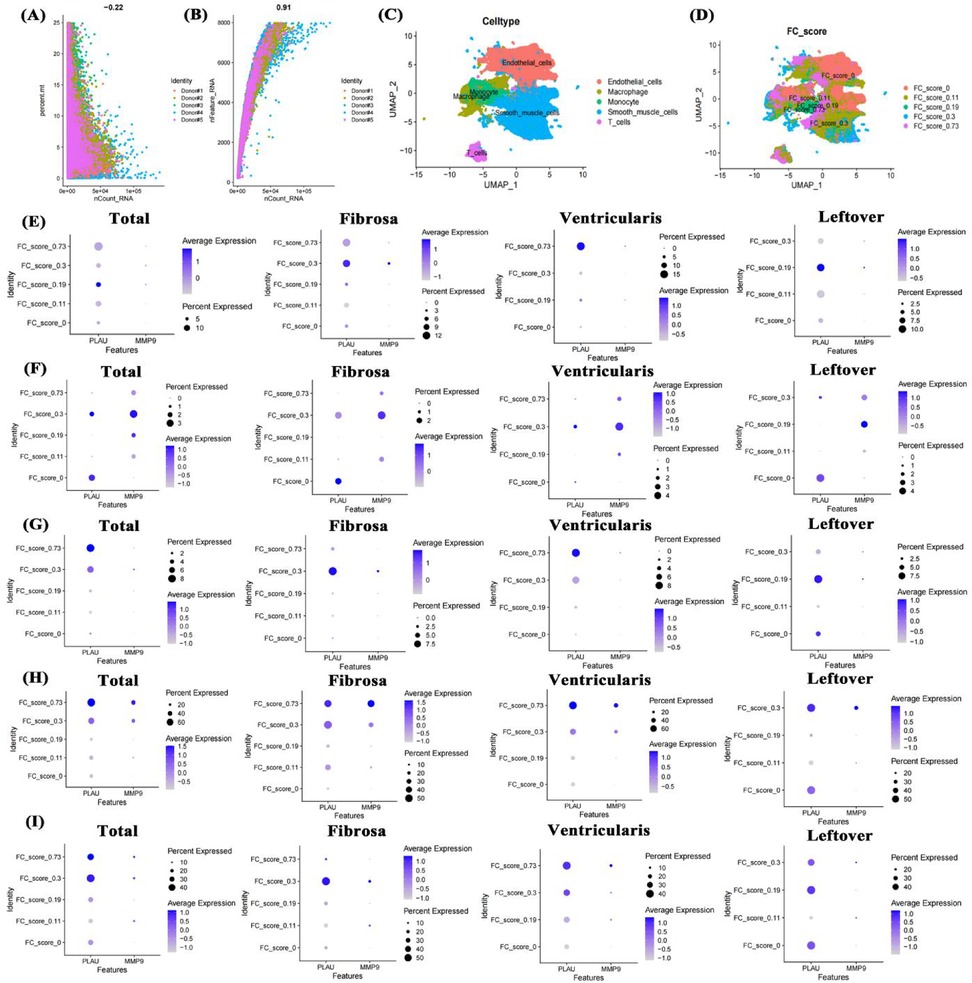
Figure 7. Single-cell transcriptome data analysis of valve calcification patients. Data quality control (A,B), UMAP of cell annotation and calcification scores (C,D), expression of PLAU and MMP9 in smooth muscle cells, T cells, endothelial cells, macrophages, and monocytes across different FC scores and positions (E–I). FC score: fibro-calcification score.
Impact of fibro-calcification score on cell functions in aortic calcification
To clarify the impact of fibrosis on different cells, the study conducted a systematic analysis of 5 cell types in different regions separately. In smooth muscle cells, higher FC scores were associated with significant changes in cardiac valve morphology, glycolysis, damage repair, TGF-β signaling pathway, and HIF-1 signaling pathway compared with lower FC scores (Figure 8A). In T cells with higher FC scores, cytokine production, T cell receptor signaling pathway, NF-κB signaling pathway, and HIF-1 signaling pathway were significantly altered compared with lower scores (Figure 8B). In different regions of the aortic valve, highly calcified endothelial cells showed significant upregulation of TNF signaling pathway, MAPK signaling pathway, endothelial cell development, and response to oxidative stress (Figure 8C). In macrophages, the highly calcified fibrosa layer showed stronger proinflammatory signals (Figure 8D). Similar to macrophages, monocytes in the highly calcified fibrosa layer also showed enhanced proinflammatory signals (Figure 8E), possibly an important factor in their differentiation into macrophages.
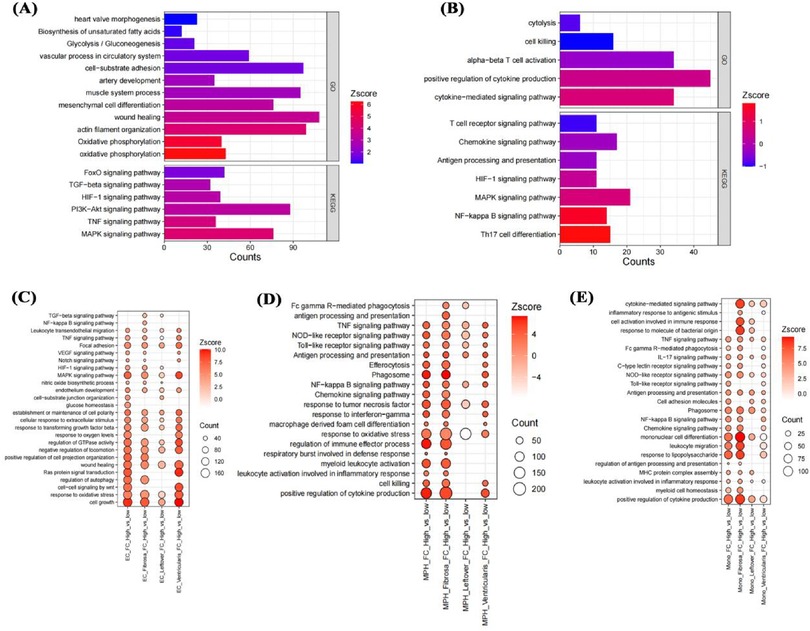
Figure 8. Impact of fibro-calcification score on cell functions. Effects of FC score on smooth muscle cell and T cell functions in the fibrosa layer (A,B); effects on endothelial cell, macrophage, and monocyte functions in the fibrosa layer, mixed remaining layer, and ventricular layer (C–E).
Impact of genes on functions of different cells in aortic calcification
Given the high expression of PLAU and MMP9 in macrophages and monocytes of highly calcified regions, pseudotime analysis was used to clarify their roles. In monocytes, initial positions of the differentiation trajectory were mainly cells not expressing PLAU and MMP9, while terminal positions were cells expressing both genes (Figures 9A,B). Similar to monocytes, initial-position cells in macrophage differentiation trajectories did not express PLAU and MMP9, while terminal cells mainly expressed these genes (Figures 9C,D). Compared with cells not expressing PLAU, PLAU-expressing cells had enhanced chemotaxis, migration, and inflammatory responses (Figure 9E). Compared with cells not expressing MMP9, MMP9-expressing cells showed enhanced lipid transport and small-molecule metabolism (Figure 9E). Therefore, these two genes may play different roles in the functions of monocytes and macrophages.
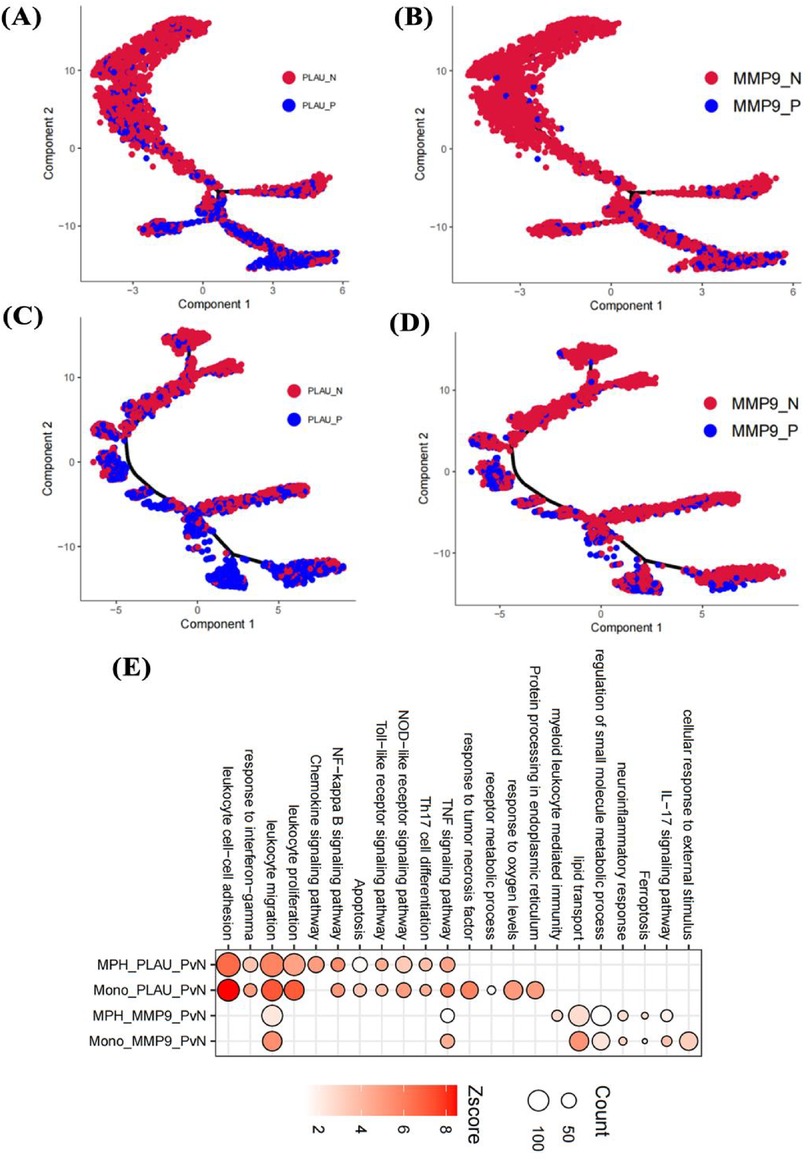
Figure 9. Effects of genes on cell pseudotime and functions. Impact of PLAU and MMP9 on differentiation trajectories of monocytes (A,B) and macrophages (C,D); effects on functions of endothelial cells, monocytes, and macrophages in the fibrosa layer (E).
Discussion
AS is considered an active disease, mainly divided into initiation and propagation stages (30). The former is primarily characterized by endothelial cell injury and low-density lipoprotein accumulation in the valve, stimulating monocyte infiltration and differentiation into macrophages (31). Early aortic valve macrophages recruit other immune cells to further exacerbate endothelial injury, consistent with the enhanced inflammatory response in early aortic sclerosis found in this study. Meanwhile, enhanced TNF signaling pathway and oxidative stress response in endothelial cells of highly calcified aortic valves also reflect immune cell stimulation. In the propagation stage, valve fibrosis and calcification are key triggers for AS (32). In different structural heart diseases, fibrosis is an important driver of heart failure (33). This study found significant increases in fibrosis-related genes and ECM formation in AS patients through two RNA-seq datasets and proteomic sequencing. Current research indicates that hypoxia-induced glycolysis is an important factor in disease deterioration, widely involved in tissue fibrosis (34). This study also found activation of the HIF-1 signaling pathway in the transcriptome, proteome, and single-cell transcriptome of AS patients, suggesting it may be a potential therapeutic target for AS.
Most current studies primarily use transcriptomics to identify AS pathogenic genes, but since proteins are the direct executors of biological functions, this study combined transcriptomics from public databases with proteomic sequencing. At the transcriptional level of aortic valve tissue, DEGs and biological functions of aortic calcification were analyzed independently, and genes from important modules were intersected to obtain robust candidates. Numerous studies have shown that MMPs are involved in ECM formation (35), which was also observed in the AS transcriptome. Consistent with current views, this study found that immune cells characterized by upregulated chemokines and proinflammatory factors actively participate in AS progression, indicating an important role of immune cells in AS fibrosis. At the protein level of aortic valve tissue, calcified AS patients showed enhanced fibrosis and inflammation. Identification of 16 hub genes through multi-algorithms revealed that 13/16 had high diagnostic efficacy, promising for histopathological diagnosis. Surprisingly, only 4/16 genes showed consistent mRNA and protein levels, but this partially avoids the limitations of single-omics analysis. The study finally found that MMP9 and PLAU showed significantly increased mRNA and protein levels after AS occurrence. Notably, due to the difficulty in collecting samples from patients with AS, this study used 8 samples per group for proteomic sequencing, which to a certain extent increases the risk of false positives. To address this limitation, verification was performed on patient tissues with 3 samples per group. It is worth noting that the heterogeneity in smoking, alcohol consumption, and coronary artery disease among the patients included in the study for proteomic sequencing may have a potential impact on the expression profiles. For instance, patients with AS group had lower rates of smoking and alcohol consumption, which might have resulted in the absence of observations related to inflammatory factors and oxidative stress in their protein expression profiles (36). Additionally, patients with AS group had a higher prevalence of a history of coronary artery disease, which could have led to an overemphasis on biological responses associated with ischemia and hypoxia (37). However, since the identified hub genes were not directly associated with reduced inflammation-oxidative stress or enhanced ischemia-hypoxia, the adverse effects caused by these baseline differences were significantly mitigated.
Tissue-level transcriptomics and proteomics are widely used for biomarker development, but their mechanistic research remains to be further explored. Current studies have found that MMP9 and PLAU are involved in extracellular matrix formation, mainly produced by fibroblasts (35, 38). This study, through single-cell transcriptomics, found that MMP9 and PLAU are not highly expressed in smooth muscle cells and T cells of highly calcified regions but are mainly associated with endothelial cells, monocytes, and macrophages. This suggests that these two genes may be involved in endothelial cell injury and early immune activation of monocyte-macrophages in aortic calcification. Using pseudotime analysis, we verified that the expression of MMP9 and PLAU is involved in the differentiation process of monocytes and macrophages. Meanwhile, lipid metabolism is a hallmark of activated macrophages—a characteristic also observed in the MMP9+ monocyte/macrophage population identified in the present study. Previous studies (39) have established that upon migrating to the valvular region, monocytes differentiate into macrophages; these macrophages then secrete proinflammatory factors to recruit additional monocytes. This pathological cascade may be linked to the enhanced chemotaxis of PLAU+ monocytes and the amplified inflammatory response of MMP9+ macrophages, as documented in our research. Consequently, MMP9 and PLAU hold promise as potential synergistic targets for anti-inflammatory interventions against AS. Notably, MMP9 and PLAU display higher expression in monocytes residing within the calcified ventricularis layer—a valvular region exposed to substantial mechanical stress. This observation suggests that the expression of these two genes may be modulated by mechanical stress, thereby indirectly contributing to valvular calcification under high-pressure conditions. It further implies the existence of a more robust monocyte-macrophage activation loop within the ventricularis layer, which could exacerbate the progression of AS-related valvular pathology.
An observational study showed that in pediatric patients, circulating MMPs, including MMP9, can be used to predict aortic dilation associated with bicuspid aortic valves (40). Given that both aortic valve calcification and dilation present an inflammatory phenotype, MMP9 may also serve as a marker for the progression of valvular calcification. PLAU is a chronic inflammatory marker; studies using GWAS analysis have revealed that it exhibits high variability in blood samples, suggesting it could be a crucial observation indicator (41). However, further research is needed to explore its role in patients with calcific aortic stenosis. Since there are certain differences in smoking, alcohol consumption, and other aspects between the two groups of patients enrolled in this study, a comprehensive assessment combining imaging examinations and other biomarkers is required in clinical application to improve the accuracy of diagnosis.
In conclusion, this study screened 16 hub genes from the proteome that can assist in AS diagnosis. Combining bulk RNA-seq and scRNA-seq, it was found that MMP9 and PLAU are mainly related to the immune activation of monocytes and macrophages in aortic valve calcification, providing new insights for early AS treatment.
Data availability statement
The original contributions presented in the study are publicly available. This data can be found here: .Bulk-RNAseq (accession numbers: GSE51472 and GSE12644) and scRNAseq (accession numbers: GSE220774) data are available in GEO database. The proteomics data has been uploaded to the iProX database, with the access ID IPX0012811001.
Ethics statement
The studies involving humans were approved by the Ethics Committee of People's Hospital of Xin jiang Uygur Autonomous Region (No. KY2024030102). The studies were conducted in accordance with the local legislation and institutional requirements. The participants provided their written informed consent to participate in this study.
Author contributions
F-XW: Writing – original draft, Funding acquisition, Data curation, Methodology, Conceptualization, Resources, Investigation, Formal analysis, Validation. SL: Data curation, Methodology, Writing – original draft, Formal analysis. H-QG: Investigation, Writing – original draft, Formal analysis, Methodology. J-QY: Methodology, Writing – original draft, Investigation, Data curation, Formal analysis. JC: Data curation, Formal analysis, Writing – original draft, Investigation, Conceptualization. QC: Software, Investigation, Writing – original draft, Conceptualization, Formal analysis. NA: Conceptualization, Investigation, Writing – original draft. FL: Writing – original draft, Formal analysis, Project administration, Methodology. M-JD: Formal analysis, Conceptualization, Methodology, Writing – original draft. XX: Supervision, Writing – review & editing, Conceptualization, Methodology, Project administration. Y-tM: Project administration, Writing – review & editing, Supervision.
Funding
The author(s) declare that financial support was received for the research and/or publication of this article. This study is supported by Tianshan Talent Training Program of Xinjiang Uygur Autonomous Region (No. 2022TSYCLJ0067), the Program of High-level Medical and Health Talents in the “Tianshan Yingcai” Project of the Third Batch of the “2 + 5” Key Talent Plan in Xinjiang Uygur Autonomous Region-Young and Middle-aged Backbone Medical Talents (No. TSYC202401B073), National Natural Science Foundation of China- Regional Project (No. 82260071) and National Natural Science Foundation of China- Regional Project (No.82460068).
Conflict of interest
The authors declare that the research was conducted in the absence of any commercial or financial relationships that could be construed as a potential conflict of interest.
Generative AI statement
The author(s) declare that no Generative AI was used in the creation of this manuscript.
Any alternative text (alt text) provided alongside figures in this article has been generated by Frontiers with the support of artificial intelligence and reasonable efforts have been made to ensure accuracy, including review by the authors wherever possible. If you identify any issues, please contact us.
Publisher's note
All claims expressed in this article are solely those of the authors and do not necessarily represent those of their affiliated organizations, or those of the publisher, the editors and the reviewers. Any product that may be evaluated in this article, or claim that may be made by its manufacturer, is not guaranteed or endorsed by the publisher.
Supplementary material
The Supplementary Material for this article can be found online at: https://www.frontiersin.org/articles/10.3389/fcvm.2025.1640014/full#supplementary-material
References
1. Nkomo VT, Gardin JM, Skelton TN, Gottdiener JS, Scott CG, Enriquez-Sarano M. Burden of valvular heart diseases: a population-based study. Lancet. (2006) 368(9540):1005–11. doi: 10.1016/S0140-6736(06)69208-8
2. Otto CM, Nishimura RA, Bonow RO, Carabello BA, Erwin JP, Gentile F, et al. 2020 ACC/AHA guideline for the management of patients with valvular heart disease: a report of the American College of Cardiology/American Heart Association joint committee on clinical practice guidelines. J Am Coll Cardiol. (2021) 77(4):e25–197. doi: 10.1016/j.jacc.2020.11.018
3. Blaser MC, Bäck M, Lüscher TF, Aikawa E. Calcific aortic stenosis: omics-based target discovery and therapy development. Eur Heart J. (2025) 46(7):620–34. doi: 10.1093/eurheartj/ehae829
4. Mathieu P, Bossé Y, Huggins GS, Corte AD, Pibarot P, Michelena HI, et al. The pathology and pathobiology of bicuspid aortic valve: state of the art and novel research perspectives. J Pathol Clin Res. (2015) 1(4):195–206. doi: 10.1002/cjp2.21
5. Rajamannan NM, Evans FJ, Aikawa E, Grande-Allen KJ, Demer LL, Heistad DD, et al. Calcific aortic valve disease: not simply a degenerative process: a review and agenda for research from the national heart and lung and blood institute aortic stenosis working group. Executive summary: calcific aortic valve disease-2011 update. Circulation. (2011) 124(16):1783–91. doi: 10.1161/CIRCULATIONAHA.110.006767
6. Greenberg HZE, Zhao G, Shah AM, Zhang M. Role of oxidative stress in calcific aortic valve disease and its therapeutic implications. Cardiovasc Res. (2022) 118(6):1433–51. doi: 10.1093/cvr/cvab142
7. Kadoglou NP, Stasinopoulou M, Gkougkoudi E, Christodoulou E, Kostomitsopoulos N, Valsami G. The complementary effects of dabigatran etexilate and exercise training on the development and stability of the atherosclerotic lesions in diabetic ApoE knockout mice. Pharmaceuticals (Basel). (2023) 16(10):1396. doi: 10.3390/ph16101396
8. Gomes AV. Spatiotemporal multi-omics-derived atlas of calcific aortic valve disease. Circulation. (2018) 138(4):394–6. doi: 10.1161/CIRCULATIONAHA.118.035431
9. Gravina M, Casavecchia G, Manuppelli V, Totaro A, Macarini L, Di Biase M, et al. Mitral annular calcification: can CMR be useful in identifying caseous necrosis? Interv Med Appl Sci. (2019) 11(1):71–3. doi: 10.1556/1646.10.2018.47
10. Zhong G, Su S, Li J, Zhao H, Hu D, Chen J, et al. Activation of piezo1 promotes osteogenic differentiation of aortic valve interstitial cell through YAP-dependent glutaminolysis. Sci Adv. (2023) 9(22):eadg0478. doi: 10.1126/sciadv.adg0478
11. Zeng P, Yang J, Liu L, Yang X, Yao Z, Ma C, et al. ERK1/2 inhibition reduces vascular calcification by activating miR-126-3p-DKK1/LRP6 pathway. Theranostics. (2021) 11(3):1129–46. doi: 10.7150/thno.49771
12. Ohukainen P, Syväranta S, Näpänkangas J, Rajamäki K, Taskinen P, Peltonen T, et al. MicroRNA-125b and chemokine CCL4 expression are associated with calcific aortic valve disease. Ann Med. (2015) 47(5):423–9. doi: 10.3109/07853890.2015.1059955
13. Bossé Y, Miqdad A, Fournier D, Pépin A, Pibarot P, Mathieu P. Refining molecular pathways leading to calcific aortic valve stenosis by studying gene expression profile of normal and calcified stenotic human aortic valves. Circ Cardiovasc Genet. (2009) 2(5):489–98. doi: 10.1161/CIRCGENETICS.108.820795
14. Robinson MD, McCarthy DJ, Smyth GK. Edger: a bioconductor package for differential expression analysis of digital gene expression data. Bioinformatics. (2010) 26(1):139–40. doi: 10.1093/bioinformatics/btp616
15. Liberzon A, Birger C, Thorvaldsdóttir H, Ghandi M, Mesirov J, Tamayo P. The molecular signatures database (MSigDB) hallmark gene set collection. Cell Syst. (2015) 1(6):417–25. doi: 10.1016/j.cels.2015.12.004
16. Szklarczyk D, Gable AL, Lyon D, Junge A, Wyder S, Huerta-Cepas J, et al. STRING V11: protein-protein association networks with increased coverage, supporting functional discovery in genome-wide experimental datasets. Nucleic Acids Res. (2019) 47(D1):D607–13. doi: 10.1093/nar/gky1131
17. Shannon P, Markiel A, Ozier O, Baliga NS, Wang JT, Ramage D, et al. Cytoscape: a software environment for integrated models of biomolecular interaction networks. Genome Res. (2003) 13(11):2498–504. doi: 10.1101/gr.1239303
18. Yu G, Wang L-G, Han Y, He Q-Y. Clusterprofiler: an R package for comparing biological themes among gene clusters. OMICS. (2012) 16(5):284–7. doi: 10.1089/omi.2011.0118
19. Tang D, Chen M, Huang X, Zhang G, Zeng L, Zhang G, et al. SRplot: a free online platform for data visualization and graphing. PLoS One. (2023) 18(11):e0294236. doi: 10.1371/journal.pone.0294236
20. Bader GD, Hogue CW. An automated method for finding molecular complexes in large protein interaction networks. BMC Bioinform. (2003) 4:2. doi: 10.1186/1471-2105-4-2
21. Chin C-H, Chen S-H, Wu H-H, Ho C-W, Ko M-T, Lin C-Y. Cytohubba: identifying hub objects and sub-networks from complex interactome. BMC Syst Biol. (2014) 8(Suppl 4):S11. doi: 10.1186/1752-0509-8-S4-S11
22. Lex A, Gehlenborg N, Strobelt H, Vuillemot R, Pfister H. Upset: visualization of intersecting sets. IEEE Trans Vis Comput Graph. (2014) 20(12):1983–92. doi: 10.1109/TVCG.2014.2346248
23. Han H, Shim H, Shin D, Shim JE, Ko Y, Shin J, et al. TRRUST: a reference database of human transcriptional regulatory interactions. Sci Rep. (2015) 5:11432. doi: 10.1038/srep11432
24. Deng S, Zhang H, Zhu K, Li X, Ye Y, Li R, et al. M6A2Target: a comprehensive database for targets of m6A writers, erasers and readers. Brief Bioinform. (2021) 22(3):bbaa055. doi: 10.1093/bib/bbaa055
25. Villa-Roel N, Park C, Andueza A, Baek KI, Su A, Blaser MC, et al. Side- and disease-dependent changes in human aortic valve cell population and transcriptomic heterogeneity determined by single-cell RNA sequencing. Genes (Basel). (2024) 15(12):1623. doi: 10.3390/genes15121623
26. Butler A, Hoffman P, Smibert P, Papalexi E, Satija R. Integrating single-cell transcriptomic data across different conditions, technologies, and species. Nat Biotechnol. (2018) 36(5):411–20. doi: 10.1038/nbt.4096
27. Aran D, Looney AP, Liu L, Wu E, Fong V, Hsu A, et al. Reference-based analysis of lung single-cell sequencing reveals a transitional profibrotic macrophage. Nat Immunol. (2019) 20(2):163–72. doi: 10.1038/s41590-018-0276-y
28. Hu C, Li T, Xu Y, Zhang X, Li F, Bai J, et al. Cellmarker 2.0: an updated database of manually curated cell markers in human/mouse and web tools based on scRNA-Seq data. Nucleic Acids Res. (2023) 51(D1):D870–6. doi: 10.1093/nar/gkac947
29. Cao J, Packer JS, Ramani V, Cusanovich DA, Huynh C, Daza R, et al. Comprehensive single-cell transcriptional profiling of a multicellular organism. Science. (2017) 357(6352):661–7. doi: 10.1126/science.aam8940
30. Lindman BR, Clavel M-A, Mathieu P, Iung B, Lancellotti P, Otto CM, et al. Calcific aortic stenosis. Nat Rev Dis Primers. (2016) 2:16006. doi: 10.1038/nrdp.2016.6
31. Peeters FECM, Meex SJR, Dweck MR, Aikawa E, Crijns HJGM, Schurgers LJ, et al. Calcific aortic valve stenosis: hard disease in the heart: a biomolecular approach towards diagnosis and treatment. Eur Heart J. (2018) 39(28):2618–24. doi: 10.1093/eurheartj/ehx653
32. Grim JC, Aguado BA, Vogt BJ, Batan D, Andrichik CL, Schroeder ME, et al. Secreted factors from proinflammatory macrophages promote an osteoblast-like phenotype in valvular interstitial cells. Arterioscler Thromb Vasc Biol. (2020) 40(11):e296–308. doi: 10.1161/ATVBAHA.120.315261
33. Frangogiannis NG. Cardiac fibrosis. Cardiovasc Res. (2021) 117(6):1450–88. doi: 10.1093/cvr/cvaa324
34. Aventaggiato M, Barreca F, Sansone L, Pellegrini L, Russo MA, Cordani M, et al. Sirtuins and hypoxia in EMT control. Pharmaceuticals (Basel). (2022) 15(6):737. doi: 10.3390/ph15060737
35. Lee C-J, Jang T-Y, Jeon S-E, Yun H-J, Cho Y-H, Lim D-Y, et al. The dysadherin/MMP9 axis modifies the extracellular matrix to accelerate colorectal cancer progression. Nat Commun. (2024) 15(1):10422. doi: 10.1038/s41467-024-54920-9
36. Caliri AW, Tommasi S, Besaratinia A. Relationships among smoking, oxidative stress, inflammation, macromolecular damage, and cancer. Mutat Res Rev Mutat Res. (2021) 787:108365. doi: 10.1016/j.mrrev.2021.108365
37. Pan J, Zhang L, Li D, Li Y, Lu M, Hu Y, et al. Hypoxia-inducible factor-1: regulatory mechanisms and drug therapy in myocardial infarction. Eur J Pharmacol. (2024) 963:176277. doi: 10.1016/j.ejphar.2023.176277
38. Fang L, Che Y, Zhang C, Huang J, Lei Y, Lu Z, et al. PLAU Directs conversion of fibroblasts to inflammatory cancer-associated fibroblasts, promoting esophageal squamous cell carcinoma progression via uPAR/akt/NF-κB/IL8 pathway. Cell Death Discov. (2021) 7(1):32. doi: 10.1038/s41420-021-00410-6
39. Zhang P, The E, Luo Z, Zhai Y, Yao Q, Ao L, et al. Pro-inflammatory mediators released by activated monocytes promote aortic valve fibrocalcific activity. Mol Med. (2022) 28(1):5. doi: 10.1186/s10020-022-00433-4
40. Făgărășan A, Săsăran MO, Gozar L, Toma D, Șuteu C, Ghiragosian-Rusu S, et al. Circulating matrix metalloproteinases for prediction of aortic dilatation in children with bicuspid aortic valve: a single-center, observational study. Int J Mol Sci. (2024) 25(19):10538. doi: 10.3390/ijms251910538
Keywords: aortic stenosis, calcification, transcriptome, proteome, single-cell transcriptomics
Citation: Wang F-X, Liu S, Guo H-Q, Yu J-Q, Cui J, Cheng Q, Aisikeer N, Liu F, Duan M-J, Xie X and Ma Y-t (2025) Integrated multi-omics analysis reveals key hub genes and mechanisms in calcific aortic stenosis. Front. Cardiovasc. Med. 12:1640014. doi: 10.3389/fcvm.2025.1640014
Received: 3 June 2025; Accepted: 24 October 2025;
Published: 14 November 2025.
Edited by:
Masanori Aikawa, Brigham and Women's Hospital and Harvard Medical School, United StatesReviewed by:
Kang Xu, Hubei University of Chinese Medicine, ChinaEsmaa Bouhamida, Mount Sinai Hospital, United States
Copyright: © 2025 Wang, Liu, Guo, Yu, Cui, Cheng, Aisikeer, Liu, Duan, Xie and Ma. This is an open-access article distributed under the terms of the Creative Commons Attribution License (CC BY). The use, distribution or reproduction in other forums is permitted, provided the original author(s) and the copyright owner(s) are credited and that the original publication in this journal is cited, in accordance with accepted academic practice. No use, distribution or reproduction is permitted which does not comply with these terms.
*Correspondence: Xiang Xie, eGlhbmd4aWU5OTlAc2luYS5jb20=; Yi-tong Ma, bXl0LXhqQDE2My5jb20=
†These authors have contributed equally to this work