 Chen-Yan Li1,2Hai-Bo Wu2Ya-Wei Duan2Peng Gao2Hong-Xiao Li2Xue-Chao Wang2Yun-Can Wang3Yan-Qing Wang2Shi-Ru Bai2Yuan Jia2
 Rong-Pin Du2*
- 1Hebei North University, Zhangjiakou, Hebei, China
- 2Hebei General Hospital, Shijiazhuang, China
- 3Department of Ultrasound, The First Hospital of Hebei Medical University, Shijiazhuang, Hebei, China
Objective: To develop a nomogram model integrating the HALP score (a composite score of hemoglobin, albumin, lymphocytes, and platelets) and sST2 for predicting the risk of major adverse cardiovascular events (MACE) within 1 year after percutaneous coronary intervention (PCI) in patients with acute myocardial infarction (AMI).
Methods: This retrospective analysis included 236 AMI patients undergoing emergency PCI (2019–2024), categorized into MACE (n = 102) and non-MACE (n = 134) groups. Independent predictors were identified through multivariate logistic regression analysis, and a nomogram model was constructed. Model performance was validated using receiver operating characteristic (ROC) curves and the Bootstrap method (N = 1,000).
Results: Multivariate analysis revealed that Killip class IV (OR = 3.758, P = 0.009), high sST2 levels (OR = 1.008, P = 0.009), high LDL-C (OR = 1.533, P = 0.041), high LVEDD (OR = 1.106, P = 0.009), and low HALP score (OR = 0.958, P = 0.023) were independent predictors of MACE. The combined model exhibited significantly better predictive performance than single indicators (AUC = 0.833, 95% CI: 0.781–0.886), with a sensitivity of 87.3% and specificity of 68.7%. The nomogram demonstrated good calibration after Bootstrap validation (Hosmer-Lemeshow test P = 0.157).
Conclusion: The nomogram model developed in this study, which integrates the HALP score (reflecting inflammatory-nutritional status) and sST2 (a marker of myocardial fibrosis) along with clinical indicators, can effectively predict the risk of MACE after PCI and provides a visual tool for individualized risk stratification.
1 Introduction
Cardiovascular diseases (CVD) remain the leading cause of morbidity and mortality worldwide, affecting not only individual health but also imposing a substantial economic burden on global healthcare systems. The 2023 World Heart Report indicates that in 2021, 20.5 million people died from cardiovascular diseases. Among these, myocardial infarction (MI) is still the primary cause of death (1, 2). The optimal strategy for managing myocardial infarction is the rapid implementation of myocardial reperfusion, and percutaneous coronary intervention (PCI) is currently one of the most important therapeutic approaches. It can restore blood flow to the infarcted myocardium, thereby reducing myocardial damage and improving patient outcomes (3–6). However, approximately 10% to 15% of patients still experience major adverse cardiovascular events (MACE) after PCI, significantly increasing the risk of death (7). Therefore, identifying reliable predictors of MACE risk in patients with acute myocardial infarction (AMI) after PCI is of great clinical significance.
Current research suggests that inflammatory and nutritional indicators are associated with the prognosis of myocardial infarction. Additionally, other studies have identified independent predictors of myocardial infarction prognosis, including gender, age, Killip classification, infarct location, left ventricular ejection fraction (LVEF), and peak CK-MB levels (8–11). Our study aims to build on previous research by exploring a novel, simple, and convenient model for predicting the risk of MACE events within one year after PCI in patients with acute myocardial infarction.
The HALP score, calculated based on hemoglobin, albumin, lymphocyte, and platelet levels, is a simple and convenient indicator that integrates inflammatory and nutritional status into a comprehensive score. Previous studies have demonstrated that the HALP score can predict the prognosis of patients with various types of cancer, particularly gastric, pancreatic, and prostate cancers, as well as stroke patients (12–15). The formula for calculating the HALP score is: hemoglobin (g/L) × albumin (g/L) × lymphocyte count (109/L)/platelet count (109/L). Recent research has shown that it is associated with adverse cardiovascular outcomes (16).
ST2, as a member of the interleukin-1 receptor family, plays a key role in the mechanical stress response and fibrosis process of the myocardium (17). Although the primary cellular source of ST2 has not been definitively identified, evidence suggests that vascular endothelial cells may be an important source of ST2. The transmembrane receptor ST2l and the soluble receptor sST2 are two key subtypes of the ST2 protein. Among them, soluble ST2 (sST2) is released into the bloodstream, acting as a decoy receptor for IL-33, thereby blocking the signaling between IL-33 and ST2l and its beneficial effects. The interaction between sST2 and IL-33 is closely related to the development and progression of various inflammatory diseases, cardiac pathological conditions, and cancers (18, 19). Currently, risk models guided by sST2 are mostly focused on heart failure research, where adverse outcomes in heart failure patients may be associated with elevated sST2 levels, making it a potential novel risk factor for predicting poor prognosis (20). However, there are few studies on the predictive efficacy of sST2 for MACE events after PCI in acute myocardial infarction, and the synergistic effect with emerging inflammatory-nutritional indicators, such as the HALP score, needs to be verified.
This study aimed to develop and validate a novel nomogram model for predicting the risk of MACE within 1 year after percutaneous coronary intervention (PCI) in patients with AMI. Through a single-center retrospective analysis of 236 AMI patients (102 in the MACE group vs. 134 in the non-MACE group), the study focused on the combined predictive value of two emerging biomarkers—metabolic-inflammation imbalance (HALP score) and myocardial fibrosis (sST2)—and integrated clinical indicators [such as Killip classification and left ventricular end-diastolic diameter (LVEDD)] to construct a personalized risk assessment tool more suitable for the East Asian population. This tool aims to guide risk stratification and precision intervention for patients after PCI. The innovations of this study include: (1) the first validation of the HALP score's value in predicting MACE after PCI, addressing the neglect of metabolic-inflammation interactions in traditional scoring systems; (2) combining the nutritional-inflammation marker HALP score with myocardial fibrosis biomarker sST2, filling a gap in existing risk prediction models that overlook the interaction between metabolic-inflammation status and myocardial remodeling processes; and (3) developing a clinically translatable nomogram model. After Bootstrap validation, the model outperformed single indicators, providing clinicians with an intuitive MACE risk stratification scheme.
2 Materials and methods
2.1 Study population
This study retrospectively included 236 patients with AMI who were initially diagnosed and underwent emergency PCI at Hebei Provincial People's Hospital from January 2019 to January 2024. Of these patients, 180 were male. The inclusion criteria were as follows: (1) Patients with AMI meeting the criteria of the Fourth Universal Definition of Myocardial Infarction; (2) Patients undergoing emergency PCI; (3) Patients with complete data and follow-up. The exclusion criteria were as follows: (1) Previous history of AMI or coronary artery bypass grafting (CABG); (2) Presence of malignancy; (3) Severe hepatic dysfunction (defined as ALT >3×ULN) or renal impairment (eGFR <30 ml/min/1.73m² using CKD-EPI equation; (4) Incomplete medical records or inability to cooperate with treatment; (5) Presence of autoimmune diseases, etc.Patients were divided into the MACE group (n = 102) and the non-MACE group (n = 134) based on whether MACE occurred within 1 year after the procedure. In this study, MACE was defined as a composite endpoint of cardiovascular death, stroke, heart failure (new-onset heart failure and worsening of existing heart failure), and ischemia-driven revascularization within 1 year after PCI for acute myocardial infarction. The study strictly adhered to the ethical principles of the Declaration of Helsinki and was approved by the Ethics Committee of Hebei General Hospital (ethical approval No.: 2025-KY42).
2.2 General clinical data
Clinical data of the included patients were collected through the hospital's medical record system. The collected data included the following:
• Demographic and lifestyle factors: Gender, age, smoking history.
• Cardiovascular disease-related factors: Infarct location, number of diseased vessels, number of stents implanted, hypertension, diabetes, Killip classification.
• Laboratory parameters:
• Cardiac biomarkers: NT-proBNP, CK-MB, cardiac troponin T (cTnT).
• Metabolic parameters: Fasting blood glucose, lipoprotein a, triglycerides, total cholesterol, low-density lipoprotein cholesterol (LDL-C), hemoglobin, albumin.
Hematologic parameters: Neutrophils, lymphocytes, monocytes, platelets, serum creatinine.
(1) Inflammatory and nutritional indices:
(1) Neutrophil-to-lymphocyte ratio (NLR).
(2) Systemic immune-inflammation index (SIRI): Neutrophil count × Monocyte count/Lymphocyte count.
(3) Prognostic nutritional index (PNI): Serum albumin (g/L) + 5 × Peripheral blood lymphocyte count (×109/L).
(4) PLR: Platelet count/Lymphocyte count.
2.3 Echocardiographic parameters
All patients in this study underwent echocardiography using a Philips Color Doppler Ultrasound Diagnostic Instrument (Philips Healthcare, Netherlands) to measure the LVEDD and LVEF. Measurements were averaged over three cardiac cycles.
2.4 Calculation of HALP score and collection of sST2
2.4.1 Calculation of HALP score
The HALP score was calculated using the following formula:
HALP = hemoglobin (g/L) × albumin (g/L) × lymphocyte count (109/L)/platelet count (109/L)
All parameters were measured within 24 hours of admission and before PCI.
2.4.2 Measurement of sST2
The sST2 levels were measured using venous blood samples collected within 24 hours of admission and before PCI. These samples were sent to the laboratory for testing. The measurements were conducted using a chemiluminescence immunoassay with an automated chemiluminescence analyzer (Chongqing Keximai Co., Ltd.: Model: SMART 300) by the Hebei Provincial People's Hospital laboratory. In this experiment, the threshold for the sST2 standard kit was set at 35 ng/ml (results under 35 ng/ml are considered negative). Data were sourced from the medical records system of Hebei Provincial People's Hospital and were retrospectively tracked. The final data included were from patients with acute myocardial infarction who had complete records of sST2 measurements.
2.5 Statistical methods
The statistical analysis of the study data was performed using SPSS version 26.0. For continuous variables with a normal distribution, data were described using the mean ± standard deviation () and compared between groups using the independent samples t-test. For continuous variables that did not conform to a normal distribution, data were described using the median and interquartile range (M Q1, Q3) and compared between groups using the Mann–Whitney U-test. Categorical variables were described using counts and percentages (%), and comparisons between groups were made using the chi-square test or Fisher's exact test when appropriate.
Variables that showed significant differences between groups in univariate analysis were included in multivariate logistic regression analysis to identify independent predictors of MACE. Multicollinearity was assessed using variance inflation factors (VIF < 5 considered acceptable). The missing values in this data are less than 2%. The method of directly deleting the cases with missing values is adopted. The diagnostic performance of these predictors was evaluated using receiver operating characteristic (ROC) curves to assess their independent and combined predictive abilities. The nomogram model was constructed using R software (version 4.1.0) with the rms package. The discrimination and calibration of the nomogram model were assessed using the area under the ROC curve (AUC) and calibration curves, respectively. A p-value of less than 0.05 was considered statistically significant.
3 Results
3.1 Baseline comparison between MACE and non-MACE groups
A total of 236 patients with AMI who underwent PCI were included in this study. Of these, 102 patients (43.22%) were in the MACE group and 134 patients (56.78%) were in the non-MACE group. Baseline comparisons between the two groups revealed significant differences in the following variables:
• Killip classification (P < 0.001)
• sST2 levels (P < 0.001)
• Neutrophil count (P = 0.031)
• Serum creatinine (P = 0.005)
• LDL-C (P = 0.038)
• LVEDD (P = 0.005)
• HALP score (P < 0.001)
• SIRI (P < 0.001)
• NLR (P < 0.001)
• PNI (P < 0.001)
• Platelet-to-lymphocyte ratio (PLR) (P < 0.001)
All these differences were statistically significant (P < 0.05).
Specifically, for Killip classification, the proportion of patients with Killip class IV was significantly higher in the MACE group (20.59%) than in the non-MACE group (5.22%). For sST2, the median level in the MACE group (87.51) was significantly higher than that in the non-MACE group (37.53). For neutrophils, the median count in the MACE group (8.27) was significantly higher than that in the non-MACE group (7.30). For serum creatinine, the median level in the MACE group (80.80) was significantly higher than that in the non-MACE group (71.60). For LDL-C, the median level in the MACE group (3.47) was significantly higher than that in the non-MACE group (3.29). For LVEDD, the median value in the MACE group (49.00) was significantly higher than that in the non-MACE group (47.00). For HALP score, the median value in the MACE group (26.62) was significantly lower than that in the non-MACE group (39.76). For SIRI, the median value in the MACE group (3.43) was significantly higher than that in the non-MACE group (2.02). For NLR, the median value in the MACE group (6.20) was significantly higher than that in the non-MACE group (4.49). For PNI, the median value in the MACE group (43.50) was significantly lower than that in the non-MACE group (47.08). For PLR, the median value in the MACE group (183.84) was significantly higher than that in the non-MACE group (131.77). The detailed results are presented in Table 1.
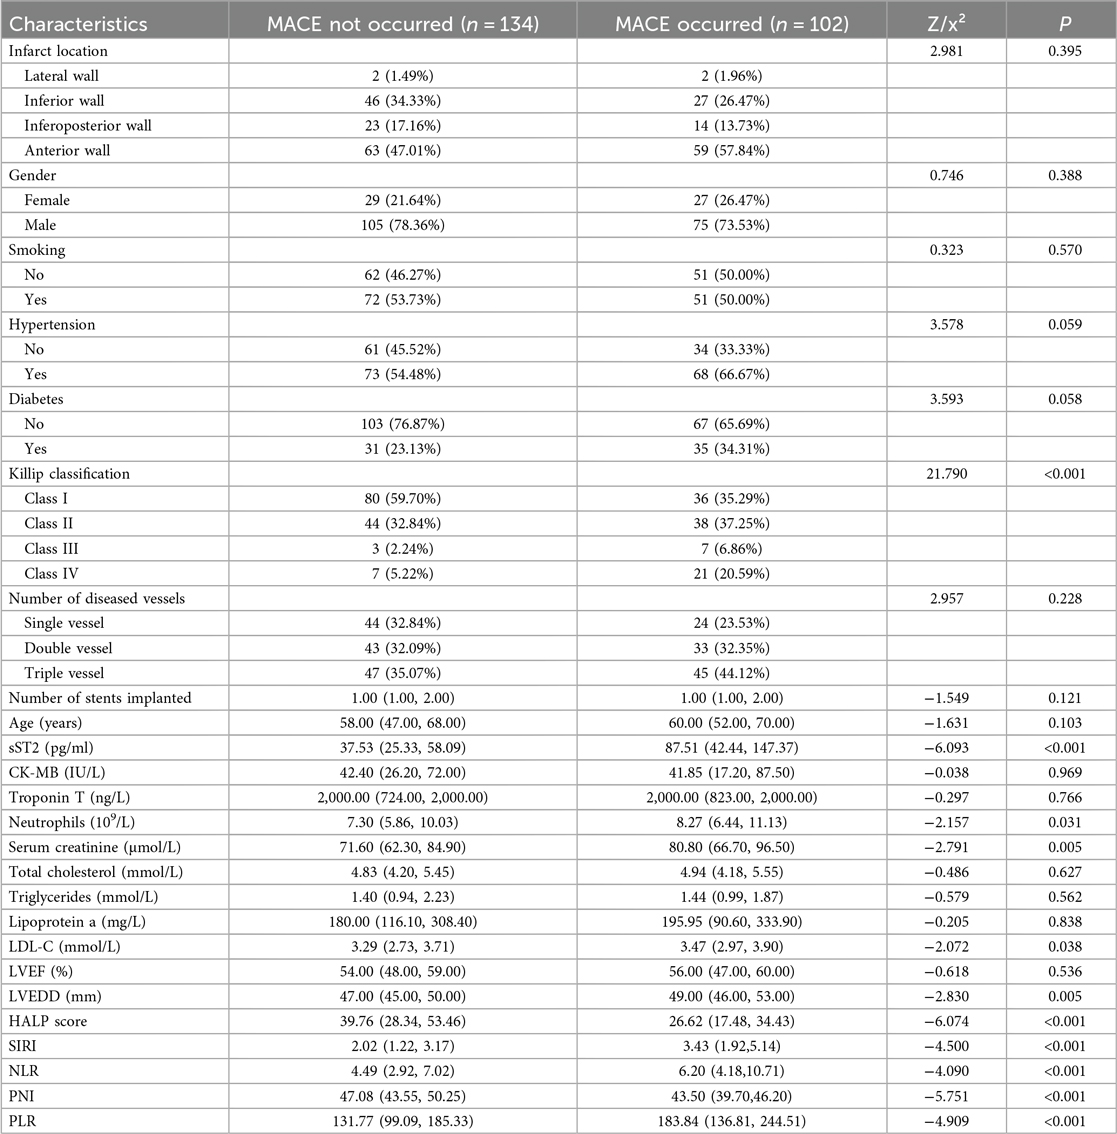
Table 1. Comparison of relevant indicators between Non-MACE and MACE groups.
3.2 Factors influencing MACE occurrence—multivariate logistic regression analysis
We constructed a multivariate logistic regression model using the occurrence of MACE (no = 0, yes = 1) as the dependent variable and the significant factors identified in the univariate analysis—Killip classification, sST2, neutrophils, serum creatinine, LDL-C, LVEDD, HALP score, SIRI, NLR, PNI, and PLR—as independent variables.
The results are shown in Table 2. The analysis revealed that the following factors were independent predictors of MACE occurrence:
• Killip class IV (OR = 3.758, P = 0.009)
• High levels of sST2 (OR = 1.008, P = 0.009)
• High levels of LVEDD (OR = 1.106, P = 0.009)
• High levels of LDL-C (mmol/L) (OR = 1.533, P = 0.041)
• Low levels of HALP score (OR = 0.958, P = 0.023). These factors were identified as significant contributors to the risk of MACE. The detailed results of the statistical analysis are presented in Table 2.
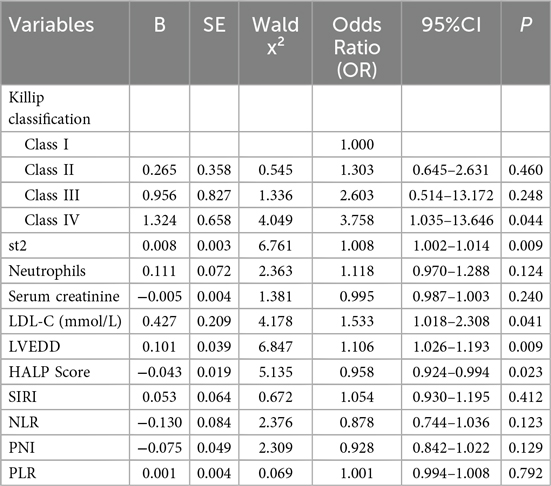
Table 2. Logistic regression analysis of factors influencing MACE occurrence.
3.3 ROC curve analysis of independent predictors and combined indicators
Based on the results of the multivariate logistic regression analysis (with a significance level of P < 0.05), we identified five independent risk factors that are meaningful for predicting the risk of MACE within 1 year after PCI in patients with AMI: Killip classification, sST2, LDL-C, LVEDD, and HALP score. We performed ROC curve analysis for these five independent predictors and for the combined indicators.
The results showed that the AUC values for the individual predictors and the combined indicators were as follows:
• Killip classification: AUC = 0.654 (95% CI: 0.582–0.725)
• sST2: AUC = 0.732 (95% CI: 0.666–0.797)
• LDL-C: AUC = 0.579 (95% CI: 0.506–0.652)
• LVEDD: AUC = 0.607 (95% CI: 0.533–0.681)
• HALP score: AUC = 0.731 (95% CI: 0.667–0.795)
• Combined indicators: AUC = 0.833 (95% CI: 0.781–0.886)
The predictive performance, ranked from highest to lowest, was as follows: combined indicators > sST2 > HALP score > Killip classification > LVEDD > LDL-C.
The detailed results are shown in Table 3, and the ROC curves are presented in Figure 1.
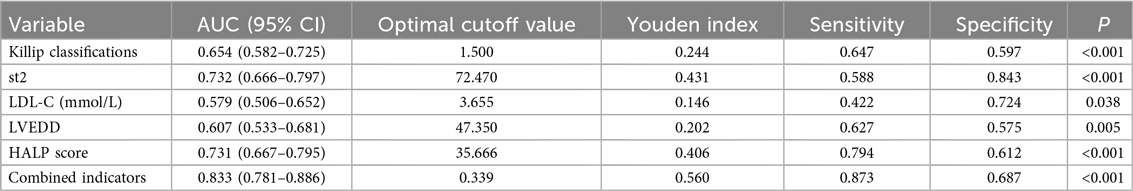
Table 3. Assessment of predictive performance for MACE occurrence by independent predictors and combined indicators.
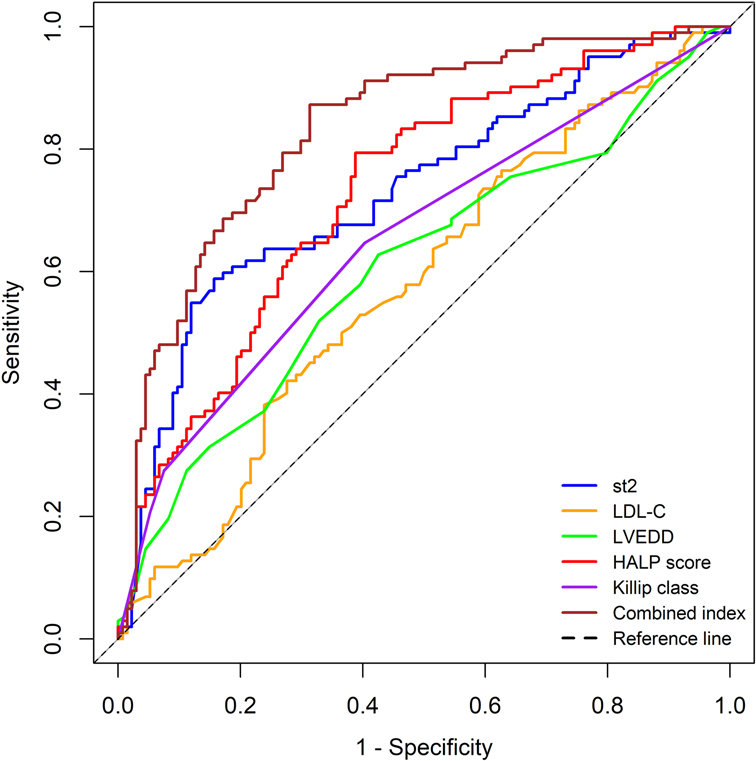
Figure 1. ROC curves for independent predictors and combined indicators.
3.4 Nomogram prediction model for MACE occurrence
Based on the independent predictors of MACE occurrence—Killip classification, sST2, LDL-C, LVEDD, and HALP score—we constructed a nomogram prediction model for MACE occurrence (Figure 2). This nomogram allows for the relatively rapid estimation of MACE risk for each patient by assigning specific scores (Points) to each of the five independent predictive factors: Killip classification, sST2, LDL-C, LVEDD, and HALP score. The total score (Total Points) is obtained by summing the scores of these five factors, and each total score corresponds to a specific probability of MACE occurrence (Predicted Value).
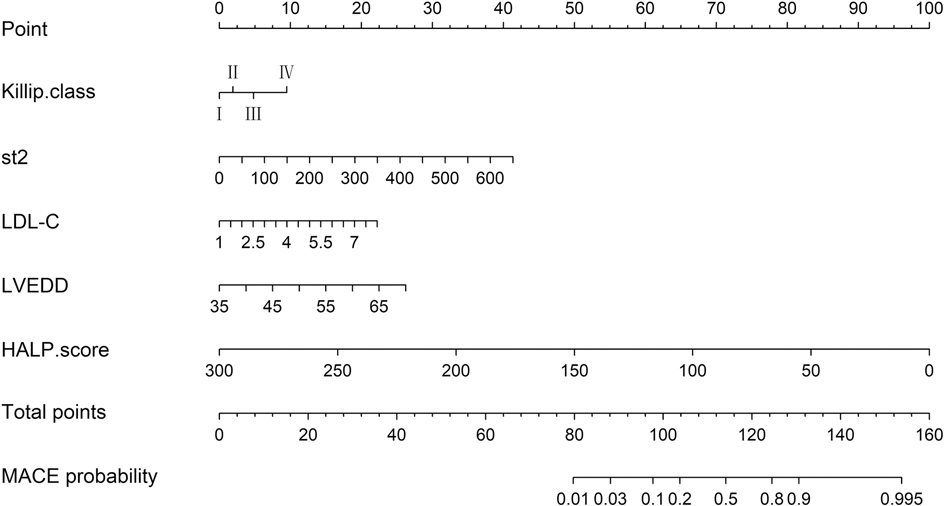
Figure 2. Nomogram for predicting the probability of MACE occurrence.
The detailed nomogram model is presented in Figure 2.
3.5 Validation of the nomogram prediction model for MACE occurrence
The nomogram prediction model for MACE occurrence was validated using the Bootstrap resampling method (N = 1000). The model's predictive performance and consistency were comprehensively assessed using ROC curves and calibration curves.
Discrimination Ability: The ROC curve for the nomogram prediction model of MACE occurrence is shown in Figure 3. The model achieved an AUC of 0.833 (95% CI: 0.781–0.886), indicating high accuracy and discrimination ability.
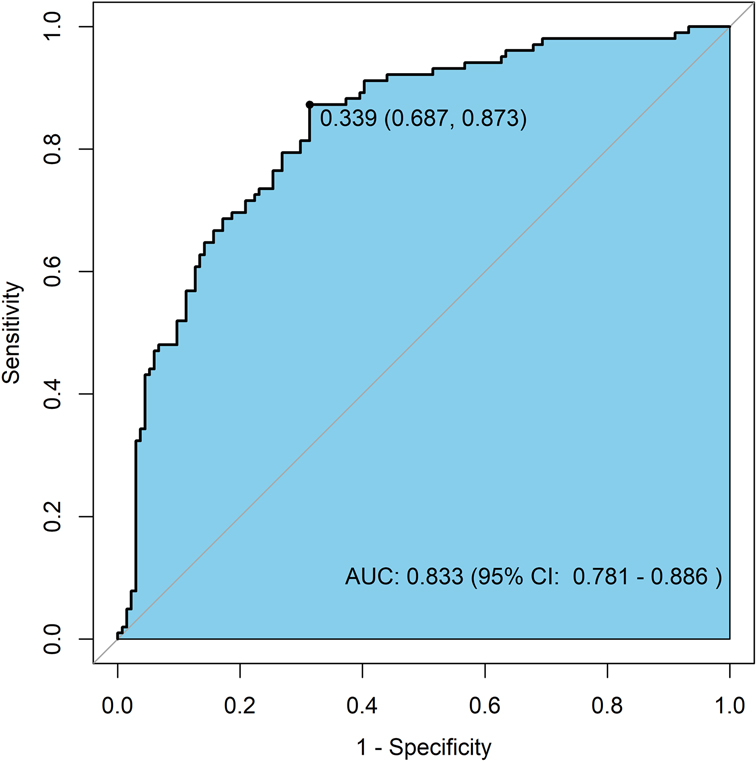
Figure 3. ROC curve of the nomogram prediction model for MACE occurrence.
Calibration: The calibration curve for the nomogram prediction model is shown in Figure 4. The Hosmer-Lemeshow (HL) test result showed that the model's predicted probability was not significantly different from the actual probability of occurrence ( = 11.864, P = 0.157, P > 0.05), suggesting good calibration.
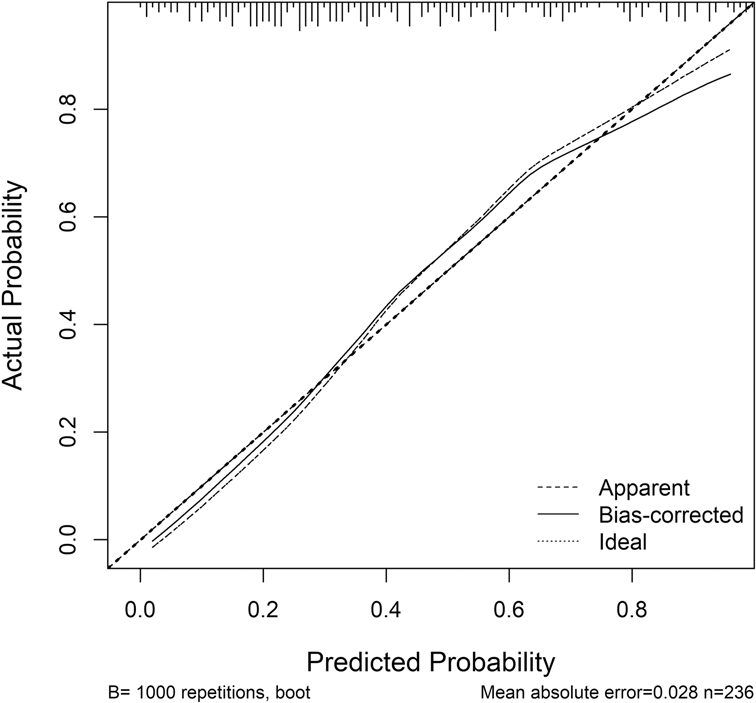
Figure 4. Calibration curve of the nomogram prediction model for MACE occurrence.
4 Discussion
This study retrospectively analyzed data from 236 patients with AMI to develop and validate a nomogram prediction model that integrates the HALP score, sST2, Killip classification, cardiac structural parameter LVEDD, and lipid parameter LDL-C. The main findings include: (1) Independent Predictive Value of Novel Biomarkers: Low HALP score (OR = 0.958, P = 0.023) and high sST2 levels (OR = 1.008, P = 0.009) were identified as independent predictors of MACE within 1 year after PCI. Their predictive performance (AUC: HALP = 0.731, sST2 = 0.732) demonstrated significant efficacy, surpassing traditional indicators such as LDL-C (AUC = 0.579) and LVEDD (AUC = 0.607). Killip class IV (OR = 3.758) and increased LVEDD (OR = 1.106) further confirmed the importance of hemodynamic disturbances. (2) Synergistic Effect of Multiple Indicators: The combined model (HALP + sST2 + Killip + LVEDD + LDL-C) exhibited excellent predictive performance (AUC = 0.833, 95% CI: 0.781–0.886), with a sensitivity of 87.3% and specificity of 68.7%. This confirmed the synergistic predictive value of integrating inflammation, fibrosis, and clinical characteristics. (3) Model Validation Results: The nomogram demonstrated good calibration (Hosmer-Lemeshow test P = 0.157) and clinical applicability through internal validation using Bootstrap resampling (N = 1,000). This study provides the first visual risk assessment tool for East Asian AMI patients that integrates nutritional, inflammatory, and myocardial stress biomarkers.
AMI is a severe form of coronary artery disease, most commonly caused by the rupture, erosion, or ulceration of primary coronary plaques. These events lead to thrombus formation and subsequent reduction or interruption of coronary blood flow, resulting in acute ischemic necrosis of the myocardium (21, 22). For patients with AMI, especially those with ST-segment elevation myocardial infarction (STEMI), PCI remains the most common and effective treatment. However, patients still face the risk of MACE after PCI, which can be life-threatening. Studies have shown that changes in serum biomarkers reflect acute events such as endothelial injury, platelet activation, aggregation, and thrombus formation, all of which are components of the progression of coronary atherosclerosis. These biomarkers can effectively predict the occurrence of MACE after surgery (23, 24). Platelets, derived from megakaryocytes in the bone marrow, play an important role in hemostasis and the development of atherosclerotic complications. Research by Tsai et al. has found that both increases and decreases in platelet counts are associated with adverse cardiovascular outcomes (25, 26). Albumin, the most abundant protein in the blood, accounting for 50% of plasma proteins, not only reflects nutritional status but has also been shown to be associated with poor in-hospital outcomes in STEMI patients when serum albumin levels are low (27, 28). Following myocardial infarction, a large number of inflammatory mediators are released into the bloodstream, triggering an inflammatory response (29). Lymphocytes, early markers of physiological stress, can inhibit excessive immune responses and limit myocardial damage. Wang et al. found that lymphocytes play a key regulatory role in the inflammatory response after acute coronary syndrome (ACS) (30, 31). Hartopo et al. demonstrated that anemia may lead to poor prognosis in patients with ACS, with hemoglobin being a hematological biomarker reflecting anemia (32). In our study, the HALP score integrates the above four indicators (hemoglobin, albumin, lymphocytes, and platelets) to investigate the risk of MACE within one year after PCI in patients with acute myocardial infarction. In the comparative analysis between the two groups, the HALP score in the MACE group (median = 26.62) was significantly lower than that in the non-MACE group (median = 39.76) (P < 0.001), indicating an association between HALP score and MACE risk. Subsequent multivariate logistic regression analysis revealed that a low HALP score (OR = 0.958, P = 0.023) is an independent risk factor for MACE occurrence. In the ROC curve analysis, the AUC corresponding to the HALP score was 0.731 (95% CI: 0.667–0.795), indicating moderate independent predictive efficacy for MACE risk, consistent with existing research findings (33, 34).
The ST2 receptor is a member of the Toll-like/interleukin-1 receptor family. Upon activation of the IL-33/ST2 signaling pathway, the clinically detectable soluble ST2 (sST2) is released into the circulation. Elevated levels of sST2 have been associated with cardiac fibrosis, and studies by Kohli et al. have reported a strong correlation between ST2 and the risk of heart failure following myocardial infarction (35, 36). Current research on the prognostic value of ST2 in cardiovascular diseases has primarily focused on heart failure, with evidence suggesting that sST2 is an independent predictor of adverse events and mortality in heart failure patients (37). In contrast, studies on its predictive value for myocardial infarction prognosis are relatively limited. Weinberg et al. found that elevated sST2 levels in heart failure patients following acute myocardial infarction are associated with poor prognosis (38). In our study, we observed that sST2 levels in the MACE group (median = 87.51) were significantly higher than those in the non-MACE group (median = 37.53). The observed sST2 levels in our cohort (median 87.51 pg/ml in MACE group) were higher than previously reported ranges in AMI populations, which may reflect differences in assay methodology. We speculate that this may be related to its role as a decoy receptor, binding to IL-33 (a cardioprotective cytokine) and blocking the IL-33/ST2l pathway, which may exacerbate myocardial injury and fibrosis (39). Additionally, in our multivariate logistic regression analysis, elevated sST2 (OR = 1.008, P = 0.009) was identified as an independent risk factor for MACE occurrence. Similarly, in the ROC curve analysis, the AUC corresponding to sST2 was 0.732 (95% CI: 0.666–0.797), indicating moderate predictive efficacy for MACE risk.
In addition, during the baseline analysis of the two groups, we found that, apart from the HALP score and sST2, several other indicators such as Killip classification, neutrophils, serum creatinine, LDL-C, SIRI, NLR, PLR, and PNI showed significant differences (P < 0.05). These indicators include: (1) SIRI (Systemic Immune-Inflammation Index): Neutrophil count × Monocyte count/Lymphocyte count; (2) NLR (Neutrophil-to-Lymphocyte Ratio): Neutrophil count/Lymphocyte count; (3) PLR: Platelet count/Lymphocyte count; (4) PNI: Serum albumin (g/L) + 5 × Lymphocyte count (×10⁹/L). These are all immune-inflammatory indicators. The significant differences suggest that the risk of MACE within 1 year after PCI in patients with acute myocardial infarction is related to inflammatory or nutritional status, which is consistent with previous studies (9, 40, 41). However, in the multivariate analysis, these inflammatory indicators were not significant, which we speculate may be related to the sample size and warrants further investigation in our subsequent studies. Some studies have shown that compared with patients with postoperative LDL-C < 1.4 mmol/L, the risk of MACCE is still higher in patients with LDL-C ≥ 1.8 mmol/L and those with LDL-C between 1.4 and < 1.8 mmol/L (42). Our study revealed that in the MACE group, pre-PCI LDL-C levels (median = 3.47 mmol/L) were significantly higher than those in the non-MACE group (median = 3.29 mmol/L). This indicates that the baseline lipid levels of patients are associated with MACE risk. In the multivariate analysis, high levels of LDL-C (OR = 1.533, P = 0.041) were identified as an independent risk factor. Ischemia following myocardial infarction leads to myocardial necrosis and fibrosis, and left ventricular dilation is a core manifestation of ventricular remodeling, affecting the long-term prognosis of patients with myocardial infarction. LVEDD, as an easily obtainable imaging parameter, holds significant value for risk stratification and individualized management after PCI. Our study also confirmed its correlation with MACE risk and its independent predictive ability.
We performed ROC curve analysis for the five independent predictors identified in the multivariate logistic regression analysis, as well as for the combined indicators. The results showed that the predictive performance, ranked from highest to lowest, was as follows: combined indicators > sST2 > HALP score > Killip classification > LVEDD > LDL-C. Notably, the HALP score (AUC = 0.731) and sST2 (AUC = 0.732) demonstrated similar predictive capabilities. However, they have distinct biological significances: the HALP score reflects a systemic imbalance of inflammation and nutrition, while sST2 indicates myocardial fibrosis stress response (13, 17). This biological heterogeneity suggests that the two may be involved in the pathogenesis of MACE through different pathways. The significant improvement in the combined model (AUC = 0.833) confirmed the necessity of integrating indicators from different pathological and physiological dimensions, especially in identifying high-risk patients (with a sensitivity of 87.3%). This is of great value in screening subgroups that require aggressive intervention.
Based on the ROC curve analysis, we further concluded that Killip classification, sST2, LDL-C, LVEDD, and HALP score are independent predictors of MACE risk within 1 year after PCI in patients with AMI. Moreover, the combined indicators demonstrated excellent predictive performance. Nomograms can visualize complex mathematical models, making prediction results more readable and assisting clinicians in better assessing patient prognosis (43). Current risk prediction models for AMI mainly include the TIMI score (based on clinical indicators such as age and Killip classification), the GRACE score (integrating electrocardiographic and biochemical indicators), and the CADILLAC score (specifically for post-PCI risk assessment). Although these models have clinical utility, they have limitations: the TIMI score inadequately covers inflammatory and metabolic indicators, the GRACE score relies on complex laboratory tests and is limited in its application in primary hospitals, and the CADILLAC score does not incorporate emerging biomarkers (such as sST2 and HALP score) (44–48). Compared to traditional TIMI/GRACE scores, this model integrates various indicators such as myocardial fibrosis (measured by sST2), inflammatory and nutritional status (HALP), and cardiac remodeling (LVEDD). For patients with significantly reduced HALP scores, which indicate malnutrition combined with chronic inflammation, nutritional support can start alongside anti-inflammatory treatment. Those with high sST2 levels, which means active myocardial fibrosis, might need more aggressive treatment to reverse remodeling. The nomogram model developed in this study shows significant value in clinical application by integrating HALP score, sST2, and standard clinical indicators [such as Killip classification, left ventricular end-diastolic diameter (LVEDD), and low-density lipoprotein cholesterol (LDL-C)]. This model helps us accurately assess risk levels, with its combined prediction model (AUC = 0.833, 95% CI: 0.781–0.886) performing significantly better than individual indicators (HALP score AUC = 0.731; sST2 AUC = 0.732), letting us easily figure out each patient's risk of major cardiovascular events (MACE). For example, patients at high risk who have sST2 levels over 87.51 pg/ml and HALP scores under 26.62 have a significantly higher risk of MACE compared to low-risk populations, which is shown in the comparison of median values. Furthermore, the model can help shape intervention strategies; for patients with lower HALP scores, they might need better anti-inflammatory and nutritional support, while elevated sST2 levels indicate ongoing heart muscle scarring, suggesting that these patients could really benefit from early anti-reconstruction therapy, such as the use of angiotensin receptor-neprilysin inhibitors (ARNI) or sodium-glucose cotransporter 2 inhibitors (SGLT-2 inhibitors). For patients with Killip classification reaching level IV and increased LVEDD, we need to keep a close eye on their blood flow changes. Most importantly, all indicators of this model are part of the routine preoperative assessments for PCI, without any extra costs, making it a great fit for use in primary care hospitals. The nomogram developed in this study is the first AMI risk tool to integrate inflammatory-metabolic (HALP) and myocardial stress (sST2) indicators with clinical parameters, and its visual design aids in individualized treatment decision-making.
This study has limitations. First, the single-center retrospective design can introduce selection bias. This is a key limitation of single-center studies; retrospective designs cannot fully control for confounding variables. Although known covariates were adjusted for using multivariable analysis, unmeasured potential confounders (such as medication adherence and socioeconomic factors) could still influence the results. The data for this study came from the case system from a single medical institution, which is a regional tertiary hospital, where the patient population might have regional specificity in genetic background, dietary habits, and access to medical resources. Secondly, the study did not assess the dynamic changes in HALP scores and their impact on prognosis. Furthermore, the study utilized a relatively small sample size for internal validation, and the model's generalizability needs further validation through multicenter prospective studies and larger external cohorts. Finally, this single-center model needs external validation in multicenter cohorts. Future research should compare its performance against established risk scores, like GRACE 2.0 or TIMI risk scores, in a prospective setting.
5 Conclusion
The nomogram model developed in this study, which integrates the HALP score, sST2, and traditional clinical indicators (Killip classification, LVEDD, LDL-C), effectively predicts the risk of MACE within 1 year after PCI in patients with acute myocardial infarction. This tool offers the following clinical benefits: (1) Relatively Precision Stratification: Identifies high-risk patients who require intensified interventions (e.g., sST2 > 72.47 ng/ml or HALP < 35.66). (2) Comprehensive Pathophysiological Coverage: Simultaneously assesses inflammatory-metabolic imbalances and cardiac remodeling. (3) Operational Convenience: Based on routine testing indicators, suitable for rapid decision-making in outpatient and emergency settings. Future work should involve validation through multicenter cohorts and exploration of whether interventions targeting HALP/sST2 levels can improve prognosis.
Data availability statement
The original contributions presented in the study are included in the article/Supplementary Material, further inquiries can be directed to the corresponding author.
Ethics statement
The studies involving humans were approved by the Ethics Committee of Hebei General Hospital. The studies were conducted in accordance with the local legislation and institutional requirements. The participants provided their written informed consent to participate in this study.
Author contributions
C-YL: Data curation, Formal analysis, Investigation, Writing – original draft, Writing – review & editing. H-BW: Formal analysis, Investigation, Software, Writing – original draft, Writing – review & editing. Y-WD: Investigation, Methodology, Project administration, Validation, Writing – original draft. PG: Project administration, Software, Validation, Writing – review & editing. H-XL: Data curation, Investigation, Visualization, Writing – original draft. X-CW: Methodology, Project administration, Writing – original draft. Y-CW: Investigation, Project administration, Writing – original draft. Y-QW: Data curation, Formal analysis, Writing – original draft. S-RB: Formal analysis, Methodology, Writing – original draft. YJ: Methodology, Project administration, Writing – review & editing. R-PD: Conceptualization, Funding acquisition, Investigation, Project administration, Resources, Supervision, Writing – original draft, Writing – review & editing.
Funding
The author(s) declare that financial support was received for the research and/or publication of this article. This work was supported by the 2025 Government-funded Clinical Medicine Outstanding Talent Training Project (ZF2025022).
Conflict of interest
The authors declare that the research was conducted in the absence of any commercial or financial relationships that could be construed as a potential conflict of interest.
Generative AI statement
The author(s) declare that no Generative AI was used in the creation of this manuscript.
Any alternative text (alt text) provided alongside figures in this article has been generated by Frontiers with the support of artificial intelligence and reasonable efforts have been made to ensure accuracy, including review by the authors wherever possible. If you identify any issue please contact us.
Publisher's note
All claims expressed in this article are solely those of the authors and do not necessarily represent those of their affiliated organizations, or those of the publisher, the editors and the reviewers. Any product that may be evaluated in this article, or claim that may be made by its manufacturer, is not guaranteed or endorsed by the publisher.
References
1. Laranjo L, Lanas F, Sun MC, Chen DA, Hynes L, Imran TF, et al. World heart federation roadmap for secondary prevention of cardiovascular disease: 2023 update. Glob Heart. (2024) 19(1):8. doi: 10.5334/gh.1278
2. Wang Y, Wang X, Wang C, Zhou J. Global, regional, and national burden of cardiovascular disease, 1990–2021: results from the 2021 global burden of disease study. Cureus. (2024) 16(11):e74333. doi: 10.7759/cureus.74333
3. Hausenloy DJ, Yellon DM. Myocardial ischemia-reperfusion injury: a neglected therapeutic target. J Clin Invest. (2013) 123(1):92–100. doi: 10.1172/jci62874
4. Davis MG, Blankenship JC. PCI for late STEMI: better late than never? Catheter Cardiovasc Interv. (2023) 101(1):11–2. doi: 10.1002/ccd.30538
5. Feistritzer HJ, Jobs A, de Waha-Thiele S, Eitel I, Freund A, Abdel-Wahab M, et al. Multivessel versus culprit-only PCI in STEMI patients with multivessel disease: meta-analysis of randomized controlled trials. Clin Res Cardiol. (2020) 109(11):1381–91. doi: 10.1007/s00392-020-01637-6
6. Kastrati A, Coughlan JJ, Ndrepepa G, Primary PCI. Late presenting STEMI, and the limits of time. J Am Coll Cardiol. (2021) 78(13):1306–8. doi: 10.1016/j.jacc.2021.08.001
7. Yao W, Li J. Risk factors and prediction nomogram model for 1-year readmission for major adverse cardiovascular events in patients with STEMI after PCI. Clin Appl Thromb Hemost. (2022) 28:10760296221137847. doi: 10.1177/10760296221137847
8. Ibanez B, James S, Agewall S, Antunes MJ, Bucciarelli-Ducci C, Bueno H, et al. 2017 ESC guidelines for the management of acute myocardial infarction in patients presenting with ST-segment elevation: the task force for the management of acute myocardial infarction in patients presenting with ST-segment elevation of the European Society of Cardiology (ESC). Eur Heart J. (2018) 39(2):119–77. doi: 10.1093/eurheartj/ehx393
9. Han YC, Yang TH, Kim DI, Jin HY, Chung SR, Seo JS, et al. Neutrophil to lymphocyte ratio predicts long-term clinical outcomes in patients with ST-segment elevation myocardial infarction undergoing primary percutaneous coronary intervention. Korean Circ J. (2013) 43(2):93–9. doi: 10.4070/kcj.2013.43.2.93
10. Zengin A, Karataş MB, Çanga Y, Durmuş G, Güzelburç Ö, Durak F, et al. Prognostic performance of controlling nutritional Status score in patients with ST segment elevation myocardial infarction treated with primary percutaneous coronary intervention. Anatol J Cardiol. (2022) 26(1):23–8. doi: 10.5152/AnatolJCardiol.2021.190
11. Fox KA, Dabbous OH, Goldberg RJ, Pieper KS, Eagle KA, Van de Werf F, et al. Prediction of risk of death and myocardial infarction in the six months after presentation with acute coronary syndrome: prospective multinational observational study (GRACE). Br Med J. (2006) 333(7578):1091. doi: 10.1136/bmj.38985.646481.55
12. Guo Y, Shi D, Zhang J, Mao S, Wang L, Zhang W, et al. The hemoglobin, albumin, lymphocyte, and platelet (HALP) score is a novel significant prognostic factor for patients with metastatic prostate cancer undergoing cytoreductive radical prostatectomy. J Cancer. (2019) 10(1):81–91. doi: 10.7150/jca.27210
13. Xu SS, Li S, Xu HX, Li H, Wu CT, Wang WQ, et al. Haemoglobin, albumin, lymphocyte and platelet predicts postoperative survival in pancreatic cancer. World J Gastroenterol. (2020) 26(8):828–38. doi: 10.3748/wjg.v26.i8.828
14. Zhu X, Zhang Y, Wang A, Zhang X, Yu G, Xiang S, et al. Association between HALP (hemoglobin, albumin, lymphocyte, and platelet) score and poor outcomes in acute ischemic stroke patients with type 2 diabetes mellitus: a study from the third China national stroke registry. Front Neurol. (2024) 15:1461188. doi: 10.3389/fneur.2024.1461188
15. Chen XL, Xue L, Wang W, Chen HN, Zhang WH, Liu K, et al. Prognostic significance of the combination of preoperative hemoglobin, albumin, lymphocyte and platelet in patients with gastric carcinoma: a retrospective cohort study. Oncotarget. (2015) 6(38):41370–82. doi: 10.18632/oncotarget.5629
16. Pan H, Lin S. Association of hemoglobin, albumin, lymphocyte, and platelet score with risk of cerebrovascular, cardiovascular, and all-cause mortality in the general population: results from the NHANES 1999–2018. Front Endocrinol (Lausanne). (2023) 14:1173399. doi: 10.3389/fendo.2023.1173399
17. Januzzi JL Jr., Peacock WF, Maisel AS, Chae CU, Jesse RL, Baggish AL, et al. Measurement of the interleukin family member ST2 in patients with acute dyspnea: results from the PRIDE (pro-brain natriuretic peptide investigation of dyspnea in the emergency department) study. J Am Coll Cardiol. (2007) 50(7):607–13. doi: 10.1016/j.jacc.2007.05.014
18. Dudek M, Kałużna-Oleksy M, Migaj J, Straburzyńska-Migaj E. Clinical value of soluble ST2 in cardiology. Adv Clin Exp Med. (2020) 29(10):1205–10. doi: 10.17219/acem/126049
19. Aimo A, Januzzi JL Jr., Bayes-Genis A, Vergaro G, Sciarrone P, Passino C, et al. Clinical and prognostic significance of sST2 in heart failure: jACC review topic of the week. J Am Coll Cardiol. (2019) 74(17):2193–203. doi: 10.1016/j.jacc.2019.08.1039
20. Gül İ, Yücel O, Zararsız A, Demirpençe Ö, Yücel H, Zorlu A, et al. Prognostic role of soluble suppression of tumorigenicity-2 on cardiovascular mortality in outpatients with heart failure. Anatol J Cardiol. (2017) 18(3):200–5. doi: 10.14744/AnatolJCardiol.2017.7741
21. Frampton J, Devries JT, Welch TD, Gersh BJ. Modern management of ST-segment elevation myocardial infarction. Curr Probl Cardiol. (2020) 45(3):100393. doi: 10.1016/j.cpcardiol.2018.08.005
22. Shah T, Kapadia S, Lansky AJ, Grines CL. ST-segment elevation myocardial infarction: sex differences in incidence, etiology, treatment, and outcomes. Curr Cardiol Rep. (2022) 24(5):529–40. doi: 10.1007/s11886-022-01676-7
23. Frank M, Sanders C, Berry BP. Evaluation and management of ST-segment elevation myocardial infarction in the emergency department. Emerg Med Pract. (2021) 23(1):1–28. Available online at: https://pubmed.ncbi.nlm.nih.gov/33320487/33320487
24. Zhu XY, Yang DD, Zhang KJ, Zhu HJ, Su FF, Tian JW. Comparative analysis of four nutritional scores predicting the incidence of MACE in older adults with acute coronary syndromes after PCI. Sci Rep. (2023) 13(1):20333. doi: 10.1038/s41598-023-47793-3
25. Broos K, Feys HB, De Meyer SF, Vanhoorelbeke K, Deckmyn H. Platelets at work in primary hemostasis. Blood Rev. (2011) 25(4):155–67. doi: 10.1016/j.blre.2011.03.002
26. Tsai MT, Chen YT, Lin CH, Huang TP, Tarng DC. U-shaped mortality curve associated with platelet count among older people: a community-based cohort study. Blood. (2015) 126(13):1633–5. doi: 10.1182/blood-2015-06-654764
27. Rabbani G, Ahn SN. Structure, enzymatic activities, glycation and therapeutic potential of human serum albumin: a natural cargo. Int J Biol Macromol. (2019) 123:979–90. doi: 10.1016/j.ijbiomac.2018.11.053
28. Bicciré FG, Pastori D, Tanzilli A, Pignatelli P, Viceconte N, Barillà F, et al. Low serum albumin levels and in-hospital outcomes in patients with ST segment elevation myocardial infarction. Nutr Metab Cardiovasc Dis. (2021) 31(10):2904–11. doi: 10.1016/j.numecd.2021.06.003
29. Kologrivova I, Shtatolkina M, Suslova T, Ryabov V. Cells of the immune system in cardiac remodeling: main players in resolution of inflammation and repair after myocardial infarction. Front Immunol. (2021) 12:664457. doi: 10.3389/fimmu.2021.664457
30. Zhao WM, Tao SM, Liu GL. Neutrophil-to-lymphocyte ratio in relation to the risk of all-cause mortality and cardiovascular events in patients with chronic kidney disease: a systematic review and meta-analysis. Ren Fail. (2020) 42(1):1059–66. doi: 10.1080/0886022x.2020.1832521
31. Wang H, Liu Z, Shao J, Lin L, Jiang M, Wang L, et al. Immune and inflammation in acute coronary syndrome: molecular mechanisms and therapeutic implications. J Immunol Res. (2020) 2020:4904217. doi: 10.1155/2020/4904217
32. Hartopo AB, Gharini PP, Setianto BY. Low serum albumin levels and in-hospital adverse outcomes in acute coronary syndrome. Int Heart J. (2010) 51(4):221–6. doi: 10.1536/ihj.51.221
33. Toprak K, Toprak H, Acar İO, Ermiş MF. The predictive value of the HALP score for no-reflow phenomenon and short-term mortality in patients with ST-elevation myocardial infarction. Postgrad Med. (2024) 136(2):169–79. doi: 10.1080/00325481.2024.2319567
34. Liu H, Zhang F, Li Y, Liu L, Song X, Wang J, et al. The HALP score predicts no-reflow phenomenon and long-term prognosis in patients with ST-segment elevation myocardial infarction after primary percutaneous coronary intervention. Coron Artery Dis. (2025) 36(4):273–80. doi: 10.1097/mca.0000000000001446
35. López B, Castellano JM, González A, Barba J, Díez J. Association of increased plasma cardiotrophin-1 with inappropriate left ventricular mass in essential hypertension. Hypertension. (2007) 50(5):977–83. doi: 10.1161/hypertensionaha.107.098111
36. Kohli P, Bonaca MP, Kakkar R, Kudinova AY, Scirica BM, Sabatine MS, et al. Role of ST2 in non-ST-elevation acute coronary syndrome in the MERLIN-TIMI 36 trial. Clin Chem. (2012) 58(1):257–66. doi: 10.1373/clinchem.2011.173369
37. Shi Y, Dong G, Liu J, Shuang X, Liu C, Yang C, et al. Clinical implications of plasma galectin-3 in heart failure with preserved ejection fraction: a meta-analysis. Front Cardiovasc Med. (2022) 9:854501. doi: 10.3389/fcvm.2022.854501
38. Weinberg EO, Shimpo M, De Keulenaer GW, MacGillivray C, Tominaga S, Solomon SD, et al. Expression and regulation of ST2, an interleukin-1 receptor family member, in cardiomyocytes and myocardial infarction. Circulation. (2002) 106(23):2961–6. doi: 10.1161/01.cir.0000038705.69871.d9
39. Sanada S, Hakuno D, Higgins LJ, Schreiter ER, McKenzie AN, Lee RT. IL-33 and ST2 comprise a critical biomechanically induced and cardioprotective signaling system. J Clin Invest. (2007) 117(6):1538–49. doi: 10.1172/jci30634
40. Tudurachi BS, Anghel L, Tudurachi A, Sascău RA, Stătescu C. Assessment of inflammatory hematological ratios (NLR, PLR, MLR, LMR and monocyte/HDL-cholesterol ratio) in acute myocardial infarction and particularities in young patients. Int J Mol Sci. (2023) 24(18):14378. doi: 10.3390/ijms241814378
41. Yang Z, Li Y, Guo T, Yang M, Chen Y, Gao Y. The effect of inflammatory markers on mortality in patients with acute myocardial infarction. Sci Rep. (2025) 15(1):14514. doi: 10.1038/s41598-025-98408-y
42. Kang D, Choi KH, Yang S, Kim H, Park TK, Lee JM, et al. Clinical significance of low-density lipoprotein cholesterol percentage reduction and attained levels after percutaneous coronary intervention. CMAJ. (2025) 197(16):E442–e452. doi: 10.1503/cmaj.241713
43. Balachandran VP, Gonen M, Smith JJ, DeMatteo RP. Nomograms in oncology: more than meets the eye. Lancet Oncol. (2015) 16(4):e173–80. doi: 10.1016/s1470-2045(14)71116-7
44. Antman EM, Cohen M, Bernink PJ, McCabe CH, Horacek T, Papuchis G, et al. The TIMI risk score for unstable angina/non-ST elevation MI: a method for prognostication and therapeutic decision making. JAMA. (2000) 284(7):835–42. doi: 10.1001/jama.284.7.835
45. Poldervaart JM, Langedijk M, Backus BE, Dekker IMC, Six AJ, Doevendans PA, et al. Comparison of the GRACE, HEART and TIMI score to predict major adverse cardiac events in chest pain patients at the emergency department. Int J Cardiol. (2017) 227:656–61. doi: 10.1016/j.ijcard.2016.10.080
46. Morrow DA, Antman EM, Parsons L, de Lemos JA, Cannon CP, Giugliano RP, et al. Application of the TIMI risk score for ST-elevation MI in the national registry of myocardial infarction 3. JAMA. (2001) 286(11):1356–9. doi: 10.1001/jama.286.11.1356
47. Shen C, Wang S, Huo R, Huang Y, Yang S. Comparison of machine learning and nomogram to predict 30-day in-hospital mortality in patients with acute myocardial infarction combined with cardiogenic shock: a retrospective study based on the eICU-CRD and MIMIC-IV databases. BMC Cardiovasc Disord. (2025) 25(1):197. doi: 10.1186/s12872-025-04628-5
48. Tanik VO, Cinar T, Arugaslan E, Karabag Y, Hayiroglu MI, Cagdas M, et al. The predictive value of PRECISE-DAPT score for in-hospital mortality in patients with ST-elevation myocardial infarction undergoing primary percutaneous coronary intervention. Angiology. (2019) 70(5):440–7. doi: 10.1177/0003319718807057
Keywords: acute myocardial infarction, HALP score, sST2, nomogram, MACE events, post-PCI
Citation: Li C-Y, Wu H-B, Duan Y-W, Gao P, Li H-X, Wang X-C, Wang Y-C, Wang Y-Q, Bai S-R, Jia Y and Du R-P (2025) A nomogram model based on HALP score and sST2 for predicting 1-year MACE risk after PCI in acute myocardial infarction patients. Front. Cardiovasc. Med. 12:1641855. doi: 10.3389/fcvm.2025.1641855
Received: 5 June 2025; Accepted: 20 August 2025;
Published: 3 September 2025.
Edited by:
DeLisa Fairweather, Mayo Clinic Florida, United StatesReviewed by:
Yeison Alberto Garcés-Gómez, Catholic University of Manizales, ColombiaSüeda Zaman, Mamak State Hospital, Türkiye
Copyright: © 2025 Li, Wu, Duan, Gao, Li, Wang, Wang, Wang, Bai, Jia and Du. This is an open-access article distributed under the terms of the Creative Commons Attribution License (CC BY). The use, distribution or reproduction in other forums is permitted, provided the original author(s) and the copyright owner(s) are credited and that the original publication in this journal is cited, in accordance with accepted academic practice. No use, distribution or reproduction is permitted which does not comply with these terms.
*Correspondence: Rong-Pin Du, bGN5MTc3NDM3OTUyNDZAb3V0bG9vay5jb20=