Abstract
Objectives:
To establish an automated scoring system for abdominal aortic calcification (AAC) to facilitate standardized quantitative imaging analysis in support of clinical decision-making in atherosclerosis management.
Methods:
x-ray images of the abdominal aorta were obtained for 2,941 individuals from five medical centers in Zhejiang Province. Calcification severity was graded manually using the Kauppila scoring system, and cases were stratified into three groups based on total calcification burden. The automated assessment framework comprised two sequential components: a lumbar spine segmentation model based on nnUnet and an AAC score regression model based on ResNet. Model development was conducted using 1,737 training cases, with internal validation in 471 cases and external validation in 733 cases from independent centers. A retrospective matched cohort study was conducted in 200 AAC patients from Center B (100 dialysis-dependent and 100 not dialysis-dependent cases), to investigate associations with major adverse cardiovascular events.
Results:
The developed automated quantification system demonstrated mean absolute errors of 1.686 (internal validation set) and 1.920 (external validation set), with strong correlation to expert ratings (Spearman's ρ = 0.923 and 0.888, respectively, both P < 0.001). Inter-rater reliability analysis revealed excellent agreement with manual scoring (intraclass correlation coefficients of 0.913 internally and 0.874 externally). Stratification based on calcification severity showed optimal sensitivity for the moderate calcification category (88.6%), with superior specificity for the non/mild (94.2%) and severe (91.5%) categories.
Conclusion:
The established automated quantification system for AAC exhibits good assessment efficiency and measurement accuracy, offering a standardized approach to refine cardiovascular risk stratification in clinical practice.
Introduction
Atherosclerosis (AS), as the core pathological basis of cardiovascular diseases, is a leading cause of disability and all-cause mortality worldwide (1–4). Abdominal aortic calcification (AAC), as a radiological marker of AS (5–7), reflects the dynamic progression of vascular calcification in the atherosclerotic process, and the severity of AAC is significantly positively correlation with the arterial plaque burden. Notably, in patients with chronic kidney disease (CKD), particularly those who require maintenance dialysis, a quantitative AAC score has emerged as a key tool for assessing the risk of a cardiovascular event (8). Research has shown that this AAC score can be used not only for quantitative evaluation of the progression of AS but also as an important independent predictor of adverse cardiovascular events and all-cause mortality (9–11).
For the purpose of clinical AAC scoring, x-ray imaging has become the preferred radiological method for assessing AAC due to its significant advantages related to cost-effectiveness (12, 13). However, the diagnostic efficacy of x-ray–based AAC detection is inhibited by multidimensional technical limitations, including: (1) labor-intensive evaluation: traditional imaging assessment involves a manual, resource-heavy approach, which not only prolongs diagnostic time but also leads to inefficient allocation of medical resources (14); (2) subjectivity and variability: visual assessment methods are susceptible to influence by physician cognitive load and inter-observer variability, resulting in limited diagnostic reproducibility (15); and (3) lack of scalability: in large-scale screening scenarios, conventional methods are incapable of processing high-throughput imaging data due to the absence of an intelligent data processing framework. Therefore, the development of novel imaging-based assessment methods for AAC is critically needed.
Against the backdrop of generational advancements in traditional imaging assessment techniques, artificial intelligence (AI)-powered image analysis is reshaping the paradigm of AAC evaluation. Early breakthroughs were achieved through machine learning models based on dual-energy x-ray absorptiometry (DXA) imaging (16, 17), which enabled automated AAC scoring and advanced cardiovascular disease research. However, clinical AAC assessment currently relies primarily on conventional x-ray images (e.g., lateral lumbar or abdominal radiographs). While anatomical structure overlap is a challenge shared by both lateral lumbar DXA and conventional x-ray imaging, the latter presents greater difficulties for automated analysis due to higher image heterogeneity and the absence of standardized quantitative outputs. Conventional x-rays provide benefits like higher spatial resolution and better soft-tissue contrast (resulting from smaller pixels and higher doses), but their variability remains a significant hurdle.
While convolutional neural networks (CNNs) have demonstrated remarkable success in medical image analysis (18), the studies conducted so far toward an automated AAC scoring system have faced significant limitations. For example, one study reported an end-to-end CNN-based AAC scoring model (15), but its single-center design may limit the model's generalizability across heterogeneous clinical settings.
Unlike existing AAC scoring systems constrained by traditional machine learning (16, 17) or single-center designs (15), the present study aimed to use a multicenter dataset to establish an x-ray–based deep learning framework, which can provide enhanced clinical efficiency and scoring accuracy for physicians.
Materials and methods
Data acquisition
We retrieved abdominal aortic radiographs from the picture archiving and communication systems (PACS) of five medical centers in Zhejiang Province and exported images in Digital Imaging and Communications in Medicine (DICOM) format while preserving essential clinical information for analysis.
The following inclusion criteria were applied: age >18 years; availability of lateral abdominal or lumbar radiographs; and image coverage from T12 to S1 vertebrae, with anterior soft tissue thickness exceeding vertebral anteroposterior diameter (ensuring complete visualization of the abdominal aorta from diaphragm to iliac bifurcation).
Cases were excluded according to the following exclusion criteria: structural incompleteness or significant vertebral destruction/compression (L1–L4 anterior vertebral height <2 cm), due to the resultant distortion of anatomical landmarks essential for standardized Kauppila scoring; poor image quality due to artifacts/noise obscuring lumbar vertebral structures; or prominent high-density overlapping shadows in lumbar/aortic regions. The detailed baseline clinical characteristics of the study participants are presented in Table 1.
Table 1
| Hospital | A | B | C | D | E | Total | P value |
|---|---|---|---|---|---|---|---|
| Sex | P < 0.001, F = 11.97 | ||||||
| F, n (%) | 727 | 414 | 79 | 47 | 185 | 1,452 | |
| M, n (%) | 737 | 319 | 105 | 117 | 211 | 1,489 | |
| Age, mean ± SD (years) | 70.3 ± 10.9 (23–97) | 68.6 ± 11.0 (21–97) | 62 ± 13.3 (21–94) | 65.7 ± 11.2 (37–89) | 62.1 ± 11.2 (32–89) | 68 ± 11.6 (21–97) | P < 0.001, F = 58.14 |
| CKD, n | 327 | 164 | 184 | 164 | 396 | ||
| Lumbar lateral | 1,137 | 569 | – | – | – | ||
| Company | Philips | Shimadzu | – | – | – | – | |
| Tube current, mA | 400 (400–517) | 400 (400–630) | – | – | – | – | |
| Tube voltage, Kv | 85 (85–95) | 95 (80–95) | – | – | – | – | |
| Abdominal lateral | 327 | 164 | 184 | 164 | 396 | ||
| Company | Philips | Shimadzu | Philips | Philips | United film | – | |
| Tube current, mA | 320 (320–320) | 250 (250–400) | 320 (320–320) | 320 (320–320) | 400 (400–508) | – | |
| Tube voltage, Kv | 85 (85–85) | 80 (80–100) | 85 (85–85) | 85 (85–85) | 85 (85–85) | – | |
| AAC score (manual) | |||||||
| No/Mild | 3 (0,4) | 2 (0,4) | 1 (0,4) | 2 (0,4) | 2 (0,4) | 2 (0,4) | P < 0.001, F = 12.03 |
| Moderate | 9 (5,15) | 8 (5,15) | 9 (5,15) | 7 (5,15) | 10 (5,15) | 9 (5,15) | P < 0.001, F = 6.23 |
| Severe | 18 (16,24) | 18 (16,24) | 16 (16,19) | 17 (16,23) | 19 (16,24) | 18 (16,24) | P = 0.026, F = 2.86 |
Baseline patient characteristics and x-ray image acquisition conditions.
This study was approved by the Medical Ethics Committee of Ningbo University Affiliated First Hospital (Approval No.: 2025-040A) and adhered to the principles outlined in the Declaration of Helsinki. All clinical data were anonymized per institutional protocols, in compliance with China's Ethical Review Measures for Life Sciences and Medical Research Involving Human Subjects. The need for an informed consent was exempted due to the retrospective nature of the study.
Dataset partitioning
To reduce computational costs while maintaining accuracy, we randomly selected 142 images from Center A (November 2021 to December 2021) and Center C (November 2023 to November 2023) to establish a small-scale dataset for lumbar segmentation model development. This subset was used for preliminary region-of-interest (ROI) localization, with a 132:10 training:test split ratio. A radiologist manually annotated L1–L5 vertebral bodies using ITK-SNAP software.
To develop the AAC scoring regression model, the dataset was systematically partitioned by lumbar segmentation model. The training set comprised data from: Center A (January 2019 to July 2023), Center C (January 2022 to November 2023), Center D (January to December 2023), and Center E (January 2021 to December 2023). The internal validation set included cases from: Center A (August 2023 to February 2024) and Center E (January to March 2024). We maintained an approximate 4:1 ratio between training and internal validation sets. Additionally, cases from Center B (January 2021 to January 2024) served as the external validation set for rigorous evaluation of the model's generalizability.
Manual AAC scoring
For manual scoring of AAC, this study employed the internationally recognized Kauppila semi-quantitative scoring method (19, 20), the gold standard for AAC assessment. The standardized evaluation protocol assessed four aortic segment pairs (anterior/posterior walls) corresponding to the L1–L4 vertebral levels, with segment boundaries defined at midpoints of adjacent intervertebral spaces. The grading criteria were as follows: no detectable calcification: 0 points; calcification length <1/3 of aortic segment: 1 point; calcification length ≥1/3 but ≤2/3 of segment: 2 points; and calcification length >2/3 of segment: 3 points. Based on the total score, cases were classified as: no or mild AAC (0–4 points), moderate AAC (5–15 points), or severe AAC (16–24 points) (21).
To ensure scoring accuracy, all raters were rigorously trained by applying the Kauppila scoring system to 451 training cases before formal evaluation for the present study. AAC scoring was performed through a standardized, double-blind protocol involving three stages: (1) initial independent scoring by two junior radiologists with <5 years of experience; (2) adjucation by a senior radiologist (≥5 years' experience) for cases with discrepant AAC24 total scores between junior radiologists were adjudicated (Through independent review, the senior radiologist assigned Kauppila sub-scores (0–3) to anterior/posterior walls of L1–L4 vertebrae. The definitive AAC24 reference standard was derived from this assessment.); and (3) quality control verification by another senior radiologist who independently scored cases in the internal/external validation sets and confirmed proper ROI localization in images, which had been processed by the lumbar spine segmentation and localization model. Figure 1 outlines the model design and laboratory workflow design.
Figure 1
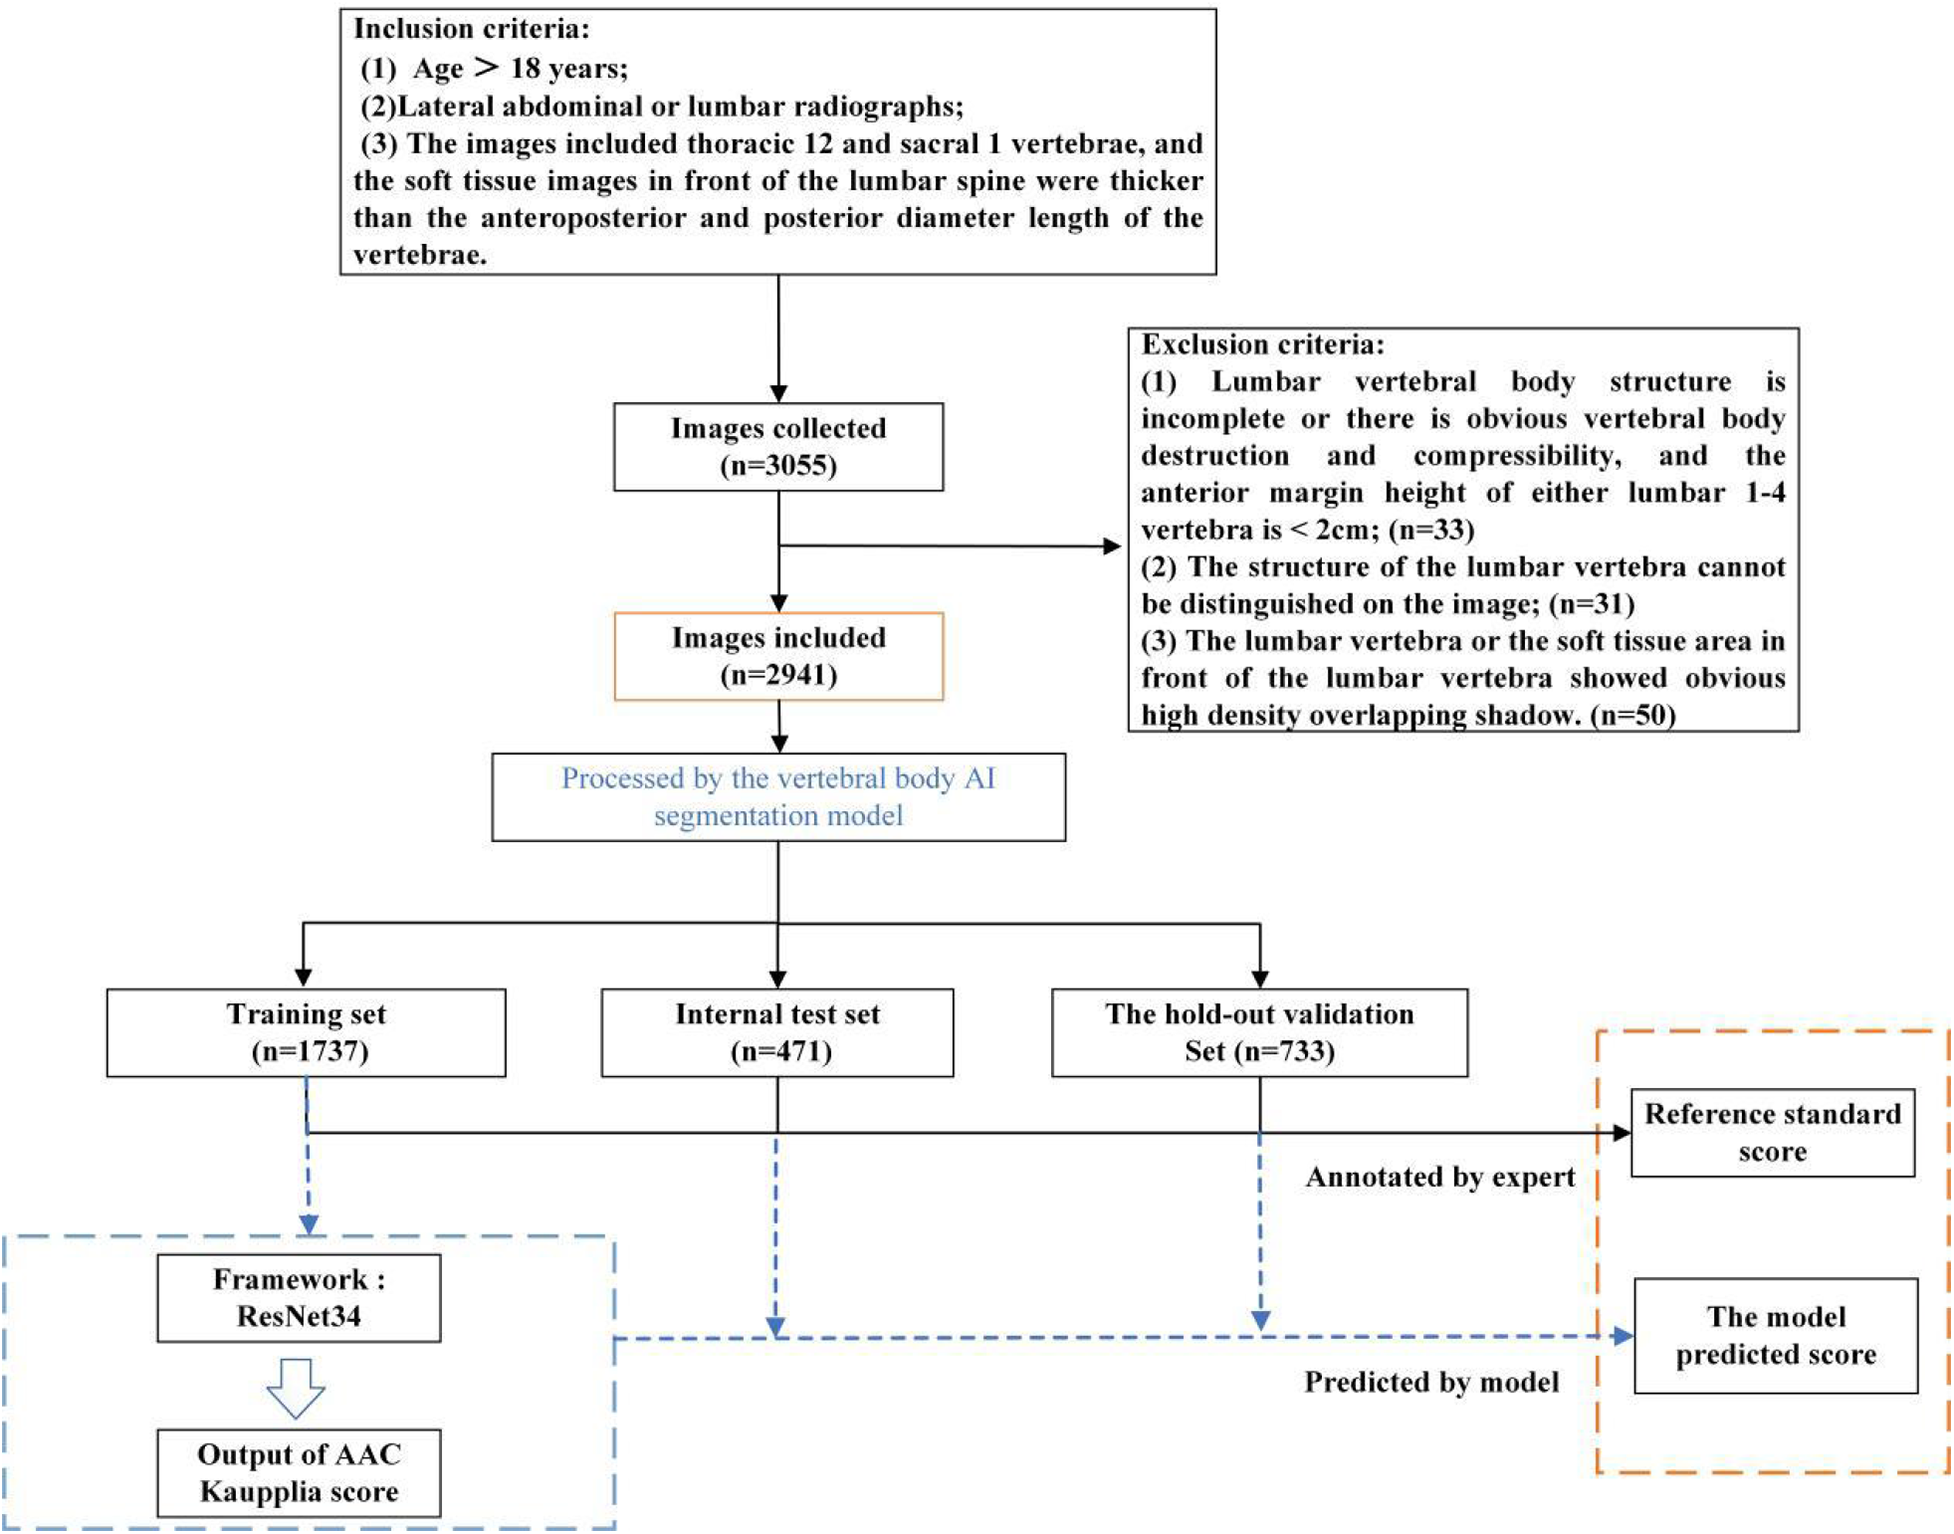
Schematic diagram of the model design and laboratory workflow design processes.
Clinical analysis
This study utilized an artificial intelligence-assisted calcification scoring system to screen abdominal aortic x-ray images from Center B's database (January 2023 to January 2024), identifying cases with AAC positivity (AAC score ≥1). Using a stratified random sampling method based on patients' dialysis history, the study established Observation Cohort 1 comprising 100 patients who received maintenance dialysis. For the control group (Observation Cohort 2), 100 patients not receiving dialysis treatment were chosen based on criteria including a glomerular filtration rate (GFR) >80 ml/min and no history of dialysis. Clinical data for both groups were retrospectively collected through the review of electronic medical records and telephone follow-ups, covering the period from January 2020 to December 2024. The primary focus was comparing the cumulative incidence of major adverse cardiovascular events (MACEs) between the two cohorts during the 5-year follow-up period. The MACE composite endpoint included four clinical outcomes: hemorrhagic stroke, ischemic stroke, myocardial infarction, and heart failure.
Construction of the AAC automated scoring system
The AAC automated scoring system primarily consists of two components: a lumbar spine segmentation and localization model and an AAC scoring regression model, as illustrated in Figure 2. The AAC score was treated as a continuous target variable for regression. This approach is justified as the score is derived from a continuous underlying physical quantity (calcified area), and each unit increment represents a comparable change in the extent of calcification.
Figure 2
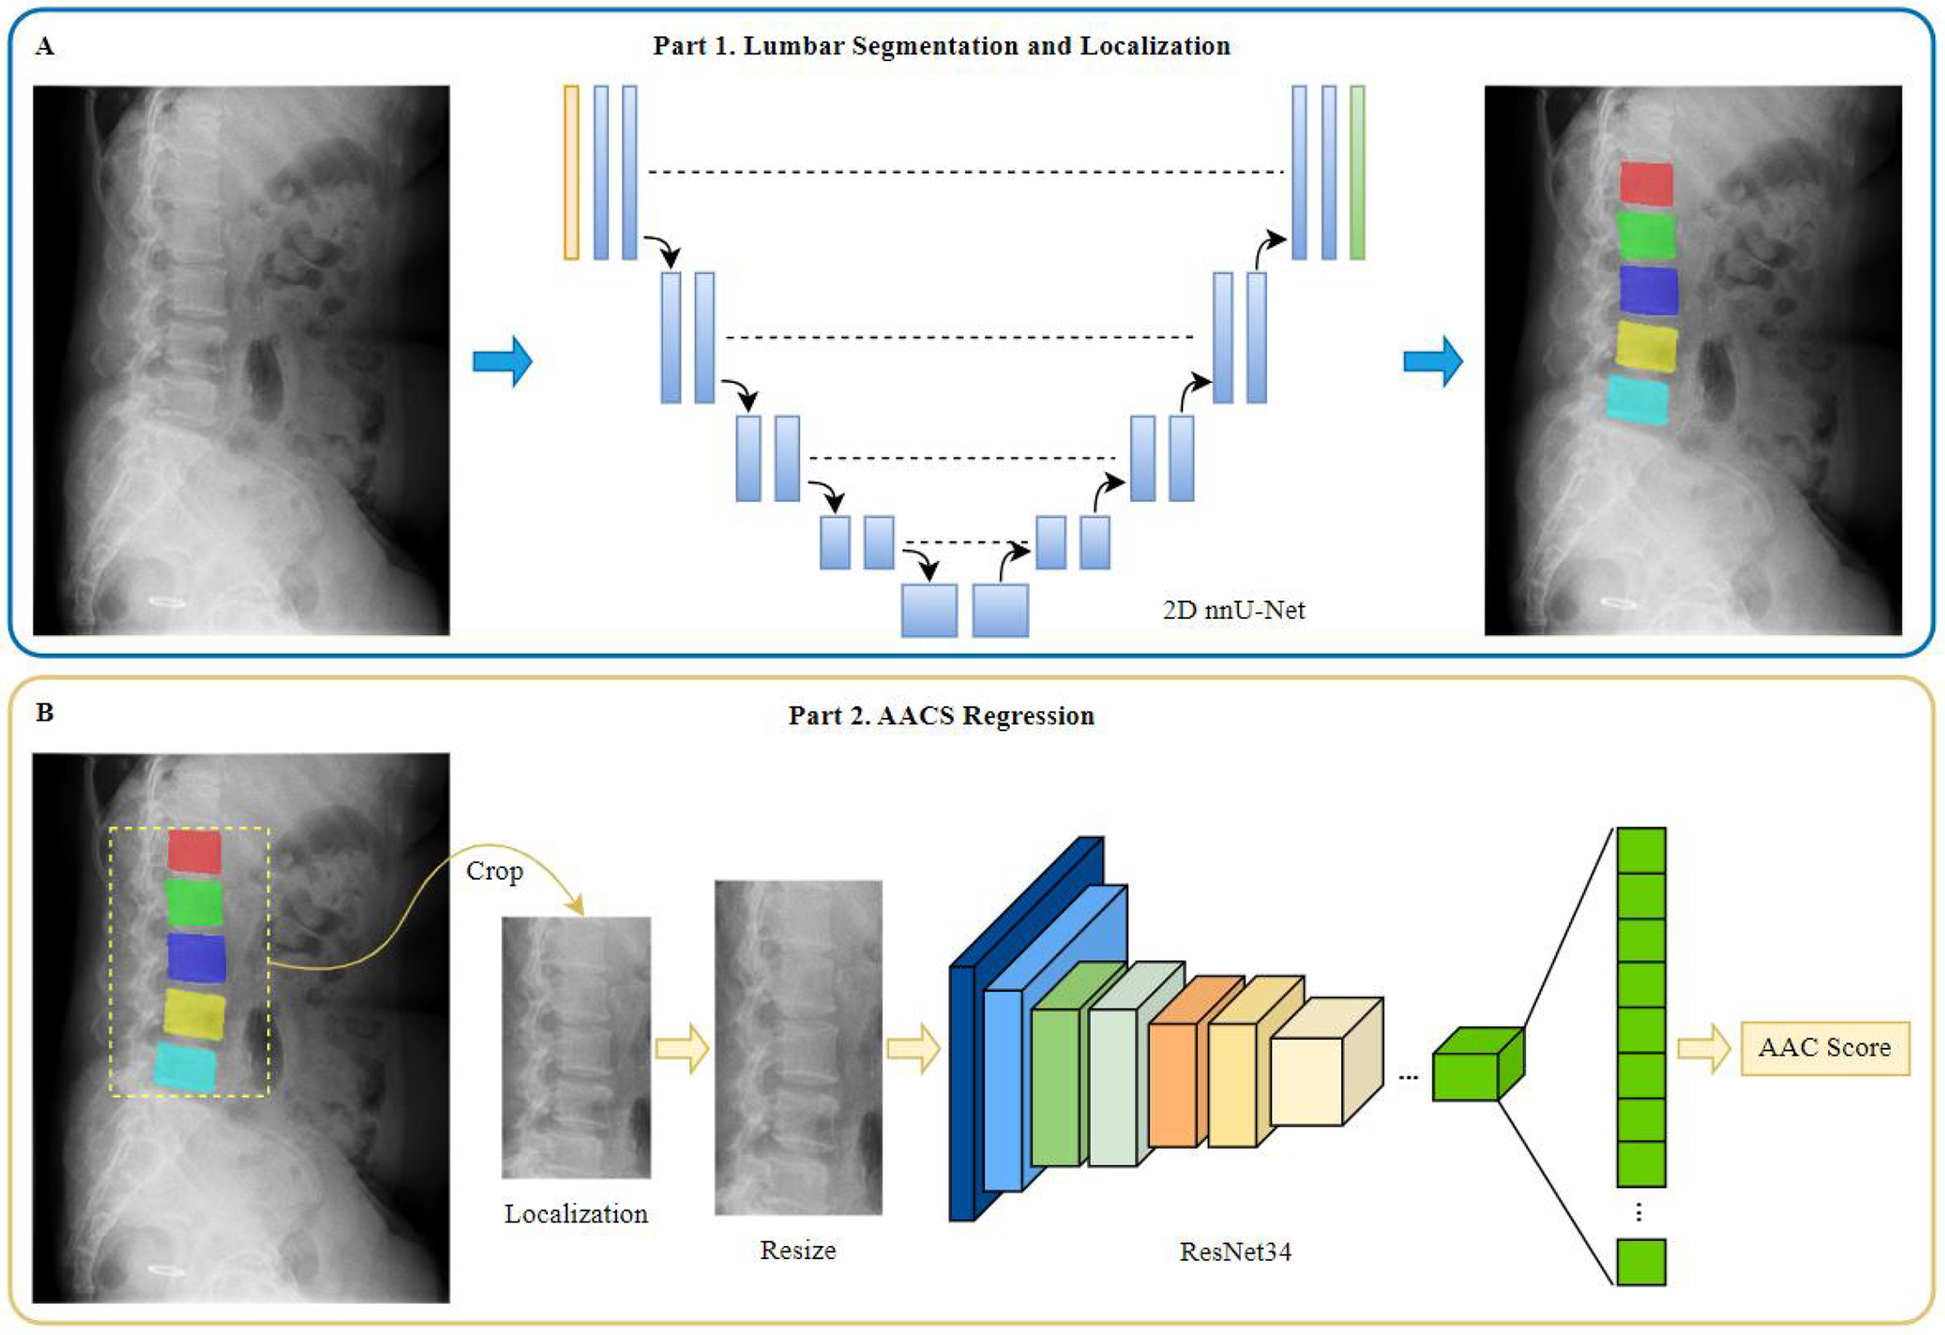
Diagram of model construction for different tasks. (A) Part 1 of the model for lumbar segmentation and localization. (B) Part 2 of the model for AACS regression.
Lumbar spine segmentation and localization model
The lumbar spine segmentation model was constructed using the 2D nnU-Net (22) framework, a state-of-the-art tool that automatically configures optimal preprocessing, network architecture, training, and postprocessing for a given dataset. This “no-new-Net” philosophy was selected to eliminate subjective manual tuning and ensure a robust, reproducible baseline, which is critical for providing high-quality masks for subsequent analysis.
The automatically configured architecture featured a 9-level encoder-decoder structure with feature channels of [32, 64, 128, 256, 512, 512, 512, 512, 512] at each stage. The encoder employed consecutive convolutional layers with 3 × 3 kernels and instance normalization, progressively reducing spatial dimensions while increasing feature channels to capture hierarchical features at different scales. The decoder then upsampled the feature maps, recovering the original spatial dimensions of the input image. Skip connections were incorporated to fuse low-level spatial features from the encoder with high-level semantic features from the decoder.
During training, the model was optimized using a combined dice and cross entropy loss based on five-fold cross validation. The network was trained on 1,536 × 1,024 pixel patches with a batch size of 2, employing Z-score normalization for intensity standardization. Complete configurations are provided in the Supplementary plans.json File.
AAC scoring regression model
Prior to constructing the AAC scoring regression model, a series of image preprocessing steps were performed as follows: (1) segmentation mask generation: using the lumbar spine segmentation and localization model, segmentation masks for vertebrae L1–L5 were obtained; and (2) extraction: based on these masks, normalized original images were cropped to generate image patches containing the L1–L5 vertebral regions. The vertical coverage extended from the inferior border of T12 to the inferior border of L5. The horizontal coverage included the L1–L5 vertebrae as well as soft tissue regions extending 3/4 of the average anteroposterior vertebral length anteriorly. The processed image data were then used as input for the subsequent AAC scoring regression model.
Images were uniformly resized to 500 × 1,000 pixels. To generate a larger, more complex, and diverse dataset for enhancement of model accuracy and generalizability, images were augmented using several different methods, including random brightness adjustment (±10% adjustment), random contrast adjustment (±10% adjustment), random addition of Gaussian noise (σ∈[0,10]), random shift operation (±5% of image size), random scaling (±5%), and random angle rotation (±30 degrees). Augmentation was performed only in the training set before each epoch.
The AAC scoring regression model was constructed based on the framework of ResNet34, a publicly available deep residual network (23) comprising 34 layers. This choice was based on ResNet's established efficacy as a deep feature extractor for two-dimensional images, particularly its ability to mitigate vanishing gradients through residual connections, which enables stable training of deep networks. To validate the architectural choices, a comparative ablation study was conducted against a VGG16_bn-based model under identical training conditions (detailed description provided in Supplementary Materials).
Transfer learning was implementded by fine-tuning the ImageNet-pretrained ResNet34 model weights. While the original ResNet34 was designed for classification tasks with a final fully-connected layer outputting 1,000 class probabilities, we modified the architecture for our regression task by replacing the final classifier with a custom sequential module. This module consisted of batch normalization, a dropout layer (P = 0.5), and a linear layer configured to produce a single continuous output value. To enhance feature representation, we integrated Spatial and Channel Squeeze & Excitation (SCse) attention modules (24) after each residual block, enabling the model to focus on informative spatial regions and channel features.
The model was optimized using stochastic gradient descent with a momentum of 0.9 and weight decay of 0.0005, with an initial learning rate of 0.01. Training was conducted with a batch size of 32 for 500 epochs using mean squared error (MSE) as the loss function, with early stopping based on validation performance. Validation loss was monitored every 10 epochs, and training was effectively terminated at epoch 400 when validation loss plateaued, indicating no further improvement (Supplementary Figure S2). We employed an enhanced learning rate scheduling strategy combining linear warmup and cosine annealing. During the initial 200 iterations, the learning rate was linearly increased from 0.0033 (one-third of the base learning rate 0.01) to the full base value of 0.01. This warmup phase improved training stability by preventing early gradient explosion. Subsequently, the learning rate followed a cosine decay function to a minimum value of 0.0001 over the remaining training epochs, facilitating convergence to better optima (25).
Experimental evaluation metrics
All statistical analyses were conducted using SPSS software (version 27.0) and Python. The normality of continuous variables was assessed using the Shapiro–Wilk test and Q-Q plots. Normally distributed data are presented as mean ± standard deviation (mean ± SD), and non-normally distributed data are reported as median (range or interquartile range [IQR]). Categorical variables are expressed as frequency count (percentage, n [%]).
The AAC total score was treated as a continuous variable. Depending on the data distribution (assessed by skewness and kurtosis tests) of both model-predicted scores and manual standard scores, the Pearson correlation coefficient was calculated to evaluate linear relationships when normality assumptions were met. Otherwise, Spearman's rank correlation coefficient was determined to assess monotonic associations. Model fit was quantified using the R2 coefficient. Prediction accuracy was measured by MSE and mean absolute error (MAE), with 95% confidence intervals (CIs) derived via bootstrapping (1,000 iterations). This involved repeatedly resampling the training set with replacement, retraining the model, predicting on the original test set, and calculating error metrics per iteration. The 95% CIs were defined as the 2.5th and 97.5th percentiles of the resulting MSE and MAE distributions. Agreement between manual standard scores and model predictions was evaluated by calculating intraclass correlation coefficients (ICCs, two-way random-effects model ICC [2,1]) and weighted Kappa coefficients, with statistical significance set at P < 0.05.
Model performance was comprehensively evaluated through: (1) confusion matrices and calculation of overall accuracy rates, and (2) subgroup-specific metrics including accuracy, sensitivity, specificity, negative predictive value (NPV), and positive predictive value (PPV). Sensitivity analyses for cardiovascular outcomes included age/sex stratification and E-value calculation to assess unmeasured confounding effects.
Results
Baseline characteristics of study participants
The study population included a total of 1,464 cases from Center A (January 2019 to February 2024), 733 cases from Center B (January 2021 to January 2024), 184 cases from Center C (January 2022 to November 2023), 164 cases from Center D (January to December 2023), and 396 cases from Center E (January 2021 to March 2024).
For this study, a total of 1,737 cases were assigned to the training cohort, 471 to the internal validation cohort, and 733 to the external validation cohort. All imaging cohorts retained the full AAC spectrum (0–24). The detailed data distribution is shown in Table 2.
Table 2
| Dataset | Total | Abdominal lateral | Lumbar lateral | No/mild AAC (score 0–4) | Moderate AAC (score 5–15) | Severe AAC (score 16–24) |
|---|---|---|---|---|---|---|
| Training | 1,737 | 795 | 942 | 387 | 1,124 | 226 |
| Internal validation | 471 | 285 | 186 | 116 | 292 | 63 |
| External validation | 733 | 164 | 569 | 246 | 406 | 81 |
Dataset partitioning for development and testing of AAC scoring regression model.
Segmentation and locoalization performance
For the lumbar spine segmentation model, the performance in segmenting vertebrae L1–L5 in the test set was excellent, with Dice scores of 0.92, 0.93, 0.95, 0.94, and 0.94, respectively. The segmentation model was subsequently applied to all imaging data to extract image patches for input into the AAC scoring regression model. Through manual review, the segmentation outputs met predefined ROI coverage criteria in 92.6% of cases (1,115/1,204) across both the internal and external validation sets.
AAC scoring regression performance
The AAC scoring regression model demonstrated excellent performance on the internal validation set with a MAE of 1.686, MSE of 4.730, and Spearman correlation coefficient of 0.923 (P < 0.001). Similar robust performance was observed in the external validation set (MAE = 1.920; MSE = 5.835; Spearman's ρ = 0.888, P < 0.001). Furthermore, the proportions of predictions deemed clinically acceptable (absolute error <4) were 90.0% and 87.6% in the internal and external validatiaon sets, respectively. Although marginally higher errors were noted in the external validation set, the model maintained clinically acceptable accuracy and stability overall. The complete results for all evaluation metrics are presented in Table 3, with visualizations provided in Figure 3.
Table 3
| Dataset | Mean absolute error (MAE) | Mean squared error (MSE) | Spearman's ρ | R 2 coefficient |
|---|---|---|---|---|
| Internal validation set | 1.686 (1.571, 1.811) | 4.730 (4.100, 5.393) | 0.923 (0.907, 0.935) P < 0.001 | 0.863 (0.835, 0.887) P < 0.001 |
| External validation set | 1.920 (1.809, 2.027) | 5.835 (5.235, 6.486) | 0.888 (0.886, 0.913) P < 0.001 | 0.811 (0.781, 0.835) P < 0.001 |
Model performance metrics for accuracy and correlation.
Figure 3
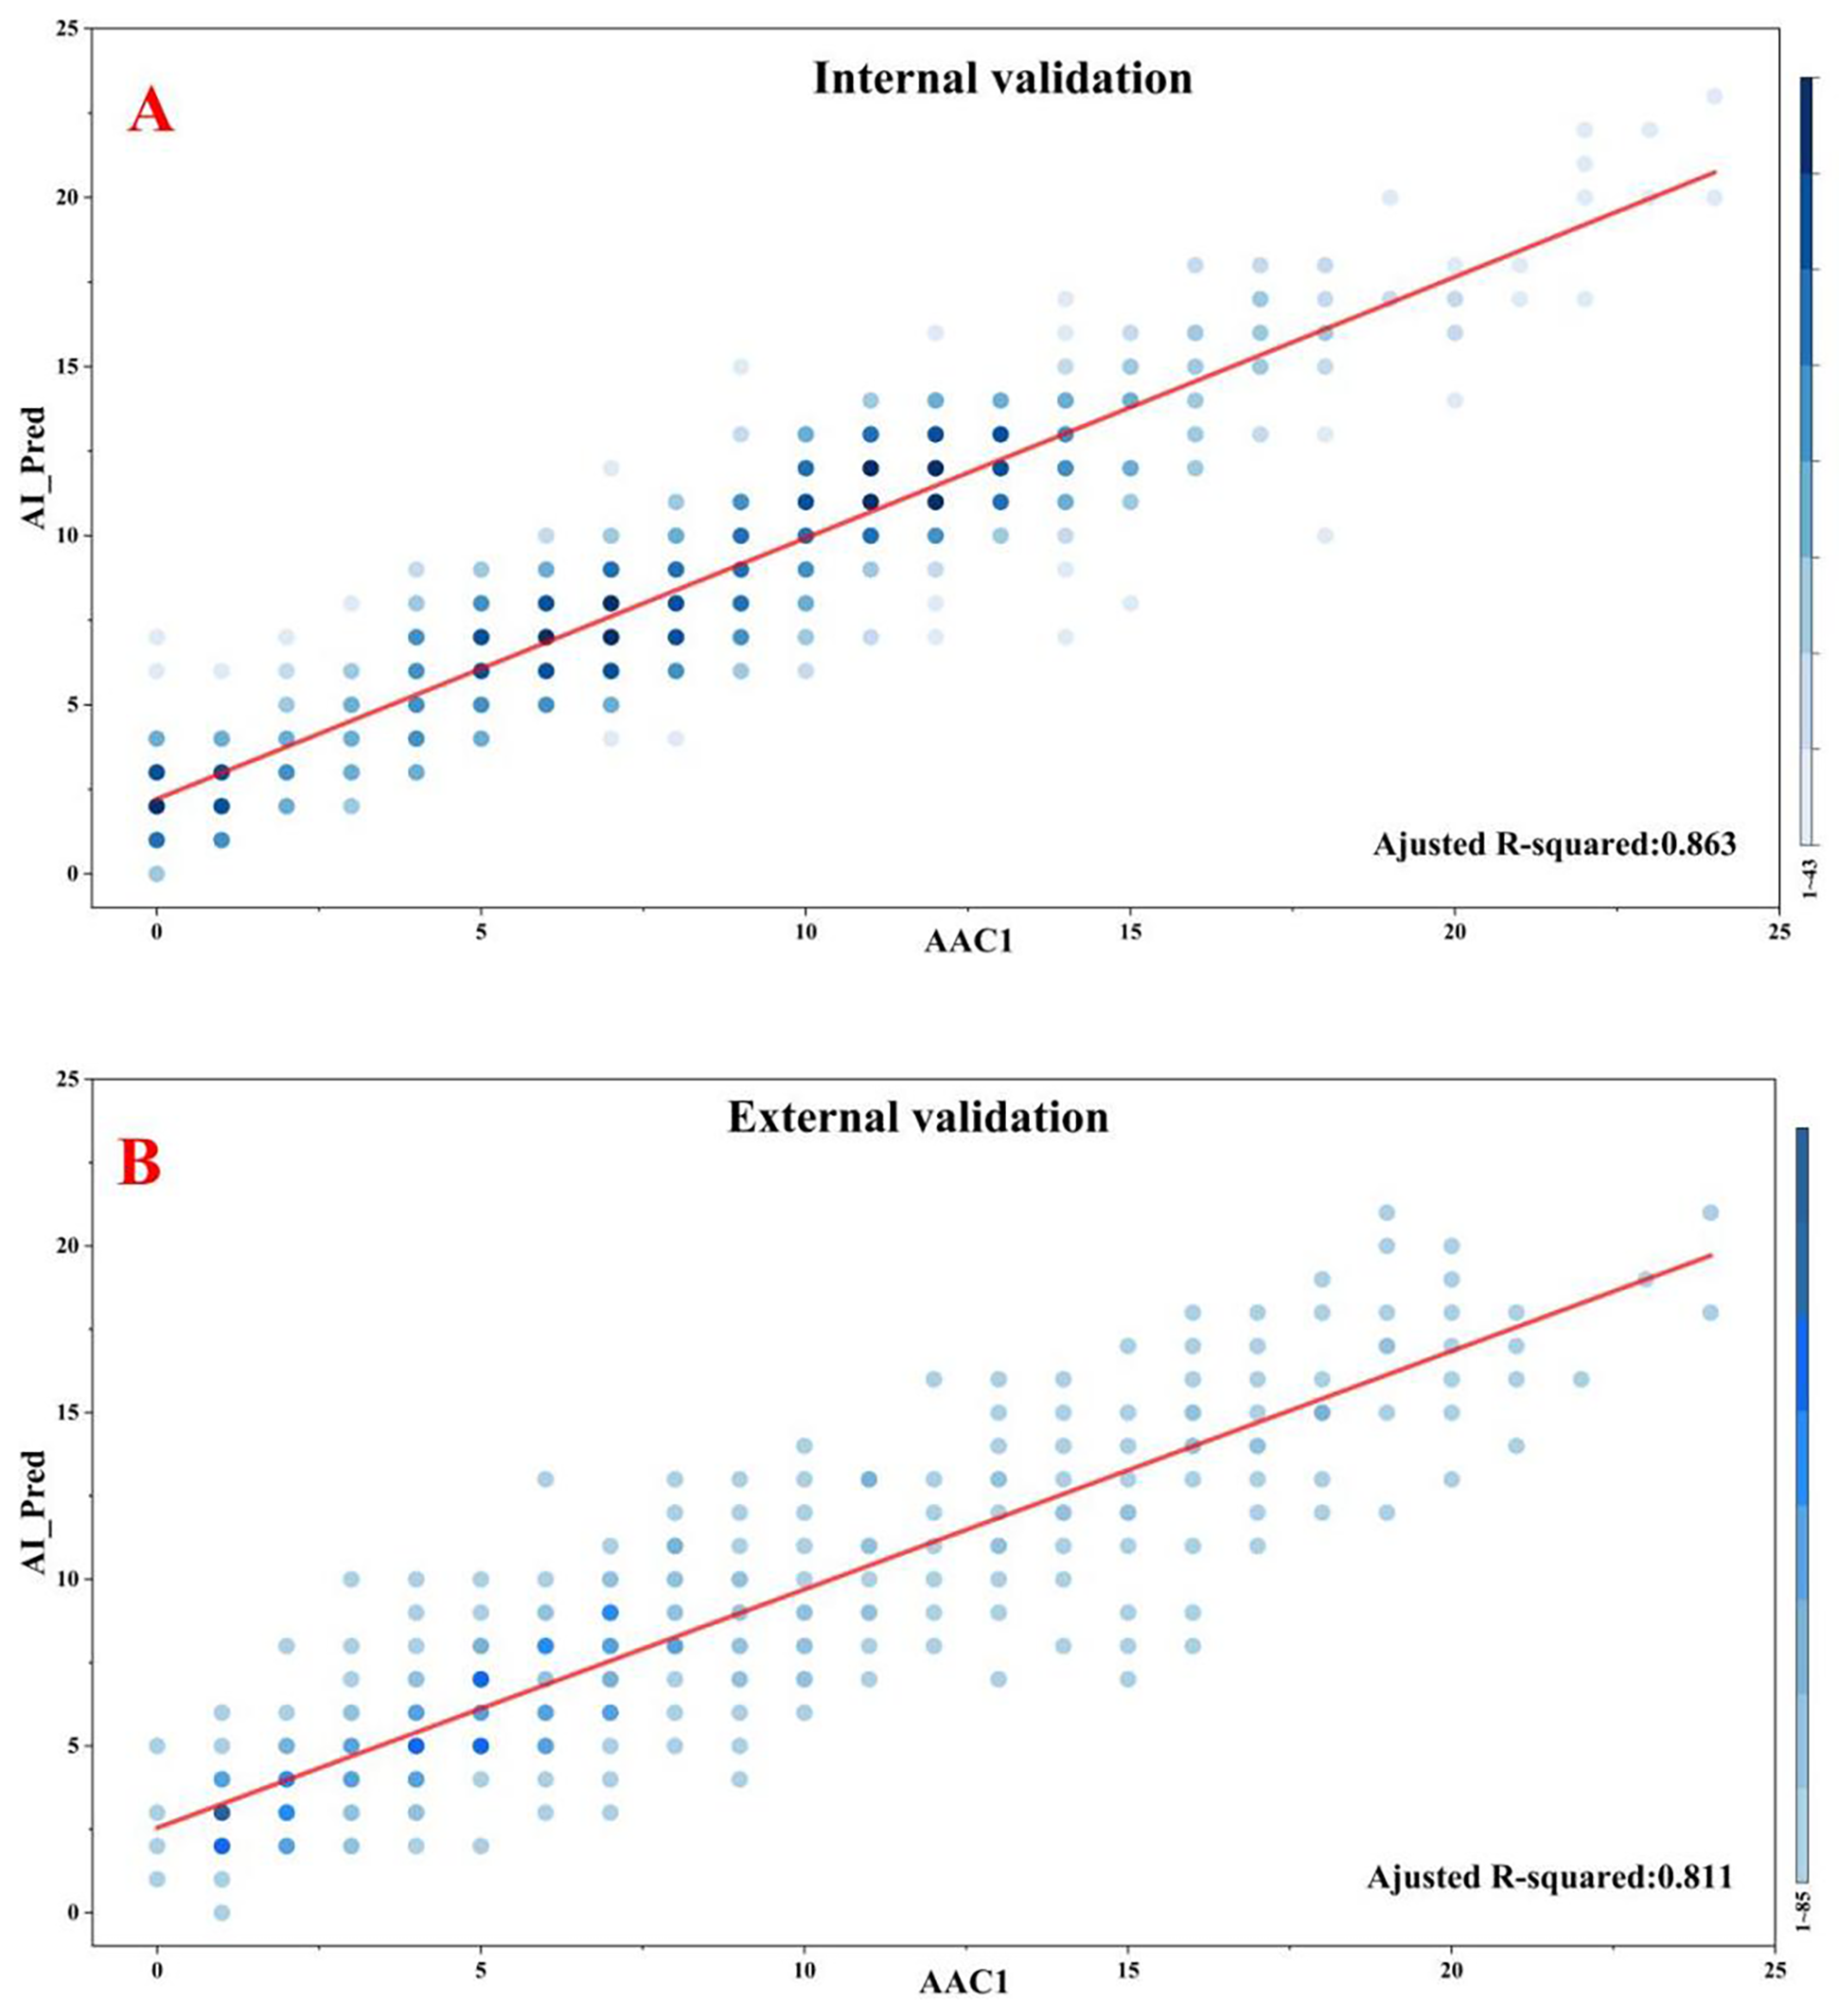
Correlations between model predictions and manual standard scoring. (A) Internal validation. (B) External validation.
Comparatively, the results of the ablation study based on an alternative VGG16_bn architecture were calculated. Under identical training conditions, the ResNet34-based model achieved lower MAE and MSE for both the internal and external validation sets (Supplementary Table S1). Furthermore, a higher proportion of predictions from the ResNet-34 model was clinically acceptable (absolute error <4). These results confirm the superiority of the chosen architecture for this task.
To further validate our findings, we conducted a comprehensive agreement analysis between manual standard scores (denoted as AAC1) and model-predicted scores (AI_Pred), with particular focus on ICCs and weighted Kappa statistics. Additionally, we incorporated a second independent manual rating (AAC2) for comparative analysis, to enable robust evaluation of discrepancies between the algorithmic and human assessments.
In the internal validation set, the model-predicted scores (AI_Pred) demonstrated strong agreement with manual standard scores (AAC1), as evidenced by an ICC of 0.913 and a weighted Kappa value of 0.716. For comparison, the inter-rater reliability between two human evaluators (AAC1 vs. AAC2) showed even higher concordance, with an ICC of 0.985 and weighted Kappa of 0.904.
In the external validation set, the agreement between manual standard scores (AAC1) and model predictions (AI_Pred) remained robust, with an ICC of 0.874 and weighted Kappa value of 0.644. By comparison, the inter-observer agreement between human raters (AAC1 vs. AAC2) in the external validation set showed superior consistency (ICC = 0.981, weighted Kappa = 0.887). The detailed results of this analysis are presented in Table 4.
Table 4
| Comparison | Dataset | ICC (95% CI) | Weighted Kappa (95% CI) |
|---|---|---|---|
| AAC1 vs. AAC2 | Internal validation set | 0.985 (0.981, 0.987)* | 0.904 (0.891, 0.917)* |
| External validation set | 0.981 (0.978, 0.983)* | 0.887 (0.876, 0.898)* | |
| AAC1 vs. AI_Pred | Internal validation set | 0.913 (0.897, 0.927)* | 0.716 (0.691, 0.741)* |
| External validation set | 0.874 (0.854, 0.892)* | 0.644 (0.620, 0.667)* |
Comparison of ICC and Kappa values between manual standard scores (AAC1) vs. alternative manual ratings (AAC2) and model predictions (AI_Pred).
All P < 0.001.
Model performance according to AAC severity
Subgroup analysis revealed significant performance disparities across different AAC severity categories (detailed in Table 5 and Figure 4). Most notably, for both the No/mild (0–4) and Severe (16–24) AAC groups, the model exhibited markedly lower sensitivity compared to that for the Moderate (5–15) category. In the internal validation set, the model had sensitivities of 74.1% for No/mild AAC and 65.1% for Severe AAC vs. 96.9% for Moderate AAC. Similarly, in the external validation set, these sensitivity values were 61.4% for No/mild AAC and 48.1% for Severe AAC vs. 96.1% for Moderate AAC. This consistent pattern (P < 0.001 for all inter-group comparisons) suggests potential detection challenges for extreme calcification conditions that warrant clinical attention.
Table 5
| Internal validation set (n = 471) | No/mild AAC (n = 116) | Moderate AAC (n = 292) | Severe AAC (n = 63) |
|---|---|---|---|
| Accuracy (%) | 92.6 (86.4–96.1) | 87.0 (82.7–90.4) | 94.5 (85.9–98.0) |
| Sensitivity (%) | 74.1 (65.4–81.2) | 96.9 (94.2–98.4) | 65.1 (52.8–75.7) |
| Specificity (%) | 98.6 (94.4–99.7) | 70.9 (65.4–75.8) | 99.0 (92.5–99.9) |
| NPV (%) | 92.1 (85.7–95.8) | 93.4 (90.0–95.7) | 94.8 (86.3–98.1) |
| PPV (%) | 94.5 (88.7–97.4) | 84.5 (79.9–88.2) | 91.1 (81.5–96.0) |
| External validation set (n = 733) | No/mild AAC (n = 246) | Moderate AAC (n = 406) | Severe AAC (n = 81) |
| Accuracy (%) | 85.5 (80.6–89.4) | 79.1 (74.9–82.8) | 93.6 (86.1–97.2) |
| Sensitivity (%) | 61.4 (55.2–67.3) | 96.1 (93.7–97.6) | 48.1 (37.6–58.8) |
| Specificity (%) | 97.7 (95.0–99.0) | 58.1 (53.2–62.8) | 99.2 (94.0–99.9) |
| NPV (%) | 83.4 (78.2–87.5) | 92.2 (89.2–94.4) | 93.9 (86.4–97.4) |
| PPV (%) | 93.2 (89.3–95.7) | 74.0 (69.5–78.0) | 88.6 (79.9–93.8) |
Model performance metrics across categories of AAC severity.
Figure 4
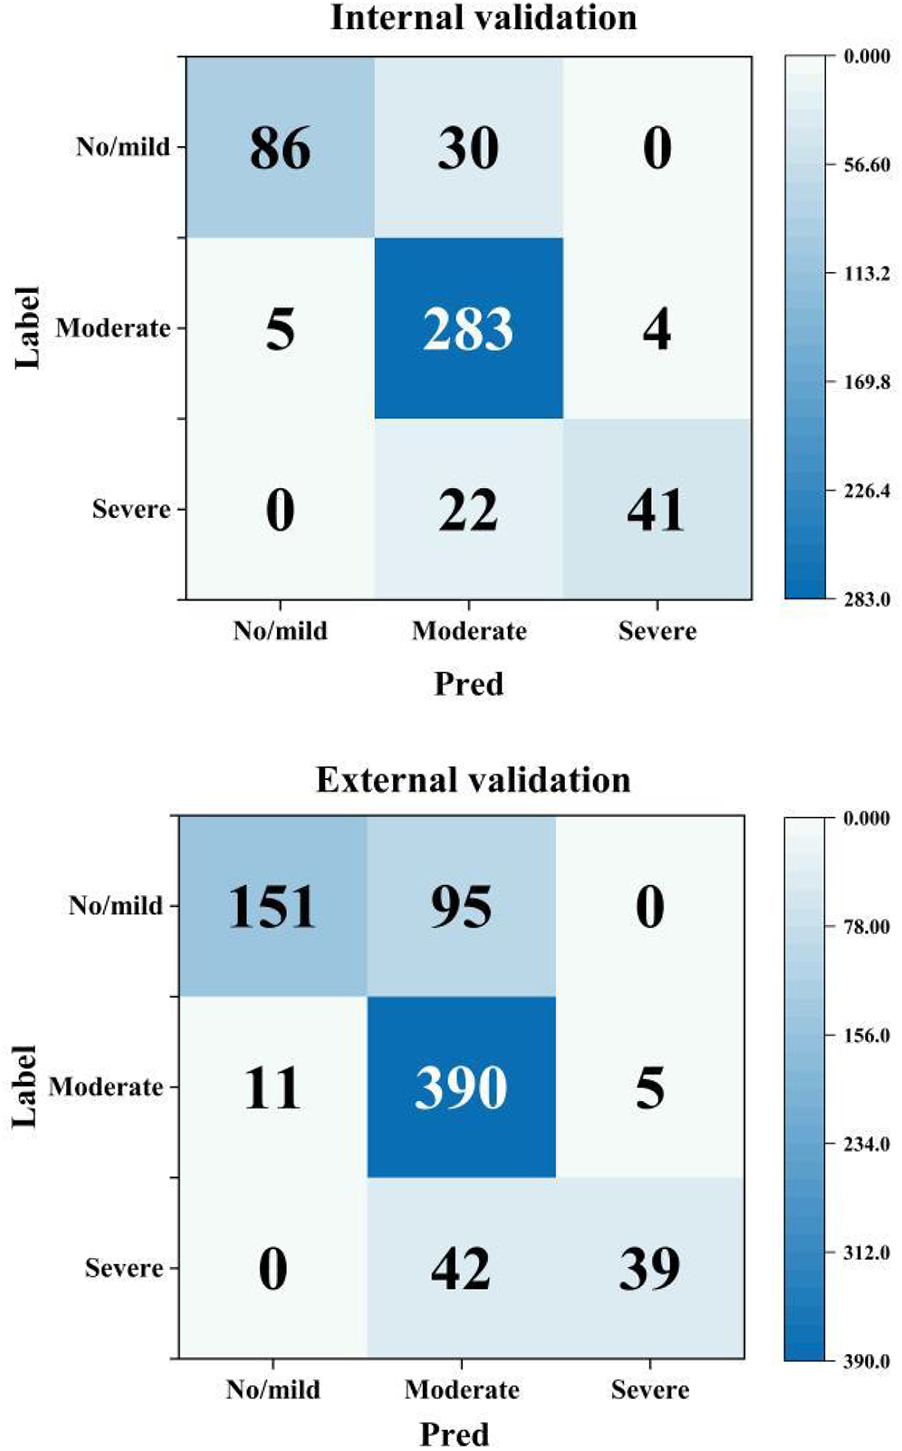
Confusion matrices by AAC severity category (Pred: model prediction, label: manual standard score).
Regarding specificity, the model showed significantly higher performance for both the No/mild and Severe AAC categories compared with the Moderate category. In the internal validation set, the model's specificity reached 98.6% for No/mild AAC and 99.0% for Severe AAC, whereas it was only 70.9% for Moderate AAC. Similarly, in the external validation set, the model's specificity was 97.7% for No/mild AAC and 99.2% for Severe AAC, in stark contrast with a value of only 58.1% for Moderate AAC (all inter-group comparisons P < 0.001). This inverse pattern related to the sensitivity results suggests a potential trade-off effect in model performance across the categories of AAC severity.
Visual interpretation analysis
To qualitatively verify the model's accuracy in localizing calcifications, we employed Grad-CAM (26) for visual explanatory insights. The results demonstrated strong agreement with radiologist assessments (78.35% correct focus; Supplementary Table S2) in the internal validation set. Figure 5 displays four randomly selected representative cases with distinct cardiovascular risk profiles involving: (A) chronic kidney disease, (B) hypertension, (C) hyperlipidemia, and (D) coronary artery disease. As exemplified in Figure 5A, the model's attention heatmap comprehensively covered nearly all AAC calcification areas, yielding a predicted AAC score of 22 points, which closely matched the manual score of 23 points.
Figure 5
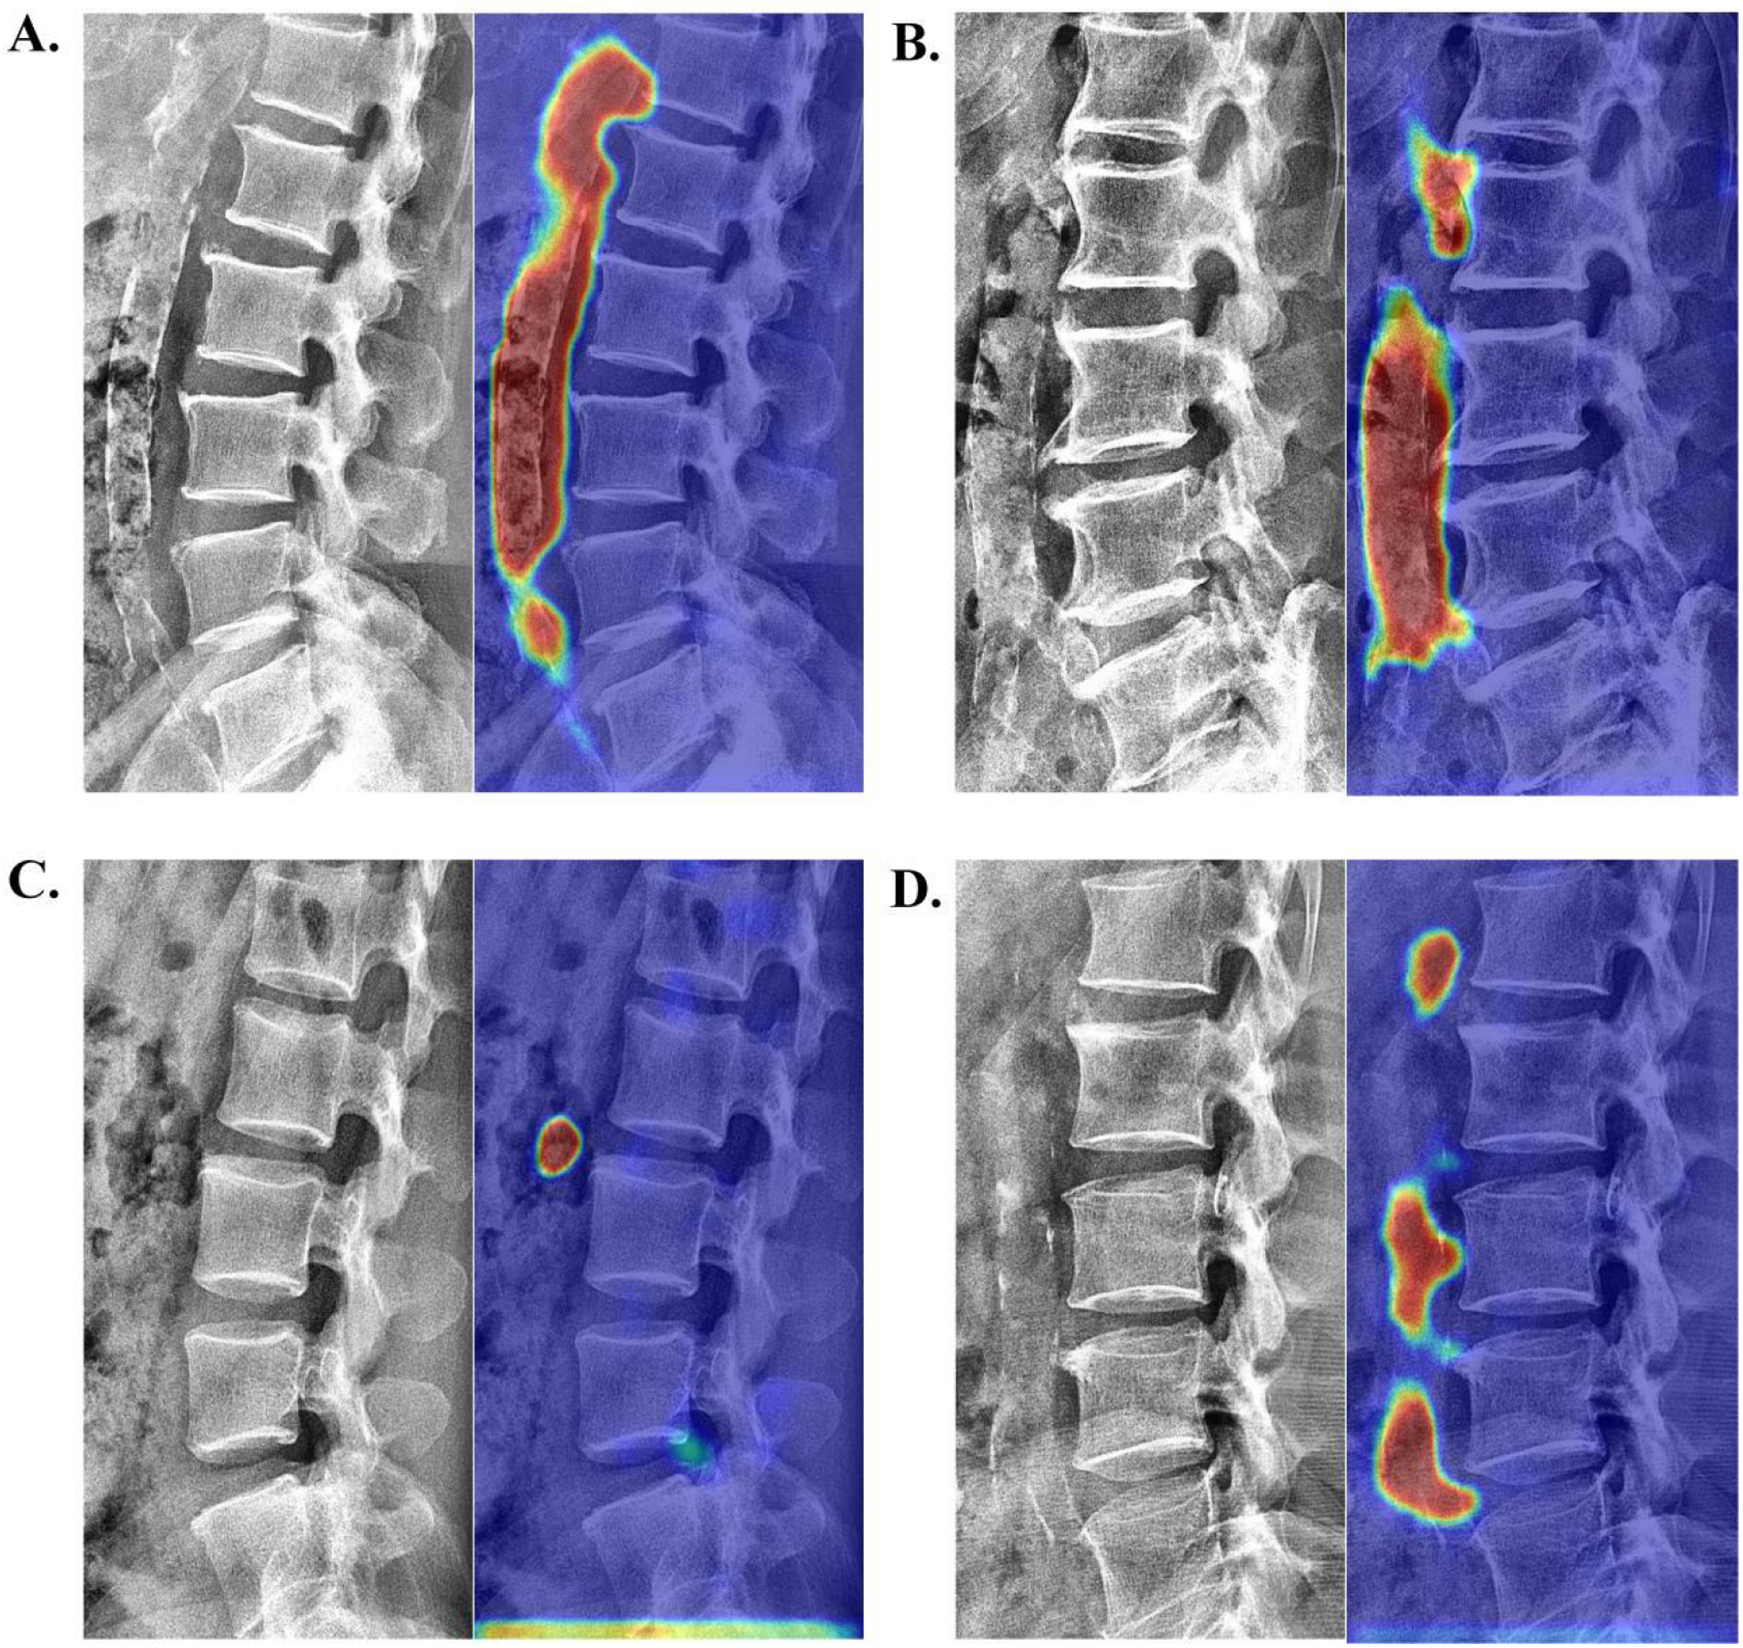
Visualization of neural network activation maps from the developed automated AAC scoring system for four randomly selected representative cases with distinct cardiovascular risk profiles involving: (A) chronic kidney disease (manual AAC score: 23; model-predicted score: 22), (B) hypertension (manual AAC score: 19; model-predicted score: 17), (C) hyperlipidemia (manual AAC score: 1; model-predicted score: 1), and (D) coronary artery disease (manual AAC score: 10; model-predicted score: 11).
Cardiovascular outcomes
In this 5-year retrospective study, a markedly higher cardiovascular risk was observed in the dialysis cohort, with 17 MACEs (15 patients, including 1 fatality) vs. 7 MACEs (7 patients) in the non-dialysis control cohort. Notably, 93.3% (14/15) of dialysis patients with MACEs and 85.7% (6/7) of non-dialysis cases with MACEs showed clinically significant calcification (AAC score >4). Furthermore, male patients predominated in the cohort (22% female vs. 78% male). Among younger patients with MACEs (age ≤65 years), those on dialysis substantially outnumbered non-dialysis individuals, whereas in the older group (age >65 years), both subgroups were similarly represented. These findings further underscore the prognostic value of vascular calcification assessment (see Table 6 for detailed results).
Table 6
| Parameter | Non-dialysis group (MACE+) | Dialysis group (MACE+) | Statistical values |
|---|---|---|---|
| Demographics | |||
| Age (years) | 83 (67–90) | 61 (54–79) | P = 0.453, F = 0.586 |
| Gender (M/F) | 5/2 | 12/3 | P = 0.673, F = 0.183 |
| Calcification | |||
| AAC score (predicted) | 8 (3–18) | 11 (2–19) | P < 0.001, F = 10.914 |
| MACE rate | |||
| Entire cohort | 7% | 15% | E-value = 3.71 (1.42–9.53) |
| Age ≤65 y (n = 9) | 0 (0%) | 9 (100.0%) | – |
| Age >65 y (n = 13) | 7 (46.2%) | 6 (53.8%) | – |
| Male (n = 17) | 5 (29.4%) | 12 (70.6%) | – |
| Female (n = 5) | 2 (40%) | 3 (60%) | – |
| MACEs | |||
| Hemorrhagic stroke | 1 | 3 | – |
| Ischemic stroke | 2 | 7 | – |
| Myocardial infarction | 4 | 5 | – |
| Heart failure | 0 | 2 | – |
MACEs during follow-up according to the need for dialysis.
Discussion
This multicenter study compiled and analyzed data for a total of 2,941 cases to develop and test an automated AAC scoring system using deep learning algorithms. The developed scoring system demonstrated both high scoring accuracy and robust clinical reliability in practical application. However, it is important to note that our model was trained and validated on a dataset from a single region, and its generalizability requires further external validation.
Model evaluation
First, this multicenter study (n = 2,941) utilized lumbar/abdominal lateral x-rays per the Kauppila criteria, offering significantly improved data diversity compared with single-center studies (15). Unlike the cohorts in prior studies, which exhibited right-skewed distributions (15, 17, 27), our cohort featured a substantially higher proportion of moderate calcification cases (AAC 5–15), achieving a near-normal sample distribution that enhanced the generalizability of the developed model across all calcification stages.
To address inherent field-of-view (FOV) variations in radiographs caused by technical/anatomical factors, we developed an innovative cascaded framework featuring: (1) a nnU-Net-based lumbar segmentation model, which achieved 92.6% precision in region localization and standardizes inputs by eliminating extra-aortic interference; and (2) a ResNet-based regression architecture (28, 29) that enhances micro-calcification detection (e.g., punctate/arc-shaped patterns) via skip connections while mitigating gradient vanishing. Furthermore, our architectural choices (nnUNet for segmentation and ResNet for regression) were empirically validated through an ablation study, which confirmed their superiority over a strong alternative (VGG16_bn) for this specific task. This systermatic approach to model selection enhances the reliability of our findings.
An important consideration in this study is the treatment of the AAC score as a continuous variable for regression. Although the score is discrete, its foundation in a continuous physical measurement (calcified area) justifies this approach. Our error analyses (Supplementary Figure S3) revealed no substantial bias across the score range, and the majority of prediction errors were minor (±1), indicating that the regression model effectively learned the underlying progression of vascular calcification. However, we acknowleage that the dataset exhibited imbalance, with underrepretation of extreme scores (both very low and very high). This imbalance may partially explain the weak but significant correlation (Spearman's ρ = 0.111, P < 0.05) between score and absolute error observed in the external validation set.
For clinical reliability, the model achieved clinically acceptable prediction rates (absolute error <4) of 90.0% in the internal validation set and 87.6% in the external validation set. Moreover, the developed model demonstrated excellent agreement with manual scoring in the internal validation set (R2 = 0.863, ICC = 0.913, weighted Kappa = 0.716), outperforming comparable deep learning models (R2 = .82) (15), with low prediction errors (MAE = 1.686, MSE = 4.730). External validation confirmed the strong generalizability of our model (R2 = 0.811, ICC = 0.874, Kappa = 0.644). Subgroup analysis according to AAC severity revealed robust model performance across all categories (average values for accuracy/sensitivity/specificity/NPV/PPV >75%).
The present study also successfully implemented Grad-CAM as a visualization tool for model activation mapping, to achieve dual purposes: (1) enabling clinicians to intuitively verify whether the model accurately identified ROIs and (2) enhancing the transparency and interpretability of AAC score predictions.
Clinical findings
As a preliminary exploratory study, the primary aim of this study was to provide an initial assessment of the model's performance within a well-characterized yet restricted cohort. This design inherently limits the interpretation of our prognostic findings and their generalizability. Nevertheless, the analysis of 200 systematically sampled AAC-positive cases revealed a significantly higher 5-year MACE incidence in dialysis vs. non-dialysis patients (15.0% vs. 7.0%, P < 0.01), with the requirement for dialysis occurring in younger individuals (median age, 61 vs. 83 years). These results not only align with the Kidney Disease Improving Global Outcomes (KDIGO) guidelines (8) and prior evidence (30, 31) but also identify substantial cardiovascular risk (7%) in AAC-positive patients with normal renal function.
Further analysis revealed a significantly higher median AAC score in dialysis-dependent cases that experienced MACEs (11 [IQR 2–19]) vs. non-dialysis cases (8 [IQR 3–18]). Notably, >70% of MACE patients in both groups exhibited moderate-to-severe calcification (AAC score >4), with a particularly high prevalence in the dialysis subgroup (93.3%, 14/15 cases) compared to the non-dialysis subgroup (71.4%, 5/7 cases). These findings corroborate prior research by Gebre et al. and Niu et al. (5, 6, 32), demonstrating that: (1) the AAC score can effectively stratify patients by MACE risk, and (2) patients with moderate-to-severe AAC (AAC score >4) have a substantially elevated cardiovascular risk compared with those with a low AAC score.
Limitations and future directions
While achieving a significant goal of developing an automated scoring system for AAC, the present study has several limitations. (1) The developed model showed suboptimal performance in cases with severe calcification (AAC score >15) and no/mild calcification (AAC score 0–4), particularly regarding scoring accuracy and subgroup classification. To improve future versions, we plan to incorporate strategies such as cost-sensitive learning and targeted data augmentation, alongside the prospective collection of more cases from under-represented subgroups to enhance model robustness across all AAC severity levels. (2) A potential limitation is the focus on comparing against a single alternative architecture (VGG16_bn). While this comparison robustly justified our choice, future work could expand this to include a broader range of modern achitectures, such as Vision Transformers.
Future directions for this research will include: (1) developing comprehensive calcification quantification metrics with segmental/wall-specific evaluation, complemented by a detailed class-wise analysis to optimize the established AAC scoring system; (2) improving visualization of calcification length/distribution (beyond heatmaps) and validating them via spatial metrics (e.g., Dice coefficient, IoU); (3) incorporating multi-center datasets from diverse regions with variations in imaging protocols, equipment, and demographic backgrounds to enhance model generalizability; and (4) expanding clinical validation through large-scale multicenter studies and multimodal data integration to strengthen cardiovascular risk stratification based on AAC assessment.
Conclusion
The present study developed a fully automated deep learning-based system for scoring the severity of AAC, and the developed system demonstrated strong agreement with manual ratings in both internal (ICC = 0.913) and external (ICC = 0.874) validation datasets. The developed system enables end-to-end AAC quantification from plain radiographs, offering an efficient solution for population-wide screening.
Statements
Data availability statement
The raw data supporting the conclusions of this article will be made available by the authors, without undue reservation.
Ethics statement
The studies involving humans were approved by Medical Ethics Committee of Ningbo University Affiliated First Hospital (Approval No.: 2025-040A). The studies were conducted in accordance with the local legislation and institutional requirements. The ethics committee/institutional review board waived the requirement of written informed consent for participation from the participants or the participants' legal guardians/next of kin because the retrospective nature of the study.
Author contributions
ZS: Data curation, Formal analysis, Investigation, Methodology, Software, Writing – original draft, Writing – review & editing. EX: Software, Writing – review & editing. LC: Data curation, Visualization, Writing – original draft. AL: Software, Writing – review & editing. CG: Data curation, Writing – review & editing. AL: Data curation, Funding acquisition, Writing – review & editing. YP: Conceptualization, Funding acquisition, Project administration, Resources, Supervision, Validation, Writing – review & editing.
Funding
The author(s) declare that financial support was received for the research and/or publication of this article. The financial support for the study was sourced from multiple entities: the Key Research and Development Project of Ningbo (Project identification nos. 2024Z220 and 2022S133); the Natural Science Joint Foundation of Zhejiang Province (Project code: LKLY25H200010); the Ningbo Clinical Research Center for Medical Imaging (Grant no.: 2022LY-KEYB03); the HwaMei Research Foundation of Ningbo No. 2 Hospital (Project no.: 2023HMKY50); the Public Welfare Science and Technology Program Project of CiXi (CN2024007).
Acknowledgments
We thank Medjaden Inc. for scientific editing of this manuscript.
Conflict of interest
The authors declare that the research was conducted in the absence of any commercial or financial relationships that could be construed as a potential conflict of interest.
Generative AI statement
The author(s) declare that no Generative AI was used in the creation of this manuscript.
Any alternative text (alt text) provided alongside figures in this article has been generated by Frontiers with the support of artificial intelligence and reasonable efforts have been made to ensure accuracy, including review by the authors wherever possible. If you identify any issues, please contact us.
Publisher’s note
All claims expressed in this article are solely those of the authors and do not necessarily represent those of their affiliated organizations, or those of the publisher, the editors and the reviewers. Any product that may be evaluated in this article, or claim that may be made by its manufacturer, is not guaranteed or endorsed by the publisher.
Supplementary material
The Supplementary Material for this article can be found online at: https://www.frontiersin.org/articles/10.3389/fcvm.2025.1647882/full#supplementary-material
Abbreviations
AS, atherosclerosis; CNNs, convolutional neural networks; DXA, dual-energy x-ray absorptiometry; AAC, abdominal aortic calcification; AACS, abdominal aortic calcification score; CKD, chronic kidney disease; FC, final fully-connected; MACE, major adverse cardiovascular events.
References
1.
World Heart Federation. World Heart Report 2023: Confronting the World’s Number One Killer. Geneva: World Heart Federation. (2023). Available online at:https://www.world-heart-federation.org/resource/world-heart-report-2023/
2.
Porsch F Binder CJ . Autoimmune diseases and atherosclerotic cardiovascular disease. Nat Rev Cardiol. (2024) 21:780–807. 10.1038/s41569-024-01045-7
3.
Linden K Mailey J Kearney A Menown IBA . Advances in clinical cardiology 2019: a summary of key clinical trials. Adv Ther. (2020) 37:2620–45. 10.1007/s12325-020-01355-5
4.
Libby P . The changing landscape of atherosclerosis. Nature. (2021) 592:524–33. 10.1038/s41586-021-03392-8
5.
Gebre AK Sim M Rodríguez AJ Hodgson JM Blekkenhorst LC Szulc P et al Abdominal aortic calcification is associated with a higher risk of injurious fall-related hospitalizations in older Australian women. Atherosclerosis. (2021) 328:153–9. 10.1016/j.atherosclerosis.2021.05.003
6.
Parikh NI Hwang SJ Larson MG Cupples LA Fox CS Manders ES et al Parental occurrence of premature cardiovascular disease predicts increased coronary artery and abdominal aortic calcification in the framingham offspring and third generation cohorts. Circulation. (2007) 116:1473–81. 10.1161/circulationaha.107.705202
7.
Fernández-Friera L Peñalvo JL Fernández-Ortiz A Ibañez B López-Melgar B Laclaustra M et al Prevalence, vascular distribution, and multiterritorial extent of subclinical atherosclerosis in a middle-aged cohort: the PESA (progression of early subclinical atherosclerosis) study. Circulation. (2015) 131:2104–13. 10.1161/circulationaha.114.014310
8.
GBD Chronic Kidney Disease Collaboration. Global, regional, and national burden of chronic kidney disease, 1990–2017: a systematic analysis for the global burden of disease study 2017. Lancet. (2020) 395:709–33. 10.1016/s0140-6736(20)30045-3
9.
Niu Q Hong Y Lee CH Men C Zhao H Zuo L . Abdominal aortic calcification can predict all-cause mortality and CV events in dialysis patients: a systematic review and meta-analysis. PLoS One. (2018) 13:e0204526. 10.1371/journal.pone.0204526
10.
Horbal SR Derstine BA Brown E Su GL Wang SC Holcombe SA . Reference distributions of aortic calcification and association with framingham risk score. Sci Rep. (2023) 13:9421. 10.1038/s41598-023-36565-8
11.
Wilson PW Kauppila LI Donnell O Kiel CJ Hannan DP Polak M et al Abdominal aortic calcific deposits are an important predictor of vascular morbidity and mortality. Circulation. (2001) 103:1529–34. 10.1161/01.cir.103.11.1529
12.
Gebre AK Lewis JR Leow K Szulc P Scott D Ebeling PR et al Abdominal aortic calcification, bone mineral density, and fractures: a systematic review and meta-analysis of observational studies. J Gerontol A Biol Sci Med Sci. (2023) 78:1147–54. 10.1093/gerona/glac171
13.
Liabeuf S Desjardins L Diouf M Temmar M Renard C Choukroun G et al The addition of vascular calcification scores to traditional risk factors improves cardiovascular risk assessment in patients with chronic kidney disease. PLoS One. (2015) 10:e0131707. 10.1371/journal.pone.0131707
14.
Fusaro M Schileo E Crimi G Aghi A Bazzocchi A Barbanti Brodano G et al A novel quantitative computer-assisted score can improve repeatability in the estimate of vascular calcifications at the abdominal aorta. Nutrients. (2022) 14:4276. 10.3390/nu14204276
15.
Wang K Wang X Xi Z Li J Zhang X Wang R . Automatic segmentation and quantification of abdominal aortic calcification in lateral lumbar radiographs based on deep-learning-based algorithms. Bioengineering. (2023) 10:1164. 10.3390/bioengineering10101164
16.
Gilani SZ Sharif N Suter D Schousboe JT Reid S Leslie WD et al Show, attend and detect: towards fine-grained assessment of abdominal aortic calcification on vertebral fracture assessment scans. Lect Notes Comput Sci. (2022) 13433:439–50. 10.1007/978-3-031-16437-8_42
17.
Sharif N Gilani SZ Suter D Reid S Szulc P Kimelman D et al Machine learning for abdominal aortic calcification assessment from bone density machine-derived lateral spine images. EBioMedicine. (2023) 94:104676. 10.1016/j.ebiom.2023.104676
18.
Li Z Liu F Yang W Peng S Zhou J . A survey of convolutional neural networks: analysis, applications, and prospects. IEEE Trans Neural Netw Learn Syst. (2022) 33:6999–7019. 10.1109/tnnls.2021.3084827
19.
Pickering ME Millet M Rousseau JC Croset M Szulc P Borel O et al Selected serum microRNA, abdominal aortic calcification and risk of osteoporotic fracture. PLoS One. (2019) 14:e0216947. 10.1371/journal.pone.0216947
20.
Neto R Pereira L Magalhães J Quelhas-Santos J Frazão J . Low bone turnover is associated with plain x-ray vascular calcification in predialysis patients. PLoS One. (2021) 16:e0258284. 10.1371/journal.pone.0258284
21.
Verbeke F Van Biesen W Honkanen E Wikström B Jensen PB Krzesinski JM et al Prognostic value of aortic stiffness and calcification for cardiovascular events and mortality in dialysis patients: outcome of the calcification outcome in renal disease (CORD) study. Clin J Am Soc Nephrol. (2011) 6:153–9. 10.2215/cjn.05120610
22.
Isensee F Jaeger PF Kohl SAA Petersen J Maier-Hein KH . nnU-Net: a self-configuring method for deep learning-based biomedical image segmentation. Nat Methods. (2021) 18:203–11. 10.1038/s41592-020-01008-z
23.
He K Zhang X Ren S Sun J . Deep residual learning for image recognition. IEEE Conference on Computer Vision and Pattern Recognition (CVPR). (2016). p. 770–8. 10.1109/CVPR.2016.90
24.
Roy AG Navab N Wachinger C . Concurrent spatial and channel ’squeeze & excitation’ in fully convolutional networks. Medical Image Computing and Computer Assisted Intervention—MICCAI 2018—21st International Conference, 2018, Proceedings Springer Verlag (2018). p. 421–9. 10.1007/978-3-030-00928-1_48
25.
Loshchilov I Hutter F. SGDR: Stochastic Gradient Descent with Warm Restarts. arXiv [Preprint]. arXiv:160803983 (2016). Available online at:https://arxiv.org/abs/1608.03983(Accessed January 11, 2025).
26.
Selvaraju RR Cogswell M Das A Vedantam R Parikh D Batra D . Grad-CAM: visual explanations from deep networks via gradient-based localization. IEEE International Conference on Computer Vision (ICCV), vol. 128 (2017). p. 336–59. 10.1109/ICCV.2017.74
27.
Reid S Schousboe JT Kimelman D Monchka BA Jafari Jozani M Leslie WD . Machine learning for automated abdominal aortic calcification scoring of DXA vertebral fracture assessment images: a pilot study. Bone. (2021) 148::115943. 10.1016/j.bone.2021.115943
28.
Rajpal S Lakhyani N Singh AK Kohli R Kumar N . Using handpicked features in conjunction with ResNet-50 for improved detection of COVID-19 from chest x-ray images. Chaos Solitons Fractals. (2021) 145:110749. 10.1016/j.chaos.2021.110749
29.
Shafiq M Gu Z . Deep residual learning for image recognition: a survey. Appl Sci. (2022) 12:8972. 10.3390/app12188972
30.
Matsushita K Ballew SH Wang AY Kalyesubula R Schaeffner E Agarwal R . Epidemiology and risk of cardiovascular disease in populations with chronic kidney disease. Nat Rev Nephrol. (2022) 18:696–707. 10.1038/s41581-022-00616-6
31.
Zhang H Li G Yu X Yang J Jiang A Cheng H et al Progression of vascular calcification and clinical outcomes in patients receiving maintenance dialysis. JAMA Netw Open. (2023) 6:e2310909. 10.1001/jamanetworkopen.2023.10909
32.
Bastos Gonçalves F Voûte MT Hoeks SE Chonchol MB Boersma EE Stolker RJ et al Calcification of the abdominal aorta as an independent predictor of cardiovascular events: a meta-analysis. Heart. (2012) 98:988–94. 10.1136/heartjnl-2011-301464
Summary
Keywords
deep learning, abdominal aortic calcification, cardiovascular riskstratification, automated quantification, x-ray image
Citation
Shao Z, Xin E, Chen L, Liu A, Gu C, Li A and Pan Y (2025) Deep learning-based automated quantification system for abdominal aortic calcification: multicenter cohort study for algorithm development and clinical validation. Front. Cardiovasc. Med. 12:1647882. doi: 10.3389/fcvm.2025.1647882
Received
16 June 2025
Accepted
03 October 2025
Published
21 October 2025
Volume
12 - 2025
Edited by
Aleksandar Kibel, International Medical Center Priora, Croatia
Reviewed by
Farhad R. Nezami, Brigham and Women's Hospital, Harvard Medical School, United States
Sami Väänänen, University of Eastern Finland, Finland
Updates
Copyright
© 2025 Shao, Xin, Chen, Liu, Gu, Li and Pan.
This is an open-access article distributed under the terms of the Creative Commons Attribution License (CC BY). The use, distribution or reproduction in other forums is permitted, provided the original author(s) and the copyright owner(s) are credited and that the original publication in this journal is cited, in accordance with accepted academic practice. No use, distribution or reproduction is permitted which does not comply with these terms.
* Correspondence: Yuning Pan fyypanyuning@nbu.edu.cn
†These authors have contributed equally to this work
ORCID Yuning Pan orcid.org/0009-0009-5361-566X
Disclaimer
All claims expressed in this article are solely those of the authors and do not necessarily represent those of their affiliated organizations, or those of the publisher, the editors and the reviewers. Any product that may be evaluated in this article or claim that may be made by its manufacturer is not guaranteed or endorsed by the publisher.