Abstract
Backgrounds/aims:
Real-world data are limited regarding long-term outcomes in terms of absolute follow-up values of low-density lipoprotein cholesterol (LDL-C) vs. percentage reductions from baseline after LDL-C-lowering therapy for patients with acute coronary syndrome. We aimed to investigate the associations between 5-year clinical outcomes and absolute follow-up LDL-C levels or percentage reductions from baseline using a nationwide Korea Acute Myocardial Infarction Registry (KAMIR).
Methods:
Of 13,662 patients from the KAMIR–National Institutes of Health database, we identified 6,248 patients who had documented LDL-C levels at baseline and during 18 months of follow-up. The primary outcome was major adverse cardiovascular events (MACE; a composite of nonfatal stroke, nonfatal myocardial infarction, repeat revascularization, and all-cause death) at 5 years.
Results:
In the analysis of absolute follow-up time-weighted average LDL-C levels (<55, 55–69, 70–89, and ≥90 mg/dL), there was a U-shaped trend of MACE incidence (10.8% vs. 9.3% vs. 10.0% vs. 13.2%, P = 0.003). In the analysis of the percentage LDL-C reduction from baseline, greater reductions were associated with lower MACE risk. In a multivariable Cox time-to-event analysis with LDL-C < 50% reduction from baseline as the reference, ≥50% LDL-C reduction from baseline was independently associated with a decreased incidence of MACE (adjusted hazard ratio, 0.76; 95% confidence interval, 0.62–0.92).
Conclusion:
This study involving 6,248 AMI patients demonstrated that the greater the LDL-C reduction from baseline, the lower the risk of MACE. However, there was no clear decreasing trend in the risk of MACE when absolute follow-up LDL-C levels were lowered from around 70 mg/dL
1 Introduction
Low-density lipoprotein cholesterol (LDL-C) lowering therapy has proved effective in the primary and secondary prevention of atherosclerotic cardiovascular disease (1, 2). Previous dyslipidemia guidelines in 2011 set LDL-C targets of “<70 mg/dL and/or ≥50% LDL-C reduction from baseline” or “<70 mg/dL” for patients with acute coronary syndrome (3, 4). Recent guidelines recommend LDL-C targets of “<70 mg/dL or <55 mg/dL” and “≥50% reduction from baseline” in this population (5, 6). However, global studies of LDL-C target achievement in real-world settings have used absolute follow-up LDL-C targets, such as <70 or <55 mg/dL, which have shown poor LDL-C target achievement rates (7–12). A recent survey in Korea regarding the optimal LDL-C targets for acute myocardial infarction (AMI) patients revealed that a considerable proportion of physicians prefer to use only absolute follow-up LDL-C targets of “<70 mg/dL or <55 mg/dL” without considering percentage LDL-C reduction from baseline (13). Furthermore, a recent 2023 European guideline emphasizes an absolute follow-up LDL-C level of 55 mg/dL to guide decisions about changing lipid-lowering therapy (14). However, data comparing LDL-C targets between percent reduction and absolute levels during the follow-up of patients with acute coronary syndrome are scarce. Therefore, we aimed to investigate the associations between clinical outcomes and percentage LDL-C reductions from baseline or absolute follow-up levels in the monitoring of LDL-C lowering therapy after AMI using a nationwide Korean registry with 5 years of follow-up.
2 Methods
2.1 Data sources and participants
The study population was derived from the Korea Acute Myocardial Infarction Registry (KAMIR)-National Institutes of Health (NIH), a nationwide prospective multicenter registry with 3 years of clinical follow-up that consecutively enrolled patients from 20 tertiary university hospitals in Korea between November 2011 and December 2015. Participating centers had facilities for percutaneous coronary intervention and onsite cardiac surgery (Supplementary Methods). The KAMIR-NIH-LIPID study was funded by the National Evidence-based Healthcare Collaborating Agency and was designed to reinforce the KAMIR-NIH data for investigating real-world practice on lipid-lowering therapy and 5-year clinical outcomes in patients with AMI. Between May 2022 and August 2023, clinical research coordinators retrospectively collected additional data on the electronic medical records of each participating center using an Internet-based Clinical Research and Trial management system (iCReaT), which was a data management system set up by the Centers for Disease Control and Prevention, Ministry of Health and Welfare, Republic of Korea (iCReaT study no. C110016). Of the 13,662 patients from the KAMIR-NIH, we identified 6,248 patients who were not on lipid-lowering therapy before hospital arrival and had LDL-C levels at baseline and at least once during 18 months of follow-up (Figure 1).
Figure 1
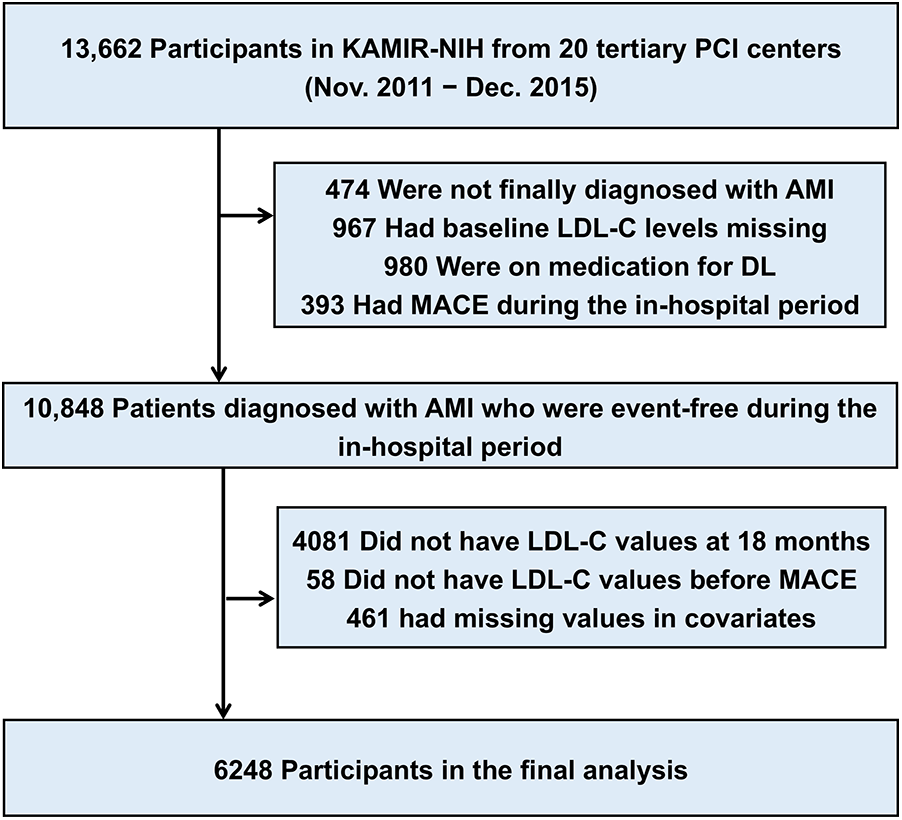
Description of the study population. The study cohort was derived from the nationwide prospective KAMIR (Korea Acute Myocardial Infarction Registry)-NIH (National Institutes of Health). AMI, acute myocardial infarction; DL, dyslipidemia; LDL-C, low-density lipoprotein cholesterol; MACE, major adverse cardiovascular event; MI, myocardial infarction; PCI, percutaneous coronary intervention.
2.2 Outcomes and definitions
The co-primary outcomes were major adverse cardiovascular events (MACE; a composite of nonfatal stroke, nonfatal myocardial infarction, repeat revascularization by coronary artery bypass grafting, and all-cause death) and all-cause death at 5 years. Cardiac death was defined as any death not definitively non-cardiac. AMI was diagnosed based on the universal definition of AMI. ST-elevation myocardial infarction was diagnosed when there was a new ST-segment elevation of ≥0.1 mV in ≥2 contiguous leads (≥0.2 mV in V2–V3) or a new left bundle branch block with a concomitant increase in cardiac enzyme levels (troponin I/T or creatine kinase myocardial band). Statin intensity was defined according to the 2018 American guidelines on cholesterol management. Lipid profiles were measured directly as routine analyses at each center. We calculated the time-averaged LDL-C as the cumulative LDL-C divided by the total duration between admission and 18 months (15). It was assumed that LDL-C levels during specific periods were the levels available just after those periods. LDL-C levels were included only when they were recorded before clinical events occurred. Based on this result, follow-up LDL-C levels were classified into four strata: <55 mg/dL, 55–69 mg/dL, 70–89 mg/dL, and ≥90 mg/dL. Percentage LDL-C reductions from baseline were classified into three strata: no reduction or increase, 0%–50% reduction, and ≥50% reduction.
2.3 Statistical analysis
Categorical variables are described as a number of cases and percentages and were compared using the chi-square test or Fisher's exact test, as appropriate. Continuous variables are presented as mean ± standard deviation and were compared using a one-way analysis of variance or the Kruskal–Wallis test, as appropriate. Kaplan–Meier curve analysis of mortality and MACE was performed using a log-rank test. Multivariable Cox regression analysis was performed to address the association between absolute levels or percentage reduction of LDL-C and outcomes using an enter method, including the baseline variables judged to be of clinical relevance–specifically, age, sex, body mass index, hypertension, diabetes mellitus, previous myocardial infarction, previous revascularization, family history of premature coronary artery disease, smoking status, type of MI, and statin intensity. A Cox proportional hazards regression model using a restricted cubic spline function was used to assess the association between follow-up levels or percentage reduction rate of LDL-C and clinical outcomes in an adjusted model. Patients with missing values in covariates were excluded from the study flow. Furthermore, we examined the analyses stratified by sex. A two-sided P value <0.05 was considered to indicate statistical significance, and analyses were performed using Stata 16 (StataCorp, College Station, TX, USA) and R version 4.2.2 (R Development Core Team, Vienna, Austria). This study was reported in accordance with the STROBE (STrengthening the Reporting of OBservational studies in Epidemiology) guidelines.
3 Results
The mean baseline LDL-C level was 117.1 ± 38.8 mg/dL. Follow-up LDL-C levels up to 4 years were between 73.7 and 77.9 mg/dL (Supplementary Table S1). The average LDL-C reduction rate for an initial 6 months was 34%. The patients were classified into four follow-up LDL-C strata: 20.2% (1,262/6,248) in LDL-C < 55 mg/dL, 26.5% (1,653/6,248) in LDL-C 55–69 mg/dL, 30.2% (1,890/6,248) in LDL-C 70–89 mg/dL, and 23.1% (1,443/6,248) in LDL-C ≥ 90 mg/dL. Baseline LDL-C levels and absolute LDL-C reduction according to these four strata are presented in Table 1.
Table 1
| Variable | Overall (N = 6,248) |
LDL-C <55 (N = 1,262) |
LDL-C 55–69 (N = 1,653) |
LDL-C 70–89 (N = 1,890) |
LDL-C ≥90 (N = 1,443) |
P value* |
|---|---|---|---|---|---|---|
| Age, years | 61.3 (12.1) | 63.0 (11.6) | 61.6 (12.0) | 60.6 (11.9) | 60.5 (12.6) | <0.001 |
| Male sex | 4,891 (78.3) | 1,042 (82.6) | 1,321 (79.9) | 1,465 (77.5) | 1,063 (73.7) | <0.001 |
| ST-elevation myocardial infarction | 3,273 (52.4) | 678 (53.7) | 884 (53.5) | 1,004 (53.1) | 707 (49.0) | 0.033 |
| Body mass index, kg/m2 | 24.3 (3.2) | 24.0 (3.1) | 24.2 (3.2) | 24.4 (3.3) | 24.5 (3.3) | <0.001 |
| Hypertension | 2,827 (45.2) | 624 (49.4) | 762 (46.1) | 820 (43.4) | 621 (43.0) | 0.002 |
| Diabetes mellitus | 1,565 (25.0) | 437 (34.6) | 383 (23.2) | 416 (22.0) | 329 (22.8) | <0.001 |
| Previous myocardial infarction | 315 (5.0) | 51 (4.0) | 71 (4.3) | 88 (4.7) | 105 (7.3) | <0.001 |
| Previous revascularization | 471 (7.5) | 85 (6.7) | 104 (6.3) | 133 (7.0) | 149 (10.3) | <0.001 |
| Previous cerebrovascular accident | 280 (4.5) | 66 (5.2) | 67 (4.1) | 85 (4.5) | 62 (4.3) | 0.480 |
| Current smoker | 2,842 (45.5) | 548 (43.4) | 734 (44.4) | 859 (45.4) | 701 (48.6) | 0.015 |
| Family history of premature coronary artery disease | 53 (0.8) | 8 (0.6) | 15 (0.9) | 14 (0.7) | 16 (1.1) | 0.535 |
| Statin treatment | <0.001 | |||||
| No/low/moderate | 4,194 (67.1) | 782 (62.0) | 1,038 (62.8) | 1,316 (69.6) | 1,058 (73.3) | |
| High | 2,054 (32.9) | 480 (38.0) | 615 (37.2) | 574 (30.4) | 385 (26.7) | |
| Other lipid-lowering therapy | ||||||
| Ezetimibe | 321 (5.1) | 58 (4.6) | 71 (4.3) | 120 (6.4) | 72 (5.0) | 0.030 |
| Fibrate | 35 (0.6) | 7 (0.6) | 7 (0.4) | 11 (0.6) | 10 (0.7) | 0.794 |
| LDL-C profiles | ||||||
| Baseline LDL-C levels, mg/dL | 117.1 (38.8) | 99.8 (33.1) | 112.0 (34.1) | 122.3 (37.4) | 131.3 (43.4) | <0.001 |
| Absolute LDL-C reduction, mg/dL | 42.0 (39.6) | 54.4 (32.5) | 49.8 (33.9) | 43.5 (37.4) | 20.5 (45.4) | <0.001 |
Baseline clinical characteristics and lipid lowering therapy according to absolute follow-up LDL-C strata.
Values are presented as mean (SD) or number (%).
LDL-C, low-density lipoprotein cholesterol.
P-values are derived from the chi-square test or Fisher's exact test for categorical variables, when appropriate, and from one-way analysis of variance test for continuous variables.
3.1 Baseline clinical characteristics by absolute follow-up LDL-C strata
Compared with patients with LDL-C ≥90 mg/dL, those with LDL-C <55 mg/dL were older, were more often male, were more likely to be ST-elevation myocardial infarction, and were more likely to have a low body mass index (Table 1). They were more likely to have a history of hypertension or diabetes mellitus but were less likely to have a history of myocardial infarction or revascularization and were less often current smokers. They were more likely to be treated with high-intensity statins. Other lipid-lowering therapies included ezetimibe in around 5% of patients and fibrate in less than 1%.
3.2 Clinical outcomes according to absolute follow-up LDL-C strata
The clinical outcomes were evaluated for up to 5 years (median 1,777 days; interquartile range 1,090–1,826 days). Among 6,248 patients with AMI, there were 312 all-cause deaths and 670 MACE at 5 years. There was a U-shaped trend of MACE incidence among the absolute follow-up LDL-C strata (136/1,262 [10.8%] in LDL-C <55 mg/dL vs. 154/1,653 [9.3%] in LDL-C 55–69 mg/dL vs. 189/1,890 [10.0%] in LDL-C 70–89 mg/dL vs. 191/1,443 [13.2%] in LDL-C ≥90 mg/dL for MACE, P = 0.003; and 82/1,262 [6.5%] vs. 70/1,653 [4.2%] vs. 73/1,890 [3.9%] vs. 87/1,443 [6.0%] for all-cause death, P < 0.001) (Table 2). Kaplan–Meier curves for MACE by the absolute follow-up LDL-C strata are shown in Figure 2. In a restricted cubic spline model, a J-shaped association was observed between absolute follow-up LDL-C levels and the risk of MACE (Figure 3). In a multivariable Cox time-to-event analysis with LDL-C level ≥90 mg/dL as the reference, the adjusted hazard ratios for MACE were 0.73 [95% confidence interval (CI), 0.58–0.92] in LDL-C < 55 mg/dL, 0.69 (95% CI, 0.56–0.86) in LDL-C 55–69 mg/dL, and 0.78 (95% CI, 0.63–0.95) in LDL-C 70–89 mg/dL (Figure 4). The results of univariable Cox time-to-event analysis are presented in Supplementary Table S2. There was a U-shaped association between absolute follow-up LDL-C levels and the risk of all-cause mortality in a restricted cubic spline model, with the lowest risk at an LDL-C level of 74.4 mg/dL (Supplementary Figure S1A). Kaplan–Meier curves for all-cause death by the absolute follow-up LDL-C strata are shown in Supplementary Figure S1B. The adjusted hazard ratios for all-cause death were 0.87 (95% CI, 0.63–1.18) in LDL-C <55 mg/dL, 0.67 (95% CI, 0.49–0.92) in LDL-C 55–69 mg/dL, and 0.67 (95% CI, 0.49–0.91) in LDL-C 70–89 mg/dL.
Table 2
| Outcome | Overall (N = 6,248) |
LDL-C <55 (N = 1,262) |
LDL-C 55–69 (N = 1,653) |
LDL-C 70–89 (N = 1,890) |
LDL-C ≥90 (N = 1,443) |
P value* |
|---|---|---|---|---|---|---|
| MACE | 670 (10.7) | 136 (10.8) | 154 (9.3) | 189 (10.0) | 191 (13.2) | 0.003 |
| MACE individual endpoints | ||||||
| Cardiac death | 130 (19.4) | 31 (22.8) | 32 (20.8) | 30 (15.9) | 37 (19.4) | |
| Non-cardiac death | 120 (17.9) | 29 (21.3) | 29 (18.8) | 31 (16.4) | 31 (16.2) | |
| Myocardial infarction | 255 (38.1) | 49 (36.0) | 53 (34.4) | 76 (40.2) | 77 (40.3) | |
| Cerebrovascular event | 142 (21.2) | 24 (17.6) | 36 (23.4) | 44 (23.3) | 38 (19.9) | |
| Coronary artery bypass grafting | 23 (3.4) | 3 (2.2) | 4 (2.6) | 8 (4.2) | 8 (4.2) | |
| Death | 312 (5.0) | 82 (6.5) | 70 (4.2) | 73 (3.9) | 87 (6.0) | <0.001 |
| Death individual endpoints | ||||||
| Cardiac death | 162 (51.9) | 42 (51.2) | 37 (52.9) | 37 (50.7) | 46 (52.9) | |
| Non-cardiac death | 150 (48.1) | 40 (48.8) | 33 (47.1) | 36 (49.3) | 41 (47.1) | |
Clinical outcomes according to absolute follow-up LDL-C strata.
Values are presented as number (%).
LDL-C, low-density lipoprotein cholesterol; MACE, major adverse cardiac events.
P-values are derived from the chi-square test or Fisher's exact test for categorical variables, when appropriate, and from one-way analysis of variance test for continuous variables.
Figure 2
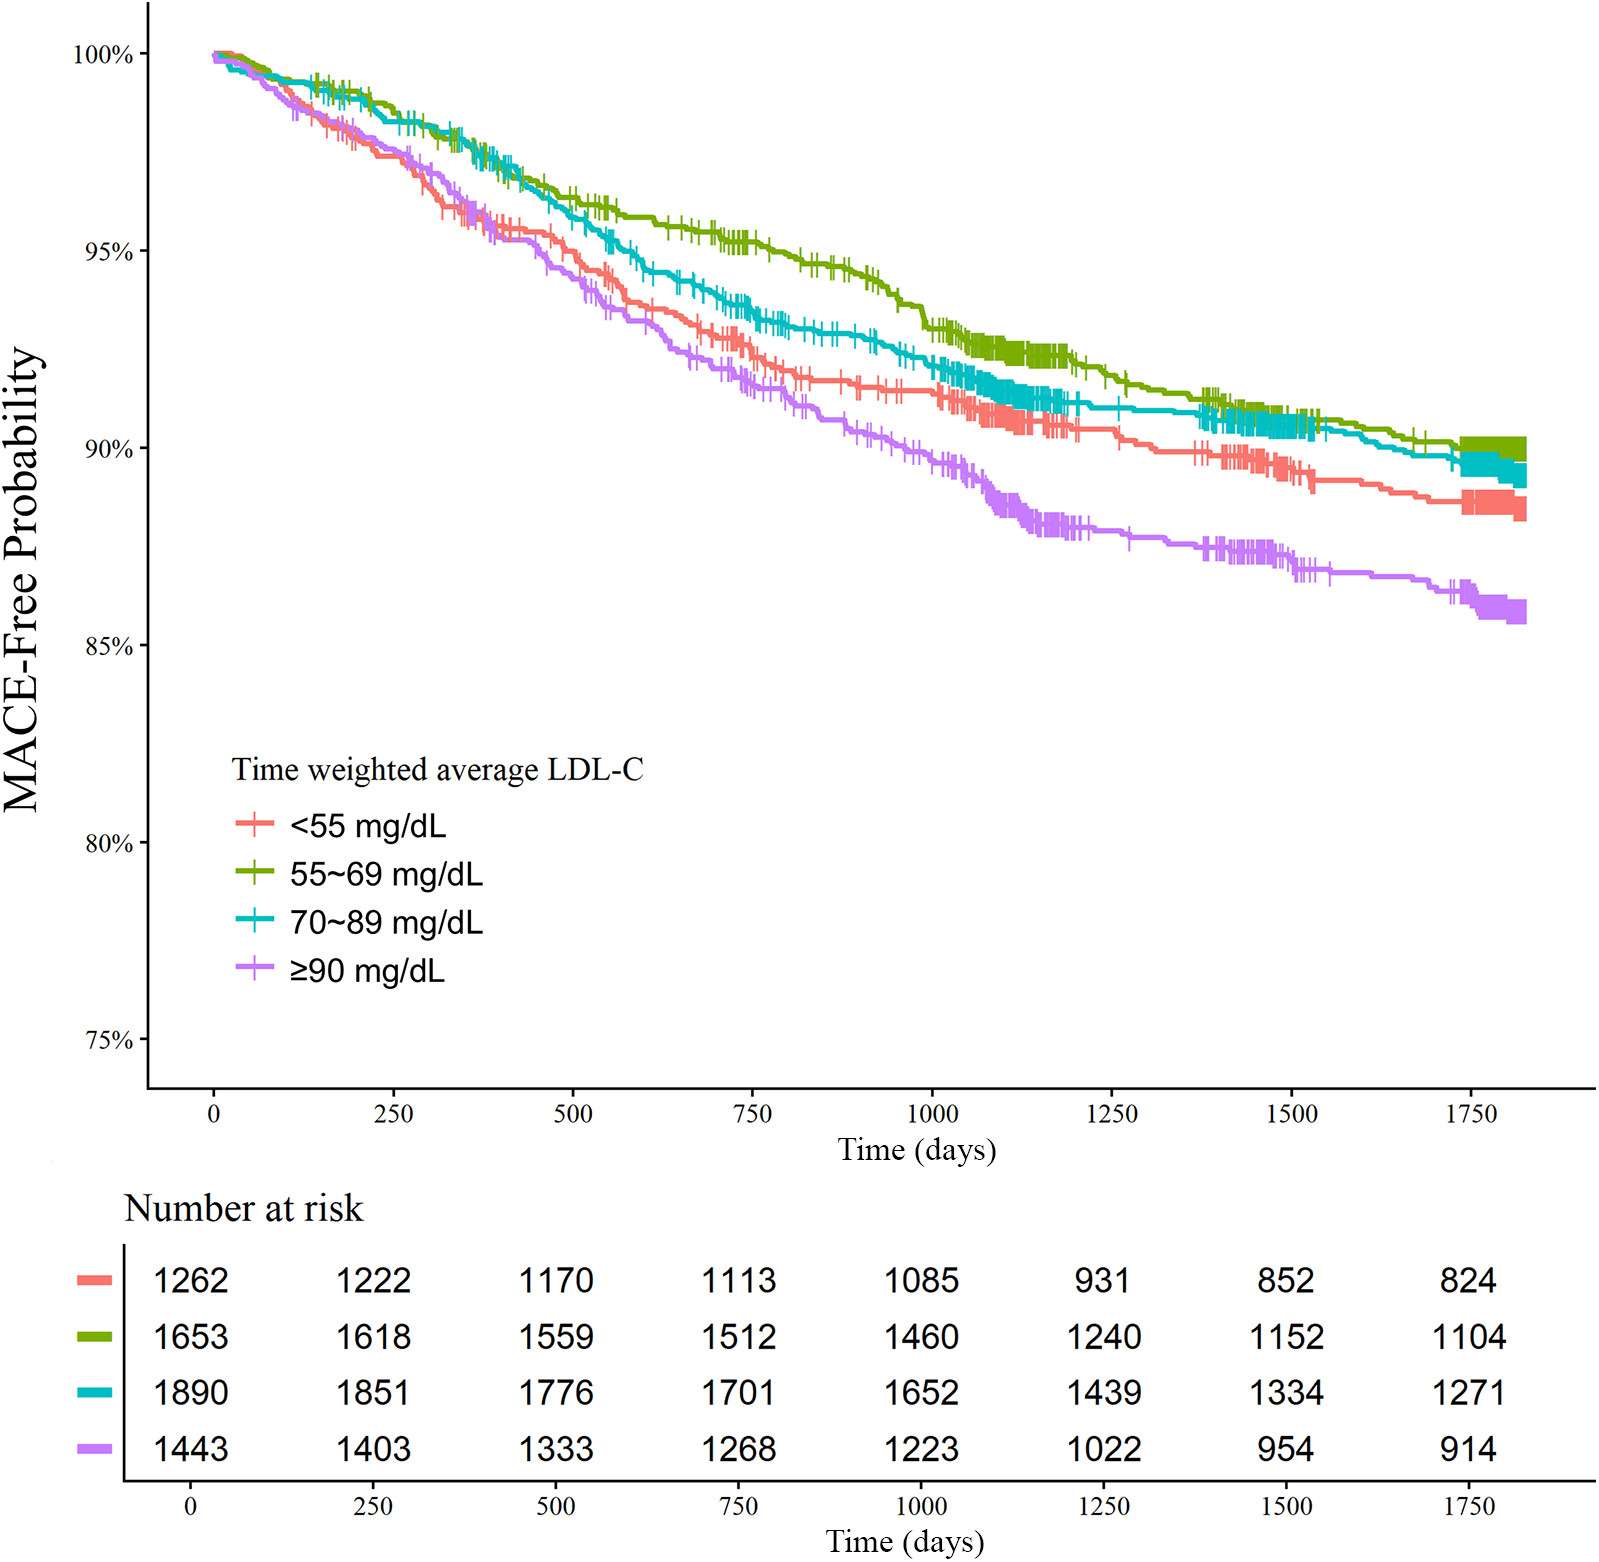
Absolute follow-up low-density lipoprotein cholesterol (LDL-C) strata and major adverse cardiovascular events (MACE) at 5 years. Kaplan–Meier curves for MACE over 5 years according to the follow-up LDL-C strata are shown. The MACE outcome was a composite of nonfatal stroke, nonfatal myocardial infarction, repeat revascularization, and all-cause death.
Figure 3
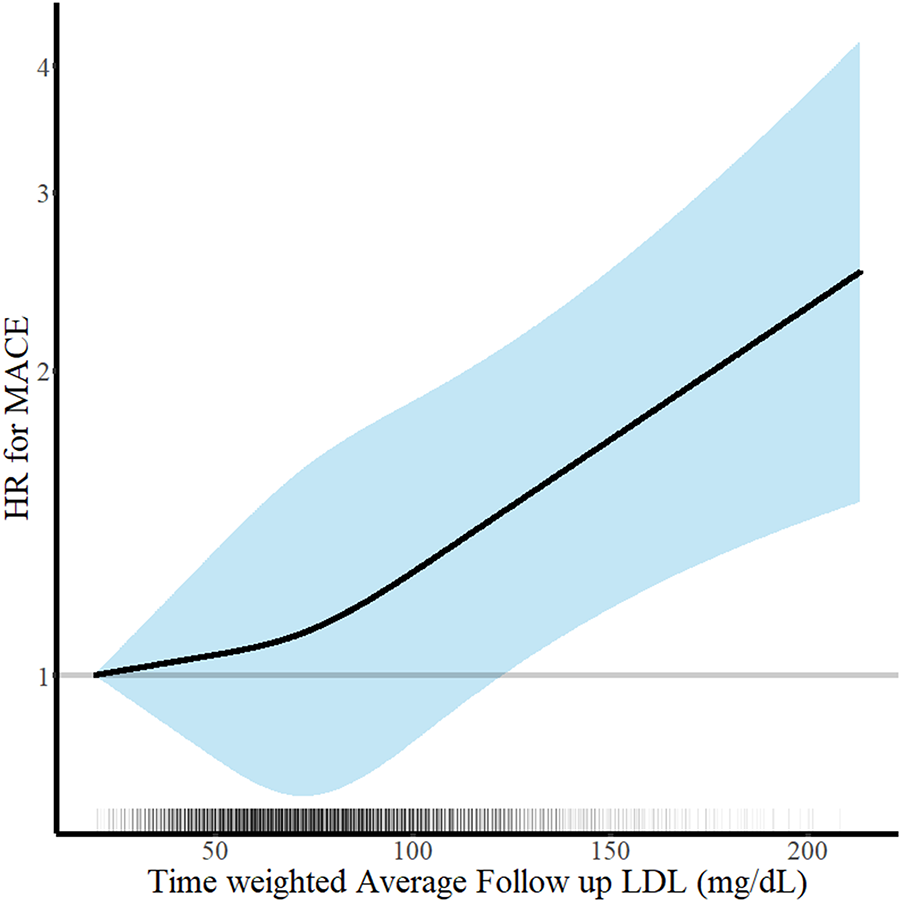
Continuous absolute follow-up low-density lipoprotein cholesterol (LDL-C) levels and risk of major adverse cardiovascular events (MACE) at 5 years. Hazard ratios for MACE at 5 years according to the continuous follow-up time-weighted average LDL-C levels are shown. Adjustments were performed for age, sex, body mass index, hypertension, diabetes mellitus, current smoker status, family history of premature coronary artery disease, previous myocardial infarction, previous myocardial revascularization, ST-elevation myocardial infarction diagnosis, and statins medication. Solid lines and shaded areas indicate hazard ratios (HRs) and 95% confidence intervals (CIs), respectively.
Figure 4
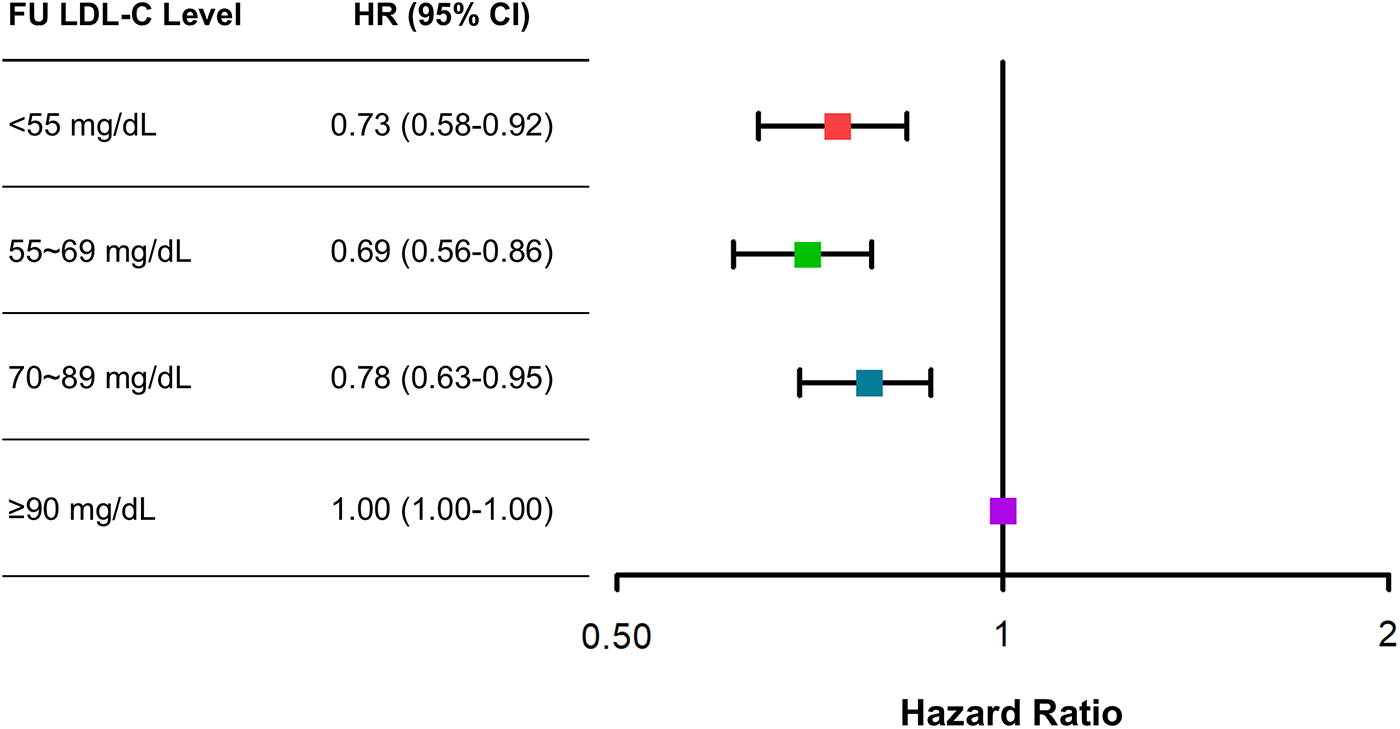
Adjusted risk of categorical absolute follow-up low-density lipoprotein cholesterol (LDL-C) strata for major adverse cardiovascular events (MACE) at 5 years. Adjusted hazard ratios (HRs) for MACE at 5 years with LDL-C ≥90 mg/dL as the reference. Cox regression analysis using the enter method was conducted.
3.3 Baseline clinical characteristics by percentage LDL-C reductions from baseline
Compared with patients with LDL-C reduction <0%, those with LDL-C reduction ≥50% were younger, were more often male, were more likely to have ST-elevation myocardial infarction, and were more likely to have a high body mass index (Table 3). They were less likely to have a history of hypertension, diabetes mellitus, previous myocardial infarction, previous revascularization, or previous cerebrovascular accident, but were more often current smokers. They were more likely to be treated with high-intensity statins.
Table 3
| Variable | Overall (N = 6,248) |
LDL-C reduction <0% (N = 876) |
LDL-C reduction 0%–49% (N = 2,655) |
LDL-C reduction ≥50% (N = 2,707) |
P value* |
|---|---|---|---|---|---|
| Age, years | 61.3 (12.1) | 64.1 (12.2) | 62.1 (11.9) | 59.7 (11.9) | <0.001 |
| Male sex | 4,891 (78.3) | 631 (72.0) | 2,101 (78.8) | 2,159 (79.8) | <0.001 |
| ST-elevation myocardial infarction | 3,273 (52.4) | 374 (42.7) | 1,420 (53.3) | 1,479 (54.6) | <0.001 |
| Body mass index, kg/m2 | 24.3 (3.2) | 24.0 (3.3) | 24.1 (3.3) | 24.5 (3.1) | <0.001 |
| Hypertension | 2,827 (45.2) | 478 (54.6) | 1,286 (48.3) | 1,063 (39.3) | <0.001 |
| Diabetes mellitus | 1,565 (25.0) | 341 (38.9) | 689 (25.9) | 535 (19.8) | <0.001 |
| Previous myocardial infarction | 315 (5.0) | 122 (13.9) | 142 (5.3) | 51 (1.9) | <0.001 |
| Previous revascularization | 471 (7.5) | 199 (22.7) | 200 (7.5) | 72 (2.7) | <0.001 |
| Previous cerebrovascular accident | 280 (4.5) | 76 (8.7) | 125 (4.7) | 79 (2.9) | <0.001 |
| Current smoker | 2,842 (45.5) | 323 (36.9) | 1,185 (44.5) | 1,334 (49.3) | <0.001 |
| Family history of premature coronary artery disease | 53 (0.8) | 6 (0.7) | 26 (1.0) | 21 (0.8) | 0.619 |
| Statin treatment | <0.001 | ||||
| No/low/moderate | 4,194 (67.1) | 736 (84.0) | 1,960 (73.5) | 1,498 (55.3) | |
| High | 2,054 (32.9) | 140 (16.0) | 705 (26.5) | 1,209 (44.7) | |
| Other lipid-lowering therapy | |||||
| Ezetimibe | 321 (5.1) | 46 (5.3) | 131 (4.9) | 144 (5.3) | 0.792 |
| Fibrate | 35 (0.6) | 11 (1.3) | 13 (0.5) | 11 (0.4) | 0.022 |
| LDL-C profiles | |||||
| Baseline LDL-C levels, mg/dL | 117.1 (38.8) | 75.1 (27.8) | 102.1 (25.5) | 145.5 (31.4) | <0.001 |
| Absolute LDL-C reduction, mg/dL | 75.0 (25.5) | 96.8 (32.1) | 74.7 (23.9) | 68.3 (20.4) | <0.001 |
Baseline clinical characteristics and lipid lowering therapy according to percentage LDL-C reduction strata.
Values are presented as mean (SD) or number (%).
LDL-C, low-density lipoprotein cholesterol.
P-values are derived from the chi-square test or Fisher's exact test for categorical variables, when appropriate, and from one-way analysis of variance test for continuous variables.
3.4 Clinical outcomes according to percentage LDL-C reductions from baseline
There was a decreasing trend of MACE incidence among the percentage LDL-C reductions from baseline strata (167/876 [19.1%] in LDL-C reduction <0% vs. 292/2,655 [11.0%] in LDL-C reduction 0%–49% vs. 211/2,707 [7.8%] in LDL-C reduction ≥50% for MACE, P < 0.001; and 82/876 [9.4%] vs. 152/2,655 [5.7%] vs. 78/2,707 [2.9%] for all-cause death, P < 0.001) (Table 4). Kaplan–Meier curves for MACE by the categorical percentage LDL-C reduction strata over 5 years demonstrated that patients with higher LDL-C reduction from baseline had a lower risk of MACE (Figure 5). For analysis of the LDL-C reduction rate from baseline in a restricted cubic spline model, the greater the reduction, the lower the risk of MACE (Figure 6). In a multivariable Cox time-to-event analysis with LDL-C < 50% reduction from baseline as the reference, ≥50% LDL-C reduction from baseline was independently associated with a lower incidence of MACE (adjusted hazard ratio 0.76; 95% CI, 0.62–0.92) (Figure 7). The results of univariable Cox time-to-event analysis are presented in Supplementary Table S3. A restricted cubic spline model and Kaplan–Meier curves for the association between percentage LDL-C reduction and all-cause death are shown in Supplementary Figure S2. In a multivariable Cox time-to-event analysis with LDL-C < 50% reduction from baseline as the reference, ≥50% LDL-C reduction from baseline was independently associated with a lower incidence of deaths (adjusted hazard ratio 0.67; 95% CI, 0.49–0.91).
Table 4
| Outcome | Overall (N = 6,248) |
LDL-C reduction <0% (N = 876) |
LDL-C reduction 0%–49% (N = 2,655) |
LDL-C reduction ≥50% (N = 2,707) |
P value* |
|---|---|---|---|---|---|
| MACE | 670 (10.7) | 167 (19.1) | 292 (11.0) | 211 (7.8) | <0.001 |
| MACE individual endpoints | |||||
| Cardiac death | 130 (19.4) | 39 (23.4) | 61 (20.9) | 30 (14.2) | |
| Non-cardiac death | 120 (17.9) | 28 (16.8) | 63 (21.6) | 29 (13.7) | |
| Myocardial infarction | 255 (38.1) | 57 (34.1) | 104 (35.6) | 94 (44.5) | |
| Cerebrovascular event | 142 (21.2) | 39 (23.4) | 52 (17.8) | 51 (24.2) | |
| Coronary artery bypass grafting | 23 (3.4) | 4 (2.4) | 12 (4.1) | 7 (3.3) | |
| Death | 312 (5.0) | 82 (9.4) | 152 (5.7) | 78 (2.9) | <0.001 |
| Death individual endpoints | |||||
| Cardiac death | 162 (51.9) | 47 (57.3) | 75 (49.3) | 40 (51.3) | |
| Non-cardiac death | 150 (48.1) | 35 (42.7) | 77 (50.7) | 38 (48.7) | |
Clinical outcomes according to percentage LDL-C reduction strata.
Values are presented as number (%).
LDL-C, low-density lipoprotein cholesterol; MACE, major adverse cardiac events.
P-values are derived from the chi-square test or Fisher's exact test for categorical variables, when appropriate, and from one-way analysis of variance test for continuous variables.
Figure 5
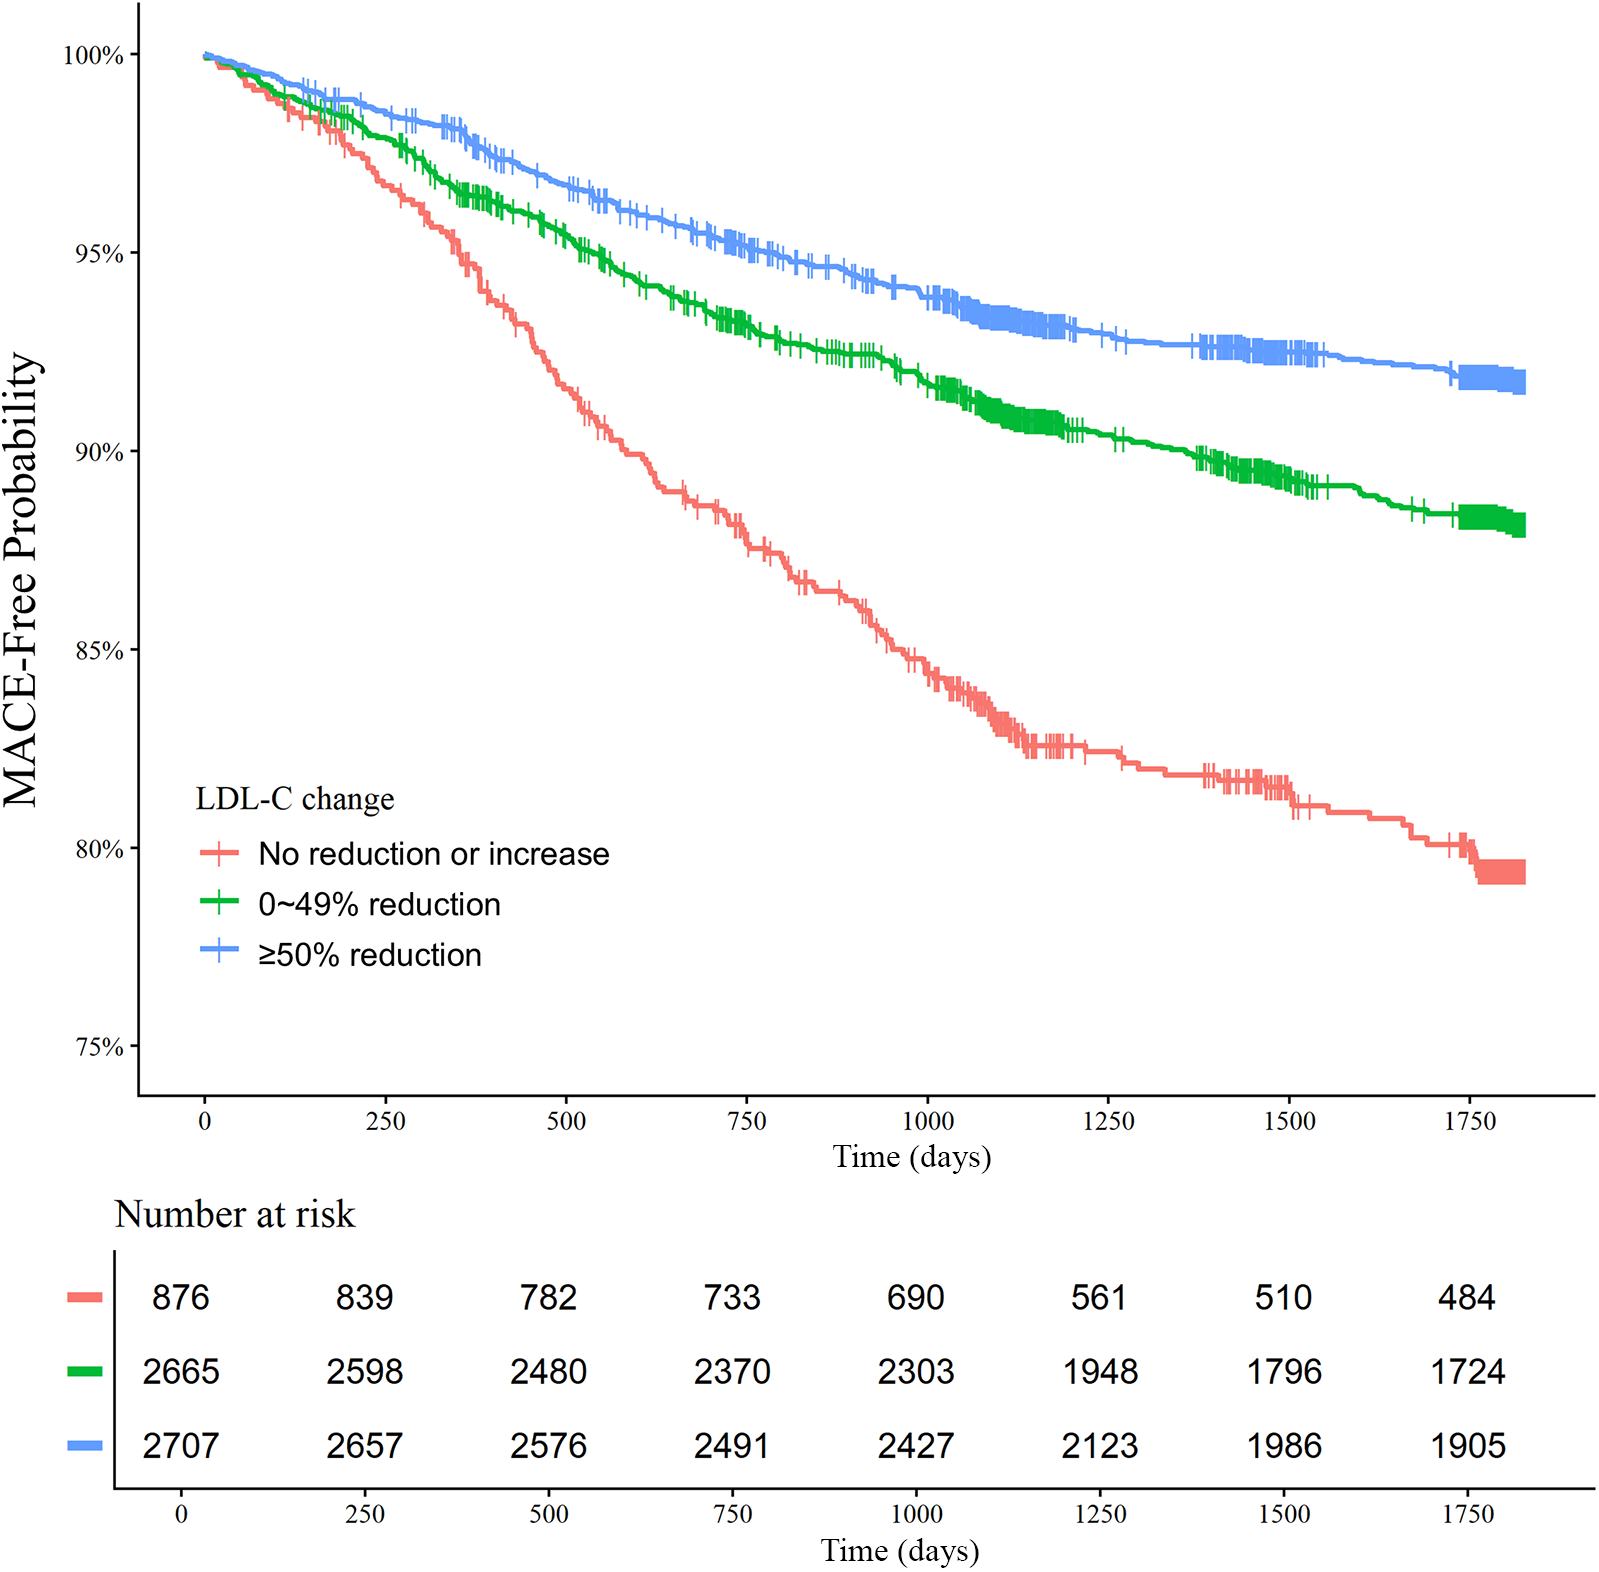
Low-density lipoprotein cholesterol (LDL-C) reduction strata and major adverse cardiovascular events (MACE) at 5 years. Kaplan–Meier curves for MACE over 5 years according to the LDL-C reduction strata are shown. The MACE outcome was a composite of nonfatal stroke, nonfatal myocardial infarction, repeat revascularization, and all-cause death.
Figure 6
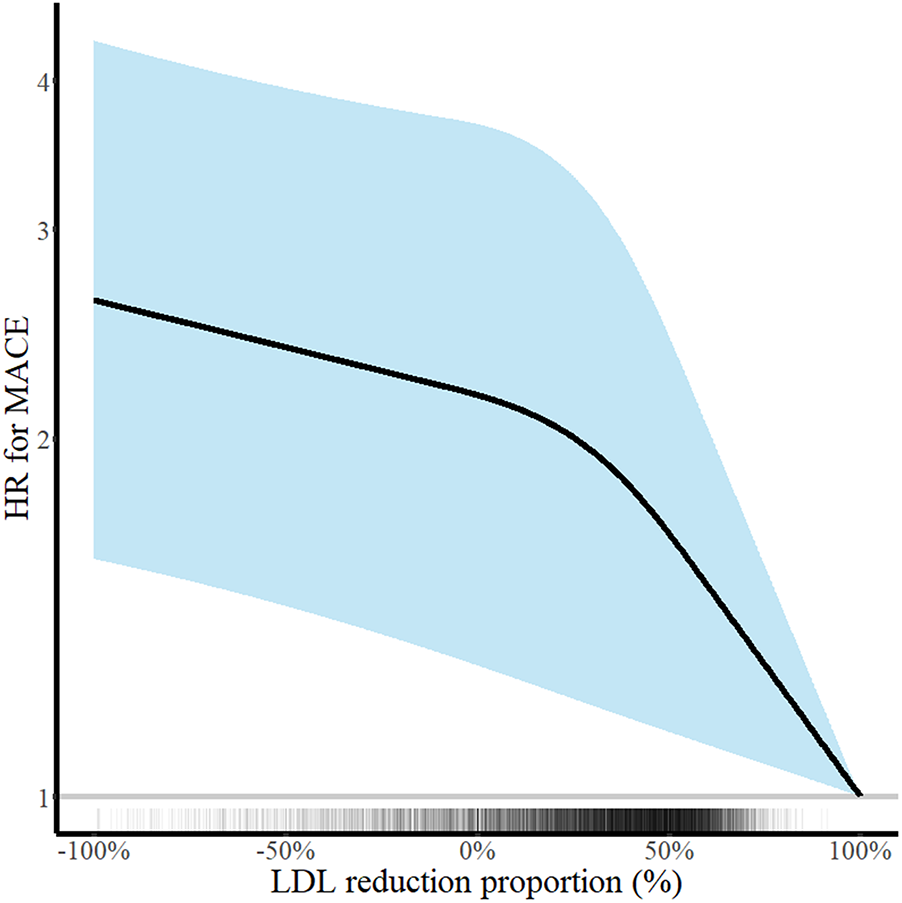
Continuous low-density lipoprotein cholesterol (LDL-C) reduction and risk of major adverse cardiovascular events (MACE) at 5 years. Hazard ratios for MACE at 5 years according to the percentage LDL-C reduction rate are shown. Adjustments were performed for age, sex, body mass index, hypertension, diabetes mellitus, current smoker status, family history of premature coronary artery disease, previous myocardial infarction, previous myocardial revascularization, ST-elevation myocardial infarction diagnosis, and statins medication. Solid lines and shaded areas indicate hazard ratios (HRs) and 95% confidence intervals (CIs), respectively.
Figure 7
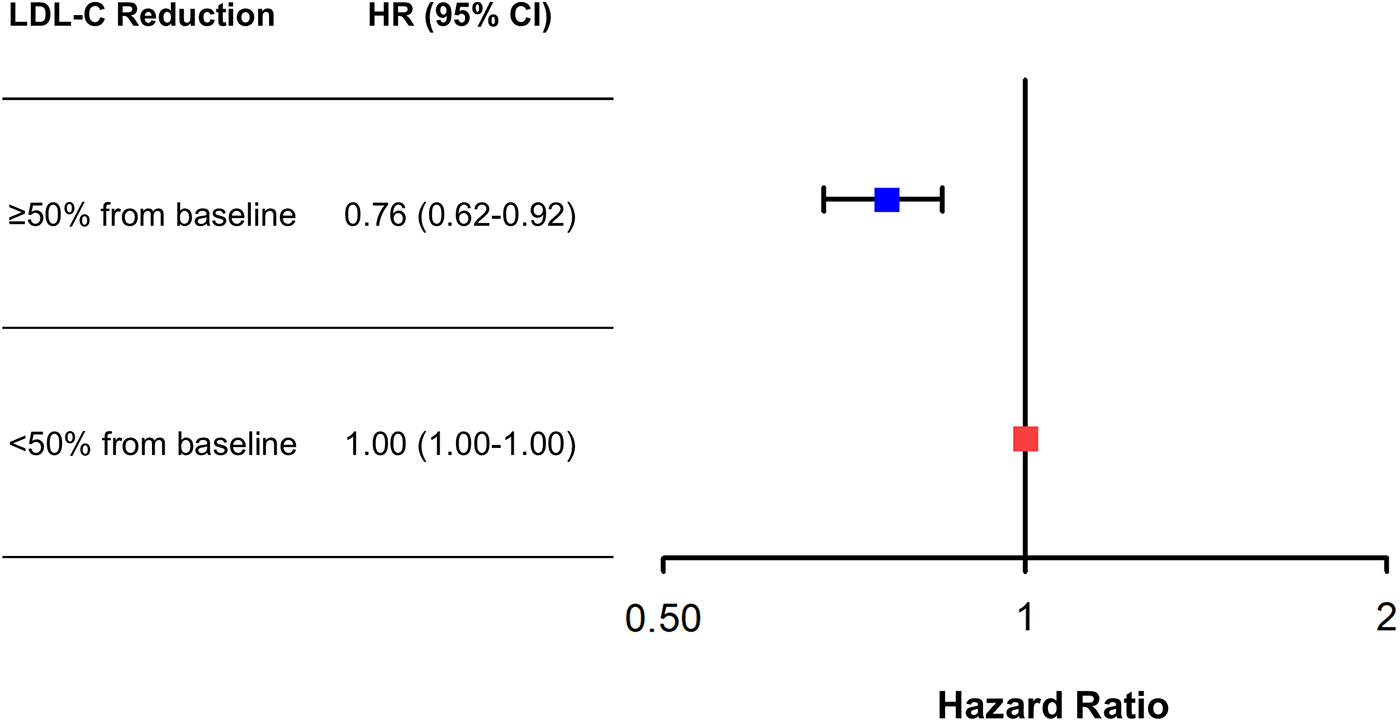
Adjusted risk of ≥50% low-density lipoprotein cholesterol (LDL-C) reduction from baseline vs. <50% reduction for major adverse cardiovascular events (MACE) at 5 years. Adjusted hazard ratios (HRs) of ≥50% LDL-C reduction from baseline for MACE at 5 years with <50% LDL-C reduction from baseline as the reference. Cox regression analysis using the enter method was conducted.
3.5 Subgroup analysis
When stratified by sex, the associations between clinical outcomes and absolute follow-up LDL-C levels vs. percentage LDL-C reduction had somewhat differing slopes in some parts but generally similar trends (Supplementary Figures S3 and S4).
4 Discussion
In a nationwide Korean cohort study with 5 years of clinical follow-up, we investigated the association between absolute value vs. percentage reduction of follow-up LDL-C levels and clinical outcomes at 5 years. For the analysis of absolute categorical follow-up LDL-C strata, there was a U-shaped trend of MACE incidence. In the analysis of continuous follow-up LDL-C levels using an adjusted cubic spline model, there was a J-shaped association between the LDL-C levels and MACE. For the analysis of the percentage LDL-C reduction from baseline, the greater the reduction rate, the lower the risk of MACE. In a multivariable Cox time-to-event analysis, a ≥50% LDL-C reduction from baseline was independently associated with a decreased incidence of MACE.
Recent American and European guidelines on dyslipidemia emphasize lowering LDL-C levels for secondary prevention in patients at very high risk of atherosclerotic cardiovascular disease, including coronary artery disease (5, 6). However, global studies on LDL-C target achievement in real-world practice have used absolute follow-up LDL-C levels such as <70 mg/dL, which have revealed poor LDL-C target achievement rates (7–12). Barriers to achieving guideline-recommended LDL-C targets can exist at the patient, physician, and healthcare system levels (5). Recently, a survey in Korea on the optimal LDL-C targets for AMI patients demonstrated that a considerable proportion of physicians prefer to use only absolute follow-up LDL-C targets of “<70 mg/dL or <55 mg/dL” without considering percentage LDL-C reduction from baseline (13). In a real-world setting, using a percent LDL-C reduction as a target can be time-consuming because baseline LDL-C levels must be determined. Guidelines state that the term “baseline” refers to the LDL-C level when not taking any LDL-C-lowering drugs. When taking LDL-C-lowering drugs, the baseline LDL-C levels should be estimated based on the average LDL-C-lowering efficacy of the given medication (6).
There has been a bunch of evidence that intensive lipid-lowering therapy either slows disease progression or promotes plaque regression by modifying both the quantity and the composition of coronary atherosclerotic plaques (16). However, the degree of atheroma regression shown in concomitant imaging trials appeared more modest as compared to the magnitude of clinical benefit accrued from high-intensity statin therapy. Two landmark randomized trials of the proprotein convertase subtilisin/kexin 9 inhibitors, the HUYGENS and the PACKMAN-AMI, have demonstrated the additional effects of achieving very low levels of LDL-C on high-risk plaque features, including fibrous cap thickness and large lipid accumulation, beyond its size (17, 18). Recent meta-analysis assessing the effect of lipid-lowering therapy on coronary artery plaque in East Asia population revealed that the lowest levels of LDL-C (≤55 mg/dL) were associated with the greatest decrease (–1.56%, 95% CI: −2.20% to – 0.92%; I2 = 0%) of percent atheroma volume when compared with levels in the range of 55–70, 70–100, and 100–130 mg/dL (19). This finding suggests that intensive lipid-lowering therapy with a lower target LDL-C, especially to <55 mg/dL, would be beneficial for atherosclerosis treatment. However, most randomized clinical trials of intracoronary imaging included patients with LDL-C levels of at least 70 or 100 mg/dL and were inherently different from a real-world setting in terms of the patient population.
The present study demonstrated a U-shaped relationship between absolute follow-up LDL-C levels and the risk of MACE. This might be partly explained by the cholesterol paradox, which has been demonstrated in observational cohort studies. Patients with low follow-up LDL-C levels were more likely to have low baseline LDL-C levels. Several previous studies have reported that very low baseline LDL-C levels are associated with poor survival in patients with or without cardiovascular disease (20–23). It has been suggested that low cholesterol levels are associated with older age, inadequate nutritional status, or frailty (20, 22–24). Iribarren et al. analyzed total cholesterol changes in 5,941 middle-aged Japanese-Americans over a 6-year period and related these data to subsequent 16-year mortality data and suggested that falling total cholesterol levels occur before the development of certain cancers or non-cardiovascular diseases (particularly liver disease) (21). A prespecified analysis of The Improved Reduction of Outcomes: Vytorin Efficacy International Trial (IMPROVE-IT) demonstrated that patients with very low LDL-C levels of <30 mg/dL at 1 month after enrollment had a higher incidence of malignancy during the 5 years follow-up compared with those with LDL-C levels of >70 mg/dL (25). A recent multicenter Korean AMI registry involving 5,532 patients with 5 years of follow-up demonstrated that a baseline LDL-C level <70 mg/dL was independently associated with an increased incidence of cardiovascular death and MACE after discharge (26). Furthermore, a meta-analysis involving ≥130,000 patients revealed that more intensive LDL-C reduction compared with less intensive reduction was associated with a greater reduction in total and cardiovascular mortality risk in patients with higher baseline LDL-C levels, but not in those with baseline LDL-C levels of <100 mg/dL (27). These findings suggest that we use an integrated model to predict the net clinical benefit from lipid-lowering therapy, considering each patient's baseline LDL-C levels and risk profile.
In the present study, the greater the LDL-C reduction from baseline, the lower the MACE incidence. Moreover, a ≥50% LDL-C reduction from baseline was independently associated with a decreased incidence of MACE after multivariable adjustments. The benefit of lipid-lowering therapy on clinical outcomes is proportionate to the magnitude of LDL-C lowering in patients with atherosclerotic cardiovascular disease (28). Recent dyslipidemia guidelines recommend achieving ≥50% LDL-C reduction from baseline as the first target when implementing lipid-lowering therapy in patients with atherosclerotic cardiovascular disease (5, 6). In a nationwide prospective Korean cohort study involving 1,305 patients with AMI with a 2-year clinical follow-up, compared with <50% LDL-C reduction from baseline at 1 year, patients with ≥50% LDL-C reduction had a 47% risk reduction in MACE. However, compared with LDL-C levels ≥70 mg/dL at 1 year, patients with LDL-C levels <70 mg/dL had a similar risk of MACE (29). Schubert et al. analyzed 40,607 patients with AMI with a median 3.78 years follow-up in a real-world cohort and demonstrated that larger early LDL-C reductions after AMI events were associated with better cardiovascular outcomes and all-cause mortality (30).
To date, no confirmatory clinical trial has been conducted to compare the efficacy and safety of two targets: an absolute follow-up LDL-C level and a percentage LDL-C reduction. Although a meta-analysis indicated that LDL-C lowering may not be beneficial for all-cause and cardiovascular mortality end points in trials with more than 50% LDL-C reduction and in trials with low baseline LDL-C levels (31), substantial evidence supports the notion that greater LDL-C reductions lead to better clinical outcomes in patients with acute coronary syndrome (2). Furthermore, the Further Cardiovascular Outcomes Research With Proprotein Convertase Subtilisin/Kexin Type 9 Inhibition in Subjects With Elevated Risk-Open Label Extension study recently demonstrated that achieving lower LDL-C levels long-term, down to <20 mg/dL (<0.5 mmol/L), was associated with the best cardiovascular outcomes with no significant safety concerns in patients with atherosclerotic cardiovascular disease (32). Taken together, the main finding of the present study and the evidence from previous literature suggests that a percentage reduction in LDL-C would be a better marker after LDL-C-lowering therapy than an absolute follow-up LDL-C target, such as 70 or 55 mg/dL, in a real-world setting. For example, if one patient diagnosed with AMI has LDL-C levels of 70 mg/dL at baseline, just having LDL-C levels of 50 mg/dL may not mean that a patient would have a chance to show the best clinical outcomes. We should consider achieving LDL-C levels of less than 35 mg/dL in this patient, which is at least a 50% reduction from baseline levels.
The findings of the present study should be considered with the following limitations. First, the KAMIR-NIH-LIPID study has a retrospective nature, where additional clinical data regarding lipid management and clinical outcomes between the 3- and 5-year follow-up periods were collected retrospectively based on the electronic medical records between May 2022 and August 2023. Therefore, the possibility of missing data, including clinical outcomes, exists. Second, due to the nature of the present study, which compared the percentage LDL-C reductions from baseline and absolute follow-up levels after AMI, there are inherent issues about selection and immortal time biases. centers from KAMIR-NIH tended to be larger-volume teaching centers. Thus, practice patterns and clinical outcomes may not be generalized to the average hospital. Third, of the 13,188 patients with AMI, only 6,990 (53%) were included in the final analysis, resulting in attenuated internal validity. A comparison of baseline characteristics and clinical outcomes between analyzed and excluded patients is provided in Supplementary Table S4. Nonetheless, the patients analyzed in the study may present a similar population where physicians consider lipid-lowering strategy modifications using follow-up LDL-C levels in real-world practice. Finally, during the KAMIR-NIH period between 2011 and 2015, non-statin LDL-C-lowering drugs, including ezetimibe and proprotein convertase subtilisin/kexin type 9 inhibitors, generally were not considered in real-world practice in Korea.
In conclusion, this nationwide Korean registry involving 6,249 AMI patients with a 5-year clinical follow-up demonstrated that the greater the LDL-C reduction from baseline, the lower the incidence of MACE, while there was no clear decreasing trend in the risk of MACE when absolute follow-up LDL-C levels were lowered from around 70 mg/dL. Our study suggests that the percentage reduction in LDL-C from baseline may be a better marker than absolute follow-up LDL-C levels for LDL-C-lowering therapy in patients with AMI even if it's sometimes tricky to find out the baseline LDL-C levels of patients for lipid management after AMI in a real-world setting. Further studies are needed to clarify this issue.
Statements
Data availability statement
The anonymized data that support the results of this study can be made available upon reasonable request.
Ethics statement
The KAMIR-NIH-LIPID study was approved by the ethics committee of each participating center (approval number: CNUH-2022-038) and conducted in accordance with the Declaration of Helsinki. The participants provided their written informed consent to participate in this study.
Author contributions
KHC: Conceptualization, Data curation, Formal analysis, Investigation, Methodology, Resources, Visualization, Writing – original draft. JHY: Data curation, Formal analysis, Investigation, Methodology, Resources, Visualization, Writing – original draft. SYL: Conceptualization, Data curation, Investigation, Visualization, Writing – review & editing. MHS: Data curation, Formal analysis, Investigation, Methodology, Resources, Visualization, Writing – original draft. SO: Formal analysis, Resources, Writing – review & editing. MCK: Formal analysis, Resources, Writing – review & editing. DSS: Formal analysis, Resources, Writing – review & editing. YJH: Formal analysis, Resources, Writing – review & editing. JHK: Formal analysis, Resources, Writing – review & editing. YA: Formal analysis, Resources, Writing – review & editing. JHL: Data curation, Investigation, Writing – review & editing. JSK: Data curation, Investigation, Writing – review & editing. YHJ: Data curation, Investigation, Writing – review & editing. JYHahn: Data curation, Investigation, Writing – review & editing. JYHwang: Data curation, Investigation, Writing – review & editing. MHJ: Conceptualization, Data curation, Formal analysis, Funding acquisition, Investigation, Resources, Supervision, Visualization, Writing – review & editing. WK: Conceptualization, Data curation, Formal analysis, Funding acquisition, Investigation, Resources, Supervision, Visualization, Writing – original draft, Writing – review & editing.
Funding
The author(s) declare that financial support was received for the research and/or publication of this article. This study was funded by the Research of Korea Center for Disease Control and Prevention (2016–ER6304–02) and the National Evidence-based Healthcare Collaborating Agency (HC21C0077). The funders of the study had no role in the study design, data collection, data analysis, data interpretation, or the writing of the report.
Acknowledgments
The authors thank the patients and investigators who participated in this registry study.
Conflict of interest
KHC has received speaker/consulting honoraria from Amgen, Sanofi, Viatris, Jeil Pharm, Aju Pharm, and JW Pharm. JHK has received speaker/consulting honoraria from Amgen, Astra Zeneca, Daiichi Sankyo, Hanmi Pharm, Organon, and Pfizer. YJH has received speaker/consulting honoraria from Hanmi Pharm, Chong Kun Dang, and Daewon Pharm. JYHahn has received speaker/consulting honoraria from Amgen, Astra Zeneca, Daiichi Sankyo, Hanmi Pharm, Organon, Novartis, Pfizer, and Sanofi-Aventis. MHJ has received an institutional research grant from Hanmi Pharm and Yuhan Pharm; speaker/consulting honoraria from Amgen.
The remaining authors declare that the research was conducted in the absence of any commercial or financial relationships that could be construed as a potential conflict of interest.
Generative AI statement
The author(s) declare that no Generative AI was used in the creation of this manuscript.
Any alternative text (alt text) provided alongside figures in this article has been generated by Frontiers with the support of artificial intelligence and reasonable efforts have been made to ensure accuracy, including review by the authors wherever possible. If you identify any issues, please contact us.
Publisher’s note
All claims expressed in this article are solely those of the authors and do not necessarily represent those of their affiliated organizations, or those of the publisher, the editors and the reviewers. Any product that may be evaluated in this article, or claim that may be made by its manufacturer, is not guaranteed or endorsed by the publisher.
Supplementary material
The Supplementary Material for this article can be found online at: https://www.frontiersin.org/articles/10.3389/fcvm.2025.1653447/full#supplementary-material
Abbreviations
AMI, acute myocardial infarction; KAMIR, Korea Acute Myocardial Infarction Registry; LDL-C, low-density lipoprotein cholesterol; MACE, major adverse cardiovascular events; NIH, National Institute of Health.
References
1.
Baigent C Blackwell L Emberson J Holland LE Reith C Bhala N et al Efficacy and safety of more intensive lowering of ldl cholesterol: a meta-analysis of data from 170,000 participants in 26 randomised trials. Lancet. (2010) 376(9753):1670–81. 10.1016/s0140-6736(10)61350-5
2.
Silverman MG Ference BA Im K Wiviott SD Giugliano RP Grundy SM et al Association between lowering ldl-C and cardiovascular risk reduction among different therapeutic interventions: a systematic review and meta-analysis. JAMA. (2016) 316(12):1289–97. 10.1001/jama.2016.13985
3.
Reiner Z Catapano AL De Backer G Graham I Taskinen MR Wiklund O et al Esc/eas guidelines for the management of dyslipidaemias: the task force for the management of dyslipidaemias of the European Society of Cardiology (Esc) and the European Atherosclerosis Society (Eas). Eur Heart J. (2011) 32(14):1769–818. 10.1093/eurheartj/ehr158
4.
Smith SC Jr Benjamin EJ Bonow RO Braun LT Creager MA Franklin BA et al Aha/accf secondary prevention and risk reduction therapy for patients with coronary and other atherosclerotic vascular disease: 2011 update: a guideline from the American Heart Association and American College of Cardiology Foundation Endorsed by the World Heart Federation and the Preventive Cardiovascular Nurses Association. J Am Coll Cardiol. (2011) 58(23):2432–46. 10.1016/j.jacc.2011.10.824
5.
Grundy SM Stone NJ Bailey AL Beam C Birtcher KK Blumenthal RS et al 2018 Aha/acc/aacvpr/aapa/abc/acpm/Ada/ags/apha/aspc/nla/pcna guideline on the management of blood cholesterol: executive summary: a report of the American College of Cardiology/American Heart Association Task Force on Clinical Practice Guidelines. Circulation. (2019) 139(25):e1046–81. 10.1161/cir.0000000000000624
6.
Mach F Baigent C Catapano AL Koskinas KC Casula M Badimon L et al 2019 Esc/eas guidelines for the management of dyslipidaemias: lipid modification to reduce cardiovascular risk. Eur Heart J. (2020) 41(1):111–88. 10.1093/eurheartj/ehz455
7.
Gitt AK Lautsch D Ferrières J Ferrari D Vyas GM Baxter A et al Cholesterol target value attainment and lipid-lowering therapy in patients with stable or acute coronary heart disease: results from the dyslipidemia international study ii. Atherosclerosis. (2017) 266:158–66. 10.1016/j.atherosclerosis.2017.08.013
8.
Lee SH Song WH Jeong MH Hur SH Jeon DW Jeung W et al Dyslipidemia and rate of under-target low-density lipoprotein-cholesterol in patients with coronary artery disease in Korea. J Lipid Atheroscler. (2019) 8(2):242–51. 10.12997/jla.2019.8.2.242
9.
Khatib R Yeh EJ Glowacki N McGuiness CB Xie H Wade RL et al Lipid-lowering therapy utilization and dosage among patients with acute coronary syndrome events: a retrospective cohort from 12 community hospitals. Clin Epidemiol. (2023) 15:547–57. 10.2147/clep.s400903
10.
Navar AM Matskeplishvili ST Urina-Triana M Arafah M Chen JW Sukonthasarn A et al Prospective evaluation of lipid management following acute coronary syndrome in non-western countries. Clin Cardiol. (2021) 44(7):955–62. 10.1002/clc.23623
11.
Alsadat N Hyun K Boroumand F Juergens C Kritharides L Brieger DB . Achieving lipid targets within 12 months of an acute coronary syndrome: an observational analysis. Med J Aust. (2022) 216(9):463–8. 10.5694/mja2.51442
12.
Harris DE Lacey A Akbari A Torabi F Smith D Jenkins G et al Achievement of European guideline-recommended lipid levels post-percutaneous coronary intervention: a population-level observational cohort study. Eur J Prev Cardiol. (2021) 28(8):854–61. 10.1177/2047487320914115
13.
Lee SY Cho KH Lee JH Hong YJ Hwang JY Jeong MH et al Significant gap between guidelines and practice in the management of ldl cholesterol: insight from the survey of the Korean society of myocardial infarction. J Korean Med Sci. (2023) 38:e419. 10.3346/jkms.2023.38.e419
14.
Byrne RA Rossello X Coughlan JJ Barbato E Berry C Chieffo A et al 2023 Esc guidelines for the management of acute coronary syndromes. Eur Heart J. (2023) 44(38):3720–826. 10.1093/eurheartj/ehad191
15.
Zhang Y Pletcher MJ Vittinghoff E Clemons AM Jacobs DR Jr Allen NB et al Association between cumulative low-density lipoprotein cholesterol exposure during young adulthood and middle age and risk of cardiovascular events. JAMA Cardiol. (2021) 6(12):1406–13. 10.1001/jamacardio.2021.3508
16.
Biccirè FG Gatto L La Porta Y Pignatelli P Prati F Pastori D . Effects of lipid lowering therapies on vulnerable plaque features: an updated narrative review of the literature. J Cardiovasc Dev Dis. (2023) 10(6):260. 10.3390/jcdd10060260
17.
Nicholls SJ Kataoka Y Nissen SE Prati F Windecker S Puri R et al Effect of evolocumab on coronary plaque phenotype and burden in statin-treated patients following myocardial infarction. JACC Cardiovasc Imaging. (2022) 15(7):1308–21. 10.1016/j.jcmg.2022.03.002
18.
Räber L Ueki Y Otsuka T Losdat S Häner JD Lonborg J et al Effect of alirocumab added to high-intensity statin therapy on coronary atherosclerosis in patients with acute myocardial infarction: the pacman-ami randomized clinical trial. JAMA. (2022) 327(18):1771–81. 10.1001/jama.2022.5218
19.
Fujisaki T Shirahama Y Sheng F Ikeda K Osada N Tanaka S et al The effect of lipid-lowering therapy on coronary artery plaque in east Asia population. JACC Asia. (2025) 5(8):1032–47. 10.1016/j.jacasi.2025.05.016
20.
Anderson KM Castelli WP Levy D . Cholesterol and mortality. 30 years of follow-up from the framingham study. JAMA. (1987) 257(16):2176–80. 10.1001/jama.257.16.2176
21.
Iribarren C Reed DM Chen R Yano K Dwyer JH . Low serum cholesterol and mortality. Which is the cause and which is the effect?Circulation. (1995) 92(9):2396–403. 10.1161/01.cir.92.9.2396
22.
Rauchhaus M Clark AL Doehner W Davos C Bolger A Sharma R et al The relationship between cholesterol and survival in patients with chronic heart failure. J Am Coll Cardiol. (2003) 42(11):1933–40. 10.1016/j.jacc.2003.07.016
23.
Markaki I Nilsson U Kostulas K Sjöstrand C . High cholesterol levels are associated with improved long-term survival after acute ischemic stroke. J Stroke Cerebrovasc Dis. (2014) 23(1):e47–53. 10.1016/j.jstrokecerebrovasdis.2013.08.009
24.
Matsuoka M Inoue T Shinjo T Miiji A Tamashiro M Oba K et al Cardiovascular risk profile and frailty in Japanese outpatients: the nambu cohort study. Hypertens Res. (2020) 43(8):817–23. 10.1038/s41440-020-0427-z
25.
Giugliano RP Wiviott SD Blazing MA Ferrari D Park GM Murphy JG et al Long-Term safety and efficacy of achieving very low levels of low-density lipoprotein cholesterol: a prespecified analysis of the improve-it trial. JAMA Cardiol. (2017) 2(5):547–55. 10.1001/jamacardio.2017.0083
26.
Cho KH Kim MC Choo EH Choi IJ Lee SN Park MW et al Impact of low baseline low-density lipoprotein cholesterol on long-term postdischarge cardiovascular outcomes in patients with acute myocardial infarction. J Am Heart Assoc. (2022) 11(17):e025958. 10.1161/jaha.122.025958
27.
Navarese EP Robinson JG Kowalewski M Kolodziejczak M Andreotti F Bliden K et al Association between baseline ldl-C level and total and cardiovascular mortality after ldl-C lowering: a systematic review and meta-analysis. JAMA. (2018) 319(15):1566–79. 10.1001/jama.2018.2525
28.
Collins R Reith C Emberson J Armitage J Baigent C Blackwell L et al Interpretation of the evidence for the efficacy and safety of statin therapy. Lancet. (2016) 388(10059):2532–61. 10.1016/s0140-6736(16)31357-5
29.
Cho KH Jeong MH Park KW Kim HS Lee SR Chae JK et al Comparison of the effects of two low-density lipoprotein cholesterol goals for secondary prevention after acute myocardial infarction in real-world practice: ≥50% reduction from baseline versus <70 mg/dl. Int J Cardiol. (2015) 187:478–85. 10.1016/j.ijcard.2015.03.386
30.
Schubert J Lindahl B Melhus H Renlund H Leosdottir M Yari A et al Low-density lipoprotein cholesterol reduction and statin intensity in myocardial infarction patients and major adverse outcomes: a Swedish nationwide cohort study. Eur Heart J. (2021) 42(3):243–52. 10.1093/eurheartj/ehaa1011
31.
Ennezat PV Guerbaai RA Maréchaux S Le Jemtel TH François P . Extent of low-density lipoprotein cholesterol reduction and all-cause and cardiovascular mortality benefit: a systematic review and meta-analysis. J Cardiovasc Pharmacol. (2023) 81(1):35–44. 10.1097/fjc.0000000000001345
32.
Gaba P O'Donoghue ML Park JG Wiviott SD Atar D Kuder JF et al Association between achieved low-density lipoprotein cholesterol levels and long-term cardiovascular and safety outcomes: an analysis of Fourier-Ole. Circulation. (2023) 147(16):1192–203. 10.1161/circulationaha.122.063399
Summary
Keywords
LDL cholesterol, acute coronary syndrome, myocardial infarction, incidence, registries
Citation
Cho KH, Yang JH, Lee SY, Shin M-H, Oh S, Kim MC, Sim DS, Hong YJ, Kim JH, Ahn Y, Lee JH, Kwun J-S, Jeong Y-H, Hahn J-Y, Hwang JY, Jeong MH and Kim W (2025) Long-term outcomes according to absolute value vs. percentage reduction in low-density lipoprotein cholesterol levels after acute myocardial infarction. Front. Cardiovasc. Med. 12:1653447. doi: 10.3389/fcvm.2025.1653447
Received
25 June 2025
Revised
20 November 2025
Accepted
20 November 2025
Published
05 December 2025
Volume
12 - 2025
Edited by
Istvan Szokodi, University of Pécs, Hungary
Reviewed by
Flavio Giuseppe Biccirè, Sapienza University of Rome, Italy
Pierre Vladimir Ennezat, Benjamin Bardel Hôpitaux Universitaires Henri Mondor, France
Updates
Copyright
© 2025 Cho, Yang, Lee, Shin, Oh, Kim, Sim, Hong, Kim, Ahn, Lee, Kwun, Jeong, Hahn, Hwang, Jeong and Kim.
This is an open-access article distributed under the terms of the Creative Commons Attribution License (CC BY). The use, distribution or reproduction in other forums is permitted, provided the original author(s) and the copyright owner(s) are credited and that the original publication in this journal is cited, in accordance with accepted academic practice. No use, distribution or reproduction is permitted which does not comply with these terms.
* Correspondence: Weon Kim mylovekw1@naver.com Myung Ho Jeong myungho6243@gmail.com
†These authors have contributed equally to this work and share first authorship
Disclaimer
All claims expressed in this article are solely those of the authors and do not necessarily represent those of their affiliated organizations, or those of the publisher, the editors and the reviewers. Any product that may be evaluated in this article or claim that may be made by its manufacturer is not guaranteed or endorsed by the publisher.