Abstract
Background:
Assessment of cardiorespiratory fitness (CRF) is imperative in patients with atrial fibrillation (AF) who have had radiofrequency catheter ablation (RFCA). This study aimed to develop and validate CRF prediction models in this population.
Methods:
141 AF patients with RFCA were recruited. The cardiopulmonary exercise test was used to assess CRF with VO2peak and METsmax. Multidimensional predictors (demographics, serum biomarkers, cardiovascular parameters, and motor function parameters) were analyzed through Spearman correlation analysis and stepwise multivariate linear regression analysis. The internal validity of the prediction equation was tested by paired Student's t-test, Pearson correlation analysis and Bland-Altman analysis.
Results:
Sex, BMI, ln NT-proBNP, glucose (GLU), 6-minute walking distance (6MWD), and systolic blood pressure (SBP) were found to be significantly associated with CRF in this population. Multivariate linear regression generated the equations: VO2peak = 35.080 − 0.286 * BMI − 1.927 * Sex − 1.090 * ln NT-proBNP + 0.011 * 6MWD − 0.039 * SBP − 0.512 * GLU, and METsmax = 9.646 − 0.447 * Sex − 0.260 * ln NT-proBNP − 0.140 * GLU − 0.078 * BMI − 0.016 * SBP + 0.004 * 6MWD, (VO2peak: adjusted R2 = 0.506, and METsmax: adjusted R2 = 0.469, both P < 0.01). Pearson correlations between the predicted values and the measured values showed good validity (VO2peak: r = 0.616, and METsmax: r = 0.581, both P < 0.01). The Bland-Altman analysis showed that the predicted VO2peak values were slightly lower than the measured values (mean difference = −0.13; 95% limits of agreement: −5.20 to 4.93), while the predicted METsmax values were in close agreement with the measured values (mean difference = −0.00; 95% limits of agreement: −1.59 to 1.59).
Conclusion:
Sex, BMI, NT-proBNP, glucose, 6MWD, and SBP are robust predictors of VO2peak and METsmax in AF population after RFCA. This study generates and internal validates the first multivariable CRF prediction models with easy-to use clinical paraments in AF patients after RFCA, thereby providing safe and effective alternatives to conventional CPX, which may help to optimize personalized patient management.
1 Introduction
Atrial fibrillation (AF) is one of the most prevalent cardiac arrhythmias with the rising incidence driven by an aging population, which is strongly associated with adverse outcomes such as stroke and heart failure (1, 2). While radiofrequency catheter ablation (RFCA) is listed as a class I recommendation for rhythm control, long-term follow-up studies have demonstrated that the incidence of late arrhythmia recurrence (defined as recurrence occurring more than 12 months post-ablation) can reach up to 30%, highlighting the urgent need for prognostic assessment tools (3–5).
Cardiorespiratory fitness (CRF) is the maximal aerobic capacity quantified by peak oxygen uptake (VO2peak) and maximal metabolic equivalents (METsmax) and has been established as a robust prognostic indicator in cardiovascular diseases (6). Among AF patients, higher CRF is independently associated with reduced risk of arrhythmia recurrence and all-cause mortality after ablation (7, 8). Notably, each 1-metabolic equivalent (MET) increase in CRF correlates with a 20% decrease in AF recurrence risk (9). While cardiopulmonary exercise test (CPX) remains the gold standard for CRF assessment, the implementation of CPX in this population faces three major challenges: First, the prevalence of AF increases with age. Data from the China Health and Retirement Longitudinal Study (CHARLS) show that 7% of Chinese adults aged 60 and above experience frailty (10). Compared to those without AF, individuals with AF are more prone to frailty, falls, and declines in physical function, making it difficult for them to meet the effective testing criteria (Respiratory Exchange Ratio ≥ 1.05) (11). Second, in clinical practice, we have observed that some patients experience kinesiophobia and refuse to undergo maximal exercise testing (12). More importantly, CPX equipment is costly and requires specialized training, limiting its application in primary care settings (13).
To date, safe and effective alternatives for evaluating CRF in AF population after RFCA have remained conspicuously absent (14–16). Emerging evidence suggests that motor function assessments, including sit-to-stand tests and 6-minute walk test, have a close relationship with CRF in cardiovascular population (17, 18). Therefore, this study aims to develop and validate CRF assessment predictive models in AF patients after RFCA using accessible clinical indicators, including demographic information, serum biomarkers, cardiovascular parameters, and motor function parameters, so as to address a critical CRF prediction gap in this population.
2 Materials and methods
2.1 Ethical approval
This study was conducted in accordance with the 1975 Declaration of Helsinki. It was approved by the Medical Ethics Committee of Xinhua Hospital Affiliated to Shanghai Jiao Tong University School of Medicine (Approval Number: XHEC-C-2024-190-1) and registered at the Chinese Clinical Trial Registry (Registration ID: ChiCTR2400094326; URL: http://www.chictr.org.cn). All patients provided written informed consent for study participation.
2.2 Sample size calculation
According to the preliminary experiment, we used G*power 3.1 software (Heinrich Heine University Düsseldorf, Germany) to estimate the required sample size. The analysis was conducted with the following parameters: the effect size f2 = 0.15, 1 − β = 80%, α = 0.05, and the number of predicted variables was 5–7. Finally, 92–103 participants were needed.
2.3 Study population
This prospective observational cohort study initially enrolled 145 AF patients who underwent RFCA at Xinhua Hospital affiliated to Shanghai Jiao Tong University School of Medicine, between May 2024 and February 2025.
All AF patients were diagnosed via standard 12-lead ECG or 24-hour Holter monitoring, and classified according to the 2023 ACC/AHA/ACCP/HRS guidelines (paroxysmal AF: self-terminating within 48 h; persistent AF: sustained > 7 days or requiring cardioversion; long-standing persistent AF: Continuous > 12 months) (1). Antiarrhythmic drugs (e.g., amiodarone) were discontinued for ≥ 5 half-lives pre-procedure. Within 48 h before the procedure, transesophageal echocardiography was performed to exclude intracardiac thrombus, supplemented by cardiac computed tomography angiography when clinically feasible. All procedures were performed under local anesthesia and guided by the CARTO3 navigation system (Biosense Webster, Inc., Irvine, USA). The THERMOCOOL SMARTTOUCH SF catheter was used as its 56-hole tip irrigation facilitating cooling at low flow rate, thus easing the fluid management process. Pulmonary vein isolation (PVI) was performed in all patients. Additional ablation including left atrial roof line, anterior septal, posterior and inferior lines, mitral isthmus (MI) and cavo-tricuspid isthmus (CTI) lines, complex fractionated electrograms (CFAE) modification, and ablation of ganglionated plexi and extra-PV triggers, were performed when deemed necessary. For patients not achieving sinus rhythm post-ablation, low-energy (≤15 J) intracardiac cardioversion was delivered via catheters positioned in the right atrium and coronary sinus/left atrium. All operations were performed by experienced physicians (>50 annual cases).
Inclusion criteria were: AF patients aged between 40 and 80 years old who underwent RFCA in the last 3–12 months (3), documented sinus rhythm with a heart rate ranging from 60 to 100 beats per minute, and with written informed consent given. Exclusion criteria included: patients with contraindications to CPX as defined by the American Heart Association, significant musculoskeletal system diseases (e.g., fractures, serious soft tissue injuries) or severe chronic diseases (e.g., cerebrovascular, pulmonary, hepatic, or renal impairment), patients with cognitive dysfunction, and those who had participated in other intervention trials within the past 90 days. After excluding atrial flutter (n = 1), non-consent (n = 1), and severe respiratory comorbidities (n = 2), data from 141 participants were analyzed (Supplementary Figure S1).
2.4 Data collection
The retrospective data of all patients included: (1) Demographic and anthropometric data: Age, gender, height, weight, and waist circumference, body mass index (BMI), blood pressure, smoking history, alcohol consumption, medical history, and current medications were recorded. The BMI was calculated as weight (kg) divided by height squared (m2). (2) Laboratory data: Fasting venous blood samples were collected in the morning to measure N-terminal pro-B-type natriuretic peptide (NT-proBNP), hemoglobin (HGB), glucose (GLU), serum creatinine (Cr), low-density lipoprotein cholesterol (LDL-C), high-density lipoprotein cholesterol (HDL-C), total cholesterol (TC), triglycerides (TG) and estimated glomerular filtration rate (eGFR) levels. (3) Cardiac function data: Two-dimensional transthoracic echocardiography was used to measure left ventricular end-diastolic dimension (LVEDD), left atrial anteroposterior diameter (LAD), left ventricular ejection fraction (LVEF) and systolic pulmonary artery pressure (PAP).
2.5 Assessment of cardiorespiratory fitness
Cardiopulmonary exercise test was conducted on an electronically braked cycle ergometer according to American Heart Association guidelines (13). The baseline phase included 3 min of seated rest. The warm-up phase consisted of 3 min of unloaded cycling (55–65 rpm). In the incremental phase, the workload was continuously increased at a constant rate of 10–15 watts per minute (ramp protocol) until the patient experienced voluntary fatigue or met the termination criteria. The recovery phase was 3 min of unloaded cycling (30 rpm). Throughout the process, output from a continuous 12-lead electrocardiogram and pulse oximetry were monitored, and blood pressure was measured every 3 min. VO2peak was directly measured using the Quark PFT4 Ergo metabolic cart (COSMED, Italy) and defined as the highest 30 s average value during maximal effort, normalized to body weight (ml·kg−1·min−1). METsmax was calculated as VO2peak divided by 3.5 ml·kg−1·min−1 (13).
2.6 Assessment of motor function
(1) Time up-and-go test (TUG): Participants sat on a 46 cm high chair with back against the chair, arms resting on the chair's arms. Upon receiving the “Go” command, they stood up and walked at a comfortable and safe pace to a line on the floor 3 m away, turned, returned to the chair, and sat down again. The total completion time was recorded in seconds (19). (2) Five-times sit-to-stand test (FTSTS): Participants performed five consecutive sit-to-stand cycles from a 46 cm high chair placed against a wall. The initial position required the ankles to be in a neutral alignment, with feet flat and the arms folded across the chest. Upon receiving the “Go” command, participants were instructed to fully extend their knees and hips during the standing phase and ensure complete contact with the chair during the sitting phase (20). The total time to complete five cycles was recorded. (3) 6-minute walk distance (6MWD): The 6MWD was performed according to the American Thoracic Society guidelines on a 30 m indoor walkway with colored cones marking turn-around points (21). A certified cardiac rehabilitation therapist assessed the baseline heart rate and blood pressure, and gave standardized instructions. Participant then walked for six min at their self-selected maximal pace. Post-test measurements, including 6MWD, heart rate and blood pressure during the recovery phase were recorded.
All participants abstained from caffeine for ≥12 h and fasted for ≥3 h before the tests, and wore comfortable clothing and shoes. To minimize the interference of fatigue, all motor function tests were completed within one week. TUG and FTSTS were performed on the same day with 5 min seated recovery interval between them, whereas the 6MWD commenced precisely 30 min after the completion of TUG/FTSTS. CPX was conducted on a separate day.
2.7 Statistical analysis
All statistical analyses were conducted using SPSS 25.0 (IBM Ink., Armonk, NY) under the supervision of a medical statistician expert. Normally distributed continuous variables were analyzed using Student's t-test, reported as mean ± SD. Non-normally distributed continuous variables were compared via the Mann–Whitney U test with median (Q1, Q3) presentation. Categorical variables were analyzed by the Chi—square (χ2) test, and the results were presented as percentages (%). Participants were randomly allocated into a derivation cohort (n = 105) and a validation cohort (n = 36) at a ratio of 3:1. Variables demonstrating statistical trends (P < 0.1) in the correlation analysis with VO2peak and METsmax were initially selected as candidate independent variables. Stepwise regression (forward entry α ≤ 0.05, backward retention α ≥ 0.1) was employed to develop the predictive equations. The robustness of the models was evaluated through multiple means. Normality was assessed using histograms of standardized residuals. Multicollinearity was examined by calculating the variance inflation factor (VIF), with a threshold of VIF < 5. Residual independence was evaluated using the Durbin—Watson statistic, with an acceptable range of 1.5–2.5. The goodness-of-fit of the models was determined by F-tests from ANOVA, and reported as adjusted R2. For internal validation, predicted and measured values in the validation cohort were compared using Pearson correlation coefficients and paired Student's t-test, with Bland-Altman agreement analysis to evaluate accuracy and systematic bias. For all analyses, P < 0.05 indicated statistically significant.
3 Results
3.1 Baseline characteristics
This study enrolled 141 AF patients who underwent RFCA, with detailed characteristics presented in Table 1. The average age was 68.7 ± 7.58 years, including 62.4% males and 56.7% persistent AF patients. Comorbidities included hypertension (96 patients), diabetes (27 patients), CAD (83 patients), and prior stroke (31 patients). Among these patients, 54.6% received ACEIs/ARBs/ARNI therapy, 81.6% NOACs, 86.5% amiodarone, 53.2% β-blockers, 23.4% antiplatelet agents, and 68.1% statins. Echocardiographic parameters demonstrated a mean LAD of 38.98 ± 4.96 mm, LVEED of 47.6 ± 4.61 mm, and LVEF of 65.72 ± 5.21%. Motor function tests revealed FTSTS (13.85 ± 4.08 s), TUG (9.35 ± 2.81 s), and 6MWD (397.0 8 ± 60.4 m). CPX results indicated VO2peak and METsmax were 16.29 ± 3.20 ml·kg−1·min−1 and 4.63 ± 0.98 ml·kg−1·min−1, respectively. No significant differences existed in demographic, blood biochemistry, motor function, and cardiopulmonary function parameters between validation and derivation cohorts (P > 0.05).
Table 1
| Indicator | Total N = 141 | Derivation cohort N = 105 | Validation cohort N = 36 | t/χ2/Z | P value |
|---|---|---|---|---|---|
| Age (years) | 68.7 ± 7.58 | 68.78 ± 7.47 | 68.47 ± 8.02 | 0.21 | 0.834 |
| Male, n (%) | 88 (62.4) | 65 (61.9) | 23 (63.9) | 0.045 | 0.832 |
| BMI (kg/m2) | 24.74 ± 3.49 | 24.78 ± 3.42 | 24.65 ± 3.75 | 0.188 | 0.851 |
| Height (m) | 1.67 ± 0.08 | 1.67 ± 0.08 | 1.67 ± 0.07 | −0.075 | 0.94 |
| Weight (kg) | 69.53 ± 12.25 | 69.56 ± 11.99 | 69.46 ± 13.16 | 0.04 | 0.968 |
| SBP (mmHg) | 121.53 ± 20.42 | 123.33 ± 16.47 | 116.28 ± 28.70 | 1.397 | 0.165 |
| DBP (mmHg) | 77.57 ± 10.03 | 78.11 ± 10.09 | 79.37 ± 16.17 | −0.433 | 0.667 |
| Current smoking, n (%) | 16 (11.3) | 9 (56.3) | 7 (43.8) | 2.162 | 0.141 |
| Alcohol consumption, n (%) | 24 (17.0) | 18 (75.0) | 6 (25.0) | 0.004 | 0.948 |
| Persistent/long-standing persistent AF, n (%) | 80 (56.7) | 62 (77.5) | 18 (22.5) | 0.894 | 0.344 |
| Paroxysmal AF, n (%) | 61 (43.3) | 43 (70.5) | 18 (29.5) | 0.894 | 0.344 |
| CHA2DS2-VASc | 4.50 ± 1.64 | 4.51 ± 1.63 | 4.44 ± 1.70 | 0.220 | 0.827 |
| Disease | |||||
| Hypertension, n (%) | 96 (68.1) | 74 (77.1) | 22 (22.9) | 1.082 | 0.298 |
| Diabetes, n (%) | 27 (19.1) | 21 (77.8) | 6 (22.2) | 0.192 | 0.661 |
| CAD, n (%) | 83 (58.9) | 62 (74.7) | 21 (25.3) | 0.006 | 0.940 |
| stroke/TIA, n (%) | 31 (22.0) | 22 (71.0) | 9 (29.0) | 0.256 | 0.613 |
| Medication | |||||
| ACEIs/ARBs/ARNI, n (%) | 77 (54.6) | 61 (79.2) | 16 (20.8) | 2.015 | 0.156 |
| NOACs, n (%) | 115 (81.6) | 84 (73.0) | 31 (27.0) | 0.666 | 0.415 |
| Amiodarone, n (%) | 122 (86.5) | 92 (75.4) | 30 (24.6) | 0.135 | 0.714 |
| β-blockers, n (%) | 75 (53.2) | 59 (78.7) | 16 (21.3) | 1.486 | 0.223 |
| Antiplatelet agents, n (%) | 33 (23.4) | 25 (75.8) | 8 (24.2) | 0.038 | 0.846 |
| Statins, n (%) | 96 (68.1) | 70 (72.9) | 26 (27.1) | 0.381 | 0.537 |
| Cardiac function | |||||
| LVEED (mm) | 47.6 ± 4.61 | 48.02 ± 4.36 | 46.34 ± 5.16 | 1.884 | 0.062 |
| LAD (mm) | 38.98 ± 4.96 | 39.38 ± 4.92 | 37.79 ± 4.98 | 1.644 | 0.103 |
| LVEF (%) | 65.72 ± 5.21 | 65.74 ± 5.23 | 65.65 ± 5.24 | 0.085 | 0.932 |
| PAP (mmHg) | 39.14 ± 13.19 | 41.11 ± 13.95 | 33.42 ± 8.53 | 3.906 | <0.001 |
| Laboratory data | |||||
| NT-proBNP (pg/ml) | 374.15 (86.49–265.09) | 438.41 (85.63–288.59) | 186.69 (87.83–227.22) | −1.227 | 0.220 |
| HGB (g/L) | 139.07 ± 14.71 | 137.8 ± 15.43 | 142.69 ± 11.85 | −1.723 | 0.087 |
| GLU (mmol/L) | 5.94 ± 1.18 | 5.89 ± 1.17 | 6.07 ± 1.23 | −0.791 | 0.431 |
| Cr (umol/L) | 84.67 ± 100.54 | 88.65 ± 11.08 | 73.04 ± 14.26 | 0.803 | 0.423 |
| TC (mmol/L) | 3.86 ± 0.92 | 3.85 ± 0.96 | 3.91 ± 0.83 | −0.345 | 0.731 |
| TG (mmol/L) | 1.16 ± 0.60 | 1.19 ± 0.60 | 1.07 ± 0.58 | 1.077 | 0.283 |
| HDL-C (mmol/L) | 1.25 ± 0.31 | 1.23 ± 0.29 | 1.32 ± 0.36 | −1.585 | 0.115 |
| LDL-C (mmol/L) | 2.22 ± 0.86 | 2.23 ± 0.89 | 2.18 ± 0.76 | 0.284 | 0.777 |
| eGFR (ml/min) | 85.53 ± 24.97 | 84.4 ± 26.15 | 88.83 ± 21.14 | −0.918 | 0.36 |
| Motor function | |||||
| FTSTS (s) | 13.85 ± 4.08 | 13.85 ± 4.29 | 13.86 ± 3.43 | −0.021 | 0.984 |
| TUG (s) | 9.35 ± 2.81 | 9.37 ± 3.00 | 9.30 ± 2.18 | 0.125 | 0.901 |
| 6MWD (m) | 397.08 ± 60.4 | 394.64 ± 62.31 | 404.2 ± 54.65 | −0.819 | 0.414 |
| Cardiorespiratory fitness | |||||
| VO2peak (ml·kg−1·min−1) | 16.29 ± 3.20 | 16.09 ± 3.18 | 16.88 ± 3.22 | −1.294 | 0.198 |
| METsmax (ml·kg−1·min−1) | 4.63 ± 0.98 | 4.57 ± 0.99 | 4.80 ± 0.96 | −1.232 | 0.22 |
| %predicted VO2peak | 71.4 ± 12.59 | 70.77 ± 12.63 | 73.25 ± 12.47 | −1.019 | 0.31 |
| Power (Watt) | 81.05 ± 26.37 | 80.72 ± 25.76 | 82.00 ± 28.44 | −0.25 | 0.803 |
| RER | 1.17 ± 0.12 | 1.18 ± 0.13 | 1.14 ± 0.08 | 1.99 | 0.05 |
| VE/VCO2 slope | 28.43 ± 4.26 | 28.35 ± 4.35 | 28.68 ± 4.06 | −0.421 | 0.675 |
| HRrest (bpm) | 74.72 ± 13.9 | 73.60 ± 13.86 | 78.00 ± 13.68 | −1.649 | 0.101 |
| HRmax (bpm) | 107.68 ± 16.59 | 106.46 ± 16.83 | 111.25 ± 15.54 | −1.503 | 0.135 |
Descriptive characteristics and cardiopulmonary exercise test variables of study participants.
6MWD, 6-minute walk distance; ACEIs/ARBs/ARNI, angiotensin-converting enzyme inhibitors/angiotensin receptor blockers/angiotensin receptor-neprilysin inhibitors; BMI, body mass index; CAD, coronary artery disease; Cr, creatinine; eGFR, estimated glomerular filtration rate; FTSTS, five-times sit-to-stand test; GLU, glucose; HDL-C, high-density lipoprotein cholesterol; HGB, hemoglobin; LAD, left atrial diameter; LDL-C, low-density lipoprotein cholesterol; LVEDD, left ventricular end-diastolic diameter; LVEF, left ventricular ejection fraction; METsmax, peak metabolic equivalents; NOACs, non-vitamin K antagonist oral anticoagulants; NT-proBNP, N-terminal pro-B-type natriuretic peptide; PAP, pulmonary artery pressure; RER, respiratory exchange ratio; SBP, systolic blood pressure; TC, total cholesterol; TG, triglycerides; TIA, transient ischemic attack; TUG, time up-and-go test; VE/VCO2 slope, minute ventilation/carbon dioxide production slope; VO2peak, peak oxygen uptake.
3.2 Correlation analysis
As summarized in Table 2, VO2peak in AF patients was significantly correlated with multiple indicators including age (r = −0.296, P = 0.002), height (r = 0.301, P = 0.002), BMI (r = −0.269, P = 0.005), gender (r = −0.451, P < 0.001), LAD (r = −0.306, P = 0.002), NT-proBNP (r = −0.379, P < 0.001), hemoglobin (r = 0.316, P = 0.001), eGFR (r = 0.309, P = 0.001), FTSTS (r = −0.303, P = 0.002), TUG (r = −0.253, P = 0.009), 6MWD (r = 0.388, P < 0.001), and systolic blood pressure (r = −0.326, P = 0.001). METsmax also showed significant correlations with multiple indicators including age (r = −0.305, P = 0.002), height (r = 0.229, P = 0.002), BMI (r = −0.272, P = 0.005), gender (r = −0.448, P < 0.001), LAD (r = −0.301, P = 0.002), NT-proBNP (r = −0.369, P < 0.001), hemoglobin (r = 0.314, P = 0.001), eGFR (r = 0.302, P = 0.002), FTSTS (r = −0.308, P = 0.001), TUG (r = −0.263, P = 0.007), 6MWD (r = 0.4, P < 0.001), and systolic blood pressure (r = −0.332, P = 0.001). Other indicators such as weight, LVEF, and lipid levels showed no significant correlation with VO2peak and METsmax.
Table 2
| Study variables | VO2peak | METsmax | ||
|---|---|---|---|---|
| Correlation coefficient | P value | Correlation coefficient | P value | |
| Age (year) | −0.296 | 0.002 | −0.305 | 0.002 |
| Height (m) | 0.301 | 0.002 | 0.299 | 0.002 |
| Weight (kg) | −0.004 | 0.968 | −0.008 | 0.935 |
| BMI (kg/m2) | −0.269 | 0.005 | −0.272 | 0.005 |
| Sex | −0.451 | <0.001 | −0.448 | <0.001 |
| LVEED (mm) | −0.113 | 0.249 | −0.102 | 0.299 |
| LAD (mm) | −0.306 | 0.002 | −0.301 | 0.002 |
| LVEF (%) | −0.096 | 0.330 | −0.096 | 0.332 |
| PAP (mmHg) | −0.185 | 0.060 | −0.180 | 0.067 |
| NT-proBNP (pg/ml) | −0.379 | <0.001 | −0.369 | <0.001 |
| HGB (g/L) | 0.316 | 0.001 | 0.314 | 0.001 |
| GLU (mmol/L) | −0.169 | 0.085 | −0.169 | 0.086 |
| Cr (umol/L) | 0.091 | 0.356 | 0.096 | 0.328 |
| TC (mmol/L) | 0.058 | 0.556 | 0.064 | 0.516 |
| TG (mmol/L) | 0.072 | 0.463 | 0.079 | 0.422 |
| HDL-C (mmol/L) | −0.127 | 0.198 | −0.123 | 0.211 |
| LDL-C (mmol/L) | 0.122 | 0.214 | 0.125 | 0.203 |
| eGFR (ml/min) | 0.309 | 0.001 | 0.302 | 0.002 |
| FTSTS (s) | −0.303 | 0.002 | −0.308 | 0.001 |
| TUG (s) | −0.253 | 0.009 | −0.263 | 0.007 |
| 6MWD (m) | 0.388 | <0.001 | 0.400 | <0.001 |
| SBP (mmHg) | −0.326 | 0.001 | −0.332 | 0.001 |
Correlations between the study variables and VO2peak and METsmax.
6MWD, 6-minute walk distance; BMI, body mass index; Cr, creatinine; eGFR, estimated glomerular filtration rate; FTSTS, five times sit-to-stand test; GLU, glucose; HDL-C, high-density lipoprotein cholesterol; HGB, hemoglobin; LAD, left atrial diameter; LDL-C, low-density lipoprotein cholesterol; LVEDD, left ventricular end-diastolic diameter; LVEF, left ventricular ejection fraction; NT-proBNP, N-terminal pro-B-type natriuretic peptide; PAP, pulmonary artery pressure; SBP, systolic blood pressure; TC, total cholesterol; TG, triglycerides; TUG, time up-and-go test.
3.3 VO2peak prediction equation
The final regression equation was: VO2peak (ml·kg−1·min−1) = 35.080 − (0.286 * BMI [kg/m2]) − (1.927 * Sex [male = 0; female = 1]) − (1.090 * ln NT-proBNP [pg/ml]) + (0.011 * 6MWD [m]) − (0.039 * SBP [mmHg]) − (0.512 * GLU [mmol/L]).
Standard error of estimate (SEE) = 2.236 ml·kg−1·min−1, R = 0.731, adjusted R2 = 0.506.
As shown in Tables 3, 4, all variables in the multiple linear regression model were significantly associated with VO2peak (P < 0.05), with variable influence ranked as: NT-proBNP > BMI > Sex > 6MWD > SBP > GLU.
Table 3
| Unstandardized coefficient | Standardized coefficient | t | P value | Tolerance | VIF | ||
|---|---|---|---|---|---|---|---|
| VO2peak model | (Constant) | 35.080 | 9.796 | <0.001 | |||
| lnNT-proBNP | −1.090 | −0.332 | −4.400 | <0.001 | 0.836 | 1.196 | |
| BMI (kg/m2) | −0.286 | −0.308 | −4.262 | <0.001 | 0.912 | 1.096 | |
| Sex | −1.927 | −0.296 | −3.888 | <0.001 | 0.822 | 1.217 | |
| 6MWD (m) | 0.011 | 0.213 | 2.778 | 0.007 | 0.807 | 1.239 | |
| SBP (mmHg) | −0.039 | −0.200 | −2.827 | 0.006 | 0.954 | 1.049 | |
| GLU (mmol/L) | −0.512 | −0.188 | −2.686 | 0.008 | 0.973 | 1.028 | |
| METsmax model | (Constant) | 9.646 | 8.380 | <0.001 | |||
| 6MWD (m) | 0.004 | 0.277 | 3.479 | 0.001 | 0.807 | 1.239 | |
| SBP (mmHg) | −0.016 | −0.274 | −3.747 | <0.001 | 0.954 | 1.049 | |
| BMI (kg/m2) | −0.078 | −0.269 | −3.596 | 0.001 | 0.912 | 1.096 | |
| lnNT-proBNP | −0.260 | −0.255 | −3.268 | 0.001 | 0.836 | 1.196 | |
| Sex | −0.447 | −0.221 | −2.805 | 0.006 | 0.821 | 1.217 | |
| GLU (mmol/L) | −0.140 | −0.166 | −2.291 | 0.024 | 0.973 | 1.028 |
Standardized and unstandardized coefficients from multiple linear regression analysis to predict VO2peak and METsmax in the derivation cohort.
6MWD, 6-minute walk distance; BMI, body mass index; GLU, glucose; lnNT-proBNP, natural log-transformed N-terminal pro-B-type natriuretic peptide; SBP, systolic blood pressure; VIF, variance inflation factor.
Table 4
| Model | R 2 | Adjusted R2 | SEE | F | P value | Durbin-watson |
|---|---|---|---|---|---|---|
| VO2peak model | 0.534 | 0.506 | 2.236 | 18.738 | <0.001 | 1.862 |
| METsmax model | 0.499 | 0.469 | 0.719 | 16.3 | <0.001 | 2.082 |
Summaries of multiple linear regression model for predict VO2peak and METsmax.
The tolerance of the VO2peak prediction model was between 0.807 and 0.973, and the VIF ranged from 1.028 to 1.239, confirming that the variables were independent of each other. The model demonstrated satisfactory goodness-of-fit, with adjusted R2 of 0.506, SEE of 2.236 ml·kg−1·min−1, and significant F-statistic (F = 18.738, P < 0.001). The histogram of residuals (Figure 1A) combined with the Kolmogorov–Smirnov test (P = 0.20) supported that the residuals were normally distributed. Scatterplot analysis (Figure 1B) revealed that residual dispersion remained relatively constant across the prediction range, which confirmed homogeneity of variance. The Durbin-Watson statistic (1.862) indicated that the residuals of this regression equation were independent of each other.
Figure 1
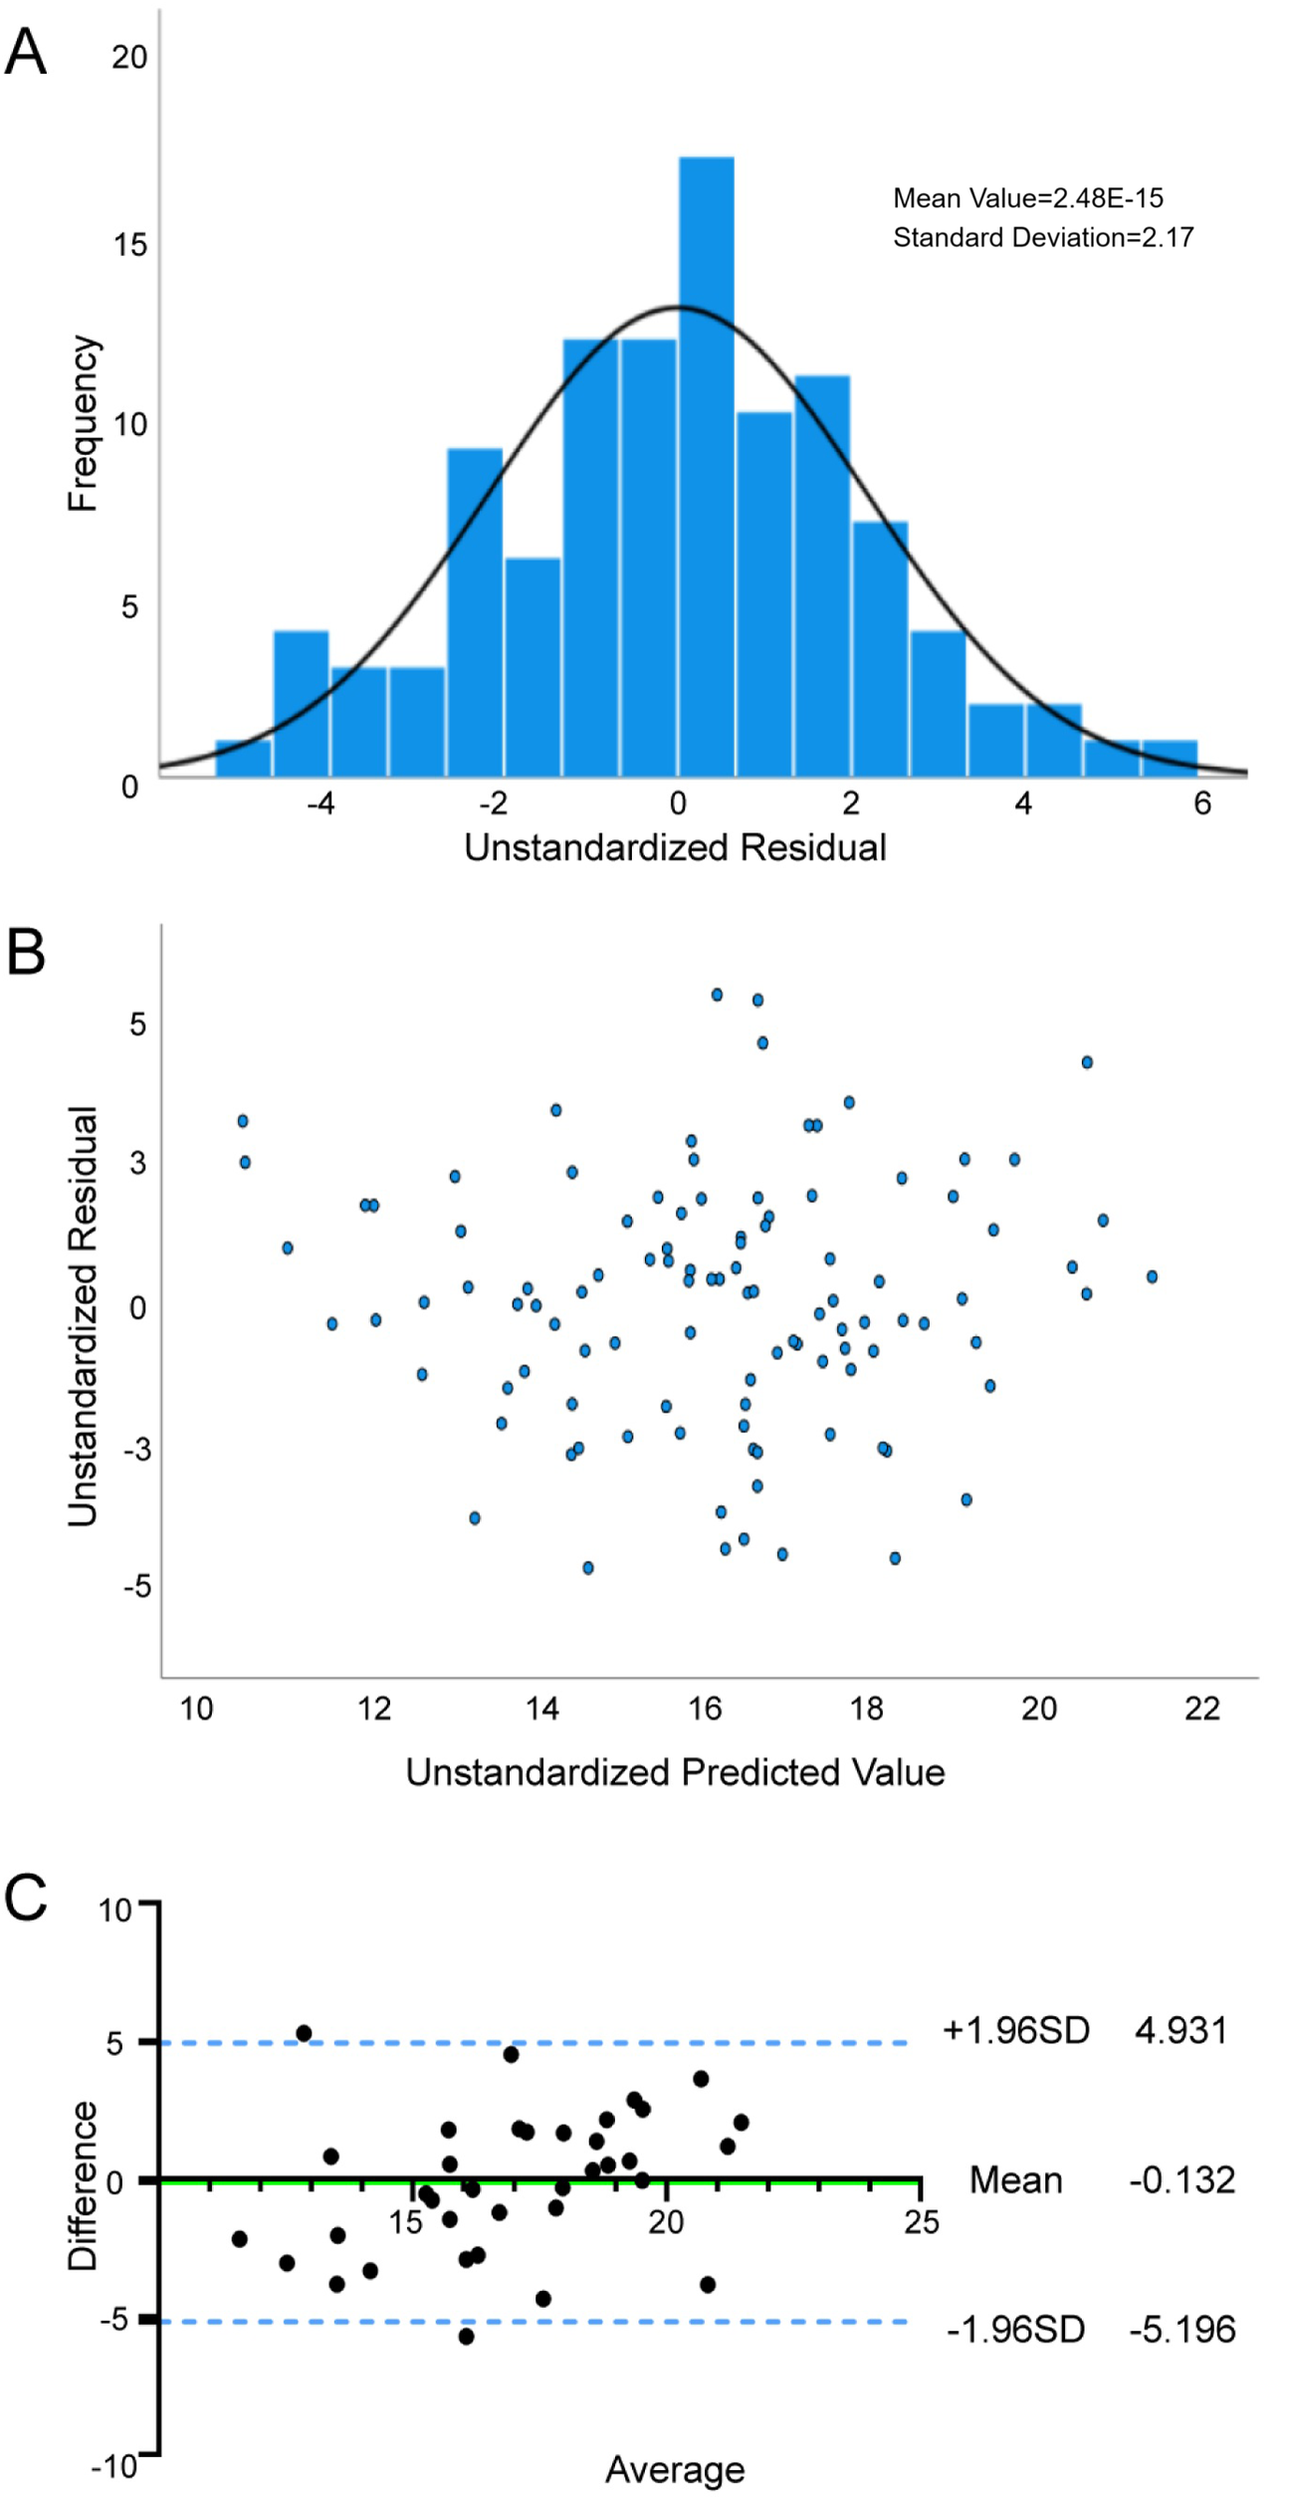
Reliability and validity tests of VO2peak prediction model. (A) Normality assessment of residuals in the VO2peak prediction model; (B) Residual plot and distribution for the VO2peak regression model; (C) Agreement between the measured VO2peak and estimated VO2peak by Bland—Altman difference plot.
Internal validation analyses (Table 5) demonstrated strong agreement between predicted and measured VO2peak. Pearson correlation analysis was significant (r = 0.616, P < 0.01), with no systematic bias detected via paired Student's t-test (P > 0.05). The Bland-Altman analysis (Figure 1C) showed a mean bias of −0.13 (95% LoA: −5.20 to 4.93) between the two values, indicating that the predicted value was slightly lower than the measured value, but the difference was within acceptable limits. These results initially validate the robustness of the VO2peak prediction model integrating NT-proBNP, BMI, Sex, 6MWD, SBP, and GLU.
Table 5
| Model | Mean ± SD | t | P value | Difference value (95%CI) | r |
|---|---|---|---|---|---|
| Measured VO2peak | 16.88 ± 3.22 | 0.31 | 0.76 | −0.13 (−1.01, −0.27) | 0.616 |
| Predicted VO2peak | 17.02 ± 3.22 | ||||
| Measured METsmax | 4.8 ± 0.96 | −0.00 | 1.00 | 0 (−0.27,0.27) | 0.581 |
| Predicted METsmax | 4.8 ± 0.76 |
Comparison of the measured value and predicted value using paired student's t-test and Pearson correlation analysis in the validation cohort.
3.4 METsmax prediction equation
The final regression equation was: METsmax (ml·kg−1·min−1) = 9.646 − (0.447 × Sex [male = 0; female = 1]) − (0.260 × ln NT-proBNP [pg/ml]) − (0.140 × GLU [mmol/L]) − (0.078 × BMI [kg/m2]) − (0.016 × SBP [mmHg]) + (0.004 × 6MWD [m]).
SEE = 0.719 ml·kg−1·min−1, R = 0.719, adjusted R2 = 0.469.
Table 1 shows that all the variables included in the regression model were significantly associated with METsmax (P < 0.05) with variable influence ranked as: 6MWD > SBP > BMI > NT-proBNP > Sex > GLU.
Tables 3, 4 show the results of the multiple linear regression and the reliability test of the METsmax prediction model, respectively. The METsmax prediction model demonstrated acceptable multicollinearity metrics (tolerance > 0.1, VIF < 5), confirming variable independence. The regression exhibited satisfactory goodness-of-fit, with adjusted R2 of 0.506, SEE of 2.236 ml·kg−1·min−1, and significant F-statistic (F = 16.3, P < 0.01). Residual diagnostics (Figures 2A,B) supported adherence to regression assumptions: normality was confirmed by Kolmogorov–Smirnov test (P = 0.2), homoscedasticity by the residual scatter-plot, and residual independence by the Durbin-Watson statistic (2.082).
Figure 2
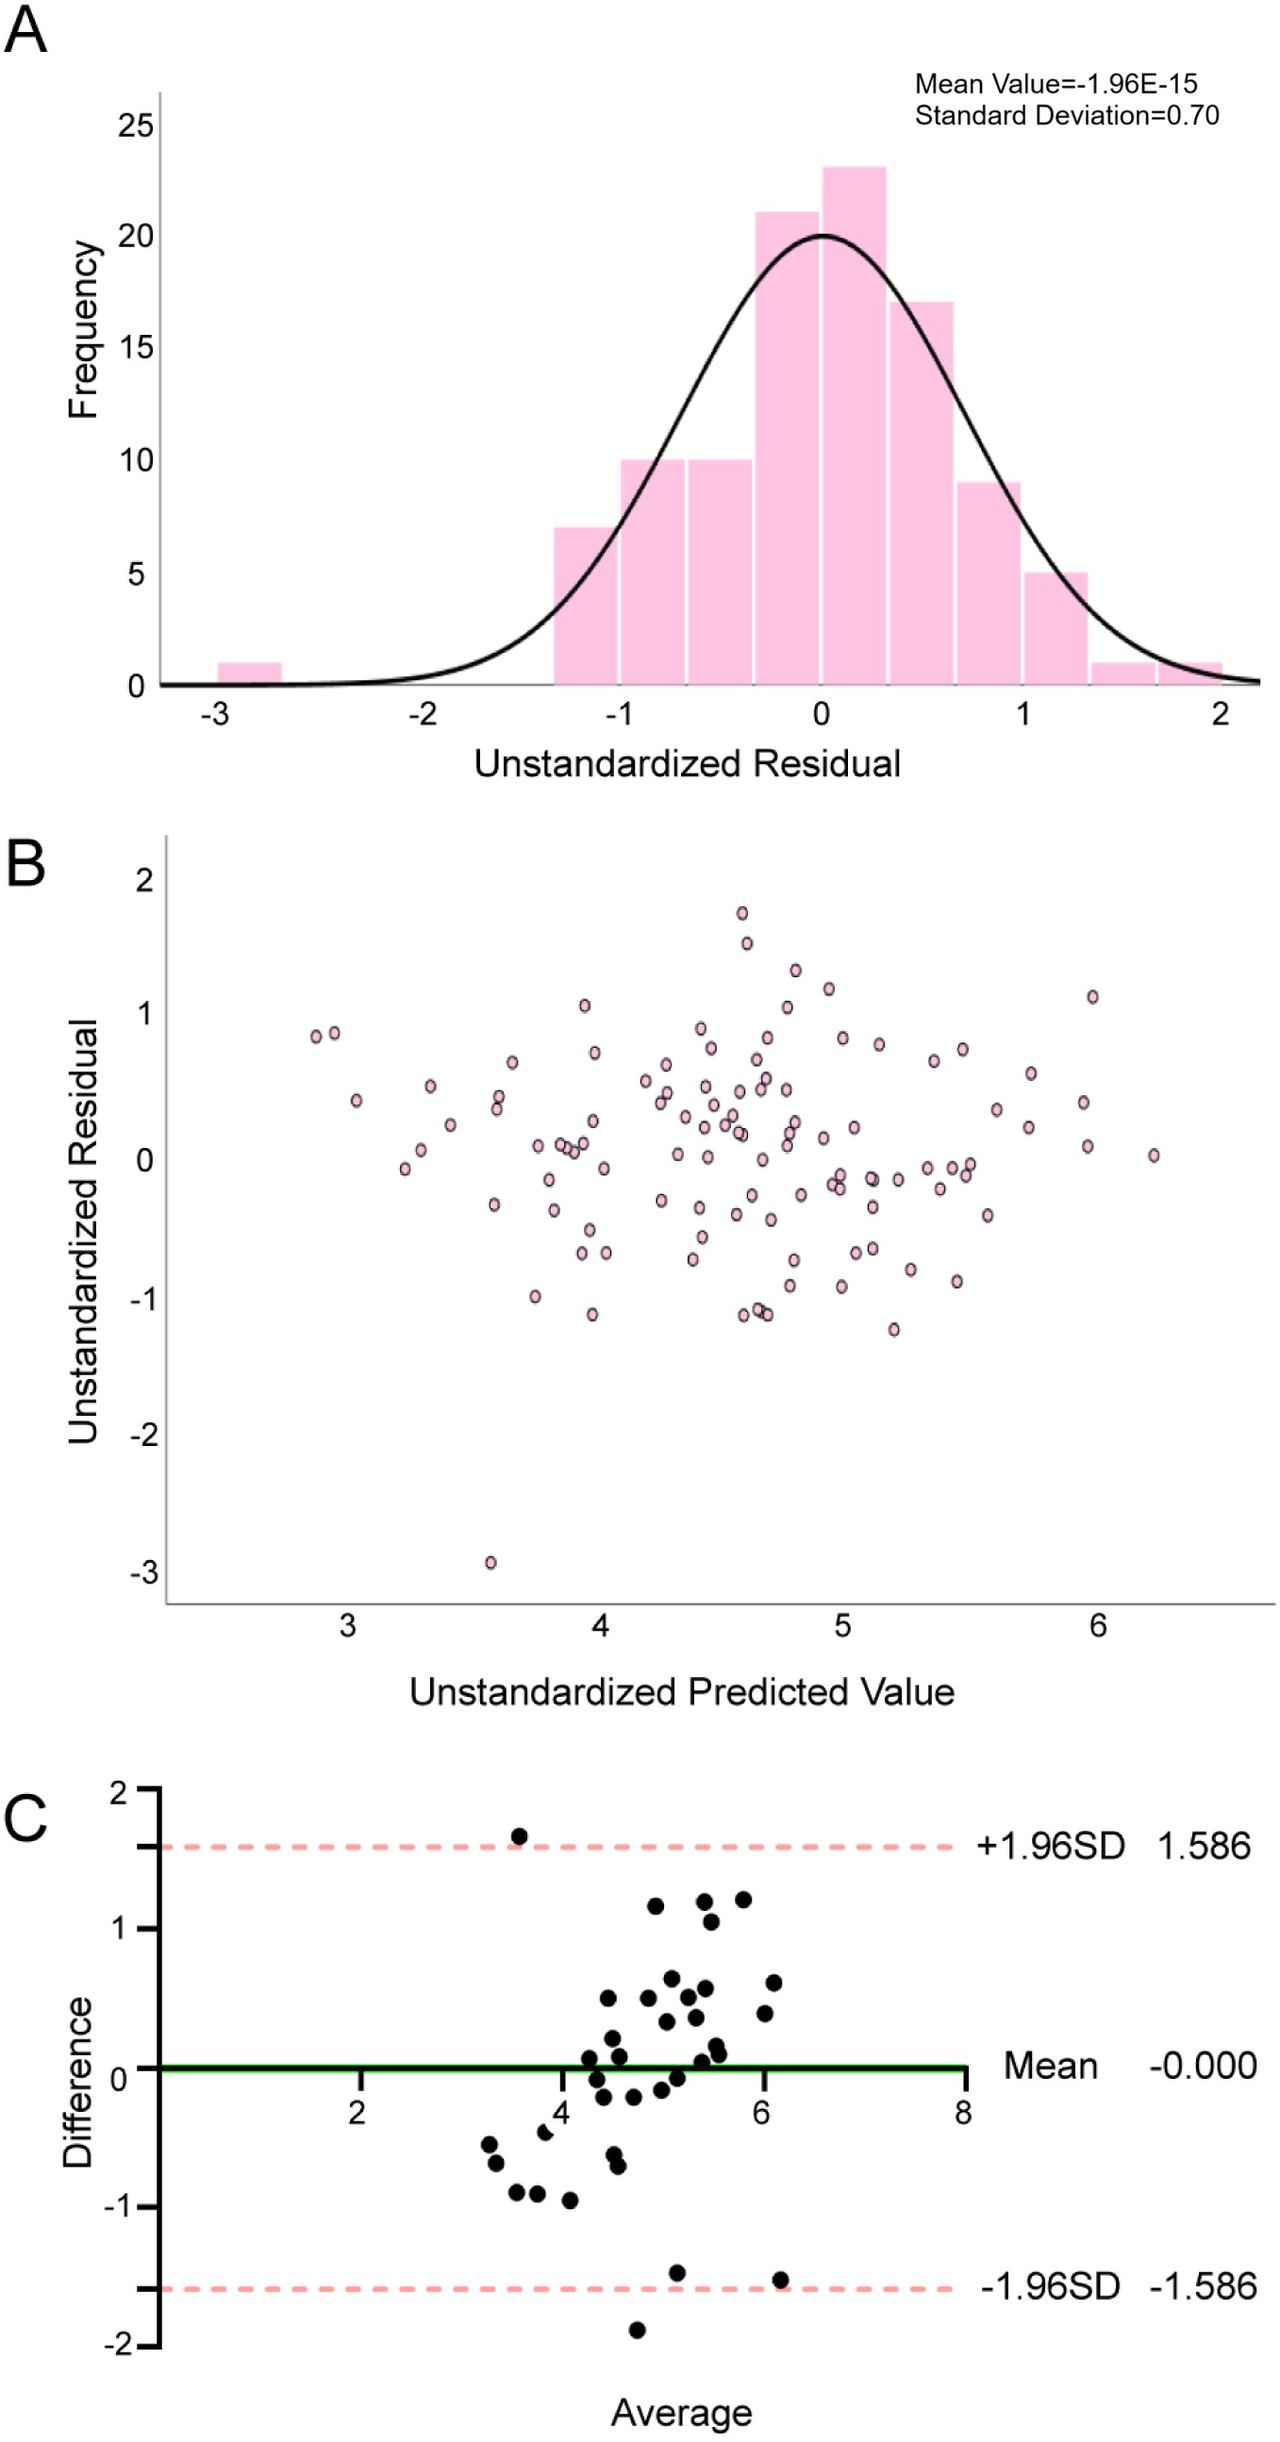
Reliability and validity tests of METsmax prediction model. (A) Normality assessment of residuals in the METsmax prediction model; (B) Residual plot and distribution for the METsmax regression model; (C) Agreement between the measured METsmax and estimated METsmax by Bland—Altman difference plot.
Internal validation analyses (Table 5) revealed strong concordance between predicted and measured METsmax. Pearson correlation analysis was significant (r = 0.581, P < 0.01), with no systematic bias detected via paired Student's t-test (P > 0.05). The Bland-Altman analysis (Figure 2C) demonstrated excellent agreement between predicted and measured values, with a negligible mean bias of −0.00 (95% LoA: −1.59 to 1.59), confirming high concordance between the two values. These results initially validate the robustness of the METsmax prediction model incorporating 6MWD, SBP, BMI, NT-proBNP, Sex, and GLU.
4 Discussion
This study demonstrated that Sex, BMI, 6MWD, SBP, NT-proBNP, and glucose are robust predictors of VO2peak and METsmax in a cohort of AF patients following RFCA. The novel predictive model demonstrated superior performance compared to Peterman's equation, it achieved a 53% reduction in the standard error of estimate (2.24 vs. 4.75) and demonstrated enhanced explanatory power (adjusted R2 = 0.506 vs. 0.43) (16). This improvement holds clinical relevance given the critical role of VO2peak and METsmax in quantifying CRF through oxygen utilization and metabolic equivalents (13).
The 6MWD represents a rapid, safe and cost-effective measure that is closely associated with an individual's CRF and is often used to assess the risk of mortality and rehospitalization in heart failure patients (17). Prior intervention studies have demonstrated that a six-week cardiac rehabilitation program can significantly enhance 6MWD and CRF metrics in patients with coronary artery disease, and this study found that 6MWD was closely associated with VO2peak and METsmax in AF patients after RFCA, suggesting similar rehabilitation potential in this population (18, 22). These findings are further supported by recent Cochrane reviews, which confirm that exercise interventions can enhance VO2peak, reduce AF recurrence, and alleviate AF-related symptoms (23, 24).
The results of the present study showed that male AF patients demonstrated significantly higher VO2peak and METsmax compared to females (17.19 ± 3.09 vs. 14.30 ± 2.45 ml·kg−1·min−1; 4.87 ± 1.02 vs. 4.09 ± 0.7 METs). This gender disparity aligns with previous reports and may be mediated by factors such as cardiac chamber dimensions, cardiac output, and hemoglobin concentrations (25–27).
Multivariable analysis revealed inverse associations of BMI and SBP with CRF, which is consistent with the findings from prior studies (14, 28–31). Excessive epicardial adipose tissue deposition may constrain ventricular diastolic compliance, thereby reducing stroke volume (32, 33). The coexistence of hypertension may further reduce cardiac output through the activation of the renin-angiotensin-aldosterone system and the sympathetic nervous system (34–36). These findings emphasis the potential cardiovascular benefits of systematic weight and blood pressure management in this patient population.
Notably, this study identified fasting glucose as a novel metabolic factor contributing to CRF impairment. Hyperglycemia may exacerbate myocardial fibrosis and left ventricular diastolic dysfunction by activating advanced glycation end products-receptor (AGEs-RAGE) through oxidative stress and inflammation (37–39). This hypothesis is supported by trials showing improvement in CRF with intensive glycemic control (28).
Of particular interest are our findings regarding NT-proBNP. Considering the non-normal distribution of NT-proBNP levels (Shapiro–Wilk P < 0.01), natural log-transformation (ln NT-proBNP) was performed before analysis. Multivariable stepwise regression, adjusted for other variables, revealed persistent inverse associations between ln NT-proBNP and CRF: VO2peak (β = −0.332, P < 0.01) and METsmax (β = −0.255, P < 0.01). The observed relationships likely reflect the biomarker's association with increased ventricular wall stress, myocardial fibrosis, and left ventricular diastolic dysfunction, collectively resulting to a reduction in cardiac output and oxygen delivery capacity during exercise (36, 40, 41). These results gain additional significance considering emerging evidence linking elevated NT-proBNP levels to adverse clinical outcomes and arrhythmia recurrence in heart failure population (42, 43). These findings suggest a dual role for NT-proBNP as both a biomarker of CRF impairment and a potential therapeutic target for functional recovery in AF patients after RFCA.
Finally, our analysis of age-related effects warrants discussion. While the univariate analysis in this study revealed a significant negative correlation between age and both VO2peak and METsmax, consistent with ATS/ACCP declaration data and previous large-scale cohort studies, confirming age as a crucial factor influencing cardiopulmonary function (44, 45). However, this relationship became nonsignificant after adjusting for sex, BMI, NT-proBNP, glucose, 6MWD, and SBP. This may be attributed to the relatively concentrated age distribution (92.4% aged 60–80 years) and limited sample size. Mediation analysis further revealed that the effect of age on CRF may be primarily mediated through 6MWD (r = −0.376, P < 0.001) and lnNTproBNP (r = 0.401, P < 0.001), which is also consistent with the relevant literature (46–49). We acknowledge the potential for collider bias in these analyses and emphasize that these findings represent statistical associations rather than causal inferences.
In summary, this prediction model holds significant clinical value with three key implications: First, the VO2peak and METsmax prediction equations incorporating six routinely available clinical parameters (sex, BMI, NT-proBNP, glucose, 6MWD, and SBP) enable rapid outpatient assessment of CRF in AF patients following RFCA, which will provide objective data to guide clinical decision-making. Second, the model can be integrated into electronic health record systems for automated calculations and dynamic monitoring of cardiopulmonary function changes (e.g., quarterly reassessment combining 6MWD and NT-proBNP), potentially enhancing long-term follow-up efficiency. Third, for regions with limited medical resources, this tool may serve as a practical alternative to complex CPX testing. To enhance clinical translation, future directions could include multicenter validation studies to systematically evaluate model performance across diverse clinical scenarios, thereby providing quantitative evidence for developing personalized cardiac rehabilitation protocols. Additionally, prospective cohort studies should be conducted to analyze dynamic changes between CRF and both quality of life and major adverse cardiovascular events (including AF recurrence and all-cause mortality) following RFCA.
5 Limitations
We acknowledge several important limitations in our study. First, as a single-center cross-sectional study with a relatively small sample size (n = 141), it limited generalizability to broader clinical populations. Second, while we employed stepwise regression—a widely used approach in exploratory clinical research—we recognize its potential limitations in variable selection. Third, external validation has not yet been performed, so the model's performance in heterogeneous populations remains to be verified. Fourth, while our use of conventional echocardiographic parameters (e.g., LAD) rather than more advanced measures like left atrial volume index (LAVi) or strain imaging enhances clinical accessibility, this pragmatic approach may come at the cost of reduced predictive precision. In the future, more multicenter studies are needed to incorporate more comprehensive assessments including advanced imaging parameters (e.g., LAVi, RV function), detailed medication histories, and lifestyle factors, while employing sophisticated statistical approaches to enhance the model's accuracy and clinical applicability across diverse patient populations.
6 Conclusion
This study establishes and internal validates the first clinically CRF prediction models specifically for AF patients after RFCA, utilizing easily available clinical indicators including sex, BMI, 6-minute walk distance, systolic blood pressure, NT-proBNP and glucose.
The models enable rapid outpatient CRF assessment to guide personalized rehabilitation planning and long-term monitoring, while also identifying modifiable risk factors (BMI, blood pressure, and glucose control) for targeted intervention to potentially reduce AF recurrence risk. More importantly, the prediction model will be a practical alternative to CPX testing in resource-limited settings.
Statements
Data availability statement
The original contributions presented in the study are included in the article/Supplementary Material, further inquiries can be directed to the corresponding authors.
Ethics statement
The studies involving humans were approved by the Medical Ethics Committee of Xinhua Hospital Affiliated to Shanghai Jiao Tong University School of Medicine. The studies were conducted in accordance with the local legislation and institutional requirements. The participants provided their written informed consent to participate in this study.
Author contributions
GZ: Conceptualization, Data curation, Formal analysis, Investigation, Methodology, Writing – original draft. JS: Conceptualization, Investigation, Methodology, Validation, Writing – original draft. QC: Conceptualization, Formal analysis, Investigation, Methodology, Writing – original draft. WX: Data curation, Formal analysis, Writing – original draft. MS: Data curation, Writing – original draft. DE-A: Validation, Writing – review & editing. RA: Validation, Writing – review & editing. JH: Conceptualization, Methodology, Validation, Writing – review & editing. SM: Conceptualization, Methodology, Supervision, Writing – review & editing. YL: Conceptualization, Methodology, Supervision, Writing – review & editing.
Funding
The author(s) declare that financial support was received for the research and/or publication of this article. This study was supported by Shanghai Shenkang Hospital Development Center (SHDC12025137).
Acknowledgments
The authors express their gratitude to all the volunteers who took part.
Conflict of interest
The authors declare that the research was conducted in the absence of any commercial or financial relationships that could be construed as a potential conflict of interest.
The author(s) declared that they were an editorial board member of Frontiers, at the time of submission. This had no impact on the peer review process and the final decision.
Generative AI statement
The author(s) declare that no Generative AI was used in the creation of this manuscript.
Any alternative text (alt text) provided alongside figures in this article has been generated by Frontiers with the support of artificial intelligence and reasonable efforts have been made to ensure accuracy, including review by the authors wherever possible. If you identify any issues, please contact us.
Publisher’s note
All claims expressed in this article are solely those of the authors and do not necessarily represent those of their affiliated organizations, or those of the publisher, the editors and the reviewers. Any product that may be evaluated in this article, or claim that may be made by its manufacturer, is not guaranteed or endorsed by the publisher.
Supplementary material
The Supplementary Material for this article can be found online at: https://www.frontiersin.org/articles/10.3389/fcvm.2025.1659905/full#supplementary-material
References
1.
Joglar JA Chung MK Armbruster AL Benjamin EJ Chyou JY Cronin EM et al 2023 ACC/AHA/ACCP/HRS guideline for the diagnosis and management of atrial fibrillation: a report of the American College of Cardiology/American Heart Association joint committee on clinical practice guidelines. Circulation. (2024) 149:e1–156. 10.1161/CIR.0000000000001193
2.
Lippi G Sanchis-Gomar F Cervellin G . Global epidemiology of atrial fibrillation: an increasing epidemic and public health challenge. Int J Stroke. (2021) 16:217–21. 10.1177/1747493019897870
3.
Calkins H Hindricks G Cappato R Kim YH Saad EB Aguinaga L et al 2017 HRS/EHRA/ECAS/APHRS/SOLAECE expert consensus statement on catheter and surgical ablation of atrial fibrillation. Heart Rhythm. (2017) 14:e275–444. 10.1016/j.hrthm.2017.05.012
4.
Erhard N Metzner A Fink T . Late arrhythmia recurrence after atrial fibrillation ablation: incidence, mechanisms and clinical implications. Herzschrittmacherther Elektrophysiol. (2022) 33:71–6. 10.1007/s00399-021-00836-6
5.
Ko D Chung MK Evans PT Benjamin EJ Helm RH . Atrial fibrillation: a review. JAMA. (2025) 333:329–42. 10.1001/jama.2024.22451
6.
Ross R Blair SN Arena R Church TS Després JP Franklin BA et al Importance of assessing cardiorespiratory fitness in clinical practice: a case for fitness as a clinical vital sign: a scientific statement from the American Heart Association. Circulation. (2016) 134:e653–99. 10.1161/CIR.0000000000000461
7.
Mujović NM Marinković MM Nedeljković I Marković N Banović M Vučićević V et al Improvement of maximal exercise performance after catheter-ablation of atrial fibrillation and its prognostic significance for long-term rhythm outcome. J Am Heart Assoc. (2021) 10:e017445. 10.1161/JAHA.120.017445
8.
Donnellan E Wazni OM Harb S Kanj M Saliba WI Jaber WA . Higher baseline cardiorespiratory fitness is associated with lower arrhythmia recurrence and death after atrial fibrillation ablation. Heart Rhythm. (2020) 17:1687–93. 10.1016/j.hrthm.2020.05.013
9.
Pathak RK Elliott A Middeldorp ME Meredith M Mehta AB Mahajan R et al Impact of CARDIOrespiratory FITness on arrhythmia recurrence in obese individuals with atrial fibrillation: the CARDIO-FIT study. J Am Coll Cardiol. (2015) 66:985–96. 10.1016/j.jacc.2015.06.488
10.
Guo Y Ng N Hassler S Wu F Miao Jonasson J . Frailty trajectories in Chinese older adults: evidence from the China health and retirement longitudinal study. Innov Aging. (2023) 8:igad131. 10.1093/geroni/igad131
11.
Wilkinson C Todd O Clegg A Gale CP Hall M . Management of atrial fibrillation for older people with frailty: a systematic review and meta-analysis. Age Ageing. (2019) 48:196–203. 10.1093/ageing/afy180
12.
Ding Y Pan Y Wang M Cao L Xu H Wei L et al Factors influencing kinesiophobia during the “blanking period” after radiofrequency catheter ablation in patients with atrial fibrillation by the fear-avoidance model. Int J Cardiol. (2022) 363:49–55. 10.1016/j.ijcard.2022.06.021
13.
Balady GJ Arena R Sietsema K Myers J Coke L Fletcher GF et al Clinician’s guide to cardiopulmonary exercise testing in adults: a scientific statement from the American Heart Association. Circulation. (2010) 122:191–225. 10.1161/CIR.0b013e3181e52e69
14.
Šagát P Kalčik Z Bartik P Šiška Ľ Štefan L . A simple equation to estimate maximal oxygen uptake in older adults using the 6 min walk test, sex, age and body mass index. J Clin Med. (2023) 12:4476. 10.3390/jcm12134476
15.
Deka P Pozehl BJ Pathak D Williams M Norman JF Alonso WW et al Predicting maximal oxygen uptake from the 6 min walk test in patients with heart failure. ESC Heart Failure. (2021) 8:47–54. 10.1002/ehf2.13167
16.
Peterman JE Arena R Myers J Ades PA Bonikowske AR Harber MP et al A nonexercise prediction of peak oxygen uptake for patients with cardiovascular disease: DATA FROM THE FITNESS REGISTRY AND THE IMPORTANCE OF EXERCISE INTERNATIONAL DATABASE (FRIEND). J Cardiopulm Rehabil Prev. (2023) 43:115. 10.1097/HCR.0000000000000722
17.
Giannitsi S Bougiakli M Bechlioulis A Kotsia A Michalis LK Naka KK . 6-minute Walking test: a useful tool in the management of heart failure patients. Ther Adv Cardiovasc Dis. (2019) 13:1753944719870084. 10.1177/1753944719870084
18.
Wang Z Li J Jiao K Yan J Zhang T Yu W et al Effects of 6-week online supervised exercise intervention on patients with different types of coronary heart disease. Acad J Naval Med Univ. (2022) 43:1135–42. 10.16781/j.CN31-2187/R.20211126
19.
Podsiadlo D Richardson S . The timed “up & go”: a test of basic functional mobility for frail elderly persons. J Am Geriatr Soc. (1991) 39:142–8. 10.1111/j.1532-5415.1991.tb01616.x
20.
Wang Z Yan J Meng S Li J Yu Y Zhang T et al Reliability and validity of sit-to-stand test protocols in patients with coronary artery disease. Front Cardiovasc Med. (2022) 9:841453. 10.3389/fcvm.2022.841453
21.
ATS Committee on Proficiency Standards for Clinical Pulmonary Function Laboratories. ATS Statement: guidelines for the six-minute walk test. Am J Respir Crit Care Med. (2002) 166:111–7. 10.1164/ajrccm.166.1.at1102
22.
Li J Liu B Wang Z El-Ansary D Adams R Han J et al Efficacy of a 6-week home-based online supervised exercise program conducted during COVID-19 in patients with post percutaneous coronary intervention: a single-blind randomized controlled trial. Front Cardiovasc Med. (2022) 9:853376. 10.3389/fcvm.2022.853376
23.
Buckley BJ Long L Risom SS Lane DA Berg SK Gluud C et al Exercise-based cardiac rehabilitation for adults with atrial fibrillation. Cochrane Database Syst Rev. (2024) 9:CD011197. 10.1002/14651858.CD011197.pub3
24.
Buckley BJ Long L Lane DA Risom S Fitzhugh CJ Berg SK et al Exercise based cardiac rehabilitation for atrial fibrillation: Cochrane systematic review, meta-analysis, meta-regression and trial sequential analysis. Br J Sports Med. (2025) (in press). 10.1136/bjsports-2024-109149
25.
Farinatti PT Soares PP . Cardiac output and oxygen uptake relationship during physical effort in men and women over 60 years old. Eur J Appl Physiol. (2009) 107:625–31. 10.1007/s00421-009-1162-y
26.
Fuchs A Mejdahl MR Kühl JT Stisen ZR Nilsson EJP Køber LV et al Normal values of left ventricular mass and cardiac chamber volumes assessed by 320-detector computed tomography angiography in the Copenhagen general population study. Eur Heart J Cardiovasc Imaging. (2016) 17:1009–17. 10.1093/ehjci/jev337
27.
Diaz-Canestro C Pentz B Sehgal A Montero D . Differences in cardiac output and aerobic capacity between sexes are explained by blood volume and oxygen carrying capacity. Front Physiol. (2022) 13:747903. 10.3389/fphys.2022.747903
28.
AL-Mhanna SB Batrakoulis A Ghazali WSW Mohamed M Aldayel A Alhussain MH et al Effects of combined aerobic and resistance training on glycemic control, blood pressure, inflammation, cardiorespiratory fitness and quality of life in patients with type 2 diabetes and overweight/obesity: a systematic review and meta-analysis. PeerJ. (2024) 12:e17525. 10.7717/peerj.17525
29.
Lopes S Mesquita-Bastos J Garcia C Bertoquini S Ribau V Teixeira M et al Effect of exercise training on ambulatory blood pressure among patients with resistant hypertension: a randomized clinical trial. JAMA Cardiology. (2021) 6:1317–23. 10.1001/jamacardio.2021.2735
30.
Schröder H Subirana I Elosua R Camps-Vilaró A Tizón-Marcos H Fitó M et al Measuring cardiorespiratory fitness without exercise testing: the development and validation of a new tool for Spanish adults. J Clin Med. (2024) 13:2210. 10.3390/jcm13082210
31.
Simoes MdS Wehrmeister FC Romiti M Gagliardi AdT Arantes RL Dourado VZ . Effect modification of cardiorespiratory fitness, obesity, and physical activity in adults. Int J Sports Med. (2022) 43:561–6. 10.1055/a-1562-6014
32.
Fu Z Wang Y Wang Y Shi S Li Y Zhang B et al Linking abnormal fat distribution with HFpEF and diastolic dysfunction: a systematic review, meta-analysis, and meta-regression of observational studies. Lipids Health Dis. (2024) 23:277. 10.1186/s12944-024-02266-y
33.
Cho IJ Lee SE Pyun WB . Association of body adiposity with left ventricular concentric remodeling and diastolic dysfunction. Echocardiography. (2024) 41:e15872. 10.1111/echo.15872
34.
Varvarousis D Kallistratos M Poulimenos L Triantafyllis A Tsinivizov P Giannakopoulos A et al Cardiac arrhythmias in arterial hypertension. J Clin Hypertens (Greenwich). (2020) 22:1371–8. 10.1111/jch.13989
35.
Improta-Caria AC Aras MG Nascimento L De Sousa RAL Aras-Júnior R Souza BdF . MicroRNAs regulating renin–angiotensin–aldosterone system, sympathetic nervous system and left ventricular hypertrophy in systemic arterial hypertension. Biomolecules. (2021) 11:1771. 10.3390/biom11121771
36.
Mouzarou A Hadjigeorgiou N Melanarkiti D Plakomyti TE . The role of NT-proBNP levels in the diagnosis of hypertensive heart disease. Diagnostics (Basel). (2025) 15:113. 10.3390/diagnostics15010113
37.
de la Cruz-Ares S Cardelo MP Gutiérrez-Mariscal FM Torres-Peña JD García-Rios A Katsiki N et al Endothelial dysfunction and advanced glycation end products in patients with newly diagnosed versus established diabetes: from the CORDIOPREV study. Nutrients. (2020) 12:238. 10.3390/nu12010238
38.
Liu X Gao Y Guo YK Xia CC Shi R Jiang L et al Cardiac magnetic resonance T1 mapping for evaluating myocardial fibrosis in patients with type 2 diabetes mellitus: correlation with left ventricular longitudinal diastolic dysfunction. Eur Radiol. (2022) 32:7647–56. 10.1007/s00330-022-08800-9
39.
Wang M Li Y Li S Lv J . Endothelial dysfunction and diabetic cardiomyopathy. Front Endocrinol (Lausanne). (2022) 13:851941. 10.3389/fendo.2022.851941
40.
Fudim M Kelly JP Jones AD AbouEzzeddine OF Ambrosy AP Greene SJ et al Are existing and emerging biomarkers associated with cardiorespiratory fitness in patients with chronic heart failure? Am Heart J. (2020) 220:97–107. 10.1016/j.ahj.2019.11.006
41.
Kerr B Brandon L . Atrial fibrillation, thromboembolic risk, and the potential role of the natriuretic peptides, a focus on BNP and NT-proBNP—a narrative review. Int J Cardiol Heart Vasc. (2022) 43:101132. 10.1016/j.ijcha.2022.101132
42.
Oeun B Nakatani D Hikoso S Kojima T Dohi T Kitamura T et al Factors associated with elevated N-terminal pro B-type natriuretic peptide concentrations at the convalescent stage and 1-year outcomes in patients with heart failure with preserved ejection fraction. Circ Rep. (2020) 2:400–8. 10.1253/circrep.CR-20-0051
43.
Mueller C McDonald K de Boer RA Maisel A Cleland JGF Kozhuharov N et al Heart failure association of the European society of cardiology practical guidance on the use of natriuretic peptide concentrations. Eur J Heart Fail. (2019) 21:715–31. 10.1002/ejhf.1494
44.
Kaminsky LA Arena R Myers J Peterman JE Bonikowske AR Harber MP et al Updated reference standards for cardiorespiratory fitness measured with cardiopulmonary exercise testing: data from the fitness registry and the importance of exercise national database (FRIEND). Mayo Clin Proc. (2022) 97:285–93. 10.1016/j.mayocp.2021.08.020
45.
American Thoracic Society, American College of Chest Physicians. ATS/ACCP statement on cardiopulmonary exercise testing. Am J Respir Crit Care Med. (2003) 167:211–77. 10.1164/rccm.167.2.211
46.
Bumrungkittikul J Thirapatarapong W . Independent predictors and equation of six-minute walk test in post-cardiac surgery. Heart Lung. (2023) 58:134–8. 10.1016/j.hrtlng.2022.12.002
47.
Ferreira MB Saraiva FA Fonseca T Costa R Marinho A Oliveira JC et al Clinical associations and prognostic implications of 6-minute walk test in rheumatoid arthritis. Sci Rep. (2022) 12:18672. 10.1038/s41598-022-21547-z
48.
Richards AM . The relationship of plasma NT-proBNP to age and outcomes in heart failure. JACC Heart Fail. (2016) 4:746–8. 10.1016/j.jchf.2016.06.006
49.
Mojón-Álvarez D Giralt T Carreras-Mora J Calvo-Fernández A Izquierdo A Soler C et al Baseline NT-proBNP levels as a predictor of short-and long-term prognosis in COVID-19 patients: a prospective observational study. BMC Infect Dis. (2024) 24:58. 10.1186/s12879-024-08980-3
Summary
Keywords
atrial fibrillation, exercise test, oxygen uptake, metabolic, equivalents, regression analysis
Citation
Zhao G, Sun J, Che Q, Xu W, Song M, El-Ansary D, Adams R, Han J, Meng S and Li Y (2025) Development and validation of clinical prediction models for cardiorespiratory fitness in atrial fibrillation patients following radiofrequency catheter ablation. Front. Cardiovasc. Med. 12:1659905. doi: 10.3389/fcvm.2025.1659905
Received
04 July 2025
Accepted
15 August 2025
Published
29 August 2025
Volume
12 - 2025
Edited by
Siew Li Goh, Universiti Malaya, Malaysia
Reviewed by
Benjamin Buckley, Liverpool John Moores University, United Kingdom
Smayk Barbosa Sousa, Universidade do Estado do Pará, Brazil
Ranel Loutati, Heart Institute, Hadassah Medical Center, Israel
Qian Luo, Sichuan University, China
Jinguo Xu, Anhui Medical University, China
Updates
Copyright
© 2025 Zhao, Sun, Che, Xu, Song, El-Ansary, Adams, Han, Meng and Li.
This is an open-access article distributed under the terms of the Creative Commons Attribution License (CC BY). The use, distribution or reproduction in other forums is permitted, provided the original author(s) and the copyright owner(s) are credited and that the original publication in this journal is cited, in accordance with accepted academic practice. No use, distribution or reproduction is permitted which does not comply with these terms.
* Correspondence: Shu Meng msdoctor@126.com Yigang Li liyigang@xinhuamed.com.cn
†These authors have contributed equally to this work and share first authorship
Disclaimer
All claims expressed in this article are solely those of the authors and do not necessarily represent those of their affiliated organizations, or those of the publisher, the editors and the reviewers. Any product that may be evaluated in this article or claim that may be made by its manufacturer is not guaranteed or endorsed by the publisher.