There was an error in Figure 1C and Figure 8A as published. Due to our mistake in combining images, GAPDH band in Figures 1C, and images for NRCMs staining in Figure 8A were misused. The corrected Figure 1C and Figure 8A appear below.
Figure 1
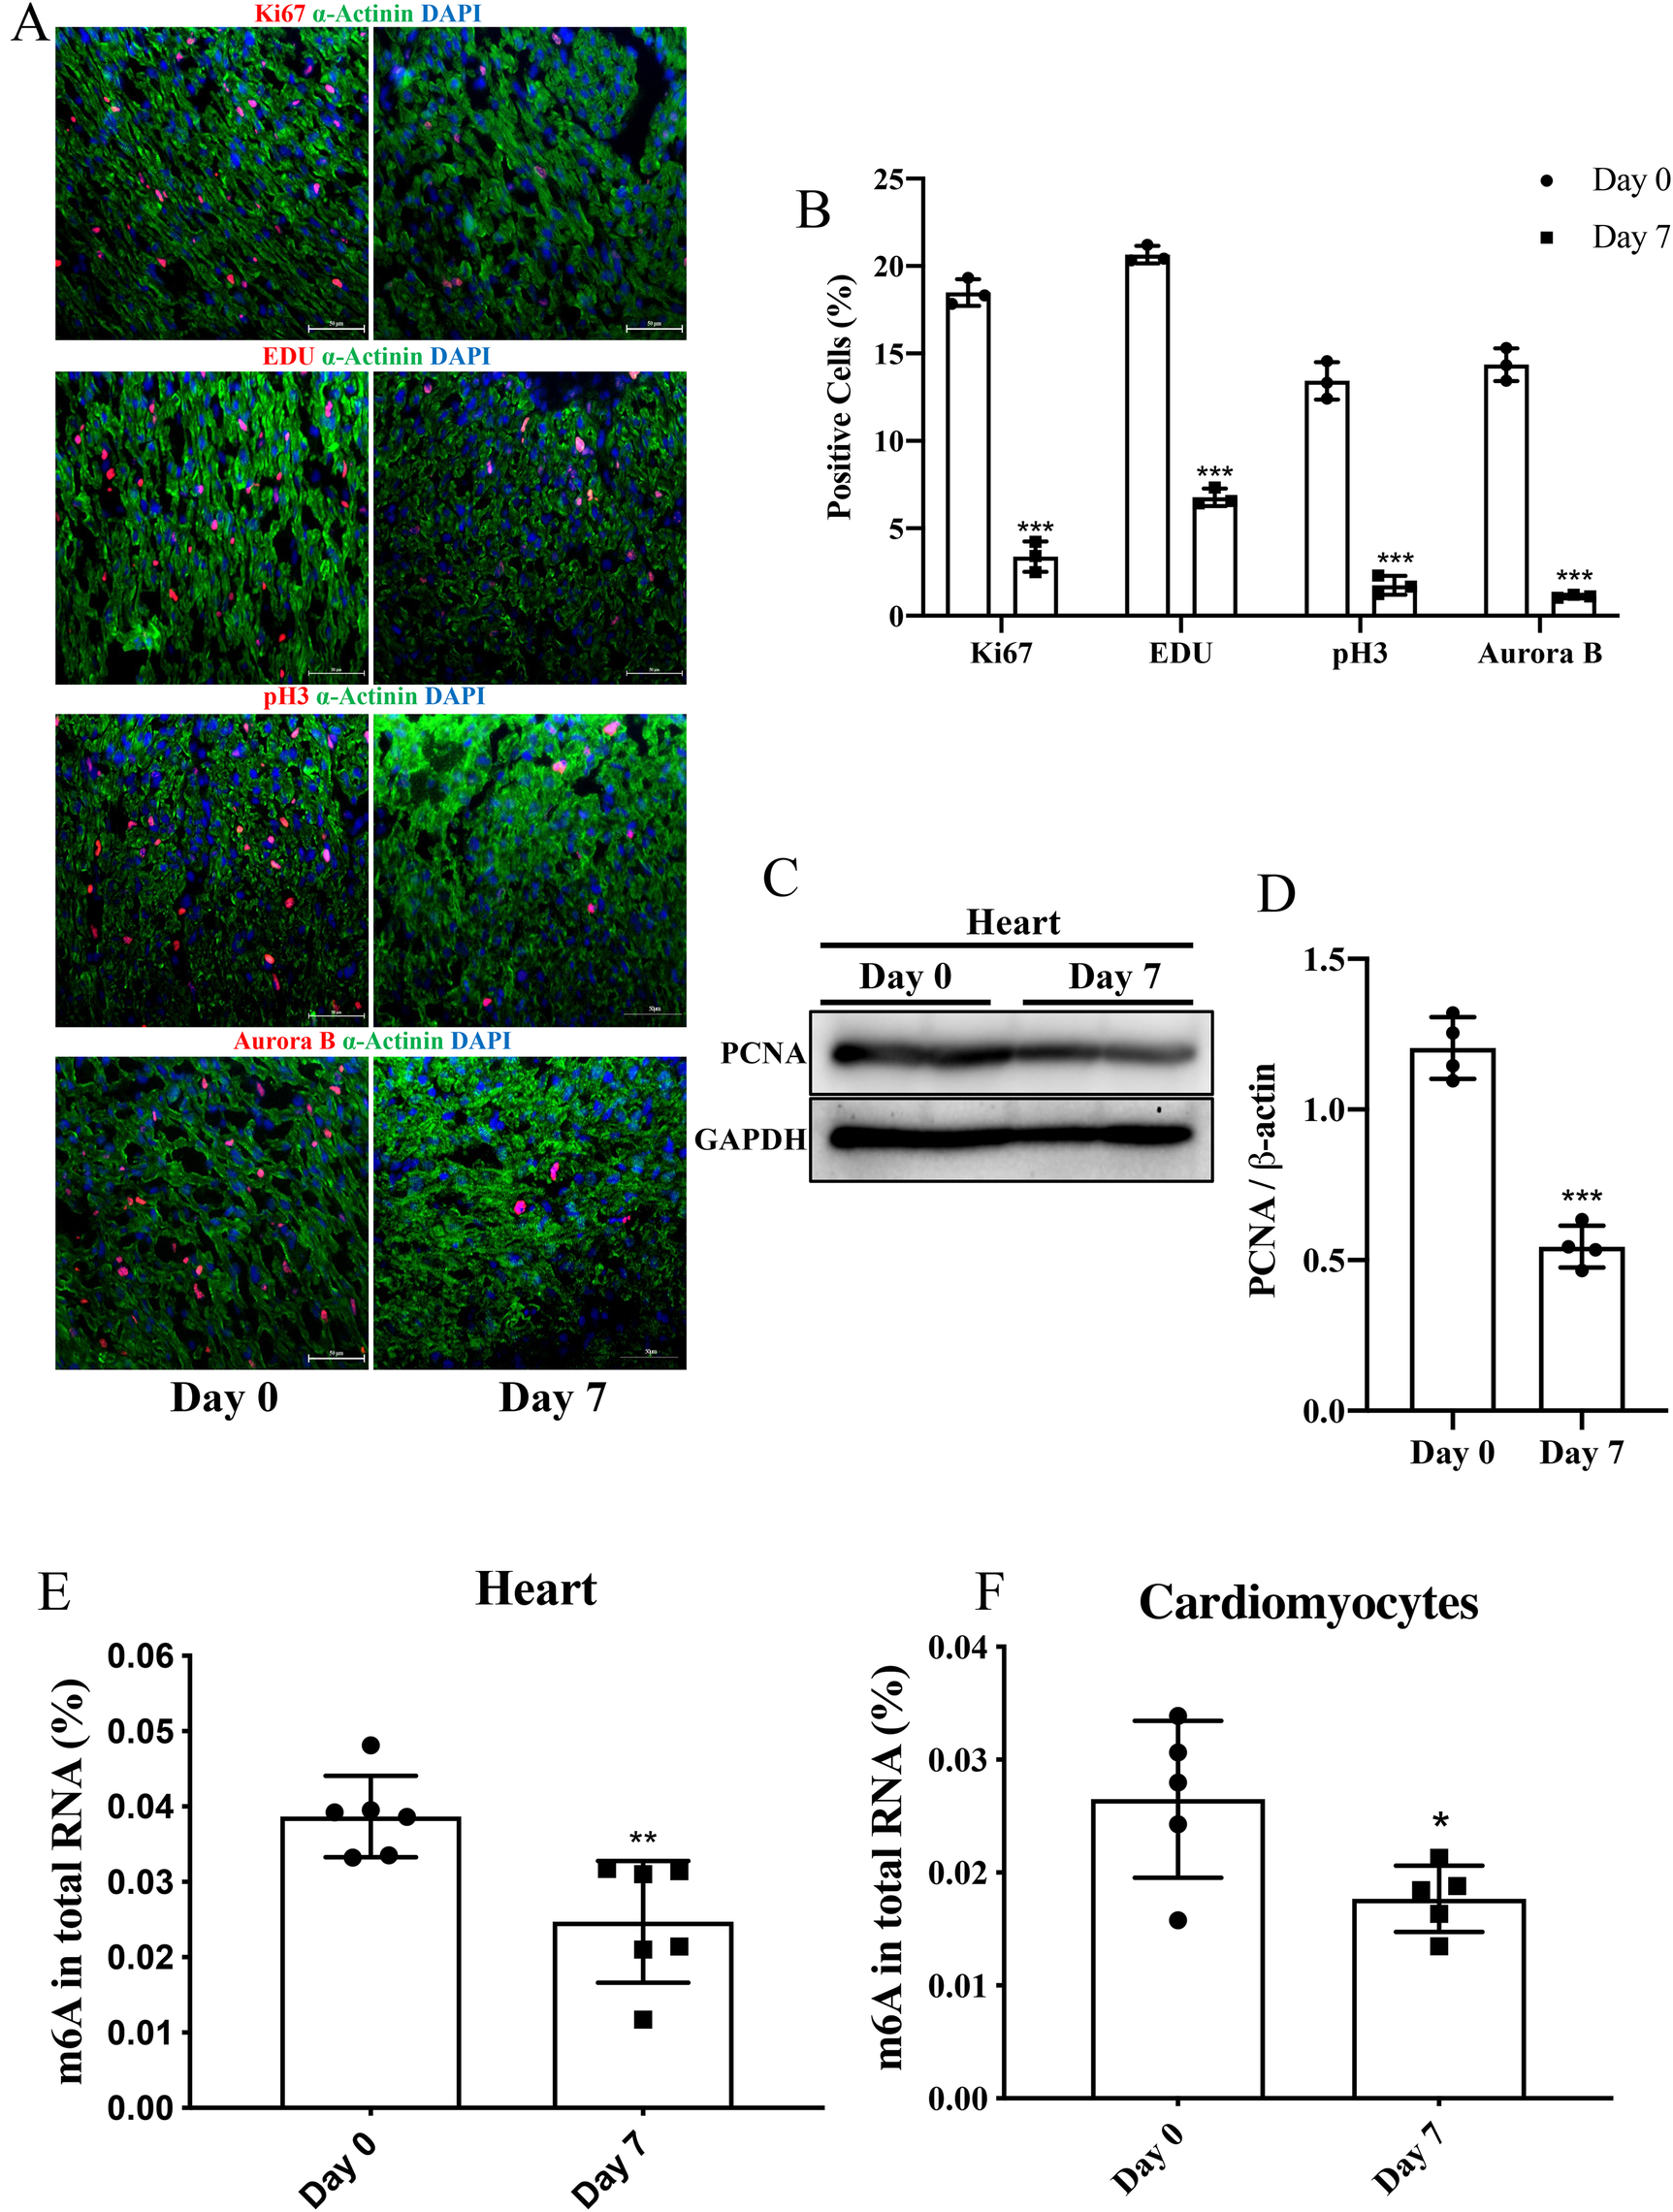
The level of m6A in P7 rat heart was decreased compared to P0. (A,B) Representative immunofluorescence images of paraffin-embedded heart sections labeled with α-Actinin, Ki67, pH3, Aurora B, and EDU at 200 × magnification (α-Actinin, green; Ki67, pH3, Aurora B, and EDU, red; DAPI, blue. Scale bars, 200 µm). (C,D) Protein expression levels of PCNA as determined by Western blotting (C) in heart tissue from P0 and P7 rats and the corresponding densitometric analyses (D) GAPDH was detected as the loading control. (E,F) Quantification of m6A in total RNA in heart tissue (E) and NRCMs (F) from P0 and P7 rats. N 3 per group. The results are expressed as means ± SEMs (NS indicates not significant, *P 0.05, **P 0.01, ***P 0.001, compared to the control group).
Figure 8
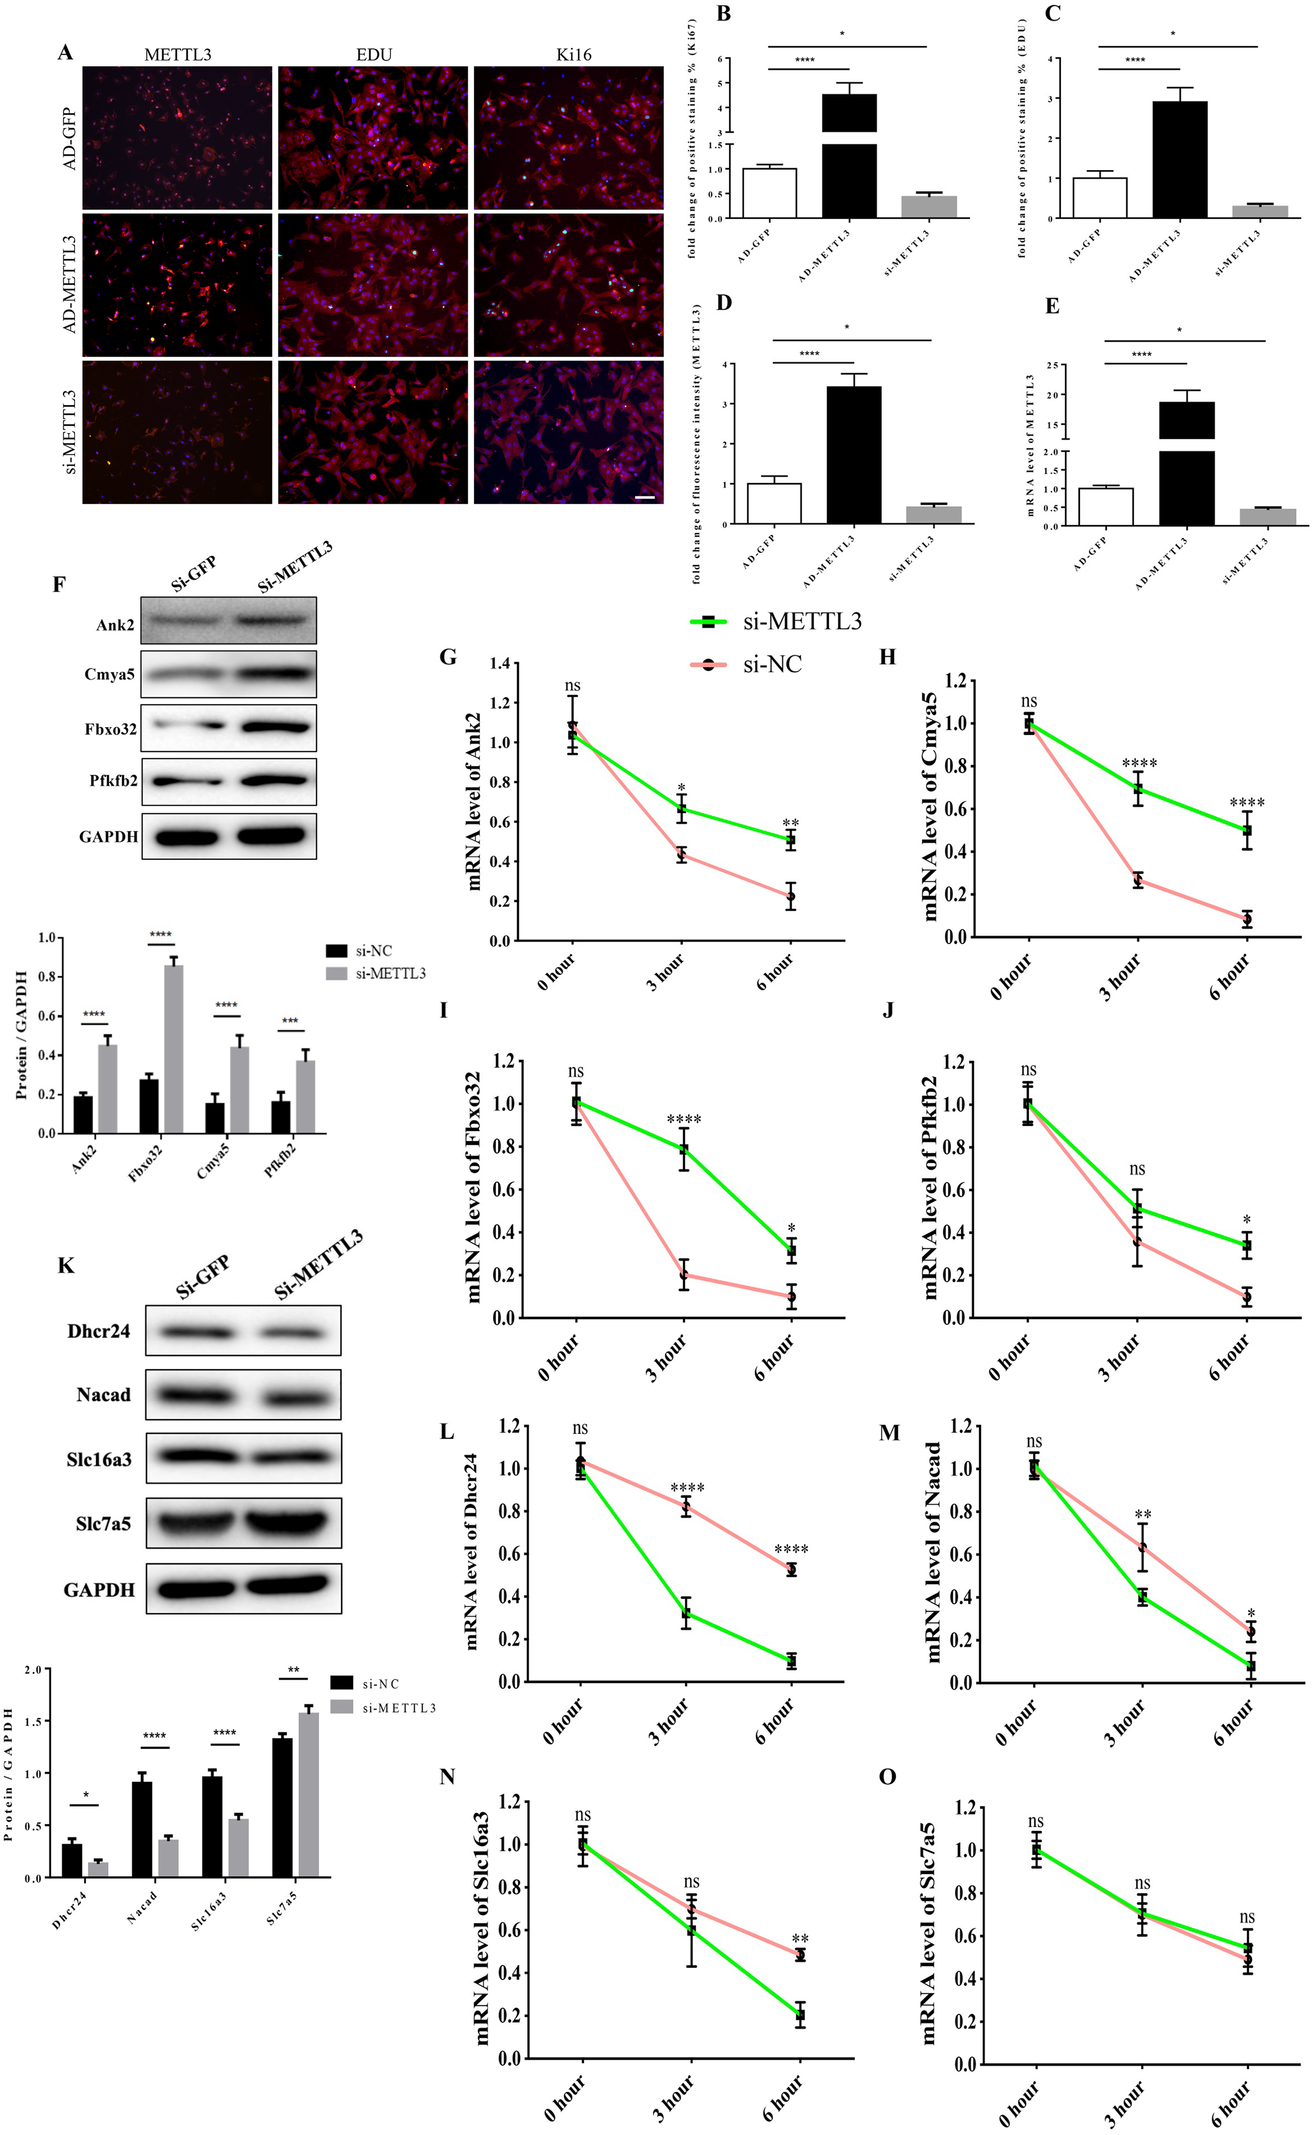
The functional link of enhanced METTL3 expression to transcript stability of target genes. (A–D) Representative immunofluorescence images of NRCMs from P0 rat hearts labeled with METTL3, EDU, and Ki67 (METTL3, or α-actinin, red; EDU, or Ki67, green; DAPI, blue. Scale bars, 50 µm) (A) and their corresponding quantitative analysis (B–D). (E) mRNA expression level of METTL3 of NRCMs from P0 rat hearts transfected with AD-GFP, AD-METTL3, or si-METTL3 determined by the qPCR method. (F) Protein expression levels of Pfkfb2, Ank2, Cmya5, and Fbxo32 in P0 NRCMs transfected with si-NC or si-METTL3 (up) and the corresponding densitometric analysis (down). (G–J) mRNA expression level of Ank2 (G), Cmya5 (H), Fbxo32 (I), and Pfkfb2 (J) in P0 NRCMs transfected with si-NC or si-METTL3 after treated with 20 µg/ml Actinomycin D for 0, 3 or 6 h. (K) Protein expression levels of Dhcr24, Nacad, Slc16a3, and Slc7a5 in P0 NRCMs transfected with si-NC or si-METTL3 (up) and the corresponding densitometric analysis (down). (L–O) mRNA expression level of Dhcr24 (L), Nacad (M), Slc16a3 (N), and Slc7a5 (O) in P0 NRCMs transfected with si-NC or si-METTL3 after treated with 20 µg/ml Actinomycin D for 0, 3 or 6 h. GAPDH was detected as the loading control. *P 0.05, **P 0.01, ****P 0.001, *****P 0.0001, compared to the si-NC group.
File Supplementary Image 1 was erroneously published with the original version of this paper. The file has now been replaced.
The original article has been updated.
Statements
Generative AI statement
Any alternative text (alt text) provided alongside figures in this article has been generated by Frontiers with the support of artificial intelligence and reasonable efforts have been made to ensure accuracy, including review by the authors wherever possible. If you identify any issues, please contact us.
Publisher’s note
All claims expressed in this article are solely those of the authors and do not necessarily represent those of their affiliated organizations, or those of the publisher, the editors and the reviewers. Any product that may be evaluated in this article, or claim that may be made by its manufacturer, is not guaranteed or endorsed by the publisher.
Summary
Keywords
m6A, epitranscriptome, heart regeneration, METTL3, cardiomyocyte
Citation
Yang C, Zhao K, Zhang J, Wu X, Sun W, Kong X and Shi J (2025) Correction: Comprehensive analysis of the transcriptome-wide m6A methylome of heart via MeRIP after birth: day 0 vs. day 7. Front. Cardiovasc. Med. 12:1662054. doi: 10.3389/fcvm.2025.1662054
Received
08 July 2025
Accepted
11 August 2025
Published
29 August 2025
Volume
12 - 2025
Edited and reviewed by
Neil Morgan, University of Birmingham, United Kingdom
Updates
Copyright
© 2025 Yang, Zhao, Zhang, Wu, Sun, Kong and Shi.
This is an open-access article distributed under the terms of the Creative Commons Attribution License (CC BY). The use, distribution or reproduction in other forums is permitted, provided the original author(s) and the copyright owner(s) are credited and that the original publication in this journal is cited, in accordance with accepted academic practice. No use, distribution or reproduction is permitted which does not comply with these terms.
* Correspondence: Xiangqing Kong xiangqing_kong@sina.com Jing Shi shijing5499@jsph.org.cn
†These authors have contributed equally to this work
Disclaimer
All claims expressed in this article are solely those of the authors and do not necessarily represent those of their affiliated organizations, or those of the publisher, the editors and the reviewers. Any product that may be evaluated in this article or claim that may be made by its manufacturer is not guaranteed or endorsed by the publisher.