 Jialei Ma1,2,†Jun Ren1,3,†
 Yujia Chen4,†Lili Xue5Yufang Huang5Jin Qian5Yan Chen5*
 Mudan Lu5*
 Yaqin Zhong1*
- 1School of Public Health, Nantong University, Nantong, Jiangsu, China
- 2Changshu Hospital Affiliated to Soochow University, Changshu NO. 1 people’s Hospital, Changshu, China
- 3Public Health Department, Changshu Hospital Affiliated Hospital of Nantong University, Changshu NO. 2 people’s Hospital, Changshu, China
- 4Department of Cardiology, The Affiliated Huishan People’s Hospital of Xinglin College, Nantong University, Wuxi Huishan District People’s Hospital, Wuxi, China
- 5Wuxi Maternity and Child Health Care Hospital, Affiliated Women’s Hospital of Jiangnan University, Wuxi, China
Background: In recent years, obesity has become a serious public health issue. This study aims to investigate the association between the Chinese Visceral Adiposity Index (CVAI) and hypertension among the middle-aged and older population in China.
Methods: Data from the China Health and Retirement Longitudinal Study (CHARLS) 2015 wave were used. A 3-knot restricted cubic spline (RCS) was employed to analyze the dose-response relationship between CVAl and hypertension. Logistic regression model was used to explore the association between CVAI and hypertension, adjusting for confounding factors including age, sex, education level, smoking, alcohol consumption, body mass index (BMI), diabetes, hyperlipidemia, and heart disease.
Results: A total of 8,787 individuals were included in the study with a hypertension prevalence of 27.89%. A significant association between CVAI and hypertension was observed. Compared to those in the low CVAI category, hypertension was significantly associated with individuals in the high CVAI category in logistic regression (OR adjusted for confounding factors =1.967, 95% CI: 1.781, 2.172). The results showed that the risk of hypertension significantly increased with higher CVAI (trend test p < 0.001). Additionally, subgroup analyses demonstrated a stronger association between CVAI and hypertension among women (OR = 2.5, 95% CI: 2.18–2.88; P for interaction <0.001) and non-smokers (OR = 2.44, 95% CI: 2.14–2.78; P for interaction = 0.001).
Conclusion: CVAI may therefore potentially serve as a useful biomarker for identifying individuals at higher risk, and controlling visceral adiposity accumulation may be a potential target for the prevention and treatment of hypertension.
Introduction
Hypertension, a prevalent chronic cardiovascular disease, is a significant public health challenge worldwide (1, 2). According to World Health Organization(WHO) statistics, there are over 100 billion patients with hypertension globally, and the number is expected to rise (3–5). Hypertension is not only a cardiovascular disease but also a major risk factor for many other conditions, including coronary heart disease, stroke, and chronic kidney disease. It significantly increases the global economic burden and threatens human lives. In China, the prevalence of hypertension is alarming high. Recent studies indicate that more than 25% of adults in China have hypertension, and the prevalence significantly increases with age (6). Therefore, investigating the risk factors of hypertension and underlying molecular mechanisms is crucial for the prevention and treatment of hypertension.
Recently, with the development of the economy and society, obesity has become another serious public health problem. There is a growing awareness of the different patterns of obesity (7, 8). Central obesity, characterized by visceral adiposity accumulation, has been demonstrated to be more harmful to human health. Visceral adiposity refers to fat wrapping around abdominal organs (9, 10). Compared to subcutaneous fat, visceral adiposity has higher metabolic activity, releasing various bioactive substances, including inflammatory factors, free fatty acids, and others. These molecules can directly regulate hypertension and induce insulin resistance, chronic inflammation, and endothelial dysfunction, eventually leading to hypertension. The Chinese Visceral Adiposity Index (CVAI), a quantitative measure of visceral adiposity content, has been widely used in research on obesity-related diseases (11, 12). However, research on the correlation between CVAI and hypertension in the Chinese middle-aged and older population remains relatively limited.
The China Health and Retirement Longitudinal Study (CHARLS) is a nationally representative large-scale longitudinal survey designed to collect multi-dimensional data on health, economic status, and social behavior among the Chinese population aged 45 and above (13).In this study, we conducted a cross—sectional analysis based on the CHARLS data of 2015 wave, aiming to explore the relationship between the Chinese Visceral Adiposity Index (CVAI) and hypertension, so as to provide a basis for further in—depth research on the association between obesity and hypertension.
Methods
Study population
The CHARLS project aimed to provide a high-quality microdata set representing households and individuals, facilitating research on population aging and interdisciplinary studies related to aging. The survey covered a wide range of topics, including demographic information, family structure, intergenerational transfers, health status, medical care and insurance, employment, income, expenditures, and assets. The national baseline survey of CHARLS was launched in 2011, employing a multi-stage probability proportional to size (PPS) sampling method. CHARLS was an ongoing longitudinal survey, with follow-up waves conducted every 2–3 years. The survey sample included 450 villages, 150 counties, and 28 provinces, covering over 17,000 individuals from approximately 10,000 households. Data collection involved face-to-face interviews conducted in participants' homes using computer-assisted personal interviewing (CAPI) technology. The datasets were publicly available and could be accessed from the CHARLS homepage at http://charls.pku.edu. cn/en. This study utilized data from the wave 3 in 2015 of CHARLS, which includes detailed health examination indicators and lifestyle information. We initially included 21,095 individuals. The exclusion criteria were as follows: (1) individuals aged below 45 (n = 497); (2) individuals with incomplete data on CVAI (n = 7,178); (3) individuals with incomplete data on hypertension (n = 4,633); and eventually, 8,787 participants were included, and the screening process is illustrated in Figure 1.
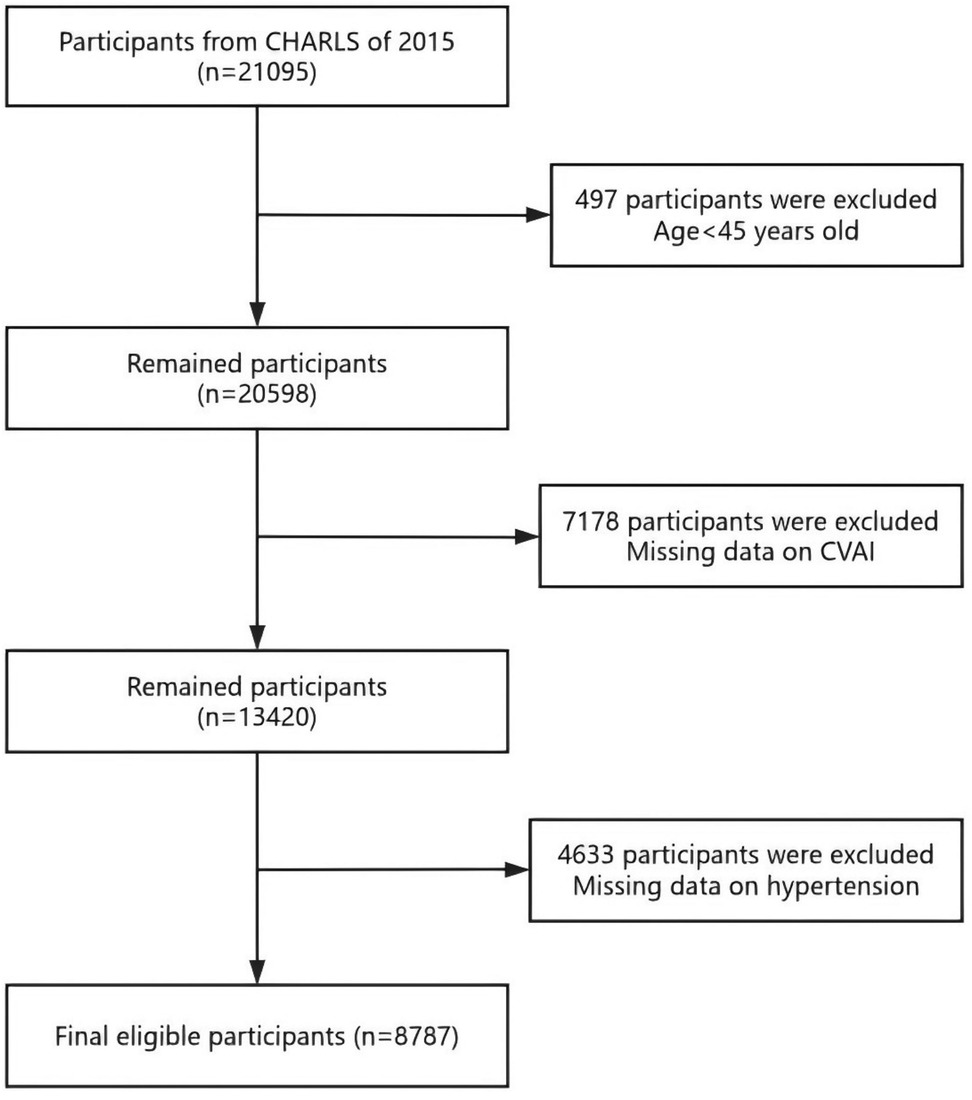
Figure 1. The flowchart indicates the participants of the study.
CVAI measurement
CVAI was a comprehensive indicator that integrates anthropometric measurements and functional parameters to assess visceral adiposity distribution. Following the studies of Amato (14) and Han (15), a specific formula incorporating waist circumference (WC), body mass index (BMI), triglycerides (TG), and high-density lipoprotein cholesterol (HDL-C) was used to calculated CVAI. Due to differences in adiposity distribution and metabolism between men and women, the CVAI formula was tailored for each gender to improve accuracy. CVAI was calculated using the following formulas:
CVAI (male) = −267.93 + 0.68 × age (years) + 0.03 × BMI (kg/m2) + 4.00 × WC (cm) + 22.00 × LgTG (mmol/L) - 16.32 × HDL-C (mmol/L)
CVAI (female) = −187.32 + 1.71 × age (years) + 4.23 × BMI (kg/m2) + 1.12 × WC (cm) + 39.76 × LgTG (mmol/L) - 11.66 × HDL-C (mmol/L)
BMI is expressed in kg/m2, calculated as weight (kg) divided by height squared (m2).
Definition of hypertension
Hypertension was determined using both self-reported medical history and blood pressure measurements. Hypertension was defined as either: (1) a self-reported physician's diagnosis of hypertension; or (2) measured systolic blood pressure ≥140 mmHg and/or diastolic blood pressure ≥90 mmHg, based on the average of three readings; or (3) current use of antihypertensive medication.
Confounding factors
The CHARLS working group used computer-assisted personal interviewing (CAPI) technology, and all physical and biochemical measurements were conducted by trained professionals using standardized protocols. Demographic and lifestyle information were collected through structured household interviews conducted by trained surveyors, including age, sex (female, male), residence (rural, urban), education level (illiteracy, primary school, middle school, high school and above), smoking status, drinking status. Health conditions and medical history were obtained through self-reported questionnaires and medical history interviews. Participants were asked if they had ever been diagnosed with dyslipidemia, diabetes mellitus (DM), heart diseases by a doctor. Participants also reported whether they were currently taking lipid-lowering medications. Blood samples were collected by trained healthcare professionals at participants' homes, and the samples were analyzed in certified laboratories. Trained medical professionals conducted standardized physical examinations to collect anthropometric and blood pressure measurements. Detailed methodologies are accessible on the CHARLS website (http://charls.pku.edu.cn/).
Statistics
The baseline characteristics of the study population were calculated, including the mean and standard deviation for continuous variables and the frequency and percentage for categorical variables. The differences in CVAI and other covariates between the hypertension and non-hypertension groups were compared using t-tests or chi-square tests. A 3-knot restricted cubic spline (RCS) plot was utilized to explore the nonlinear relationship between CVAI and hypertension. Specifically, we used three knots placed at the 10th, 50th, and 90th percentiles of the CVAI distribution, which is a commonly recommended approach in epidemiological studies to balance model flexibility and stability. The aim was to establish the cutoff point using the RCS curve, followed by conducting a logistic regression analysis anchored on this threshold. A logistic regression model was conducted to analyze the association between CVAI and hypertension, adjusting for potential confounding factors. The results were expressed as odds ratios (ORs) with 95% confidence intervals (CIs). Subgroup analyses were conducted to explore the heterogeneity in the association between CVAI and hypertension. While our subgroup analyses suggested potential effect modifications by factors such as age, sex, and smoking status, it is important to acknowledge the issue of multiple testing. Conducting numerous statistical comparisons increases the probability of Type I error, where an association is falsely deemed significant. The CHARLS study was approved by the Ethics Committee of Peking University, and all participants provided informed consent. This study used publicly available anonymized data, which did not require additional ethical review. All statistical analyses were conducted using spss27.0, Stata 17.0, and R statistical software, with a significance level set at P < 0.05.
Results
General characteristics of participants
The study included a total of 8,787 individuals, with 2,626 (27.89%) having hypertension and 6,161 (70.11%) without hypertension (Table 1). The results indicated that the incidence of hypertension among the middle-aged and older adults varied based on several factors, including age, gender, education, smoking, drinking, dyslipidemia, diabetes mellitus (DM), use of lipid-lowering drugs, heart diseases, fasting blood glucose levels, creatinine, uric acid, triglycerides (TG), total cholesterol (TC), low-density lipoprotein (LDL), weight, body mass index (BMI), waist circumference, systolic blood pressure (SBP), diastolic blood pressure (DBP), and the Chinese visceral adiposity index (CVAI). The differences among these factors were statistically significant (p < 0.05). The average age of the entire sample was 61.46 ± 9.19 years, with hypertensive individuals being significantly older (63.98 ± 9.26 years) compared to non-hypertensive individuals (60.39 ± 8.95 years, p < 0.001). There were 1,334 females with hypertension (27.91%) and 3,445 without hypertension (72.09%). Among the middle-aged and older adults living in rural areas, 4,763 (70.06%) were in the non-hypertensive group, while 2,035 (29.94%) were in the hypertensive group. Among middle-aged and older adults with a high school education or higher, 263 (27.86%) were diagnosed with hypertension, while 681 (72.14%) were non-hypertension. Of those with hypertension, 1,139 (31.84%) were smokers, and 1,487 (28.54%) were non-smokers. In terms of alcohol consumption, 2,068 (68.57%) of the middle-aged and older adults in the non-hypertensive group consumed alcohol, compared to 948 (31.43%) in the hypertensive group. Regarding comorbidities, among middle-aged and older adults with hypertension, 406 individuals (38.85%) had dyslipidemia, 235 (40.80%) had diabetes mellitus (DM), and 421 (36.64%) had heart diseases. Among participants using lipid-lowering drugs, 600 (61.22%) were in the non-hypertensive group, whereas 380 (38.78%) were in the hypertensive group. Biochemically, hypertensive individuals had significantly higher levels of fasting blood glucose (104.25 ± 33.41 mg/dl), creatinine (0.82 ± 0.25 mg/dl), uric acid (5.10 ± 1.47 mg/dl), total cholesterol (188.57 ± 37.26 mg/dl), triglycerides (148.82 ± 95.03 mg/dl), and low-density lipoprotein (LDL) (105.10 ± 29.56 mg/dl), compared to those without hypertension. Other physical measurements showed that hypertensive individuals had a significantly higher weight (61.90 ± 12.18 kg), BMI (24.79 ± 4.04 kg/m2), and waist circumference (88.72 ± 11.52 cm). Systolic blood pressure (SBP) and diastolic blood pressure (DBP) were also significantly higher in hypertensive individuals (152.38 ± 15.58 mmHg and 86.45 ± 11.18 mmHg, respectively). The Chinese visceral adiposity index (CVAI) was significantly higher in hypertensive individuals (122.30 ± 40.06) compared to non-hypertensive individuals (104.54 ± 38.72, p < 0.001), suggesting a strong association between CVAI and hypertension.
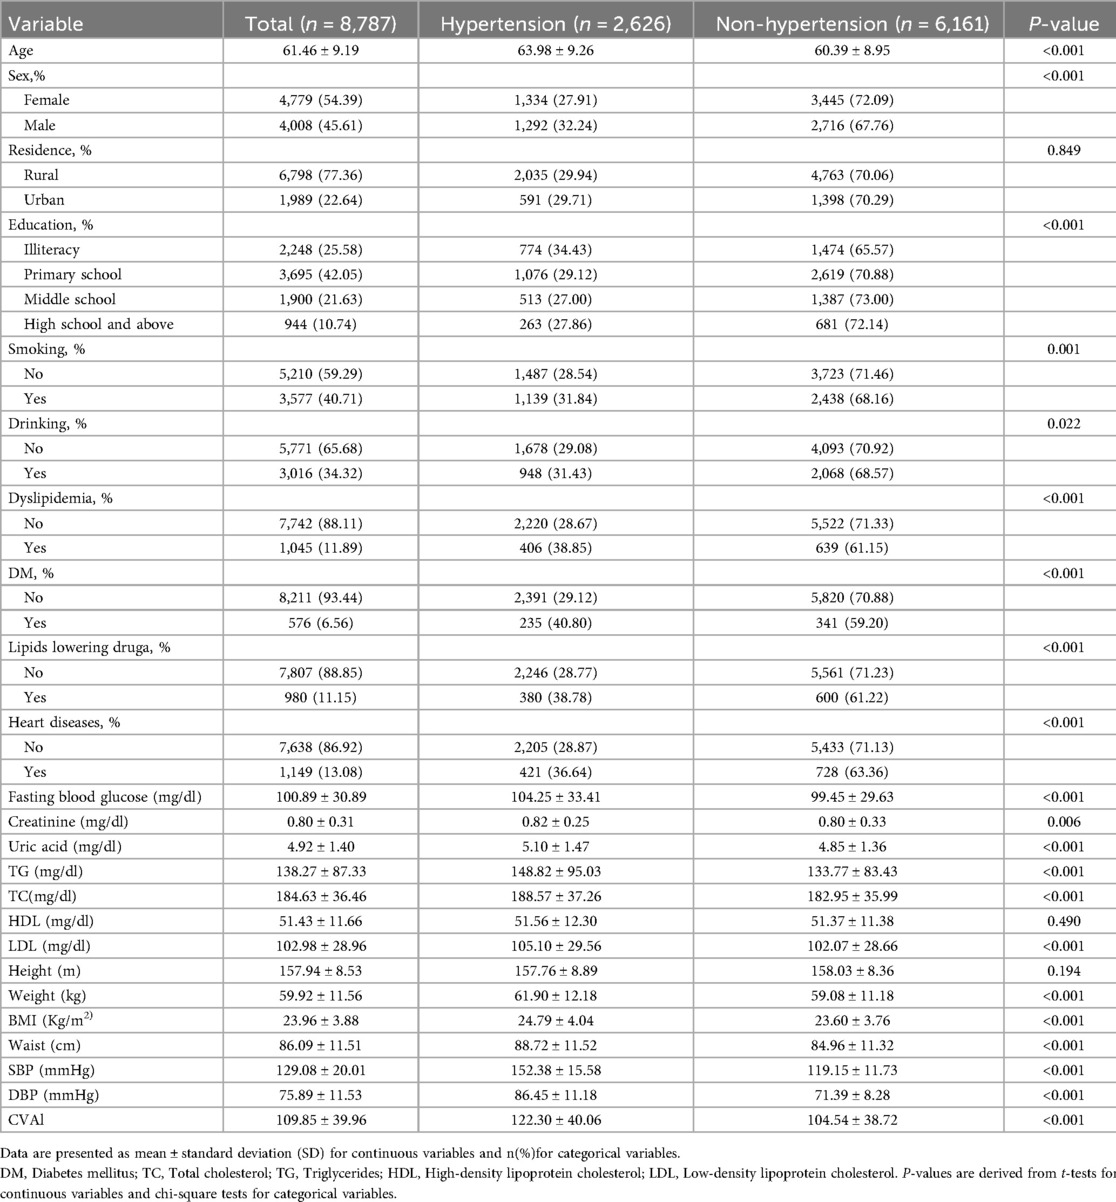
Table 1. Baseline characteristics of the study population stratified by hypertension status.
Dose-response relationship between the CVAl and hypertension
In addition, a 3-knot RCS was employed to model the dose-response relationship between CVAl and elevated hypertension, as depicted in Figure 2. The CVAI was plotted as the horizontal coordinate and the odds ratio (OR) was plotted as the vertical coordinate. The results, after adjusting for potential covariates, indicated that higher levels of CVAI cor-responded with an increasing risk of hypertension (nonlinear P < 0.001). The corresponding inflection point value was 108.88.
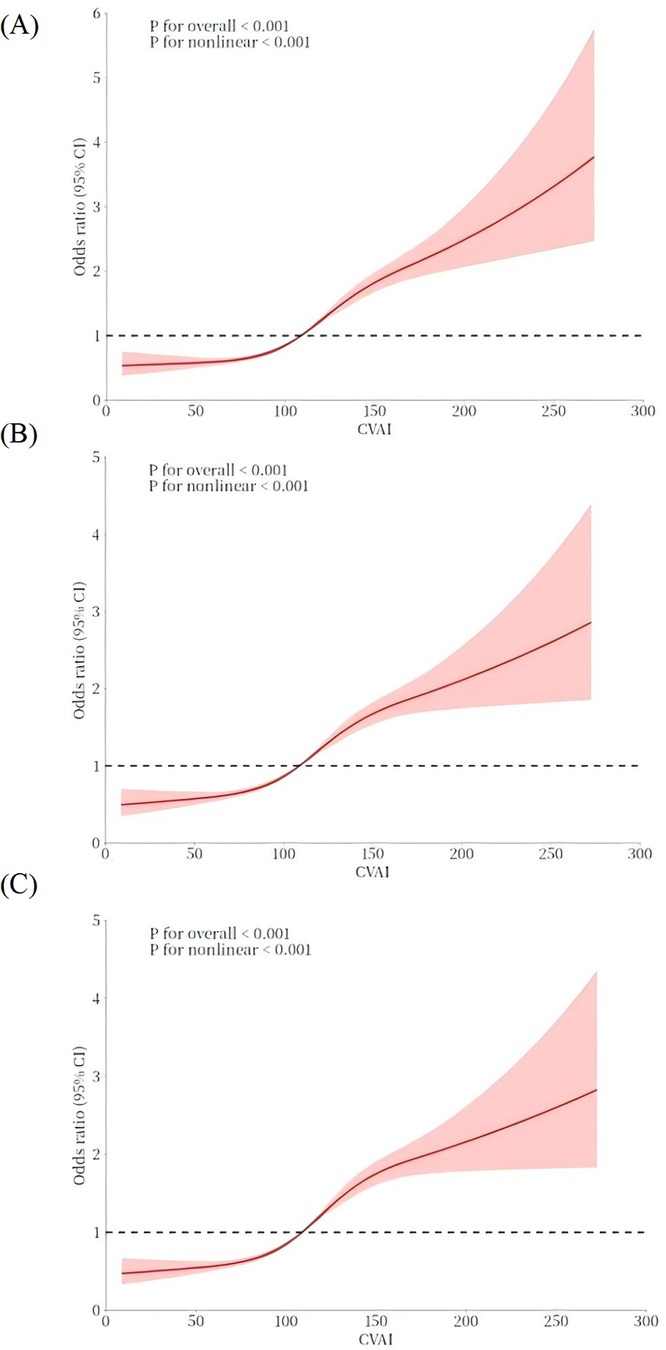
Figure 2. The dose–response relationship between CVAI and hypertension. A 3-knot RCS was employed to fit the dose–response relationship between CVAI and hypertension. (A) Model 1: no covariates were adjusted. (B) Model 2: age, sex. (C) Model 3: age, sex, education, residence, smoking, alcohol consumption, diabetes, hyperlipidemia, heart disease, and lipid-lowering medication use. The red solid line represents the curve fitting between variables, and the shaded area indicates the 95% CI of the fit.
The relationship between CVAI and hypertension is displayed in Table 2. After controlled for potential covariates in Model 3, the findings indicated a significant positive relationship with an OR of 1.010 (95% CI: 1.008, 1.011). The RCS was applied to examine the nonlinear relationship between CVAI and hypertension. An inflection point value of 108.88 was derived (see Figure 2C), which was then used as a cutoff point to classify the CVAI as a dichotomous variable for logistic regression. In Model 1, the OR for the upper category in comparison with the lower category was 2.189 (95% CI: 1.993, 2.405). In Model 2, after controlled for age and gender, the OR for the higher category increased to 2.019 (95% CI: 1.834, 2.223). In model 3, multiple confounding factors were controlled, including age, sex, education, residence, smoking, alcohol consumption, diabetes, hyperlipidemia, heart disease, and lipid- lowering medication use. The OR was 1.967 (95% CI: 1.781, 2.172), indicating that the relationship between higher CVAI and hypertension remained statistically significant. The trend analysis confirmed a consistent positive correlation between the two categories (P for trend < 0.001).
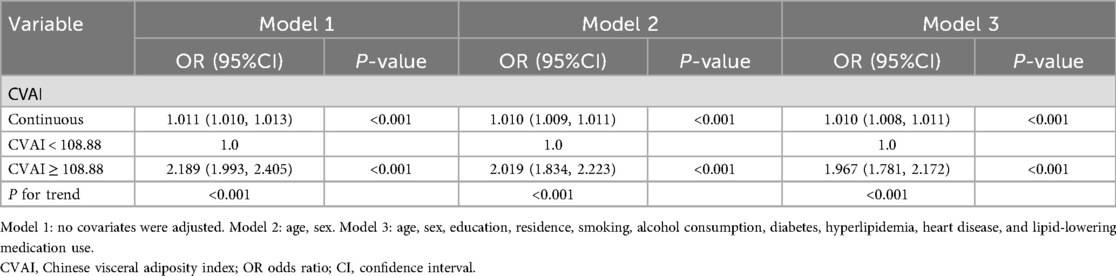
Table 2. Relationship between CVAI and hypertension.
Subgroup analyses
Our subgroup analysis utilized stratification variables such as sex (Male vs. Female), residence (Rural vs. Urban), education (Illiteracy vs. Primary school vs. Middle school vs. High school and above), smoke (Yes vs. No), and drinking status (Yes vs. No). The results were visually presented using a forest plot. As presented in Figure 3, these analyses revealed that these factors influenced the relationship between the CVAI and hypertension. Specifically, a positive association between CVAI and hypertension was observed across all subgroups. This association appeared to be stronger within specific subgroups: such as women (P for interaction < 0.001), and non-smokers (P for interaction = 0.001). In contrast, residence, education, drinking status did not appear to have a substantial impact on the relationship (P for interaction >0.05). Overall, the test for interaction between subgroups indicated that the relationship between CVAI and hypertension varied significantly across different subgroups.
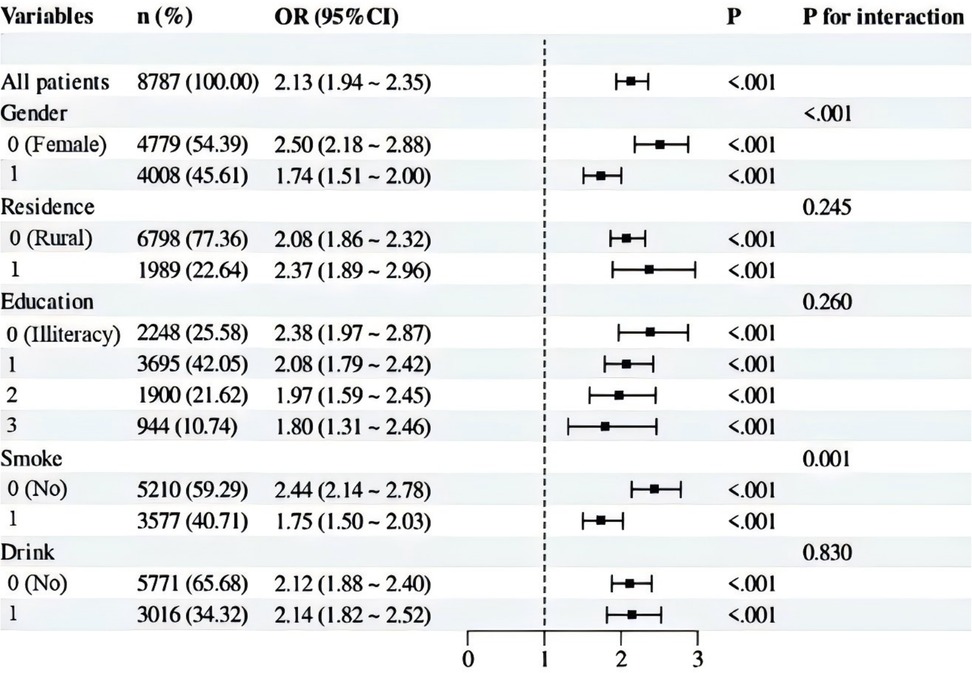
Figure 3. Subgroup analysis of CVAI and hypertension.
Discussion
In this study, we conducted a cross-sectional analysis among middle-aged and older adults in China (aged over 45 years) to systematically investigate the association between CVAI and hypertension. We found a positive correlation between Chinese visceral adiposity accumulation and the occurrence of hypertension, suggesting that controlling visceral adiposity accumulation may be a potential target for the prevention and treatment of hypertension. Besides, the dose-response analysis revealed a nonlinear association between CVAI and hypertension risk, with a notable inflection point at 108.88, indicating a critical threshold where the risk of hypertension markedly increases, which might be helpful in clinical practice and for heathy police makers. However, due to the inherent limitations of cross-sectional studies, our study cannot establish a causal relationship between CVAI and hypertension, therefore, further prospective studies are needed to confirm these findings.
From biological mechanisms, we infer that visceral adiposity could contribute to vascular dysfunction from the aspects, including promoting inflammation, oxidative stress, and adipokine imbalance. Blood vessels are primarily composed of endothelium and smooth muscle. As the most abundant cellular component in blood vessels, smooth muscle dysfunction can significantly impair vascular function, contributing to the development and progression of various chronic cardiovascular diseases, including hypertension (16, 17). From a molecular mechanism perspective, numerous studies have confirmed that visceral adiposity accumulation can lead to vascular smooth muscle dysfunction. First, unlike subcutaneous fat, visceral adiposity has higher secretory activity and can release various inflammatory mediators, including TNF-α, IL-6, and IL-8 (18, 19). These circulating inflammatory mediators may induce inflammation in smooth muscle, eventually leading to vascular fibrosis and calcification, which results in impaired vasodilation. Furthermore, oxidative stress plays a crucial role in vascular sclerosis. In addition to increasing systemic inflammation levels, visceral adiposity also contributes to the accumulation of reactive oxygen species (ROS) (20–23). Vascular endothelial cells also play a crucial role in maintaining vascular homeostasis. Studies have shown that reducing visceral adipose tissue (VAT) can significantly improve NO production, reduce inflammation levels, and enhance vascular dilation function. Recent studies have shown that inflammatory responses play a crucial role in the development and progression of cardiovascular diseases, particularly in VAT and perivascular adipose tissue (PVAT) (21). For example, a study on hereditary hypertriglyceridemic (HHTg) rats found that sex differences significantly influence inflammatory responses and hematological status, thereby affecting cardiovascular disease risk. In this study, female HHTg rats exhibited more pronounced hypertriglyceridemia and a procoagulant state, whereas male rats showed higher non-fasting blood glucose levels and serum leptin levels. Additionally, ICAM-1 gene expression was increased in the aorta of male HHTg rats, while TNFα gene expression was lower in the aorta of female rats, suggesting that females had a relatively milder inflammatory response (24–26). Due to the multifaceted and multi-mechanistic damage caused by visceral adiposity to blood vessels, its detrimental effects are particularly strong. In this study, we conducted a detailed subgroup analysis, revealing a significant association between visceral adiposity and hypertension across different populations. Notably, this association was stronger in women and non-smokers, with statistically significant differences. One possible explanation is that women, particularly postmenopausal women, may experience hormonal changes that influence fat distribution and cardiovascular risk, thereby amplifying the effect of visceral fat on hypertension. Similarly, in non-smokers, the absence of smoking-related vascular damage may make the hypertensive effect of visceral adiposity more discernible.
Actually, previous clinical studies already explored the association between visceral adiposity and hypertension. A long-term MRI-based follow-up study demonstrated that baseline VAT area (VAT cm2) and the proportion of VAT to total abdominal adiposity (VAT%) were significantly associated with metabolic syndrome, hypertension, and diabetes status (27). The study further indicated that while VAT cm2 and VAT% performed similarly in predicting metabolic syndrome and hypertension, VAT% was more advantageous in assessing lipid status, whereas VAT cm2 better reflected inflammation and blood glucose status. This aligns with our findings, suggesting that CVAI, as a comprehensive index, may incorporate the clinical significance of both VAT cm2 and VAT%, thereby offering unique value in predicting hypertension and other cardiometabolic risks. Additionally, the MRI study found that after 18 months of lifestyle intervention, reductions in VAT cm2 and VAT% were significantly correlated with decreases in triglycerides, HbA1c, ferritin, and liver enzymes, as well as increases in HDL-c levels. These results further support the beneficial role of visceral adiposity reduction in improving metabolic health and suggest that CVAI may serve as a potential indicator for evaluating the effectiveness of lifestyle interventions (28, 29). However, MRI is not a routine examination, as it requires a relative high cost and technical expertise. Our study on the relationship between CVAI and hypertension provides a more accessible approach to understanding this association of abdominal adiposity and hypertension. Notably, we identified a critical inflection point at 108.88, beyond which the correlation between CVAI and hypertension becomes more pronounced. This finding may contribute to future hypertension prevention and management strategies.
This study has several limitations. First, the wave 3 of CHARLS was used in the present study, it can only reveal the association between CVAI and hypertension but cannot establish a causal relationship. CHARLS collects data from the same group of samples at multiple time points, the cross-sectional nature of our analysis is due to the unavailability of comparable data from other years. The reason to utilize the 2015 dataset is because blood pressure measurements were not continued for participants in subsequent waves. Second, this study did not examine the dynamic changes in CVAI and their impact on hypertension risk. Future longitudinal studies should investigate the trends in CVAI over time and their relationship with hypertension development to further validate its predictive value. Third, this study mainly relied on the indirect calculation of CVAI and did not directly measure VAT volume or vascular function indicators (such as flow-mediated dilation or endothelial function biomarkers). Additionally, although we adjusted for multiple confounding factors in the multivariable regression analysis, unmeasured or residual confounders may still exist, potentially affecting the relationship between CVAI and hypertension. Finally, since CHARLS primarily focuses on middle-aged and older adults in China, the findings may not be generalizable to other age groups or ethnic populations. Future studies should extend to diverse populations to assess the generalizability of CVAI.
Conclusion
This study, based on the CHARLS database, systematically explored the relationship between CVAI and hypertension in the middle-aged and older population in China. The results show a significant positive association between CVAI and hypertension, which is consistent across subgroup analysis of gender, and smoking status. Although this is a cross-sectional study and causality cannot be determined, the findings suggest that visceral fat accumulation may be an important risk factor for hypertension. Controlling visceral adiposity accumulation may provide a new strategy for the prevention and treatment of hypertension.
Data availability statement
The original contributions presented in the study are included in the article/Supplementary Material, further inquiries can be directed to the corresponding authors.
Ethics statement
The studies involving humans were approved by Peking University Ethics Committee. The IRB approval numbers were IRB00001052-11015 and IRB00001052-11014. The studies were conducted in accordance with the local legislation and institutional requirements. The participants provided their written informed consent to participate in this study.
Author contributions
JM: Conceptualization, Data curation, Investigation, Methodology, Software, Supervision, Writing – original draft, Writing – review & editing, Formal analysis, Project administration. JR: Investigation, Methodology, Software, Supervision, Writing – original draft, Writing – review & editing, Conceptualization, Data curation, Formal analysis. YuC: Conceptualization, Data curation, Methodology, Writing – original draft, Writing – review & editing, Formal analysis, Investigation, Project administration, Software, Supervision. LX: Data curation, Methodology, Software, Supervision, Writing – review & editing. YH: Investigation, Methodology, Project administration, Software, Supervision, Validation, Writing – review & editing. JQ: Formal analysis, Methodology, Project administration, Software, Supervision, Validation, Writing – review & editing. YaC: Formal analysis, Funding acquisition, Project administration, Resources, Validation, Visualization, Writing – review & editing. ML: Formal analysis, Funding acquisition, Project administration, Resources, Validation, Visualization, Writing – review & editing. YZ: Funding acquisition, Methodology, Resources, Supervision, Validation, Visualization, Writing – review & editing.
Funding
The author(s) declare that financial support was received for the research and/or publication of this article. This work was supported by Jiangsu Provincial Traditional Chinese Medicine Science and Technology Development Plan Project (MS2022059); Wuxi City Double Hundred Top-notch Talent Project (BJ2023079).
Conflict of interest
The authors declare that the research was conducted in the absence of any commercial or financial relationships that could be construed as a potential conflict of interest.
Generative AI statement
The author(s) declare that no Generative AI was used in the creation of this manuscript.
Any alternative text (alt text) provided alongside figures in this article has been generated by Frontiers with the support of artificial intelligence and reasonable efforts have been made to ensure accuracy, including review by the authors wherever possible. If you identify any issues, please contact us.
Publisher's note
All claims expressed in this article are solely those of the authors and do not necessarily represent those of their affiliated organizations, or those of the publisher, the editors and the reviewers. Any product that may be evaluated in this article, or claim that may be made by its manufacturer, is not guaranteed or endorsed by the publisher.
References
1. Li H, Liu L, Zhou Y, Jiang H, Zhang W, Zhou C, et al. Metabolic dysfunction in idiopathic intracranial hypertension: current theories and updates. Aging Dis. (2024) 16(6):3311–34. doi: 10.14336/AD.2024.1147
2. Falk JM, Froentjes L, Kirkwood JE, Heran BS, Kolber MR, Allan GM, et al. Higher blood pressure targets for hypertension in older adults. Cochrane Database Syst Rev. (2024) 12(12):Cd011575. doi: 10.1002/14651858.CD011575.pub3
3. Moran AE, Gupta R. Implementation of global hearts hypertension control programs in 32 low- and middle-income countries: JACC international. J Am Coll Cardiol. (2023) 82(19):1868–84. doi: 10.1016/j.jacc.2023.08.043
4. Wiersinga J, Jansen S, Peters MJL, Rhodius-Meester HFM, Trappenburg MC, Claassen J, et al. Hypertension and orthostatic hypotension in the elderly: a challenging balance. Lancet Reg Health Eur. (2025) 48:101154. doi: 10.1016/j.lanepe.2024.101154
5. Song P, Zhang Y, Yu J, Zha M, Zhu Y, Rahimi K, et al. Global prevalence of hypertension in children: a systematic review and meta-analysis. JAMA Pediatr. (2019) 173(12):1154–63. doi: 10.1001/jamapediatrics.2019.3310
6. Gao Y, Chen G, Tian H, Lin L, Lu J, Weng J, et al. China National diabetes and metabolic disorders study group. Prevalence of hypertension in China: a cross-sectional study. PLoS One. (2013) 8(6):e65938. doi: 10.1371/journal.pone.0065938
7. Fulton S, Décarie-Spain L, Fioramonti X, Guiard B, Nakajima S. The menace of obesity to depression and anxiety prevalence. Trends Endocrinol Metab. (2022) 33(1):18–35. doi: 10.1016/j.tem.2021.10.005
8. Vasim I, Majeed CN, DeBoer MD. Intermittent fasting and metabolic health. Nutrients. (2022) 14(3):631. doi: 10.3390/nu14030631
9. Kolb H. Obese visceral fat tissue inflammation: from protective to detrimental? BMC Med. (2022) 20(1):494. doi: 10.1186/s12916-022-02672-y
10. Neeland IJ, Ross R, Després JP, Matsuzawa Y, Yamashita S, Shai I, et al. Visceral and ectopic fat, atherosclerosis, and cardiometabolic disease: a position statement. Lancet Diabetes Endocrinol. (2019) 7(9):715–25. doi: 10.1016/S2213-8587(19)30084-1
11. Liu L, Peng J, Zang D, Zhang Y, Wu Z, Song C, et al. The Chinese visceral adiposity index: a novel indicator more closely related to cardiovascular disease than other abdominal obesity indices among postmenopausal women. J Transl Med. (2024) 22(1):855. doi: 10.1186/s12967-024-05665-y
12. Wan H, Wang Y, Xiang Q, Fang S, Chen Y, Chen C, et al. Associations between abdominal obesity indices and diabetic complications: chinese visceral adiposity index and neck circumference. Cardiovasc Diabetol. (2020) 19(1):118. doi: 10.1186/s12933-020-01095-4
13. Jin S, Li C, Miao J, Sun J, Yang Z, Cao X, et al. Sociodemographic factors predict incident mild cognitive impairment: a brief review and empirical study. J Am Med Dir Assoc. (2023) 24(12):1959–1966.e1957. doi: 10.1016/j.jamda.2023.08.016
14. Amato MC, Giordano C, Galia M, Criscimanna A, Vitabile S, Midiri M, et al. Alkamesy study group: visceral adiposity Index: a reliable indicator of visceral fat function associated with cardiometabolic risk. Diabetes Care. (2010) 33(4):920–2. doi: 10.2337/dc09-1825
15. Han M, Qie R, Li Q, Liu L, Huang S, Wu X, et al. Chinese Visceral adiposity index, a novel indicator of visceral obesity for assessing the risk of incident hypertension in a prospective cohort study. Br J Nutr. (2021) 126(4):612–20. doi: 10.1017/S0007114520004298
16. Ungvari ZI. Endothelium-derived bone morphogenic protein antagonists may counteract the proatherogenic vascular effects of bone morphogenic protein 4. Circulation. (2007) 116(11):1221–3. doi: 10.1161/CIRCULATIONAHA.107.726307
17. Young EW, Beebe DJ. Fundamentals of microfluidic cell culture in controlled microenvironments. Chem Soc Rev. (2010) 39(3):1036–48. doi: 10.1039/b909900j
18. Li N, Li X, Deng L, Yang H, Gong Z, Wang Q, et al. 6-Shogaol Inhibits the proliferation, apoptosis, and migration of rheumatoid arthritis fibroblast-like synoviocytes via the PI3 K/AKT/NF-κB pathway. Phytomedicine. (2023) 109:154562. doi: 10.1016/j.phymed.2022.154562
19. García-Hermoso A, Ramírez-Vélez R, Díez J, González A, Izquierdo M. Exercise training-induced changes in exerkine concentrations may be relevant to the metabolic control of type 2 diabetes mellitus patients: a systematic review and meta-analysis of randomized controlled trials. J Sport Health Sci. (2023) 12(2):147–57. doi: 10.1016/j.jshs.2022.11.003
20. Pou KM, Massaro JM, Hoffmann U, Vasan RS, Maurovich-Horvat P, Larson MG, et al. Visceral and subcutaneous adipose tissue volumes are cross-sectionally related to markers of inflammation and oxidative stress: the Framingham heart study. Circulation. (2007) 116(11):1234–41. doi: 10.1161/CIRCULATIONAHA.107.710509
21. Wong CX, Ganesan AN, Selvanayagam JB. Epicardial fat and atrial fibrillation: current evidence, potential mechanisms, clinical implications, and future directions. Eur Heart J. (2017) 38(17):1294–302. doi: 10.1093/eurheartj/ehw045
22. Piskounova E, Agathocleous M, Murphy MM, Hu Z, Huddlestun SE, Zhao Z, et al. Oxidative stress inhibits distant metastasis by human melanoma cells. Nature. (2015) 527(7577):186–91. doi: 10.1038/nature15726
23. Meher AK, McNamara CA. B-1 lymphocytes in adipose tissue as innate modulators of inflammation linked to cardiometabolic disease. Immunol Rev. (2024) 324(1):95–103. doi: 10.1111/imr.13342
24. Markova I, Hüttl M, Gayova N, Miklankova D, Cerna K, Kavanova M, et al. Visceral adipose tissue inflammation and vascular complications in a rat model with severe dyslipidemia: sex differences and PAI-1 tissue involvement. Biomolecules. (2024) 15(1):19. doi: 10.3390/biom15010019
25. Wagner R, Machann J, Lehmann R, Rittig K, Schick F, Lenhart J, et al. Exercise-induced albuminuria is associated with perivascular renal sinus fat in individuals at increased risk of type 2 diabetes. Diabetologia. (2012) 55(7):2054–8. doi: 10.1007/s00125-012-2551-z
26. Schuetz LT, Duran G, Baeten P, Lintsen D, Hermans D, Chenine S, et al. Sex differentially affects pro-inflammatory cell subsets in adipose tissue depots in a diet induced obesity model. Biol Sex Differ. (2024) 15(1):105. doi: 10.1186/s13293-024-00677-1
27. Bea JW, Chen Z, Blew RM, Nicholas JS, Follis S, Bland VL, et al. MRI Based validation of abdominal adipose tissue measurements from DXA in postmenopausal women. J Clin Densitom. (2022) 25(2):189–97. doi: 10.1016/j.jocd.2021.07.010
28. Klein H, Zelicha H, Yaskolka Meir A, Rinott E, Tsaban G, Kaplan A, et al. Visceral adipose tissue area and proportion provide distinct reflections of cardiometabolic outcomes in weight loss; pooled analysis of MRI-assessed CENTRAL and DIRECT PLUS dietary randomized controlled trials. BMC Med. (2025) 23(1):57. doi: 10.1186/s12916-025-03891-9
Keywords: Visceral Adiposity Index, hypertension, middle-aged and older adults, cross-sectional study, risk assessment
Citation: Ma J, Ren J, Chen Y, Xue L, Huang Y, Qian J, Chen Y, Lu M and Zhong Y (2025) The association between Chinese visceral adiposity index and hypertension among middle-aged and older population: a cross-sectional study based on CHARLS. Front. Cardiovasc. Med. 12:1664848. doi: 10.3389/fcvm.2025.1664848
Received: 12 July 2025; Accepted: 10 October 2025;
Published: 31 October 2025.
Edited by:
Li-Da Wu, Nanjing Medical University, ChinaReviewed by:
Mehdi Bazrafshan, Shiraz University of Medical Sciences, IranQIng Guan, Mahidol University, Thailand
Copyright: © 2025 Ma, Ren, Chen, Xue, Huang, Qian, Chen, Lu and Zhong. This is an open-access article distributed under the terms of the Creative Commons Attribution License (CC BY). The use, distribution or reproduction in other forums is permitted, provided the original author(s) and the copyright owner(s) are credited and that the original publication in this journal is cited, in accordance with accepted academic practice. No use, distribution or reproduction is permitted which does not comply with these terms.
*Correspondence: Mudan Lu, bHVtdWRhbjA1MjdAMTYzLmNvbQ==; Yan Chen, anl5eWN5QDEyNi5jb20=; Yaqin Zhong, eXF6aG9uZ0BudHUuZWR1LmNu
†These authors have contributed equally to this work