Abstract
Background:
Atrial fibrosis serves as a key pathological basis for atrial fibrillation, significantly elevating the risk of cardiovascular events. However, its molecular mechanisms remain incompletely understood. N⁶-methyladenosine (m6A) modifications have been proven to involve in the pathological processes of cardiovascular diseases, yet its role in atrial fibrosis remains unclear. m6A plays an important role in disease pathogenesis via mRNA modification. This study aimed to define the role of m6A modifications in the fibrotic atria of rats with chronic intermittent hypoxia (CIH).
Methods:
A CIH model was established using rats living in an intermittent hypoxia simulation chamber filled with oxygen and nitrogen. Myocardial function and atrial fibrosis were examined by echocardiography, electrophysiology, and histopathology. Methylated RNA immunoprecipitation sequencing (MeRIP-Seq) and mRNA sequencing (mRNA-Seq) were performed on atria from control and CIH rats to identify differential m6A methylated genes and transcripts and further analyze their coexistence. Functional enrichment of the conjoint genes was analyzed using Gene Ontology and Kyoto Encyclopedia of Genes and Genomes assays. m6A distribution of the conjoint gene ANGPTL4 (angiopoietin like 4) was also observed. ANGPTL4 and m6A-related gene expression levels were determined by quantitative real-time polymerase chain reaction.
Results:
CIH led to electrical conduction dysfunction and abnormal expression of fibrosis-associated proteins, indicating successful atrial fibrosis. Conjoint analysis identified 10 genes with upregulated m6A peaks and transcripts and 24 genes with downregulated m6A peaks and transcripts. These genes were functionally enriched in the calcium ion transport-related and fibrosis pathways (extracellular matrix receptor interaction). The m6A modification level of ANGPTL4 mRNA and the expression of four m6A regulatory enzymes were significantly different between control and CIH rats.
Conclusion:
Our results revealed that m6A modification plays a crucial role in atrial fibrosis and may provide new therapeutic strategies for this disease.
1 Background
Atrial fibrosis is recognized as a vital pathophysiological contributor and is characterized by the abnormal activation, proliferation, and differentiation of fibroblasts accompanied by excessive deposition and synthesis of myocardial extracellular matrix (ECM) proteins (1). Atrial fibrosis is a key biological event in cardiovascular disease, as it is a risk factor for atrial fibrillation (AF), a common arrhythmia that can lead to ischemic stroke and heart failure and increase disability and mortality (2). Pathologically, fibrosis is involved in the electrical and structural remodeling of AF and is closely related to abnormalities in cardiac structure and function. An increase in the degree of fibrosis leads to changes in atrial electrophysiological characteristics, thereby increasing the risk and recurrence rate of AF (3). However, the molecular mechanisms underlying atrial fibrillation remain unclear.
Recently, an increasing number of studies have focused on epigenetics due to its role in disease occurrence and the progression of diseases (4). Epigenetics primarily include DNA methylation, histone labeling, and RNA modifications, among which adenosine N(6) methylation (m6A) is the most common modification of eukaryotic messenger RNA (mRNA). m6A methylation is a dynamic and reversible process regulated by enzymes such as methyltransferases (writers), demethylases (erasers), and methylation reading proteins (readers) that are responsible for m6A modification, removal, and recognition of m6A modification, respectively (5). m6A methylation is involved in the translation, degradation, splicing, and export of mRNA and widely affects biological processes in mammalian organisms such as development, cell differentiation, immunity, metabolism, and tumorigenesis (6). Accumulating evidence suggests that m6A modifications are involved in the pathological development of cardiovascular diseases. For example, one review summarized the evidence for the involvement of m6A methylation in the occurrence and development of heart failure (7). Research using a mouse cardiac ischemia-reperfusion model revealed that the m6A methyltransferase METTL14 (methyltransferase 14, N6-adenosine-methyltransferase non-catalytic subunit) protects cardiomyocytes against ischemia-reperfusion injury (8). In the context of myocardial fibrosis, the m6A methyltransferase METTL3 (methyltransferase 3, N6-adenosine-methyltransferase complex catalytic subunit) was observed to control myocardial hypertrophy and fibrosis in cardiomyocytes (9–11). However, the involvement of m6A methylation in the pathology of atrial fibrosis remains largely unknown.
In this study, we performed methylated RNA immunoprecipitation sequencing (MeRIP-Seq) on the atrial tissues of control and chronic intermittent hypoxia (CIH) rats, an animal model that has been demonstrated to induce atrial fibrosis (12), and we identified differential m6A peaks (including 105 genes with upregulated hypermethylated m6A and 28 genes with downregulated hypermethylated m6A). Further conjoint analysis of differentially expressed m6A peak-annotated genes and transcripts suggested that m6A methylation was associated with calcium ion transport-related pathways and multiple fibrosis-related pathways.
2 Methods
2.1 CIH rat model
Eighty adult male SD rats (8 weeks old) were randomly divided into control and CIH groups (n = 40 per group). Rats in the CIH group lived in an intermittent hypoxia-simulated chamber for 8 h per day for 12 weeks. The chamber was alternately filled with oxygen (1.5 min) and nitrogen (3.5 min) every 5 min during each cycle. The oxygen concentration in the intermittent hypoxia simulation chamber was maintained between 7% and 21%. With the exception of the time spent in the simulation chamber, the living and feeding conditions of rats in both groups were the same. Twelve weeks after modeling, cardiac electrophysiological examination was performed, and the atria were isolated for fibrosis protein expression detection and high-throughput sequencing. The animals were fed and operated according to the Guiding Principles in the Care and Use of Animals (China) and in a manner approved by the Laboratory Animal Ethics Committee of Tianjin Medical University (No. TMUaMEC2016012).
2.2 Intracardiac electrophysiological examination
Rats were anesthetized by intraperitoneal injection of 1.5% tribromoethanol at a dosage of 300 mg/kg, and their limbs and heads were fixed on the operating table. A standard 2-lead body surface electrocardiogram (ECG) needle electrode was connected to record surface ECGs form the rats. The neck skin of the rats was cut, and the right jugular vein was exposed by blunt separation of the surrounding tissue. A multipolar electrophysiological catheter was slowly inserted into the right ventricle by puncturing the jugular vein. The multipolar electrophysiological catheter included eight round 0.5 mm electrodes spaced 0.5 mm apart (STG3008-FA, ADInstruments, New South Wales, Australia). The position of the multipole catheter was adjusted using ECG monitoring to ensure the successful pacing of the stimulation. Additionally, the stimulation voltage was selected to be twice the pacing threshold to ensure atrial pacing. For the AF induction rate evaluation scheme, continuous high-frequency stimulation was used as a burst stimulus, and the pacing cycle was set to start at 40 ms and then decrease to 20 ms (repeated five times). This was the burst stimulus. After burst stimulation, a 1 min rest was required to ensure that the rat atrium returned to the resting state. Successfully induced AF was defined as a burst of irregular non-sinus rhythms for >1 s with irregular RR intervals and irregular f waves on surface ECGs. If AF was induced three times among the five inductions, the rats were recorded as positive for AF.
2.3 Electrophysiological mapping of epicardium
At the end of the cardiac electrophysiology experiment, the trachea was intubated using the tracheotomy method and connected to a small animal ventilator. After the respiratory rate of the rats stabilized, the chest cavity was opened, and the heart was fully exposed by separating the pericardium and surrounding tissue. A 6 × 6 probe with 36 microelectrodes was gently attached to the surface of the left atrium, and the electrical activity of the microelectrodes was recorded using MappingLab EMapRecord 5 software. The conduction velocity (CV) and absolute inhomogeneity index (inhomogeneity index) were measured using MappingLab EMapScope 4 software. CV refers to the ratio of the distance between the earliest and last activation sites to the conduction time and is typically used to express the epicardial conduction velocity. Absolute conduction heterogeneity and heterogeneity index reflect the degree of electrical conduction uniformity in the atrial epicardium.
2.4 Immunohistochemistry
Rats were euthanized by intraperitoneal injection of 3% pentobarbital sodium solution at a dose of 100 mg/kg body weight. Atria were embedded in paraffin and then cut into 5 μm sections. After deparaffinization, the sections were immersed in citrate buffer and heated for 15 min, and this was followed by the addition of 3% hydrogen peroxide. Sections were immersed in blocking solution for 10 min and then reacted sequentially with primary antibody (overnight, 4°C) and secondary antibody (10 min, room temperature). The primary and secondary antibodies used are listed in Table 1. The sections were stained using 3,3′-diaminobenzidine chromogenic solution and hematoxylin staining solution. The sectioned tissue was dehydrated, drip-added to a neutral resin, and covered with a coverslip. Target protein staining was observed under a microscope (OLYMPUS, Japan).
Table 1
| Primary antibodies | dilution (IHC/WB) | solvent (IHC/WB) |
|---|---|---|
| Rabbit Anti-Collagen I antibody (ab270993) | 1: 500/1:1,000 | PBS/TBST |
| Rabbit Anti-Collagen III antibody (ab7778) | 1:200/1:5,000 | PBS/TBST |
| Rabbit Anti-CTGF (ab227180) | 1:100/1:1,000 | PBS/TBST |
| Rabbit anti-TGF-β1 (ab170874) | 1:150/1:1,000 | PBS/TBST |
| Mouse anti-MMP2 (ab86607) | 1:200/1:1,000 | PBS/TBST |
| Rabbit anti-MMP9 (ab76003) | 1:1,000/1:5,000 | PBS/TBST |
| Mouse anti-α-SMA (ab7817) | 1:200/1:1,000 | PBS/TBST |
| Rabbit anti-POSTN (ab92460) | 1:200/1:1,000 | PBS/TBST |
| Mouse anti-β-actin (ab8226) | -/1:5,000 | -/TBST |
| Secondary antibodies | Dilution (IHC/WB) | Solvent (IHC/WB) |
| Goat anti-rabbit IgG-HRP (ab7090) | 1:5,000 | PBS/TBST |
| Goat anti-mouse IgG-HRP (ab97040) | 1:5,000 | PBS/TBST |
Primary and secondary antibodies used in immunohistochemical assay and western blot.
CTGF, connective tissue growth factor; HRP, horseradish peroxidase; IHC, immunohistochemistry; MMP, matrix metalloproteinase; PBS, phosphate buffer saline; POSTN, periostin; SMA, smooth muscle actin; TBST, Tris buffered saline tween; TGF, transforming growth factor.
2.5 Western blot
Total protein samples were prepared from the atria using RIPA lysis buffer (CWBIO, China) mixed with 1% PMSF. After the cell lysates were centrifuged, the supernatant containing protein was collected and boiled at 95°C for 10 min. The protein samples were subjected to 10%–15% SDS–PAGE and transferred to a polyvinylidene fluoride membrane (Millipore, USA). Subsequently, nonspecific proteins in the membrane were blocked with 5% nonfat milk, and the target proteins were immunoreacted with primary antibody overnight at 4°C. The membrane was then immersed in a horseradish peroxidase-conjugated secondary antibody for 2 h and subsequently immersed in ECL chemiluminescence liquid (Dingguo Changsheng Biotechnology, Beijing, China). Table 1 lists the primary and secondary antibodies used in this study. The visualized immunoblots of the target proteins were photographed, and their relative expression was analyzed using β-actin as an internal reference.
2.6 MeRIP sequencing
Atria from 30 control rats and 30 CIH rats were subjected to RNA extraction (the atria of every 10 rats were used as test samples), and the extracted RNA was used for MeRIP and RNA sequencing. Total RNA samples were prepared using the Invitrogen TRizol™ Reagent (Thermo Fisher, USA). The RNA quality was examined using an Agilent 2,100 (Agilent Technologies, USA). A total of 10 μg of RNA was mixed with RNA Fragmentation Reagents (Invitrogen, USA) and reacted for 10 min at 70°C to break RNA into fragments of approximately 100 nt. RNA fragments were incubated with a bead-m6A antibody for 4 h for immunoprecipitation using a magna-methylated RNA immunoprecipitation (MeRIP) m6A kit (Merck Millipore, USA). The immunoprecipitated RNA fragments were eluted from the beads, purified with phenol:chloroform:isoamyl alcohol (125:24:1) (Sigma-Aldrich, USA), and subjected to library preparation and high-throughput sequencing by RiboBio (Guangzhou, China) using an Illumina PE150 model on a NovaSeq 6,000 sequencer (Illumina, USA).
The peak calling and differential m6A peak identification were conducted using Package “macs2/exomePeak” (Version 3.8) software. The m6A-modified regions (termed peaks in m6A-IP samples) were analyzed with the corresponding m6A-input samples as the controls. The differential m6A peak was identified as the peak with P < 0.05 and |logFC|>1 and annotated to the RefSeq database (hg19/mm10/m6) using STAR software (version 2.5.3a, Cold Spring Harbor Laboratory, USA) with default parameters. Peak annotation and the m6A binding motif were analyzed using HOMER (version 4.9) (13) and DREME (14). The m6A peaks were visualized using an integrative genomics viewer (IGV) (15) according to the BW file of the sequencing samples. Prediction score distribution along the query sequence was calculated using a sequence-based RNA adenosine methylation site predictor (SRAMP) algorithm (16).
2.7 RNA sequencing
A total of 2 μg of RNAs were used for library preparation for digital mRNA sequencing (mRNA-Seq) using the Ribo-off rRNA Depletion Kit (Human/Mouse/Rat) (Illumina) and the KC-Digital™ Stranded mRNA Library Prep Kit for Illumina® (Wuhan Seqhealth Co., Ltd, China). Library products (200–500 bp) were quantified and subjected to high-throughput sequencing using an Illumina PE150 model on a Novaseq 6,000 sequencer (Illumina). The differentially expressed transcript was defined as the cutoff of P < 0.05 between the CIH group and the control group according to t-test. Heatmaps and volcano plots were constructed for genes with differential m6A peaks and transcripts using ggplot2 software (R foundation, USA). The genes with differential m6A peaks were annotated and received conjoint analysis with the differentially expressed transcript of mRNA-seq to discern the shared genes. The potential functions of the shared genes were explored by Gene Ontology (GO) and Kyoto Encyclopedia of Genes and Genomes (KEGG) functional enrichment analyses using KOBAS3.0 (Peking University, Beijing, China).
2.8 Quantitative real-time polymerase chain reaction (qRT-PCR)
RNA samples were prepared from the atria of control and CIH rats using TRIzol reagent (Thermo Fisher Scientific, USA). RNA quantity was evaluated using a spectrophotometer. The RNA was reverse transcribed using an RT Reagent Kit with gDNA Eraser (TaKaRa, Japan), and the generated cDNA was subjected to real-time PCR using SYBR Green PCR Master Mix (Thermo Fisher Scientific). The primers used are listed in Table 2. The PCR procedure included 40 cycles of denaturation at 95°C for 15 s and annealing and extension at 60°C for 30 s. Relative expression of each mRNA was calculated using the housekeeping gene glyceraldehyde-3-phosphate dehydrogenase as the internal control as per the 2–ΔΔCt method.
Table 2
| Primer | Species | Sequence (5′-3’) | Tm (℃) |
|---|---|---|---|
| GAPDH | Rat | F: AAATGGTGAAGGTCGGTGTGAAC | 58.0 |
| R: CAACAATCTCCACTTTGCCACTG | |||
| METTL3 | Rat | F: CCTCAGATGTTGACCTGGAGATAG | 58.0 |
| R: GACTGTTCCTTGGCTGTTGTG | |||
| METTL14 | Rat | F: GATCGCAGCACCTCGGTCATT | 58.0 |
| R: CCCACTTTCGCAAACATACTCTCC | |||
| WTAP | Rat | F: TTCAAACGATGTGACTGGCTTA | 58.0 |
| R: TCTCCTGTTCCTTGGTTGCTA | |||
| FTO | Rat | F: TGTGGAAGAAGATGGAGAGTGTGA | 58.0 |
| R: GGATCAGGACGGCAGACAGAA | |||
| ALKBH3 | Rat | F: TCCGCAACCAAGACTTACAG | 58.0 |
| R: ACAGGAAGCCAGTGAGGAT | |||
| ALKBH5 | Rat | F: GGGTTCTTATGTTCTTGGCTTTCC | 58.0 |
| R: ATCTCTACTGGCTACTCTGGTGT | |||
| ANGPTL4 | Rat | F: GGGACCTTAACTGTGCCAAGA | 58.0 |
| R: CCGTTGCCGTGGAATAGAGT |
Primers used in real-time PCR.
GAPDH, glyceraldehyde-3-phosphate dehydrogenase; METTL3, methyltransferase 3, N6-adenosine-methyltransferase complex catalytic subunit; METTL14, methyltransferase 14, N6-adenosine-methyltransferase non-catalytic subunit; WTAP, WT1 associated protein; FTO, FTO alpha-ketoglutarate dependent dioxygenase; ALKBH3, alkB homolog 3, alpha-ketoglutarate dependent dioxygenase; ALKBH5, alkB homolog 5, alpha-ketoglutarate dependent dioxygenase; ANGPTL4, angiopoietin like 4.
2.9 Statistical analysis
Data are expressed as the means ± standard error. Statistical evaluations were performed using SPSS 22.0 software, and graphs were drawn using GraphPad Prism version 9.0 (GraphPad Software). The differences between the control and CIH rats were tested using the Student's t-test, and the AF induction rate was compared using the chi-square test in both groups. A p-value of less than 0.05 represents a notable difference between groups.
3 Results
3.1 CIH induces changes in cardiac function and atrial fibrosis in rats
Echocardiography results suggested that ventricular wall motion was significantly reduced in the CIH group (Figure 1a). Echocardiography and caudal artery blood pressure data demonstrated that left atrial diameter (LAD), left ventricular end-diastolic diameter (LVEDD), and left ventricular end-systolic diameter (LVESD) increased and interventricular septal thickness during diastole (IVS-D), interventricular septal thickness during systole (IVS-S), left ventricular posterior wall thickness during diastole (LVPW-D), and left ventricular posterior wall thickness during systole (LVPW-S) decreased in CIH rats (Table 3). The heart weight/tibia length (HW/TL) ratio in the control group was comparable to that in the CIH group was (P = 0.179), confirming that CIH did not induce significant cardiac hypertrophy in our model. The electrical conduction of the left atrial outer membrane in the control group spread in an orderly manner to the surrounding tissues, whereas that in the CIH group was disordered, and the conduction between the left atrial outer membrane and the surrounding tissues was not uniform (Figure 1b). In the statistical analysis, compared to that of control rats, the conduction velocity of the left atrial adventitia in the CIH rats was significantly decreased, whereas the absolute heterogeneity and heterogeneity index were significantly increased (Figure 1c), suggesting that CIH could lead to a decline in the electrical conduction function of the atrial adventitia in rats. The results of AF induction indicated that CIH rats exhibited a higher susceptibility to AF than did control rats (Figures 1d,e). Histopathological analysis demonstrated that the CIH group possessed a disordered atrial tissue structure and a higher degree of fibrosis (Figures 1f,g). Both IHC and western blot results indicated the protein expression levels of fibrosis-associated genes, including matrix metalloproteinase 2 (MMP2), MMP9, collagen type I (Col-I), Col-III, connective tissue growth factor (CTGF), α-smooth muscle actin (α-SMA), transforming growth factor-β (TGF-β), and periostin (POSTN), were significantly upregulated in atrial tissues of CIH rats (Figures 2a–d), further confirming that CIH induces atrial fibrosis.
Figure 1
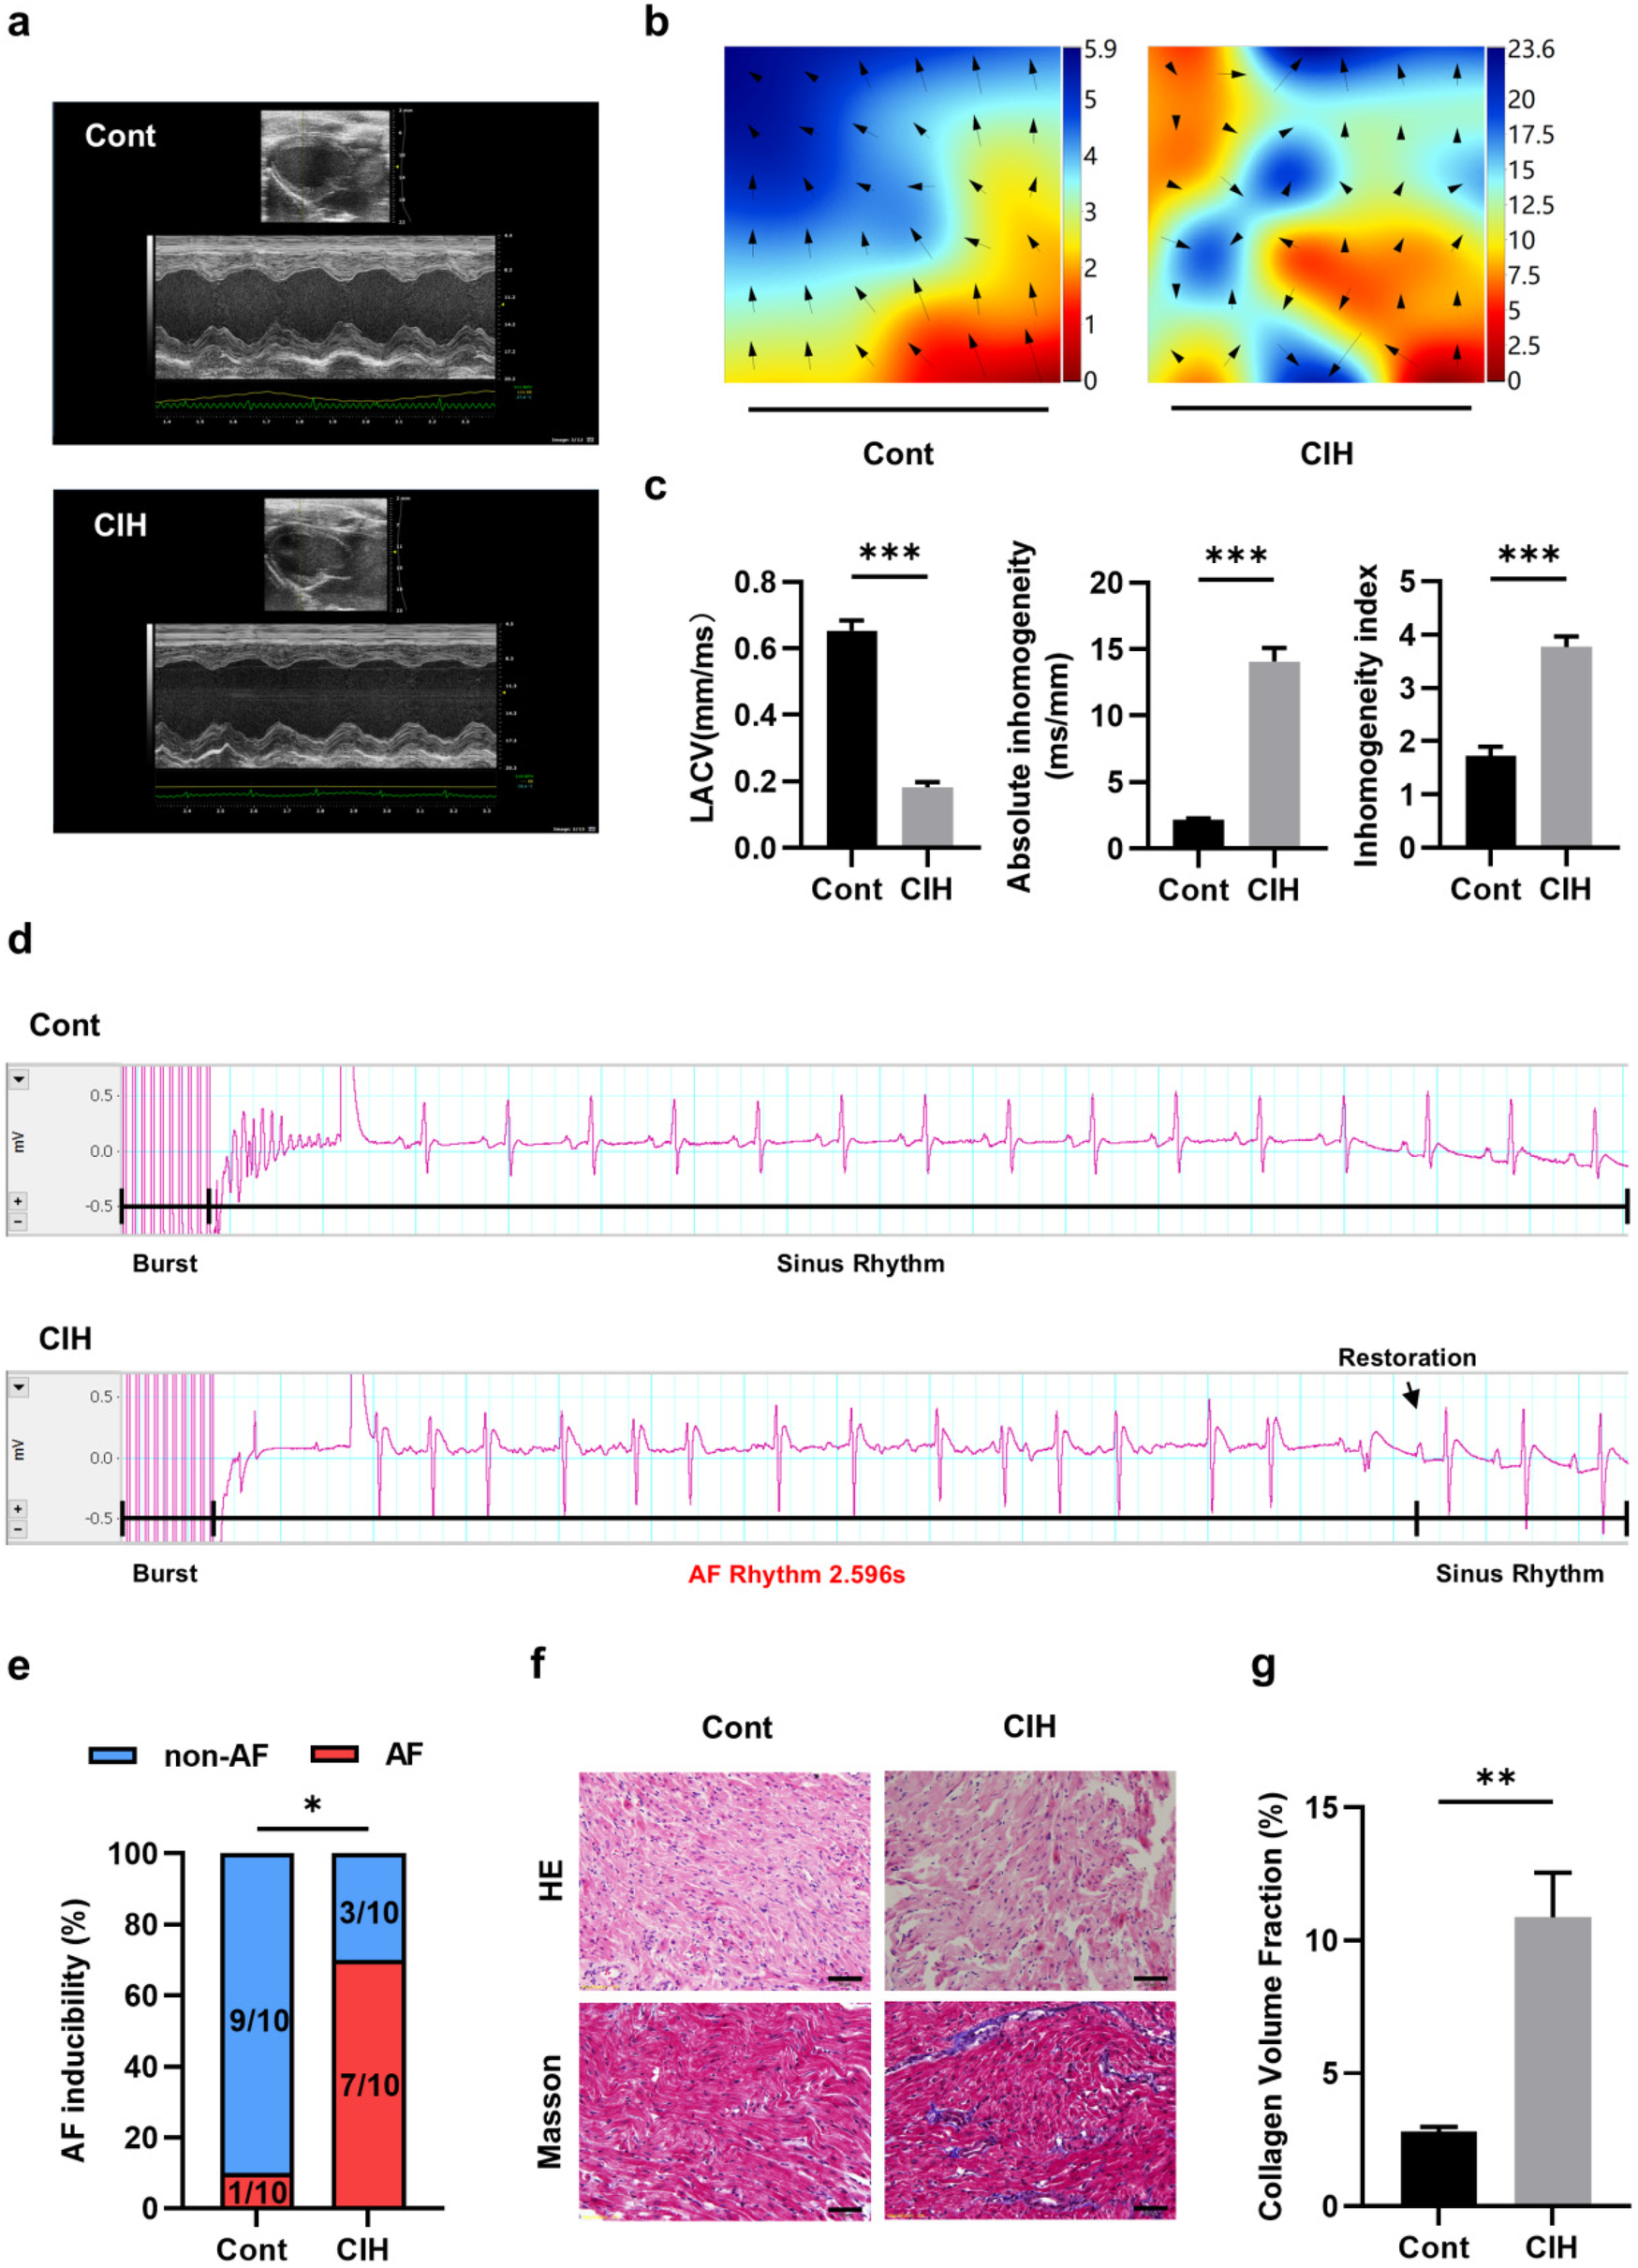
Characteristics of atrial fibrosis in a CIH rat model. (a) Typical echocardiographic images of two groups of rats. (b) Typical diagram of electrical conduction in the epicardial membrane of the left atrium. (c) Statistical results for left atrial conduction velocity, absolute heterogeneity, and heterogeneity index between the two groups (N = 5). ***P < 0.001. (d) Representative ECG of sinus rhythm and AF episodes after burst stimulation. (e) Statistical results for AF induction rate (N = 10). *P < 0.05. (f) Representative images stained with HE and Masson (400×). Scale = 50 μm. (g) Statistical results of atrial fibrosis collagen volume fraction in the two groups (N = 3). **P < 0.01. All data are expressed as mean ± standard error (SEM). The data between the two groups were compared using an unpaired t-test, and the AF induction rates were compared using the chi-square test.
Table 3
| Variables | Cont (n = 15) | CIH (n = 15) | P |
|---|---|---|---|
| LAD (mm) | 4.62 ± 0.40 | 5.00 ± 0.40* | 0.005 |
| IVS-D (mm) | 2.04 ± 0.23 | 1.80 ± 0.13* | <0.001 |
| IVS-S (mm) | 3.13 ± 0.27 | 2.86 ± 0.27* | 0.001 |
| LVEDD (mm) | 7.47 ± 0.59 | 7.84 ± 0.48* | 0.032 |
| LVESD (mm) | 4.26 ± 0.66 | 4.92 ± 0.41* | 0.001 |
| LVPW-D (mm) | 2.18 ± 0.26 | 2.01 ± 0.26* | 0.044 |
| LVPW-S (mm) | 3.29 ± 0.35 | 2.98 ± 0.28* | 0.004 |
| LVvol-D (ul) | 297.50 ± 50.11 | 333.08 ± 43.35* | 0.021 |
| LVvol-S (ul) | 84.43 ± 23.39 | 114.76 ± 22.05* | <0.001 |
| LVEF (%) | 72.03 ± 5.92 | 65.61 ± 3.96* | 0.001 |
| FS (%) | 42.89 ± 5.75 | 37.51 ± 3.13* | 0.001 |
| BP-S (mmHg) | 111.10 ± 1.89 | 132.20 ± 2.61* | <0.001 |
| BP-D (mmHg) | 81.87 ± 3.50 | 105.90 ± 4.60* | 0.002 |
| mPAP (mmHg) | 69.90 ± 2.23 | 66.63 ± 2.92* | 0.002 |
| HW/TL (mg/mm) | 35.15 ± 0.47 | 34.94 ± 0.37 | 0.179 |
Rat echocardiography and caudal artery blood pressure data.
P < 0.05 compared with Cont (n = 15).
BP-D, diastolic blood pressure; BP-S, systolic blood pressure; CIH, chronic intermittent hypoxia; Cont, control; FS, left ventricular fractional shortening; HW/TL, heart weight/tibia length; IVS-D, interventricular septal thickness during diastole; IVS-S, interventricular septal thickness during systole; LAD, left atrial diameter; LVEDD, left ventricular end-diastolic diameter; LVEF, left ventricular ejection fraction; LVESD, left ventricular end-systolic diameter; LVPW-D, left ventricular posterior wall thickness during diastole; LVPW-S, left ventricular posterior wall thickness during systole; LVvol-D, left ventricular volume during diastole; LVvol-S, left ventricular volume during systole; mPAP, mean pulmonary artery pressure.
Figure 2
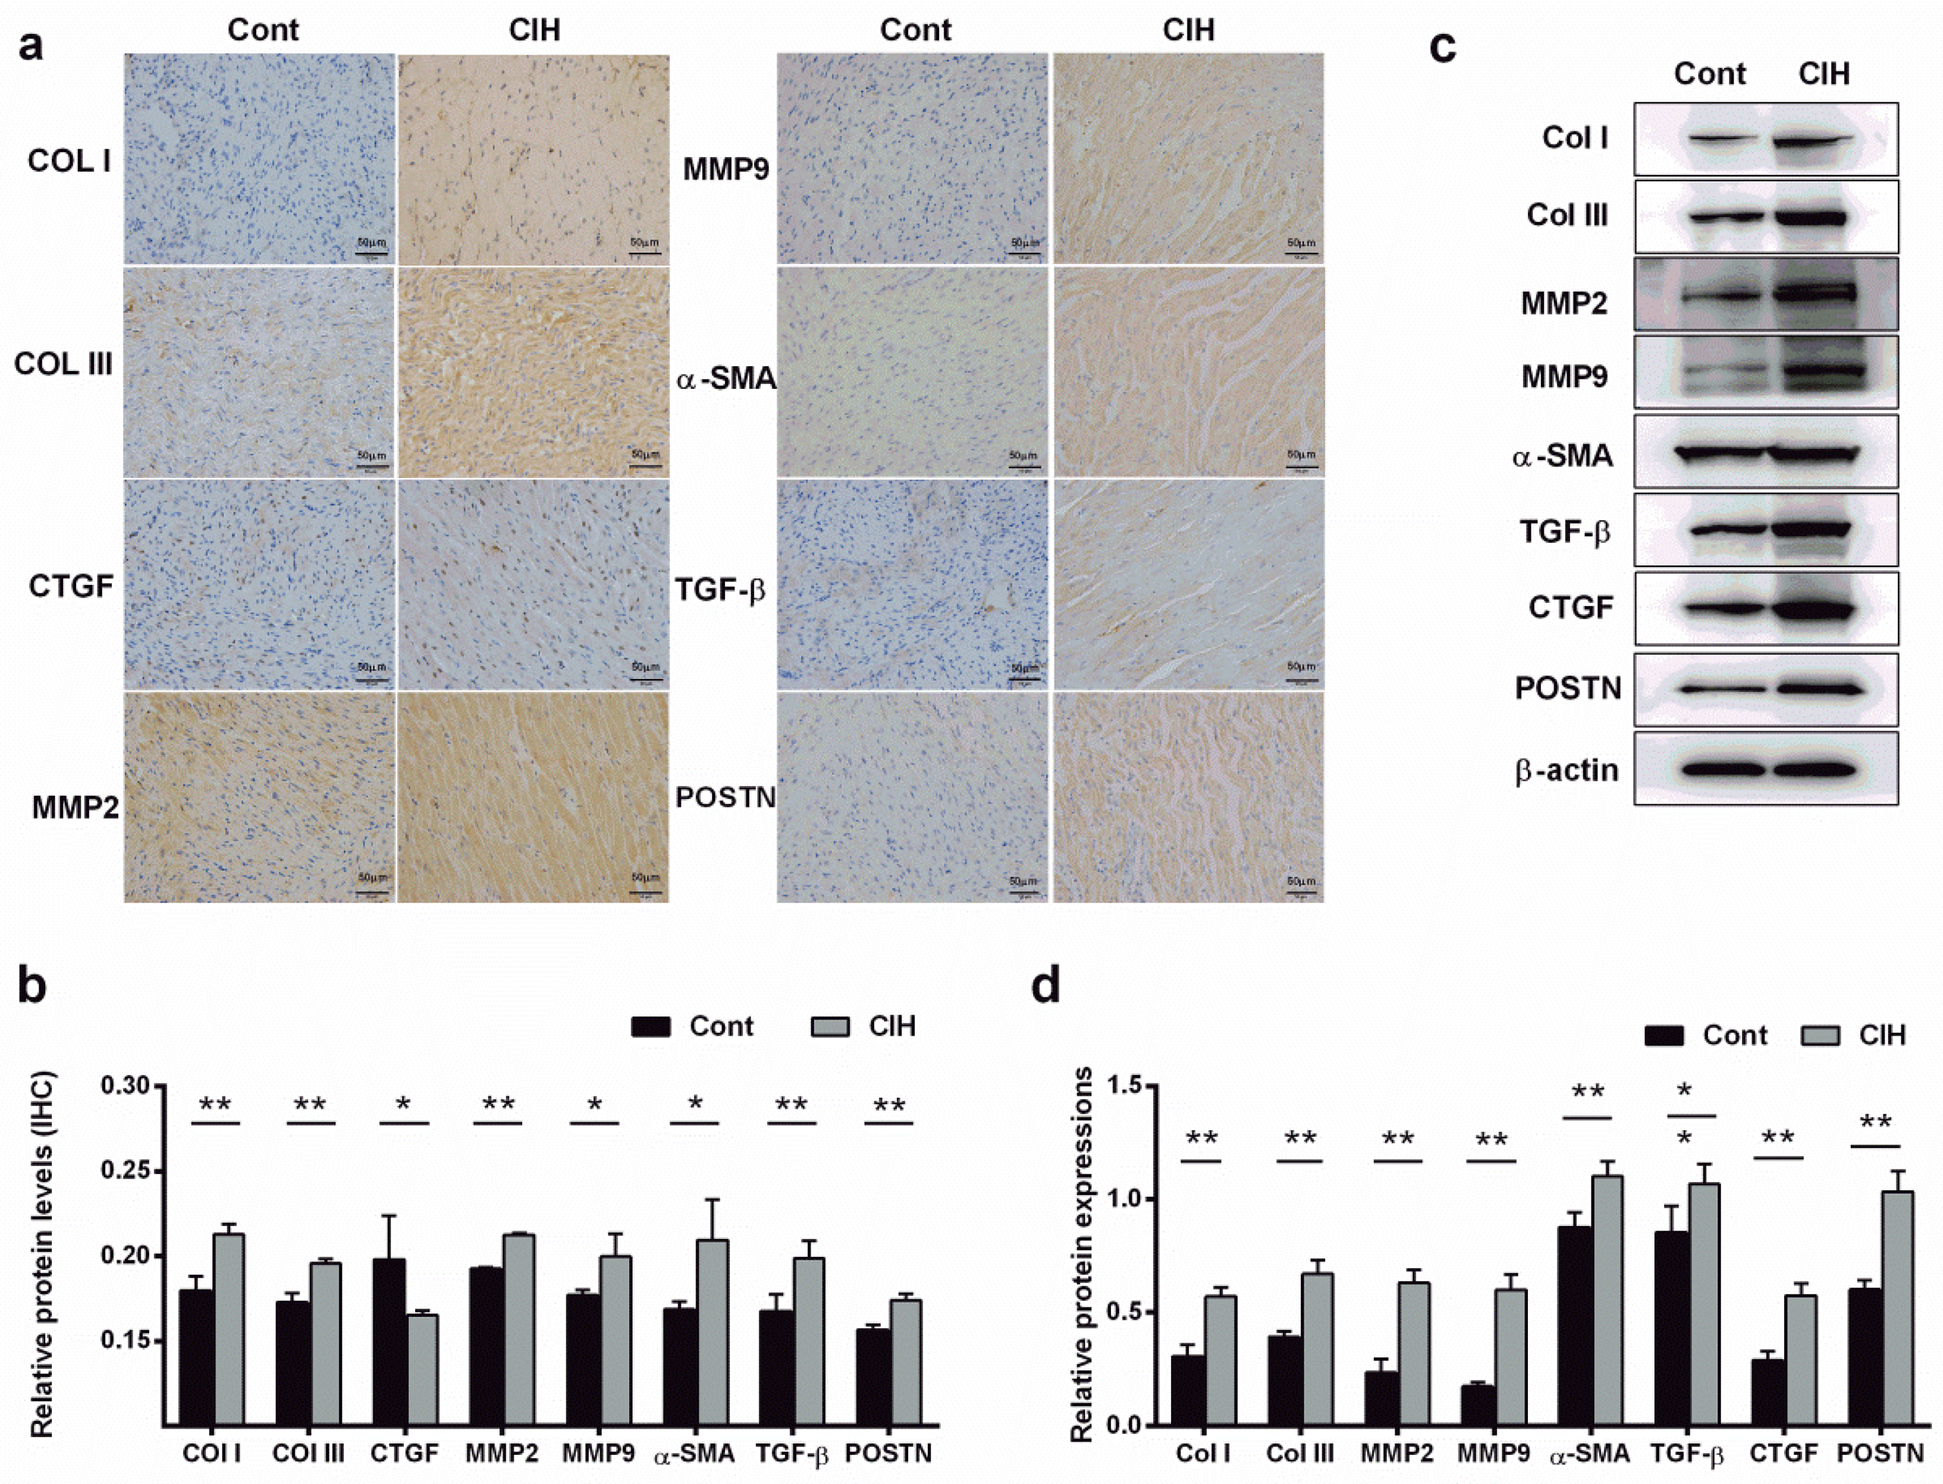
Fibrosis-related proteins are expressed in the fibrotic atrial tissue of CIH rats. (a,b). Expression levels of fibrosis-related proteins were detected by immunohistochemistry (a) and quantified (b) (400×). (c,d) Expression levels of fibrosis-related proteins were detected by western blot (c) and quantified (d). *P < 0.05, **P < 0.01. N = 3; All data are expressed as mean ± standard error (SEM). The data between the two groups were compared using an unpaired t-test.
3.2 Transcriptome-wide MeRIP-Seq reveals the overall characteristics of the m6A peak distributions in control and CIH rats
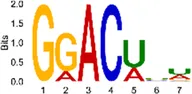
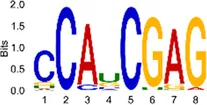
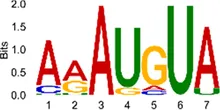
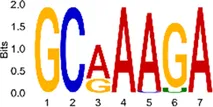
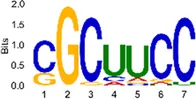
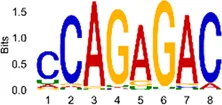
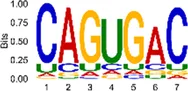
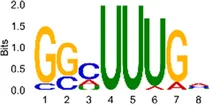
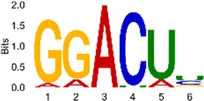
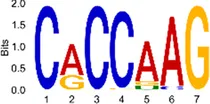
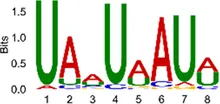
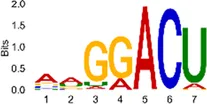
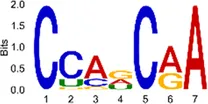
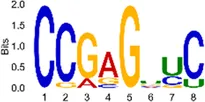
The sequencing data were aligned with the reference genome, and the number and length of m6A peaks were confirmed using TopHat software (v2.0.13) (Table 4). The overall length of the m6A peak varied from 1,173,899 bp to 3, 329, 809 bp in the control and CIH samples. m6A peaks were observably related to two distinct coordinates, including the start of the coding sequence (CDS) and the beginning of the 3′ untranslated region (3′UTR) (Figure 3a). The distribution of m6A peaks in the CIH rats and control rats exhibited the same trend, rising from the 5′ untranslated region (5′UTR) to the beginning of the 3′UTR and descending from the beginning of the 3′UTR to the end of the transcriptome. However, the density of m6A of CIH rats in the 3′UTR region was lower than that of the controls (Figure 3a). The m6A peaks were distributed across the chromosomes (Figure 3b). The control and CIH samples exhibited only 41.32% common peaks (Figure 3c). To methodically assess enrichment, we assigned each m6A peak to one of five non-overlapping transcript segments. As a result, 77.18% of m6A peaks were located within the coding region (introns and exons) (Figure 3d). The m6A motifs concentrated in rats of the control and CIH groups are listed in Table 5.
Table 4
| Sample | PeakNum | AverageLength | MedianLength | TotalLength |
|---|---|---|---|---|
| Cont1_MeRIP | 4,606 | 488.77 | 384 | 2,251,270 |
| Cont2_MeRIP | 3,098 | 405.85 | 305 | 1,257,322 |
| Cont3_MeRIP | 6,433 | 482.75 | 377 | 3,105,556 |
| CIH1_MeRIP | 6,779 | 491.19 | 382 | 3,329,809 |
| CIH2_MeRIP | 5,135 | 402.66 | 299 | 2,067,635 |
| CIH3_MeRIP | 3,177 | 369.50 | 376 | 1,173,899 |
The number and length of peaks across the controls and CIH samples.
Figure 3
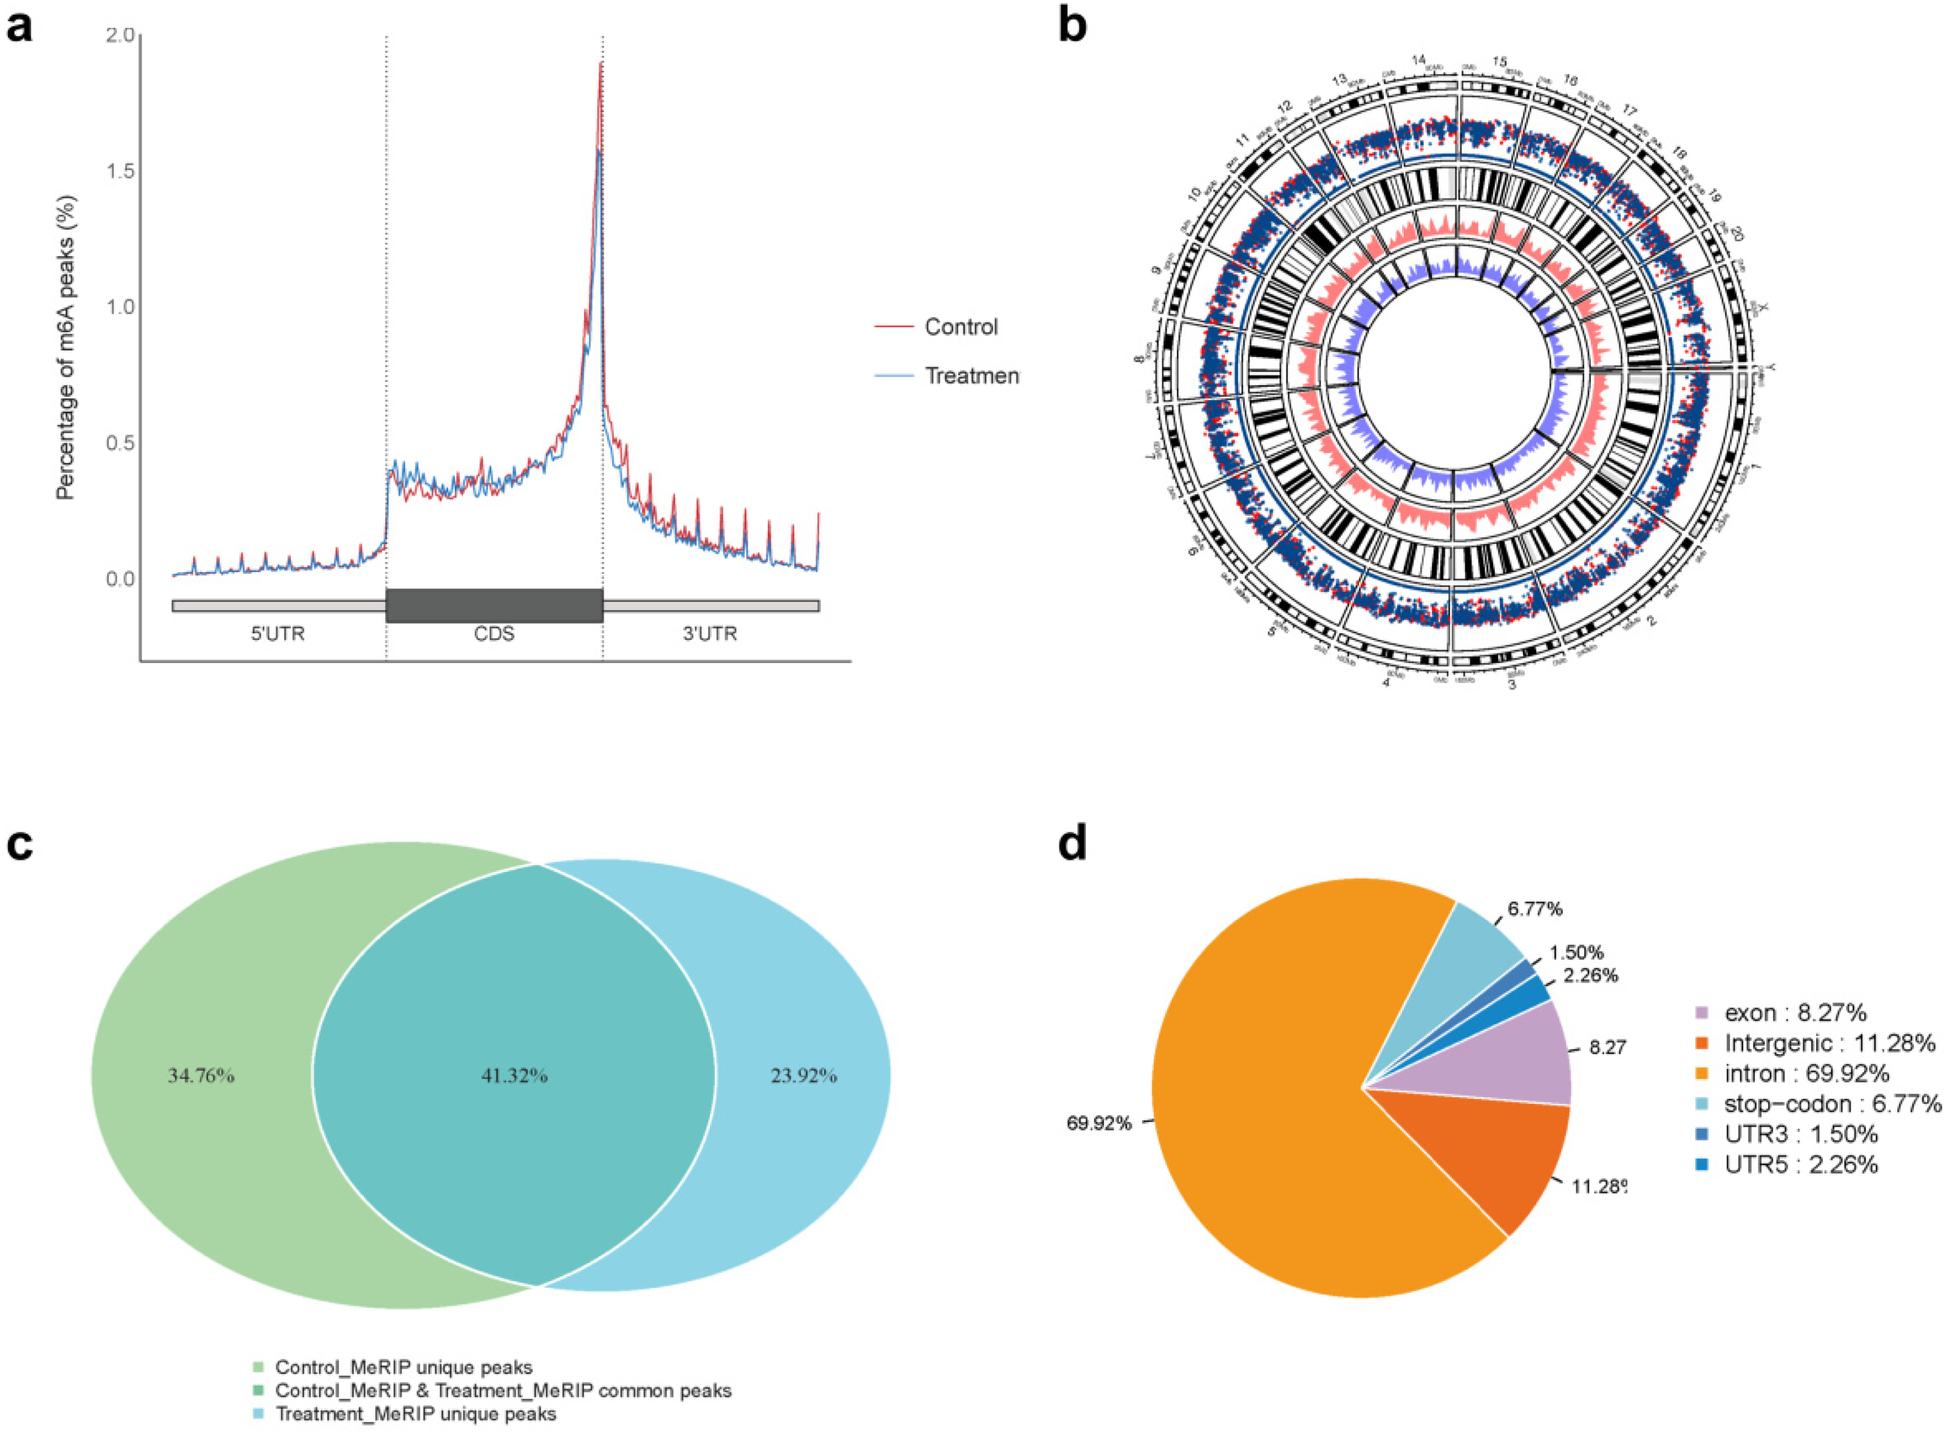
Differential m6A peak analysis between control and CIH rats. (a) m6A peak distributions in the 5′-UTR, CDS, and 3′UTR regions of mRNA. (b) Circos diagram displays the m6A profile over chromosomes. (c) Venn diagram indicates peaks shared by control and CIH rats. (d) Annotated distribution of differential m6A peaks in different gene contexts in CIH rats.
Table 5
| Sample | Motif | ||||
|---|---|---|---|---|---|
| Cont1_MeRIP |
|
|
|
|
|
| Cont2_MeRIP |
|

|
|

|

|
| Cont3_MeRIP |

|
|
|

|
|
| CIH1_MeRIP |
|

|

|

|
|
| CIH2_MeRIP |

|

|

|
|
|
| CIH3_MeRIP |
|
|

|
|
|
Motifs across m6A peaks in control and CIH rats.
3.3 Differential m6A peaks and transcripts were identified in fibrotic atria
The heat map displayed differential m6A methylation peaks in CIH and control atrial tissues (Figure 4a) that included 105 significantly upregulated hyper-methylated m6A peaks and 28 significantly downregulated hypermethylated m6A peaks (fold change >1.3, P < 0.05) (Figure 4b). Table 6 presents the top 20 differential m6A peaks, including the upregulation of LOC100911417, Lyn, Sox5, Cdh20, Ophn1, Zfp654, Sncaip, RGD1304728, Cdh13 and Atrnl1 and the downregulation of Myh911, Myh9, Fgg, Foxe1, Fnip2, RGD1559575, Prokr2, Cpxm2, and Lrrn4. A heat map of differentially expressed transcripts between the control and CIH groups (Figure 4c) included 271 upregulated transcripts and 153 downregulated transcripts (fold change >1.3, P < 0.05) (Figure 4d). Conjoint analysis revealed the co-expression of genes with differential m6A modifications and differentially expressed transcripts, encompassing genes with simultaneous upregulation (10 genes, including Vash2, Angptl4, Slc25a34, Tubb3, Stmn3, Adgra1, LOC102550048, Uchl1, Adgra1, and Lnc215) (Table 7) or downregulation (24 genes, Table 8) and genes with opposite trends (Figure 4e).
Figure 4
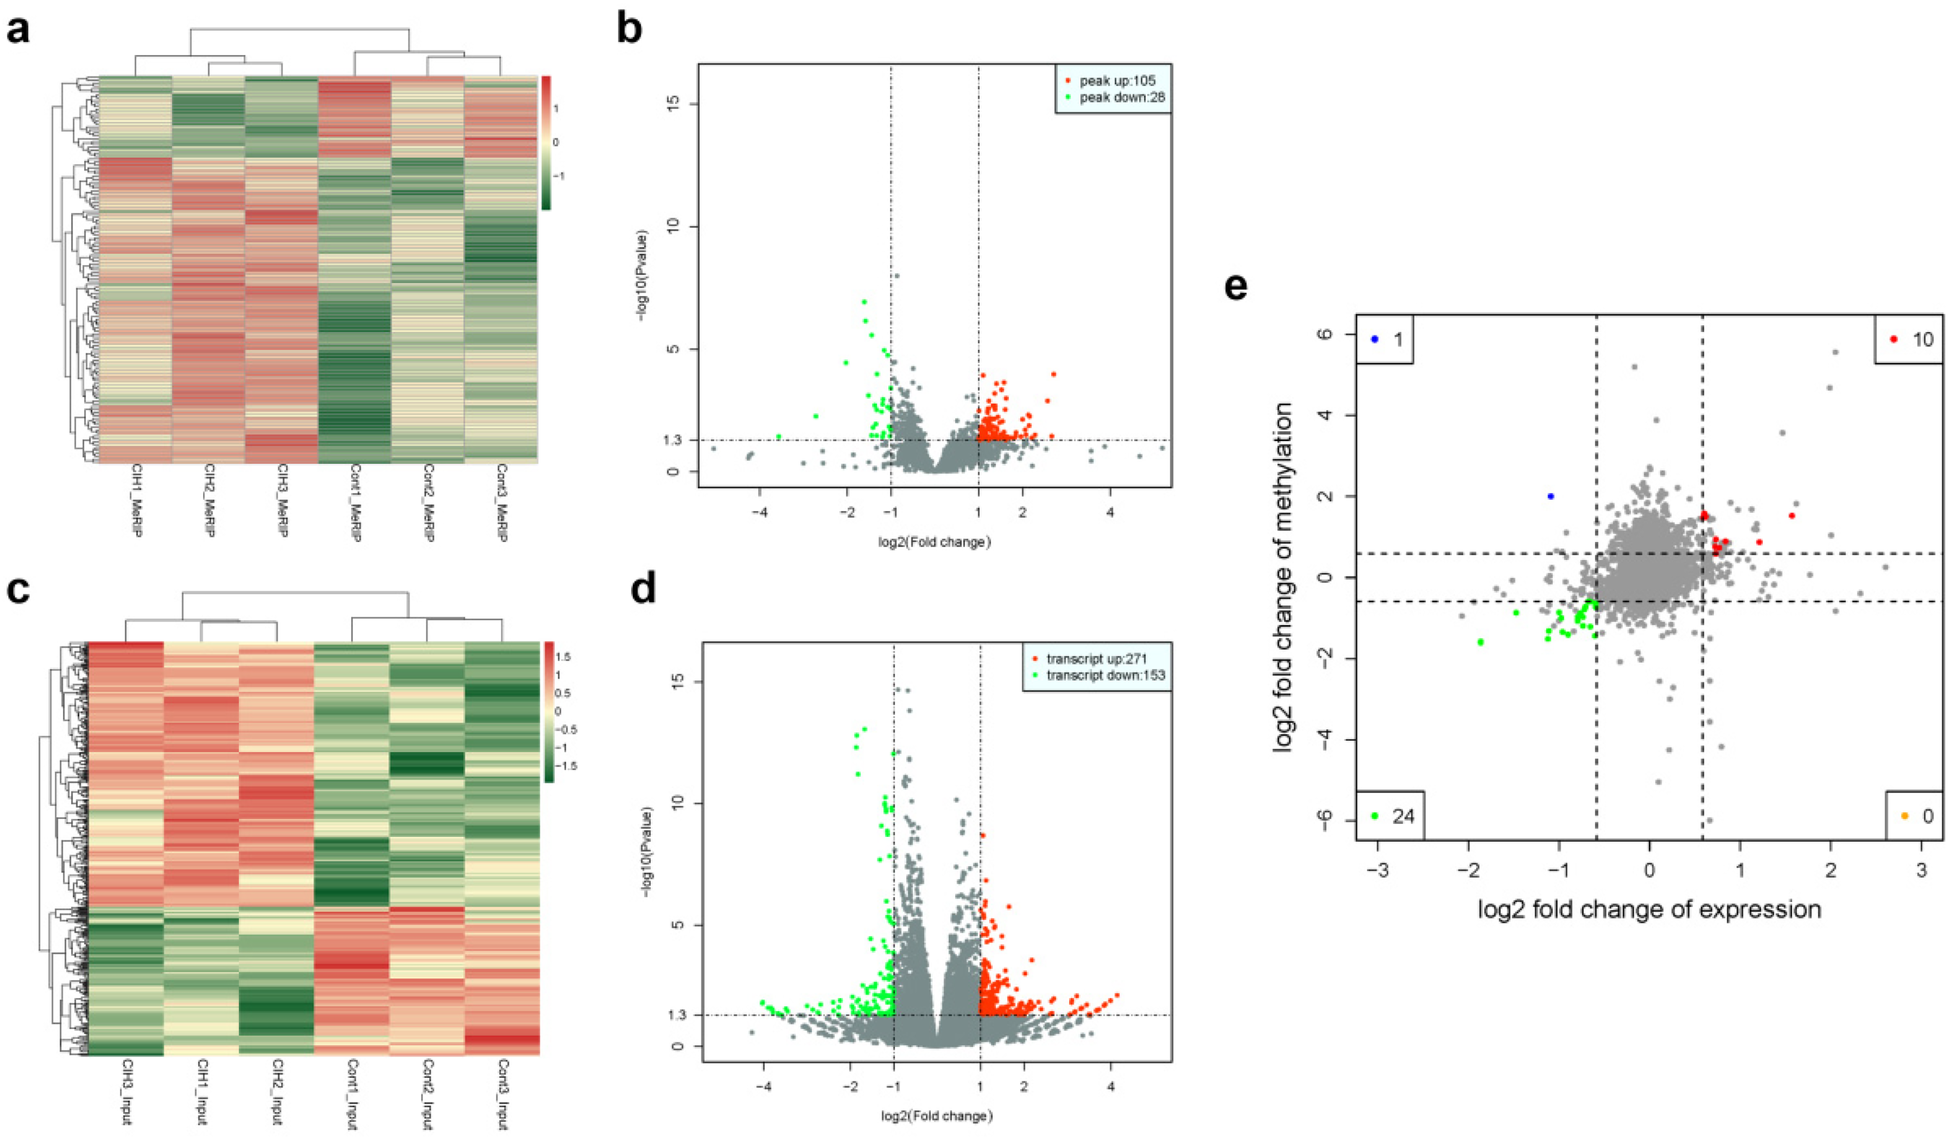
Differential m6A peaks and transcripts. (a) Heat map of differential m6A peaks. (b) Volcano plot of differential m6A peaks. (c) Heat map of differentially expressed transcripts. (d) Volcano plot of differentially expressed transcripts. (e) Conjoint analysis of genes with significant differential m6A peaks and differentially expressed transcripts. Blue and green spots represent significant upregulation or downregulation of m6A. Red and orange spots represent significant upregulation or downregulation of differentially expressed transcripts.
Table 6
| Gene | Gene ID | log2 (FC) | p-value | Chromsome | Start | End | Peak_length | Region |
|---|---|---|---|---|---|---|---|---|
| LOC100911417 | 100,911,417 | 5.55 | 2.96698E-32 | Chr2 | 208,409,630 | 208,409,955 | 325 | Intron |
| Lyn | 81,515 | 2.71 | 0.000106108 | chr5 | 16,552,092 | 16,552,319 | 227 | Intron |
| Sox5 | 140,587 | 2.67 | 0.035706082 | Chr4 | 178,465,843 | 178,466,068 | 225 | Intron |
| Cdh20 | 363,948 | 2.57 | 0.001283526 | chr13 | 24,679,373 | 24,679,641 | 268 | Intron |
| Ophn1 | 312,108 | 2.29 | 0.031507343 | chrX | 68,411,946 | 68,412,172 | 226 | Intron |
| Zfp654 | 288,354 | 2.21 | 0.041795912 | chr11 | 1,860,053 | 1,860,351 | 298 | Intron |
| Sncaip | 307,309 | 2.16 | 0.005538060 | chr18 | 47,784,314 | 47,784,521 | 207 | Intron |
| RGD1304728 | 360,560 | 2.15 | 0.013126615 | chr10 | 58,743,087 | 58,743,344 | 257 | Intron |
| Cdh13 | 192,248 | 2.14 | 0.004824475 | chr19 | 51,755,448 | 51,755,881 | 433 | Intron |
| Atrnl1 | 307,992 | 2.08 | 0.031315912 | chr1 | 278,758,829 | 278,759,088 | 259 | Intron |
| Myh9l1 | 25,745 | −5.99 | 0.028731061 | chr7 | 118,771,251 | 118,771,452 | 201 | Intron |
| Sphkap | 316,561 | −2.17 | 0.005460955 | chr9 | 89,329,233 | 89,329,480 | 247 | Intergenic |
| Myh9 | 69,709 | −2.03 | 0.000035899 | chr7 | 119,001,887 | 119,002,109 | 222 | Exon |
| Fgg | 24,367 | −1.61 | 1.18247E-07 | chr2 | 181,993,531 | 181,993,729 | 198 | Stop-codon |
| Foxe1 | 192,274 | −1.51 | 0.000780637 | chr5 | 61,954,825 | 61,955,407 | 582 | UTR5 |
| Fnip2 | 310,538 | −1.44 | 0.032957645 | chr2 | 178,235,032 | 178,235,233 | 201 | Intron |
| RGD1559575 | 287,231 | −1.44 | 2.67012E-06 | chr10 | 34,241,724 | 34,242,067 | 343 | Exon |
| Prokr2 | 192,649 | −1.41 | 0.015628763 | chr3 | 125,009,082 | 125,009,317 | 235 | Stop-codon |
| Cpxm2 | 293,566 | −1.37 | 0.001974051 | chr1 | 204,049,691 | 204,049,942 | 251 | Stop-codon |
| Lrrn4 | 311,443 | −1.34 | 0.011311799 | chr3 | 125,522,949 | 125,523,654 | 705 | UTR3 |
The top 20 differently methylated m6A peaks.
Table 7
| Gene | m6A | Transcriptome | ||||
|---|---|---|---|---|---|---|
| PeakID | log2FC | p-value | Region | log2FC | p-value | |
| Vash2 | diff_1479 | 1.58 | 0.0002282 | Stop-codon | 0.60 | 0.0012495 |
| Angptl4 | diff_813 | 1.52 | 0.0004499 | Stop-codon | 1.57 | 0.0007552 |
| Slc25a34 | diff_258 | 0.87 | 0.0007739 | Exon | 1.21 | 0.0098501 |
| Tubb3 | diff_2333 | 0.73 | 0.0008939 | Intron | 0.77 | 0.0105064 |
| Stmn3 | diff_2666 | 0.89 | 0.0012626 | Exon | 0.84 | 0.0005739 |
| Adgra1 | diff_16 | 0.94 | 0.0054963 | Stop-codon | 0.73 | 0.0001413 |
| LOC102550048 | diff_2271 | 1.48 | 0.0098805 | Intergenic | 0.59 | 0.0224413 |
| Uchl1 | diff_2765 | 0.75 | 0.0104990 | Exon | 0.73 | 0.0011816 |
| Adgra1 | diff_3233 | 0.59 | 0.0209435 | Exon | 0.73 | 0.0001413 |
| Lnc215 | diff_1740 | 1.49 | 0.0348945 | Intron | 0.62 | 0.0000654 |
Transcript and m6A methylation levels of upregulated genes in conjoint analysis of MeRIP-seq and RNA-seq.
Table 8
| Gene | m6A | Transcriptome | ||||
|---|---|---|---|---|---|---|
| PeakID | log2FC | p-value | Region | log2FC | p-value | |
| LOC103689965 | diff_1003 | −0.86 | 1.02357E-08 | Exon | −1.00 | 0.0004826 |
| Fgg | diff_2713 | −1.61 | 1.18247E-07 | Stop-codon | −1.86 | 4.87849E-13 |
| Fgg | diff_3621 | −1.58 | 7.06631E-07 | Intron | −1.86 | 4.87849E-13 |
| RGD1559575 | diff_159 | −1.44 | 2.67012E-06 | Exon | −0.60 | 0.0001878 |
| Bicdl1 | diff_124 | −1.07 | 0.0000176 | Exon | −0.79 | 5.45330E-07 |
| Bicdl1 | diff_1850 | −0.94 | 0.0000359 | Intron | −0.76 | 1.01410E-06 |
| Nat8f3 | diff_3209 | −1.32 | 0.0001035 | Stop-codon | −.1.11 | 2.66972E-06 |
| Adgre1 | diff_2634 | −0.88 | 0.0002351 | Intron | −0.76 | 1.20141E-11 |
| Chst4 | diff_105 | −1.00 | 0.0003884 | Exon | −0.97 | 8.31112E-09 |
| Foxe1 | diff_173 | −1.51 | 0.0007806 | UTR5 | −1.12 | 0.0080070 |
| RT1-A2 | diff_2086 | −0.64 | 0.0008495 | Intron | −0.60 | 0.0000216 |
| Bicdl1 | diff_3477 | −1.00 | 0.0012325 | Exon | −0.79 | 5.45330E-07 |
| Rspo1 | diff_232 | −0.72 | 0.0014418 | UTR5 | −0.71 | 0.0003025 |
| RT1-A2 | diff_2085 | −0.73 | 0.0017619 | Intron | −0.60 | 0.0000216 |
| Chrdl1 | diff_2955 | −1.19 | 0.0017635 | Intron | −0.73 | 5.16063E-06 |
| Bicdl1 | diff_723 | −0.97 | 0.0018116 | Exon | −0.79 | 5.45330E-07 |
| Crb2 | diff_3380 | −1.21 | 0.0035803 | Exon | −0.65 | 0.0020231 |
| Anxa1 | diff_1647 | −0.59 | 0.0035881 | Intron | −0.67 | 2.23240E-15 |
| Lrrn4 | diff_268 | −1.34 | 0.0113118 | UTR3 | −0.96 | 0.0027670 |
| Prokr2 | diff_647 | −1.41 | 0.0156288 | Stop-codon | −0.90 | 0.0066046 |
| Chrdl1 | diff_2782 | −0.97 | 0.0216582 | Intron | −0.73 | 5.16063E-06 |
| C6 | diff_2496 | −0.60 | 0.0283728 | Intron | −0.65 | 1.80917E-08 |
| Cd2 | diff_1896 | −0.79 | 0.0354323 | Exon | −0.72 | 0.0458585 |
| Gal3st2 | diff_726 | −0.87 | 0.0467916 | Exon | −1.47 | 0.0000998 |
Transcript and m6A methylation levels of downregulated genes in conjoint analysis of MeRIP-seq and RNA-seq.
3.4 Functional enrichment analysis
To define the potential role of genes with differential m6A peaks and transcripts in CIH rats, functional enrichment of GO and KEGG pathways was observed. GO exploration revealed that the genes with differential m6A peaks in CIH rats were significantly related to calcium ion transport-related pathways such as calcium channel complex, regulation of calcium ion transport into the cytosol, and release of sequestered calcium ions into the cytosol by endoplasmic reticulum and sarcoplasmic reticulum (Figure 5a). KEGG pathway exploration revealed that these genes were significantly related to protein digestion and absorption, phosphatidylinositol—3—kinase—Protein kinase B (PI3K-AKT) signaling pathway, and ECM receptor interaction (Figure 5b). As for differentially expressed transcripts, GO exploration indicated that these genes were significantly enriched in the receptor regulatory response (Figure 5c), and KEGG pathway annotation demonstrated that these genes were relevant to the toll-like receptor and peroxisome proliferator—activated receptor (PPAR) signaling pathways (Figure 5d).
Figure 5
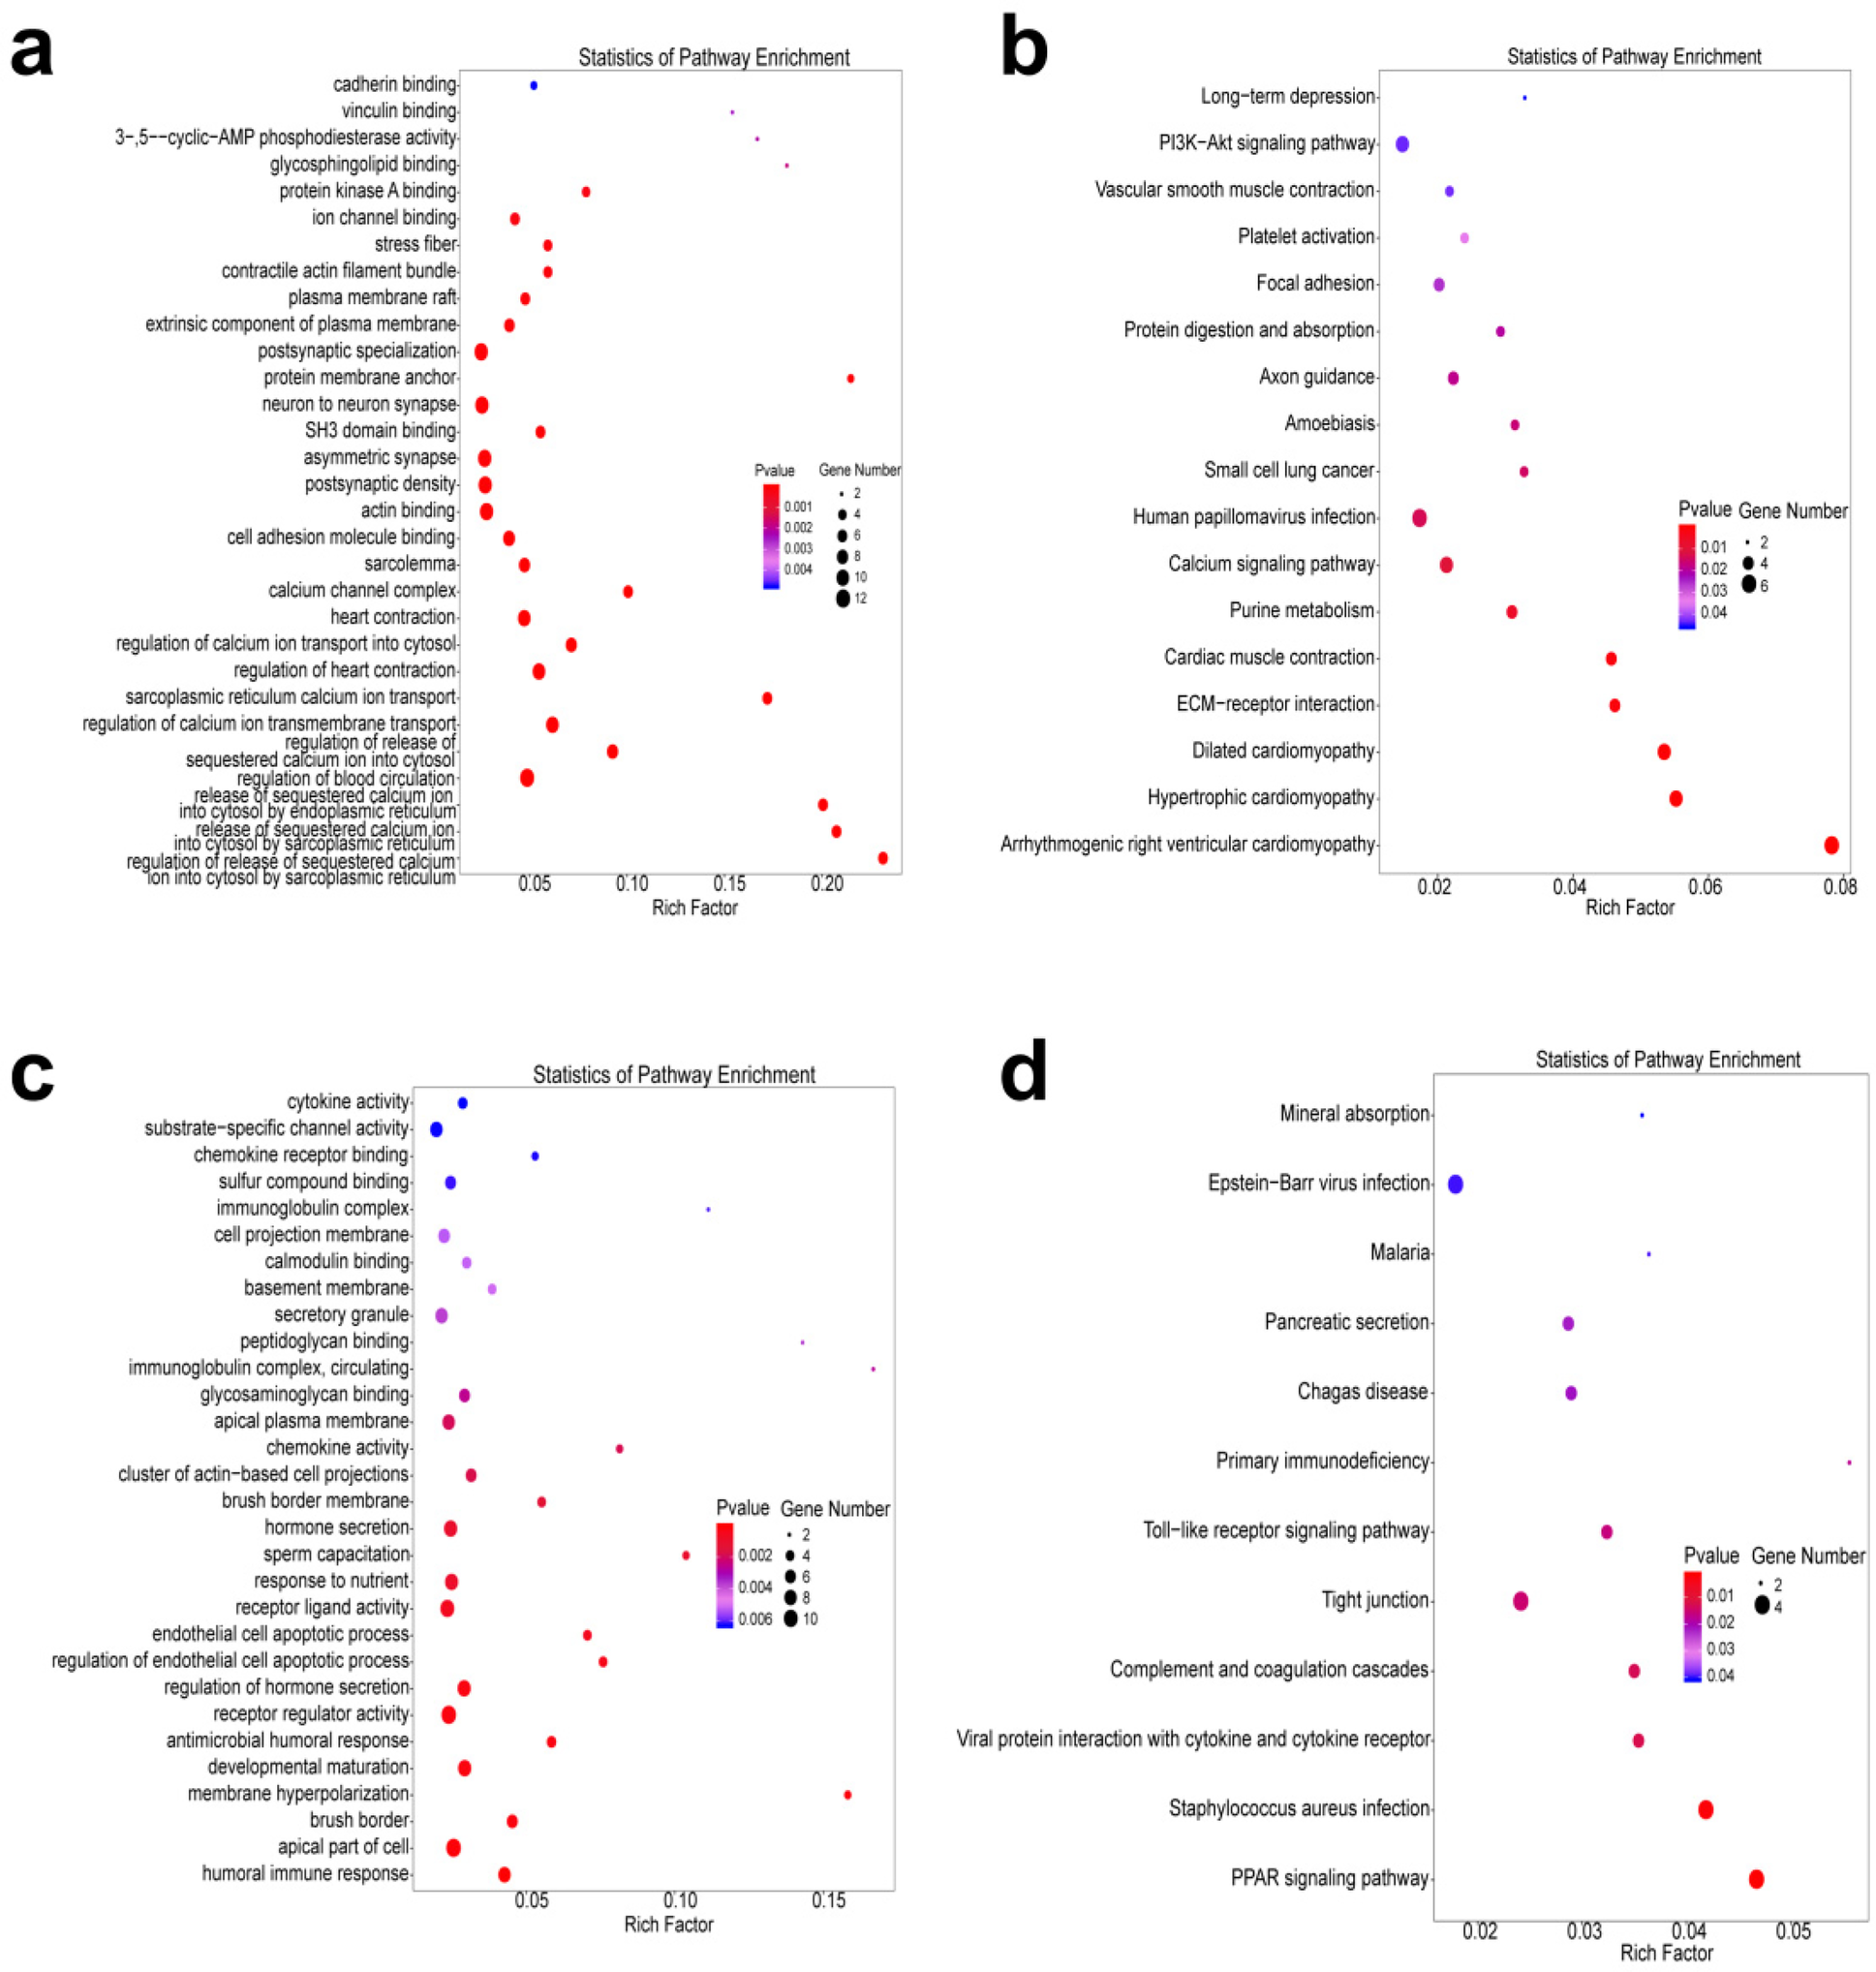
Functional enrichment analysis. (a,b) GO bubble chart (a) and KEGG bubble chart (b) of genes with increased m6A peaks. (c,d) GO bubble chart (c) and KEGG bubble chart (d) of differentially expressed transcripts. The size of the dots indicates the number of genes with differential m6A peaks or transcripts. The color of the dots corresponds to different P values.
3.5 The visual representation of m6A
ANGPTL4 (angiopoietin like 4) that is located on chromosome 7 and appears to increase m6A peaks and transcripts in conjoint analysis was selected to verify m6A methylation distribution. As reported by IGV, the m6A modifications of ANGPTL4 mRNA differed between the control and CIH rats (Figure 6a). SRAMP identified 39 m6A sites in the ANGPTL4 mRNA sequence, with seven sites possessing the highest probability scores (Figure 6b). We further compared the expression of ANGPTL4 and six key regulatory enzymes that modulate dynamic m6A modifications in control and CIH rats. The results revealed that four m6A regulatory enzymes (METTL3, METTL14, WT1 associated protein (WTAP), and FTO (FTO alpha-ketoglutarate dependent dioxygenase)) and ANGPTL4 were upregulated in CIH rats, whereas no significant differences in the expression of two m6A regulatory enzymes, ALKBH3 (alkB homolog 3, alpha-ketoglutarate dependent dioxygenase) and ALKBH5, were observed (Figure 6c).
Figure 6
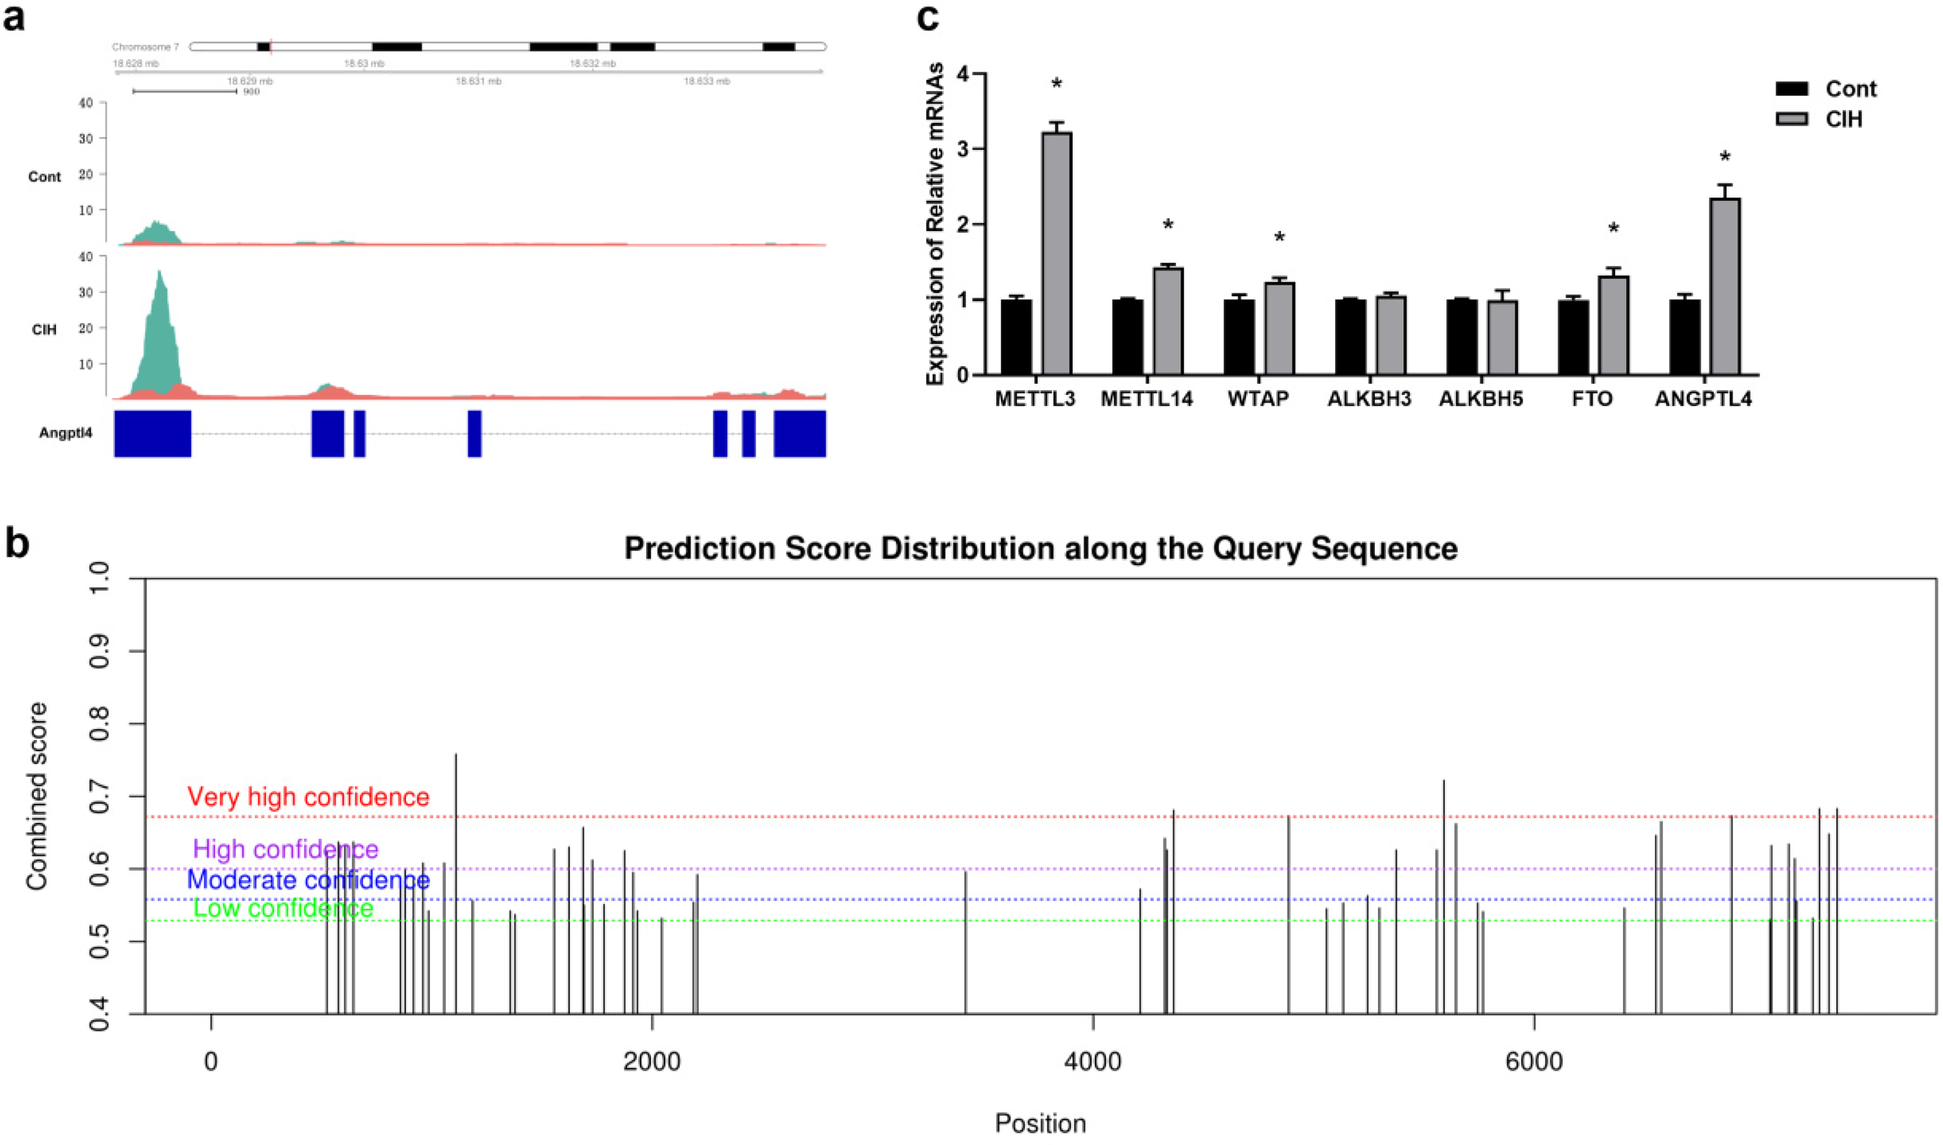
Validation of m6A modification in CIH rat atrial tissues. (a) Visualized tracks of m6A modifications of ANGPTL4 mRNA (located in Chromosome 7) in control and CIH rats using Integrative Genomics Viewer (IGV). (b) RNA adenosine methylation site predictor (SRAMP) algorithm analyzed the prediction score distributions along the query sequence. Y axis indicates the combined score at different levels of high (H), moderate (M), and low (L) probability. Vertical bars indicate the score for m6A sites. The X-axis indicates the Chromosome 7 genome in base pair resolution. (c) qRT-PCR was performed to determine the expression levels of six key regulatory enzymes that modulate dynamic m6A modification and ANGPTL4. *P < 0.05.
4 Discussion
Over the past few years, due to the ubiquitous m6A methylation of mRNA, its role in disease-related biological processes (including proliferation, metabolism, immunity, and apoptosis) has attracted wide attention. Accumulating evidence has revealed that m6A is associated with fibrosis. Specifically, the enzymes involved in the regulation of m6A improve or promote fibrosis progression by regulating the translation of target genes (particularly in the liver, kidney, lung, and myocardial tissues where fibrosis often occurs) (17–19). These findings highlight the important function of m6A in the biological progression of fibrosis and its potential as a therapeutic target. In the present study, based on MeRIP-Seq detection of atrial fibrosis tissues in CIH rats, we observed that high m6A methylation and low m6A methylation corresponded to high and low expression of transcripts, respectively, and these genes are related to the pathway of atrial fibrosis. We believe that revealing the relationship between m6A methylation and atrial fibrosis will help to clarify the pathological mechanism of atrial fibrosis and offer a potential basis for disease-modifying strategies.
m6A methylation occurs in coding sequences (CDS) and non-coding regions (3′UTR and 5′UTR) in eukaryotic mRNAs. When occurring in the 5′UTR and 3′UTR of mRNA, m6A is associated with the functional controls such as translation initiation, mRNA precursor cleavage, mRNA structural stability, and mRNA transport, while the m6A methylation modification in the CDS region is used to maintain mRNA stability (20). Our MeRIP-seq results yielded the largest proportion of m6A peaks in the CDS and the richest m6A peak in the stop codon region (a region close to the 3′UTR and CDS), and this is consistent with a previous report (21). As m6A is related to mRNA pre-splicing, nuclear export, and mRNA stability, m6A modification has been observed to be positively related to transcript abundance (22, 23). In this study, we identified 10 upregulated and 24 downregulated differentially expressed m6A peaks and transcripts using conjoint analysis. Overall, these results indicated the involvement of m6A in atrial fibrosis.
Functional analysis of genes with differential m6A peaks and transcripts between CIH and control rats indicated that the genes were functionally relevant to calcium ion transport-related pathways, the PI3K-AKT signaling pathway, ECM receptor interaction, receptor regulatory response, the toll-like receptor signaling pathway, and the PPAR signaling pathway, and this may constitute the potential mechanism of atrial fibrosis. The molecular mechanisms involved in atrial fibrosis are highly complex and involve multiple biological events such as Ca2+ homeostasis dysregulation, ECM dysregulation, and signal transduction (24). Abnormal Ca2+ processing and increased sarcoplasmic reticulum release rate are the main causes of arrhythmia in patients with AF, and the effect of Ca2+ changes on AF has also been reported (25, 26). Alterations in Ca2+ homeostasis have recently been proposed to play an important role in the pathogenesis of atrial fibrosis. When AF and fibrosis risk factors (such as hypertension and diabetes) change, Ca2+-handling dysfunction and calpain activity also change, and the maintenance of Ca2+ homeostasis helps to improve atrial remodeling and the incidence of AF (27, 28). In addition to Ca2+ homeostasis, ECM-receptor interaction, an important intracellular biological event that mediates the interaction between the ECM and cells and affects cell migration, adhesion, proliferation, differentiation, and other cellular activities, is also important during atrial fibrosis. Transmembrane proteins that mediate this process, primarily integrins, proteoglycans, and others, play a role in regulating atrial fibrosis (29, 30). Additionally, several signaling pathways have also been determined to be engaged in the process of atrial fibrosis (24). In the present study, we observed that genes with m6A modification were enriched in the PI3K-AKT signaling pathway and PPAR signaling pathway. The PI3K-AKT signaling pathway is a vital pathway involved in fibrosis stimulation and is active in the kidney, liver, and heart (31–33). Activation or inhibition of PI3K-AKT-mediated pathway components can result in varying effects on atrial fibrosis (34, 35). PPARs are a family of ligand-activated nuclear hormone receptors consisting of three homologous members, PPARα, PPARβ/δ, and PPARγ, that affect the expression of genes correlated with energy metabolism, cell development, and differentiation. In a study investigating atrial fibrosis, activation of PPARγ by pioglitazone can improve the atrial structural and electrophysiological remodeling caused by diabetes (36). PPARα was inhibited in the AF mouse model induced by AngII. Activation of PPARα by clofibric acid can reverse atrial fibrosis in mice (37). Taken together, these results suggest that m6A methylation is involved in the process of atrial fibrosis through a variety of mechanisms.
Interestingly, our results revealed that angiopoietin-like protein 4 (ANGPTL4), a multifunctional secreted protein, possesses multiple m6A modification sites and is significantly upregulated in rats subjected to CIH. ANGPTL4 participates in the modulation of lipid metabolism and angiogenesis in a variety of tissues and has been observed to play a role in cardiovascular diseases, with abnormal lipid metabolism as a risk factor (38). Accumulating evidence suggests an interaction between fibrosis regulatory factors and lipid metabolism (39). In recent years, ANGPTL4 has been observed to be significantly upregulated in the tissues of animal fibrosis models (including the kidneys and lungs) (40, 41). These results are consistent with our detection of ANGPTL4 expression in CIH tissues. In terms of mechanism, in a study based on a non-alcoholic steatohepatitis mouse model, ANGPTL4 deficiency could lead to the accumulation of free cholesterol, thereby promoting the progression of liver fibrosis (42). A study based on an AngII-induced atrial fibrosis cell model in vitro reported that ANGPTL4 may inhibit fibrosis via downregulating PPARγ, AKT, and others (43). Therefore, the role of ANGPTL4 up-regulation in atrial fibrosis requires further exploration.
This study has several limitations that should be acknowledged. First, our research was conducted exclusively using a CIH-induced rat model of atrial fibrosis. While CIH is a well-validated model for this pathology (12), the findings may not fully generalize to other etiologies of atrial fibrosis, which warrants verification in multiple animal models in future studies. Second, we focused on transcriptomic-level changes in m6A modification and its correlation with gene expression in whole left atrial tissue, but lacked identification of the specific cell type involved in m6A methylation. Third, although we identified ANGPTL4 as a key m6A-modified gene upregulated in CIH induced atrial fibrosis, its cell-specific function was not explored. Fourth, the mechanism by which m6A modification regulates target gene expression was not explored in depth. Despite these limitations, our findings provide novel insights into the epitranscriptomic regulation of atrial fibrosis and lay a foundation for subsequent mechanistic and translational research.
5 Conclusions
In summary, the findings of the current study confirm that m6A methylation is essential for atrial fibrosis and is associated with the abnormal elevation of enzymes regulating m6A modification, including METTL3, METTL14, WTAP, and FTO, exerting a regulatory effect on fibrosis-related pathways, including calcium transport-related pathways, through target proteins. However, the specific targets and exact mechanisms of m6A modifications in atrial fibrosis require further investigation and verification.
Statements
Data availability statement
The datasets presented in this study can be found in online repositories. The name of the repository and accession number are as follows: NCBI Sequence Read Archive (SRA), https://www.ncbi.nlm.nih.gov/sra/, accession number PRJNA1175848.
Ethics statement
The animal study was approved by the Laboratory Animal Ethics Committee of Tianjin Medical University. The study was conducted in accordance with the local legislation and institutional requirements.
Author contributions
TG: Data curation, Funding acquisition, Writing – original draft. SQ: Data curation, Writing – review & editing. XC: Data curation, Writing – review & editing. JL: Data curation, Writing – review & editing. XX: Data curation, Writing – review & editing. TG: Data curation, Writing – review & editing. HW: Data curation, Writing – review & editing. PS: Writing – original draft. SG: Data curation, Writing – original draft. WS: Writing – original draft. WW: Data curation, Writing – original draft. HZ: Data curation, Writing – original draft. ZZ: Data curation, Writing – original draft. LW: Writing – review & editing. XL: Funding acquisition, Writing – review & editing.
Funding
The author(s) declare that financial support was received for the research and/or publication of this article. This work was sponsored by Tianjin Health Research Project (Grant No. TJWJ2023MS007), Central guidance for local scientific and technological development funding project (Grant No. 246Z7719G) and Tianjin Key Medical Discipline Construction Project (TJYXZDXK-3-006B).
Acknowledgments
The authors thank the Guangzhou RiboBio Co., Ltd. (Guangzhou, China) for providing high-throughput sequencing services and bioinformatics analysis.
Conflict of interest
The authors declare that the research was conducted in the absence of any commercial or financial relationships that could be construed as a potential conflict of interest.
Generative AI statement
The author(s) declare that no Generative AI was used in the creation of this manuscript.
Any alternative text (alt text) provided alongside figures in this article has been generated by Frontiers with the support of artificial intelligence and reasonable efforts have been made to ensure accuracy, including review by the authors wherever possible. If you identify any issues, please contact us.
Publisher’s note
All claims expressed in this article are solely those of the authors and do not necessarily represent those of their affiliated organizations, or those of the publisher, the editors and the reviewers. Any product that may be evaluated in this article, or claim that may be made by its manufacturer, is not guaranteed or endorsed by the publisher.
Supplementary material
The Supplementary Material for this article can be found online at: https://www.frontiersin.org/articles/10.3389/fcvm.2025.1670859/full#supplementary-material
Abbreviations
AF, atrial fibrillation; 3′UTR, 3′ untranslated region; 5′UTR, 5′ untranslated region; m6A, adenosine N(6) methylation; ANGPTL4, angiopoietin-like protein 4; CIH, intermittent hypoxia; CDS, coding sequence; CV, conduction velocity; DEG, differentially expressed gene; GO, gene ontology; MAPK, mitogen-activated protein kinase; mRNA, messenger RNA; m6A, N6-methyl-adenosine; ECM extracellular matrix; MeRIP-seq, methylated RNA immunoprecipitation sequencing; mRNA-Seq, mRNA sequencing; RNA-seq, RNA sequencing; KEGG, kyoto encyclopedia of genes and genomes; UTR, untranslated region; SRAMP, sequence-based RNA adenosine methylation site predictor.
References
1.
Mahnkopf C Kwon Y Akoum N . Atrial fibrosis, ischaemic stroke and atrial fibrillation. Arrhythm Electrophysiol Rev. (2021) 10(4):225–9. 10.15420/aer.2021.51
2.
Ma J Chen Q Ma S . Left atrial fibrosis in atrial fibrillation: mechanisms, clinical evaluation and management. J Cell Mol Med. (2021) 25(6):2764–75. 10.1111/jcmm.16350
3.
Assaf A Mekhael M Noujaim C Chouman N Younes H Feng H et al Effect of fibrosis regionality on atrial fibrillation recurrence: insights from DECAAF II. Europace. (2023) 25(9) euad199. 10.1093/europace/euad199
4.
Jain R Epstein JA . Epigenetics. Adv Exp Med Biol. (2024) 1441:341–64. 10.1007/978-3-031-44087-8_18
5.
He X Tang B Zou P Song Z Liu J Pi Z et al M6a RNA methylation: the latent string-puller in fibrosis. Life Sci. (2024) 346:122644. 10.1016/j.lfs.2024.122644
6.
Jiang X Liu B Nie Z Duan L Xiong Q Jin Z et al The role of m6A modification in the biological functions and diseases. Signal Transduct Target Ther. (2021) 6(1):74. 10.1038/s41392-020-00450-x
7.
Fan S Hu Y . Role of m6A methylation in the occurrence and development of heart failure. Front Cardiovasc Med. (2022) 9:892113. 10.3389/fcvm.2022.892113
8.
Wang L Wang J Yu P Feng J Xu GE Zhao X et al METTL14 is required for exercise-induced cardiac hypertrophy and protects against myocardial ischemia-reperfusion injury. Nat Commun. (2022) 13(1):6762. 10.1038/s41467-022-34434-y
9.
Zhang R Qu Y Ji Z Hao C Su Y Yao Y et al METTL3 Mediates Ang-II-induced cardiac hypertrophy through accelerating pri-miR-221/222 maturation in an m6A-dependent manner. Cell Mol Biol Lett. (2022) 27(1):55. 10.1186/s11658-022-00349-1
10.
Tu B Song K Zhou Y Sun H Liu ZY Lin LC et al METTL3 Boosts mitochondrial fission and induces cardiac fibrosis by enhancing LncRNA GAS5 methylation. Pharmacol Res. (2023) 194:106840. 10.1016/j.phrs.2023.106840
11.
Ding JF Sun H Song K Zhou Y Tu B Shi KH et al IGFBP3 Epigenetic promotion induced by METTL3 boosts cardiac fibroblast activation and fibrosis. Eur J Pharmacol. (2023) 942:175494. 10.1016/j.ejphar.2023.175494
12.
Wang W Zhang K Li X Ma Z Zhang Y Yuan M et al Doxycycline attenuates chronic intermittent hypoxia-induced atrial fibrosis in rats. Cardiovasc Ther. (2018) 36(3):e12321. 10.1111/1755-5922.12321
13.
Heinz S Benner C Spann N Bertolino E Lin YC Laslo P et al Simple combinations of lineage-determining transcription factors prime cis-regulatory elements required for macrophage and B cell identities. Mol Cell. (2010) 38(4):576–89. 10.1016/j.molcel.2010.05.004
14.
Bailey TL . DREME: motif discovery in transcription factor ChIP-seq data. Bioinformatics. (2011) 27(12):1653–9. 10.1093/bioinformatics/btr261
15.
Thorvaldsdottir H Robinson JT Mesirov JP . Integrative genomics viewer (IGV): high-performance genomics data visualization and exploration. Brief Bioinform. (2013) 14(2):178–92. 10.1093/bib/bbs017
16.
Zhou Y Zeng P Li YH Zhang Z Cui Q . SRAMP: prediction of mammalian N6-methyladenosine (m6A) sites based on sequence-derived features. Nucleic Acids Res. (2016) 44(10):e91. 10.1093/nar/gkw104
17.
Sun R Tian X Li Y Zhao Y Wang Z Hu Y et al The m6A reader YTHDF3-mediated PRDX3 translation alleviates liver fibrosis. Redox Biol. (2022) 54:102378. 10.1016/j.redox.2022.102378
18.
Ni WJ Zhou H Lu H Ma NN Hou BB Li W et al Genetic and pharmacological inhibition of METTL3 alleviates renal fibrosis by reducing EVL m6A modification through an IGF2BP2-dependent mechanism. Clin Transl Med. (2023) 13(8):e1359. 10.1002/ctm2.1359
19.
Zhuang T Chen MH Wu RX Wang J Hu XD Meng T et al ALKBH5-mediated M6a modification of IL-11 drives macrophage-to-myofibroblast transition and pathological cardiac fibrosis in mice. Nat Commun. (2024) 15(1):1995. 10.1038/s41467-024-46357-x
20.
Tong J Flavell RA Li HB . RNA M6a modification and its function in diseases. Front Med. (2018) 12(4):481–9. 10.1007/s11684-018-0654-8
21.
Kumari R Ranjan P Suleiman ZG Goswami SK Li J Prasad R et al mRNA modifications in cardiovascular biology and disease: with a focus on m6A modification. Cardiovasc Res. (2022) 118(7):1680–92. 10.1093/cvr/cvab160
22.
Han X Wang J Zhang Y Kong Y Dong H Feng X et al Changes in the m6A RNA methylome accompany the promotion of soybean root growth by rhizobia under cadmium stress. J Hazard Mater. (2023) 441:129843. 10.1016/j.jhazmat.2022.129843
23.
Tang P Yang J Chen Z Du C Yang Y Zhao H et al Nuclear retention coupled with sequential polyadenylation dictates post-transcriptional m6A modification in the nucleus. Mol Cell. (2024) 84(19):3758–74. 10.1016/j.molcel.2024.07.017
24.
Sygitowicz G Maciejak-Jastrzebska A Sitkiewicz D . A review of the molecular mechanisms underlying cardiac fibrosis and atrial fibrillation. J Clin Med. (2021) 10(19):4430. 10.3390/jcm10194430
25.
Fakuade FE Steckmeister V Seibertz F Gronwald J Kestel S Menzel J et al Altered atrial cytosolic calcium handling contributes to the development of postoperative atrial fibrillation. Cardiovasc Res. (2021) 117(7):1790–801. 10.1093/cvr/cvaa162
26.
Dobrev D Wehrens XHT . Calcium-mediated cellular triggered activity in atrial fibrillation. J Physiol. (2017) 595(12):4001–8. 10.1113/JP273048
27.
Wang Q Yuan J Shen H Zhu Q Chen B Wang J et al Calpain inhibition protects against atrial fibrillation by mitigating diabetes-associated atrial fibrosis and calcium handling dysfunction in type 2 diabetes mice. Heart Rhythm. (2024) 21(7):1143–51. 10.1016/j.hrthm.2024.02.036
28.
Pluteanu F Hess J Plackic J Nikonova Y Preisenberger J Bukowska A et al Early subcellular Ca2+ remodelling and increased propensity for Ca2+ alternans in left atrial myocytes from hypertensive rats. Cardiovasc Res. (2015) 106(1):87–97. 10.1093/cvr/cvv045
29.
Wang Y Wang J Shi L Chen X Li D Cui C et al CIB2 is a novel endogenous repressor of atrial remodeling. Circulation. (2023) 147(23):1758–76. 10.1161/CIRCULATIONAHA.122.062660
30.
Yu M He X Song X Gao J Pan J Zhou T et al Biglycan promotes hepatic fibrosis through activating heat shock protein 47. Liver Int. (2023) 43(2):500–12. 10.1111/liv.15477
31.
Li R Shi C Wei C Wang C Du H Liu R et al Fufang Shenhua tablet inhibits renal fibrosis by inhibiting PI3K/AKT. Phytomedicine. (2023) 116:154873. 10.1016/j.phymed.2023.154873
32.
Wang R Song F Li S Wu B Gu Y Yuan Y . Salvianolic acid A attenuates CCl4-induced liver fibrosis by regulating the PI3K/AKT/mTOR, Bcl-2/Bax and caspase-3/cleaved caspase-3 signaling pathways. Drug Des Devel Ther. (2019) 13:1889–900. 10.2147/DDDT.S194787
33.
Qin W Cao L Massey IY . Role of PI3K/Akt signaling pathway in cardiac fibrosis. Mol Cell Biochem. (2021) 476(11):4045–59. 10.1007/s11010-021-04219-w
34.
Chong E Chang SL Hsiao YW Singhal R Liu SH Leha T et al Resveratrol, a red wine antioxidant, reduces atrial fibrillation susceptibility in the failing heart by PI3K/AKT/eNOS signaling pathway activation. Heart Rhythm. (2015) 12(5):1046–56. 10.1016/j.hrthm.2015.01.044
35.
Zhang X Tian B Cong X Ning Z . Corilagin inhibits angiotensin II-induced atrial fibrosis and fibrillation in mice through the PI3K-Akt pathway. Iran J Basic Med Sci. (2024) 27(6):717–24. 10.22038/IJBMS.2024.73281.15928
36.
Zhang Z Zhang X Meng L Gong M Li J Shi W et al Pioglitazone inhibits diabetes-induced atrial mitochondrial oxidative stress and improves mitochondrial biogenesis, dynamics, and function through the PPAR-gamma/PGC-1alpha signaling pathway. Front Pharmacol. (2021) 12:658362. 10.3389/fphar.2021.658362
37.
Han X Zhang YL Zhao YX Guo SB Yin WP Li HH . Adipose triglyceride lipase deficiency aggravates angiotensin II-induced atrial fibrillation by reducing peroxisome proliferator-activated receptor alpha activation in mice. Lab Invest. (2023) 103(1):100004. 10.1016/j.labinv.2022.100004
38.
Fernandez-Hernando C Suarez Y . ANGPTL4: a multifunctional protein involved in metabolism and vascular homeostasis. Curr Opin Hematol. (2020) 27(3):206–13. 10.1097/MOH.0000000000000580
39.
Lin LC Liu ZY Yang JJ Zhao JY Tao H . Lipid metabolism reprogramming in cardiac fibrosis. Trends Endocrinol Metab. (2024) 35(2):164–75. 10.1016/j.tem.2023.10.004
40.
Li Y Chen S Yang Q Liu X Zhou W Kang T et al The ANGPTL4-HIF-1alpha loop: a critical regulator of renal interstitial fibrosis. J Transl Med. (2024) 22(1):649. 10.1186/s12967-024-05466-3
41.
Saito S Kitabatake M Ouji-Sageshima N Ogawa T Oda A Nishimura T et al Angiopoietin-like 4 is a critical regulator of fibroblasts during pulmonary fibrosis development. Am J Respir Cell Mol Biol. (2023) 69(3):328–39. 10.1165/rcmb.2022-0304OC
42.
Teratani T Tomita K Wada A Sugihara N Higashiyama M Inaba K et al Angiopoietin-like protein 4 deficiency augments liver fibrosis in liver diseases such as nonalcoholic steatohepatitis in mice through enhanced free cholesterol accumulation in hepatic stellate cells. Hepatol Res. (2021) 51(5):580–92. 10.1111/hepr.13603
43.
Zhu X Zhang X Gu W Zhao H Hao S Ning Z . ANGPTL4 Suppresses the profibrogenic functions of atrial fibroblasts induced by angiotensin II by up-regulating PPARγ. Iran J Basic Med Sci. (2023) 26(5):587–93. 10.22038/IJBMS.2023.69196.15077
Summary
Keywords
MeRIP sequencing, RNA sequencing, chronic intermittent hypoxia, atrial fibrosis, m6A methylation
Citation
Geng T, Qi S, Cao X, Li J, Xia X, Gu T, Wang H, Sun P, Guan S, Shangguan W, Wang W, Zhang H, Zhao Z, Wang L and Liang X (2025) Comprehensive analysis of m6A methylated modification of fibrotic atria in rats induced by chronic intermittent hypoxia. Front. Cardiovasc. Med. 12:1670859. doi: 10.3389/fcvm.2025.1670859
Received
07 August 2025
Accepted
29 September 2025
Published
15 October 2025
Volume
12 - 2025
Edited by
Yasir Hameed, Islamia University of Bahawalpur, Pakistan
Reviewed by
Loredan Stefan Niculescu, Institute of Cellular Biology and Pathology (ICBP), Romania
Wenhui Yue, Tongji University, China
Updates
Copyright
© 2025 Geng, Qi, Cao, Li, Xia, Gu, Wang, Sun, Guan, Shangguan, Wang, Zhang, Zhao, Wang and Liang.
This is an open-access article distributed under the terms of the Creative Commons Attribution License (CC BY). The use, distribution or reproduction in other forums is permitted, provided the original author(s) and the copyright owner(s) are credited and that the original publication in this journal is cited, in accordance with accepted academic practice. No use, distribution or reproduction is permitted which does not comply with these terms.
* Correspondence: Lijun Wang wanglijun211022@ tmu.edu.cn Xue Liang liangxue19841219@tmu.edu.cn
†These authors share first authorship
Disclaimer
All claims expressed in this article are solely those of the authors and do not necessarily represent those of their affiliated organizations, or those of the publisher, the editors and the reviewers. Any product that may be evaluated in this article or claim that may be made by its manufacturer is not guaranteed or endorsed by the publisher.