Abstract
Background:
Disturbed metabolism correlates with the progression of heart failure with preserved ejection fraction (HFpEF). However, the discrepancy in metabolism between asymptomatic (Stage B) and symptomatic (Stage C) HFpEF patients remains unclear. This study aimed to explore the metabolic differences between Stages B and C HFpEF patients and to screen metabolites to distinguish between the two groups of patients.
Methods:
A total of 97 Stage B and 31 Stage C HFpEF patients were included from a previous cohort, named Frailty and Comprehensive Geriatric Assessment in Hospitalized Elderly Patients (registration number: ChiCTR1800017204). Serum metabolites of the participants were identified and quantified using targeted metabolomics (Biocrates MxP® Quant 500 kit).
Results:
Differential analysis identified 208 metabolites of 19 categories, of which lipids (n = 168), amino acids (n = 7), and related metabolites (n = 18) accounted for the top three differential metabolites. In addition, the differential metabolites were significantly enriched in 15 metabolic pathways encompassing amino acid metabolism (10 pathways), lipid metabolism (two pathways), carbohydrate metabolism (one pathway), energy metabolism (one pathway), and protein translation (one pathway). Metabolite set enrichment analysis demonstrated that the differential metabolites most likely originated from muscles and were most significantly enriched in renal disease states (continuous ambulatory peritoneal dialysis and chronic renal failure). Three non-heart-specific metabolites, i.e., cystine (AUC = 0.919), stearic acid [FA (18:0), AUC = 0.913], and N-palmitoyl sphingomyelin (SM C 16:0, AUC = 0.898), displayed higher accuracy than N-terminal pro-B-type brain natriuretic peptide (AUC = 0.838) in differentiating Stage B and Stage C patients.
Conclusion:
Compared with Stage B control, Stage C patients suffer from extensive metabolic disorders, of which lipid metabolism and amino acid metabolism are mostly significantly impaired. The alterations of metabolites are largely attributed to renal dysfunction and muscle proteolysis. Moreover, non-heart-specific metabolites display potential diagnostic value in differentiating subgroups of patients with HFpEF.
Introduction
Heart failure (HF) remains a global health challenge, affecting over 56 million individuals worldwide with persistently high mortality rates (1). Epidemiological shifts have established HF with preserved ejection fraction (HFpEF) as the predominant phenotype, constituting >50% of HF cases (2). Despite preserved systolic function, HFpEF carries a prognosis paralleling HF with reduced ejection fraction (HFrEF), with 5-year mortality exceeding 70% (3). This paradox underscores the need to re-evaluate HFpEF pathophysiology beyond ejection fraction-centric paradigms.
The HF continuum progresses through Stages A–D, with Stage B marking asymptomatic cardiac structural abnormalities preceding overt clinical symptoms (4). Alarmingly, Stage B HF affects >40% of community populations (5, 6), of whom 90% exhibit HFpEF (5). This at-risk cohort represents a critical window for intervention to avert progression to Stage C HFpEF—a transition marked by irreversible myocardial remodeling and functional decline (4, 7). However, current management strategies confront two fundamental challenges in Stage B HFpEF: (1) the absence of stage-specific therapies rooted in incomplete understanding of progression mechanisms (4) and (2) the diagnostic inadequacy of heart-derived biomarker, N-terminal pro-B-type brain natriuretic peptide (NT-proBNP), which fails to discriminate Stages B and C due to shared cardiac abnormalities (4). These limitations highlight the urgent need for non-heart-specific biomarkers to differentiate between the two stages.
Emerging evidence positions metabolic dysregulation as a pivotal yet understudied mechanism in HFpEF pathogenesis. Recent clinical trials with metabolic modulators—sodium–glucose cotransporter 2 (SGLT2) inhibitors and glucagon-like peptide-1 receptor agonists (GLP-1 RA)—have demonstrated unprecedented improvements in exercise capacity among symptomatic HFpEF patients (8, 9). These therapeutic breakthroughs suggest that metabolic perturbations may drive disease progression through pathways distinct from traditional hemodynamic models. However, critical knowledge gaps persist in characterizing the metabolic transitions between preclinical (Stage B) and clinical (Stage C) HFpEF—a prerequisite for developing stage-specific interventions.
Notably, current investigations have not comprehensively characterized metabolic alterations across HFpEF disease stages—a crucial omission given the dynamic nature of metabolic adaptations during disease progression. To address these gaps, we employ a targeted metabolomics approach to (1) systematically characterize stage-specific metabolic profiles in HFpEF progression; (2) explore potential metabolic mechanisms promoting HFpEF progression with a bioinformatic approach; and (3) identify candidate metabolic biomarkers with diagnostic potential for distinguishing Stage B and C HFpEF. Our findings may provide novel insights into metabolic drivers of HFpEF advancement and inform the development of stage-specific therapeutic strategies.
Materials and methods
Study participants
This study included participants from a previous cohort study, named Frailty and Comprehensive Geriatric Assessment in Hospitalized Elderly Patients (10). The previous study consecutively recruited 1,000 elderly inpatients from September 2018 to February 2019 in Beijing Hospital. That study was approved by the Ethics Committee of Beijing Hospital (approval no. 2018BJYYEC-121-02) and registered at the Chinese Clinical Trial Registry (registration number: ChiCTR1800017204). Written informed consents were obtained from all participants.
The HFpEF diagnosis and HF stages were defined according to the 2022 AHA/ACC/HFSA Guidelines for the Management of Heart Failure (4). Stage C HFpEF patients were those who fulfilled the following criteria: (1) current or previous symptoms or signs of HF; (2) left ventricular ejection fraction (LVEF) ≥ 50%; and (3) evidence of cardiac structural or functional abnormalities. Stage B HFpEF patients were LVEF-preserved (LVEF ≥ 50%) and had cardiac abnormalities but had no current or previous presentation of HF. The criteria for defining cardiac abnormalities (Supplementary Table S1) were proposed previously (11). Patients with cancer, acute infection, rheumatic diseases, hematological disease, acute myocardial infarction, acute cerebral infarction, estimated glomerular filtration rate (eGFR) < 30 mL/(min*1.73 m2), abnormal liver function, and LVEF < 50% were excluded. In this study, a total of 97 Stage B and 31 Stage C HFpEF patients were included.
Metabolomics analysis
Fasting blood samples were collected in the morning after admission. Serum samples were prepared and frozen at −80 °C until further analysis. Metabolite levels were profiled using the Biocrates MxP Quant 500 kit. The details of metabolite extraction and analysis are described elsewhere (12, 13). For metabolite extraction, a 10 μm sample was transferred to a 96-well plate and dried under a nitrogen stream. The samples were then derivatized with 5% phenyl isothiocyanate solution. After incubating in the dark for 1 h, the samples were dried under a nitrogen stream and dissolved in the extraction solvent. The dissolved samples were then mixed and filtered to obtain the extracts. Flow injection analysis-tandem mass spectrometry (FIA-MS/MS) and liquid chromatography-tandem mass spectrometry (LC-MS/MS) methods were used to analyze the extracts. Lipids were analyzed by FIA-MS/MS using a 5500 QTRAP® instrument (AB Sciex, Darmstadt, Germany) with an electrospray ionization source, and non-lipid molecules were analyzed by LC-MS/MS with the same 5500 QTRAP® instrument. MS software (Sciex Analyst®) and Biocrates MetIDQ™ software were used to calculate metabolite concentrations, data assessment, and compilation. Metabolites with levels below the detection limit were excluded from further analyses.
Statistics
All data were analyzed using GraphPad Prism 8 (GraphPad, San Diego, CA, USA), Microsoft Excel, SPSS 23.0 (IBM Corp., Armonk, NY, USA), R 4.1.2 (Vienna, Austria), and MetaboAnalyst 5.0 (https://www.metaboanalyst.ca). Categorical variables were described as percentages, and normally distributed continuous variables were expressed as mean ± standard deviation. Non-normally distributed continuous data were described as medians (interquartile range: 25th–75th percentiles).
Differences in baseline characteristics between Stage B and C HFpEF participants were tested using the chi-squared test (categorical variables), Mann–Whitney U test (non-normally distributed continuous variables), or Student's t-test (normally distributed continuous variables). Differential analysis of all metabolites was performed using the Mann–Whitney U test, as most metabolites were not normally distributed. The P-values across all metabolites within each comparison were adjusted using a false discovery rate (FDR) method to account for multiple testing, and FDR < 0.05 was considered statistically significant. Hierarchical clustering heatmaps were generated using the “pheatmap” package. Kyoto Encyclopedia of Genes and Genomes (KEGG) pathway analysis was performed by the MetaboAnalyst web service with a hypergeometric test for significance and topology analysis for pathway impact (14). Metabolite set enrichment analysis (MSEA) of diseases and origins was also performed using MetaboAnalyst with a hypergeometric test for significance (14). To maximize the identification of differences in metabolic profiles between groups, an orthogonal projection to latent structure-discriminant analysis (OPLS-DA) model was constructed using SIMCA-P 14.1 (Umetrics AB, Sweden). Metabolites with FDR < 0.05 and variable importance in projection (VIP) ≥1.5 were further analyzed with receiver operating characteristic (ROC) curves.
Results
Baseline characteristics
The baseline characteristics of patients stratified by Stage B (n = 97) and Stage C (n = 31) are presented in Table 1. Stage C tend to be older compared with Stage B (80.45 ± 7.41 vs. 77.85 ± 5.95 years, p = 0.050), with marked differences observed in cardiac biomarker and renal function. Stage C patients demonstrated significantly elevated NT-proBNP levels (median 700.2 vs. 170.4 pg/mL, p < 0.001), lower eGFR [median 63.59 vs. 79.77 mL/(min × 1.73 m2), p < 0.001], and decreased exercise tolerance. Echocardiographic analysis revealed that Stage C patients had lower LVEF (62% vs. 65%, p = 0.001) and higher E wave velocity (0.96 ± 0.28 vs. 0.81 ± 0.22 m/s, p = 0.002). Moreover, Stage C patients had larger left atrial dimensions (LAAPD: 42.27 ± 6.11 vs. 38.90 ± 5.37 mm, p = 0.004), and more Stage C patients suffered from atrial fibrillation (21.6% vs. 48.4%, p = 0.004). No significant differences were observed in gender, body mass index, total cholesterol, total triglyceride, high-density lipoprotein (HDL), low-density lipoprotein (LDL), smoking status, prevalence of hypertension, diabetes, peripheral artery disease, coronary heart disease, valvular disease, and stroke. Medication patterns were generally comparable between groups except fr diuretics (Stage C vs. Stage B: 12.4% vs. 64.5%, p < 0.001) and mineralocorticoid receptor antagonists (Stage C vs. Stage B: 0% vs. 12.9%, p = 0.003).
Table 1
| Characteristics | Stage B (n = 97) | Stage C (n = 31) | P-value |
|---|---|---|---|
| Age (years) | 77.85 ± 5.95 | 80.45 ± 7.41 | 0.050 |
| Male (%) | 48 (49.5%) | 10 (32.3%) | 0.093 |
| BMI (kg/m2) | 25.08 ± 3.65 | 24.51 ± 3.66 | 0.449 |
| Smoker (%) | 28 (28.9%) | 6 (19.4%) | 0.297 |
| NT-proBNP (pg/mL) | 170.4 (89.81–390.6) | 700.2 (184.4–1,819) | <0.001 |
| NYHA functional class | <0.001 | ||
| I (%) | 97 (100%) | 0 (0%) | |
| II (%) | 0 (0%) | 10 (32.3%) | |
| III (%) | 0 (0%) | 19 (61.2%) | |
| IV (%) | 0 (0%) | 2 (6.5%) | |
| Disease history | |||
| Atrial fibrillation (%) | 21 (21.6%) | 15 (48.4%) | 0.004 |
| Aortic regurgitation (%) | 4 (4.2%) | 0 (%) | 0.571 |
| Mitral regurgitation (%) | 8 (8.2%) | 1 (3.2%) | 0.687 |
| Hypertension (%) | 79 (81.4%) | 28 (90.3) | 0.245 |
| Diabetes mellitus (%) | 34 (35.1%) | 14 (45.2%) | 0.311 |
| Peripheral artery disease (%) | 20 (20.6%) | 10 (32.3%) | 0.183 |
| Coronary heart disease (%) | 52 (53.6%) | 18 (58.1%) | 0.664 |
| Stroke (%) | 32 (33.0%) | 7 (22.6%) | 0.273 |
| eGFR [mL/(min × 1.73 m2)] | 79.77 (67.70–89.17) | 63.59 (42.81–86.83) | <0.001 |
| Medication | |||
| Diuretics (%) | 12 (12.4%) | 20 (64.5%) | <0.001 |
| MRAs (%) | 0 (0%) | 4 (12.9%) | 0.003 |
| Antiplatelet drugs (%) | 68 (70.1%) | 16 (51.6%) | 0.059 |
| RAAS inhibitors (%) | 43 (44.3%) | 10 (32.3%) | 0.235 |
| Lipid-lowering drugs (%) | 74 (76.3%) | 23 (74.2%) | 0.813 |
| β-blockers (%) | 53 (54.6%) | 22 (71.0%) | 0.108 |
| Anticoagulants (%) | 12 (12.4%) | 8 (25.8%) | 0.09 |
| Blood lipids | |||
| Total cholesterol (mmol/L) | 3.52 (3.10–4.30) | 3.89 (3.32–4.40) | 0.376 |
| Total triglyceride (mmol/L) | 1.12 (0.81–1.53) | 1.15 (0.78–1.36) | 0.733 |
| HDL (mmol/L) | 1.07 (0.92–1.21) | 1.01 (0.72–1.12) | 0.309 |
| LDL (mmol/L) | 2.10 (1.72–2.69) | 2.34 (1.68–2.79) | 0.336 |
| Echocardiographic parameters | |||
| LVEF (%) | 65 (60–65) | 62 (60–65) | 0.001 |
| LAAPD (mm) | 38.90 ± 5.37 | 42.27 ± 6.11 | 0.004 |
| E velocity (m/s) | 0.81 ± 0.22 | 0.96 ± 0.28 | 0.002 |
| A velocity (m/s) | 0.94 (0.84–1.1) | 1 (0.98–1.2) | 0.804 |
| E/A | 0.8 (0.67–1.08) | 0.67 (0.61–1.09) | 0.837 |
| Septal e′ (cm/s) | 7 (6–7.2) | 7 (6–9) | 0.649 |
| Lateral e′ (cm/s) | 5 (4–6) | 5 (5–6) | 0.187 |
| Septal E/e′ | 12.09 ± 4.66 | 13.99 ± 5.64 | 0.171 |
| Lateral E/e′ | 16.8 ± 6.2 | 19.05 ± 10.67 | 0.265 |
| LV mass/height2.7 (g/m2.7) | 42.81 (37.40–47.63) | 46.35 (36.32–51.88) | 0.142 |
Patients' characteristics.
BMI, body mass index; NT-proBNP, N-terminal pro-B-type brain natriuretic peptide; NYHA, New York Heart Association; eGFR, estimated glomerular filtration rate; MRAs, mineralocorticoid receptor antagonists; RAAS, renin–angiotensin–aldosterone system; HDL, high-density lipoprotein; LDL, low-density lipoprotein; LV, left ventricular; LVEF, left ventricular ejection fraction; LAAPD, left atrial anteroposterior diameter; E velocity, peak early diastolic transmitral flow velocity; A velocity, peak late diastolic transmitral flow velocity; septal e′, peak early diastolic mitral annular tissue velocity at septal mitral annulus; lateral e′ peak early diastolic mitral annular tissue velocity at lateral mitral annulus.
Differential analysis
Using targeted metabolomics, 630 compounds were identified and quantified, including 107 non-lipid compounds and 523 lipids. After removing compounds with levels below the detection limit, 355 metabolites were statistically analyzed.
Differential analysis identified 208 metabolites in 19 categories that differed significantly (FDR < 0.05) between the two groups (Figures 1A,B). Detailed concentrations of the 208 differential metabolites are summarized in Supplementary Table S2. Compared with the Stage B group, almost all differential metabolites (202/208) significantly increased in symptomatic patients, and only six metabolites significantly decreased (Figure 1B and Supplementary Table S2).
Figure 1
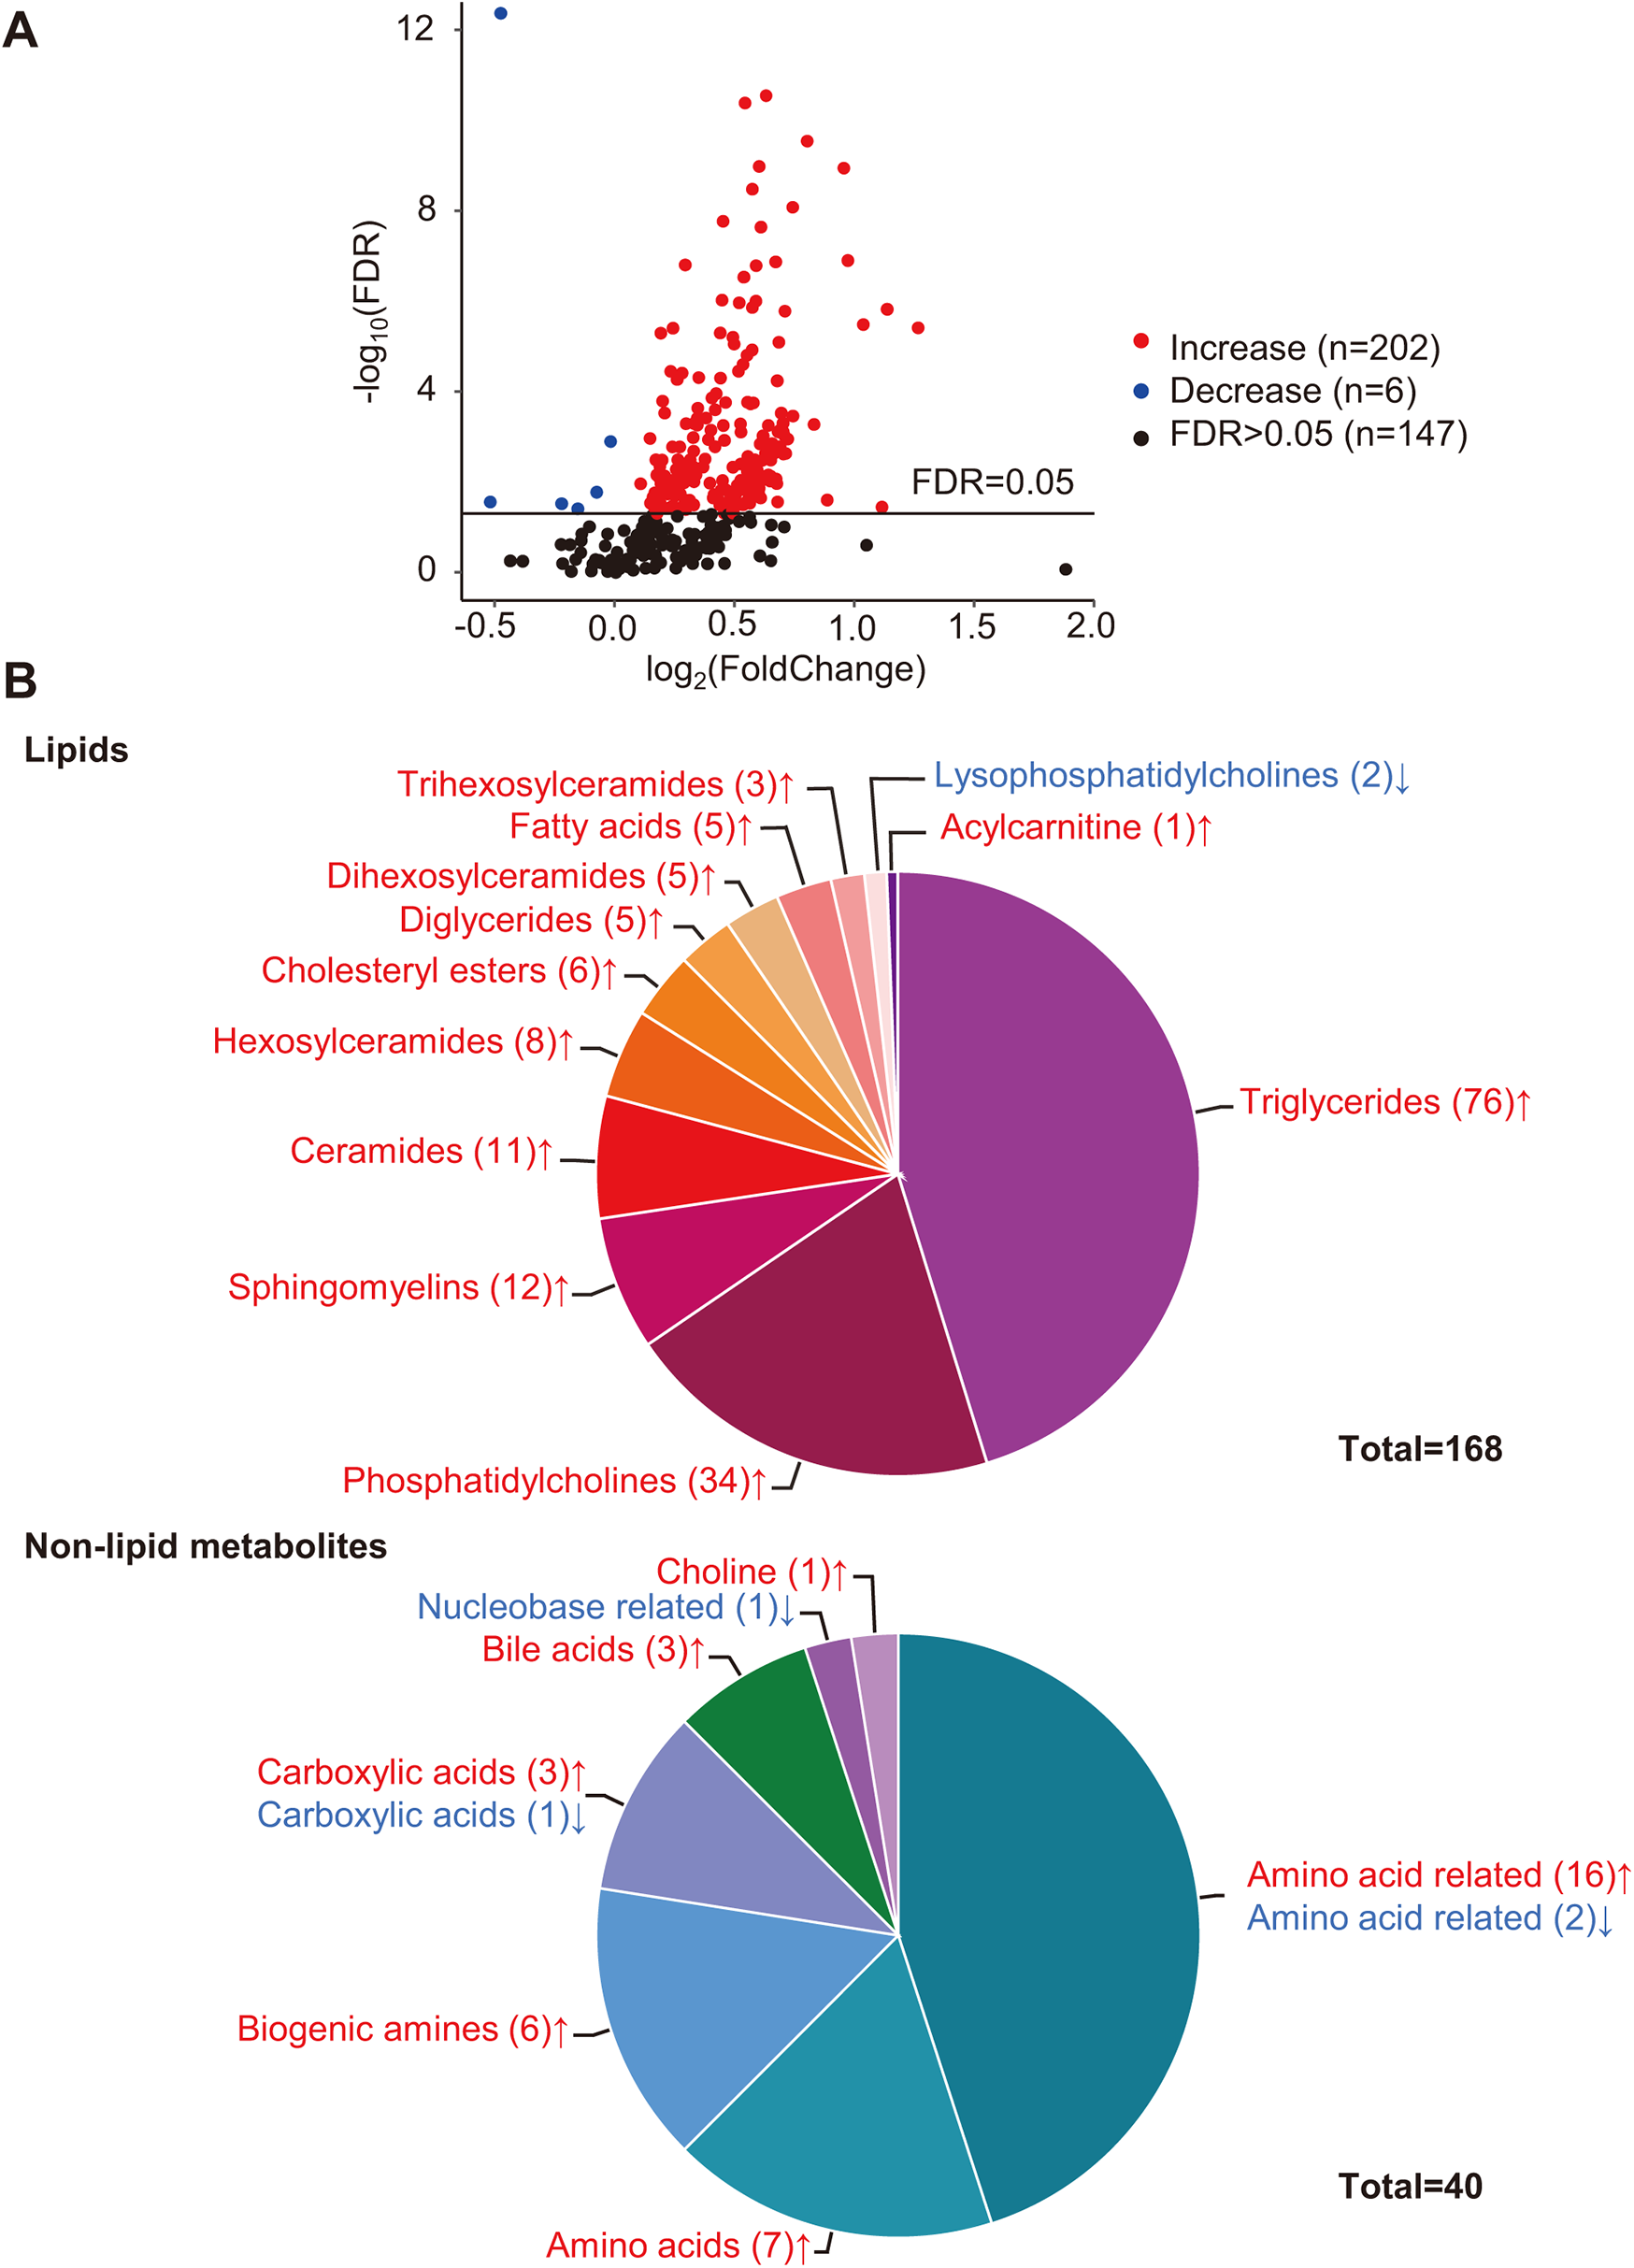
Differential analysis of metabolites. (A) Volcano plot of quantified metabolites in Stage C vs. Stage B patients. Each dot represents a metabolite. Y-axis: significance plotted as -log10 FDR (false discovery rate) with a cutoff of 0.05 (horizontal line). X-axis: effect size plotted as log2 fold change. Red dots represent increased metabolites, blue dots represent decreased metabolites, and black dots represent metabolites that were not significantly changed. (B) Categories of differential metabolites. Each part with a different color in the circular ring represents each category of metabolites. The area of each part represents the proportion of metabolites of each category to all differential metabolites; red font (↑) and blue font (↓) indicate metabolites that were significantly increased or decreased, respectively.
Lipids accounted for the largest proportion of differential metabolites (168/208). The differential lipids include triglycerides (TGs, n = 76), diglycerides (DGs, n = 5), fatty acids (FAs, n = 5), cholesteryl esters (CEs, n = 6), phosphatidylcholines (PCs, n = 34), lysophosphatidylcholines (LysoPCs, n = 2), acylcarnitine (Acar, n = 1), ceramides (Cers, n = 11) and their derivates, hexosylceramides (Hexcers, n = 8), dihexosylceramides (Hex2Cers, n = 5), trihexosylceramides (Hex3Cers, n = 3), and sphingomyelins (SMs, n = 12) (Figure 1B). The Pearson correlation coefficients among the differential lipids with similar structures, such as TGs–DGs, PCs, and Cers, tended to gather in the hierarchical clustering heatmap (Supplementary Figure S1).
Among the non-lipid metabolites, amino acids (AAs) and AA-related metabolites accounted for the top two differential metabolites, with 23 compounds (7 AAs and 16 AA-related metabolites) significantly increased and only two AA-related metabolites, carnosine and phenylacetylglycine, significantly decreased (Figure 1B and Supplementary Table S2). In addition, six biogenic amines, three carboxylic acids, three bile acids, and choline significantly increased (Figure 1B and Supplementary Table S2). One carboxylic acid (succinic acid) and one nucleobase-related metabolite (hypoxanthine) significantly decreased (Figure 1B and Supplementary Table S2).
Pathway analysis and enrichment analysis of differential metabolites
To investigate the metabolic pathways related to the metabolic differences between Stage B and C patients, KEGG pathway analysis was performed using the MetaboAnalyst web service. Altogether, 38 metabolic pathways were mapped, of which 15 were significantly enriched, most of which were involved in AA metabolism (10/15) (P < 0.05, Figure 2). In addition, pathways concerning lipid metabolism (2/15), carbohydrate metabolism (1/15), energy metabolism (1/15), and protein translation (1/15), although impacted relatively lower by differential metabolites, were also significantly changed (Figure 2). As shown in Figure 2, the top three significantly altered pathways were the histidine, arginine, and glutathione metabolic pathways.
Figure 2
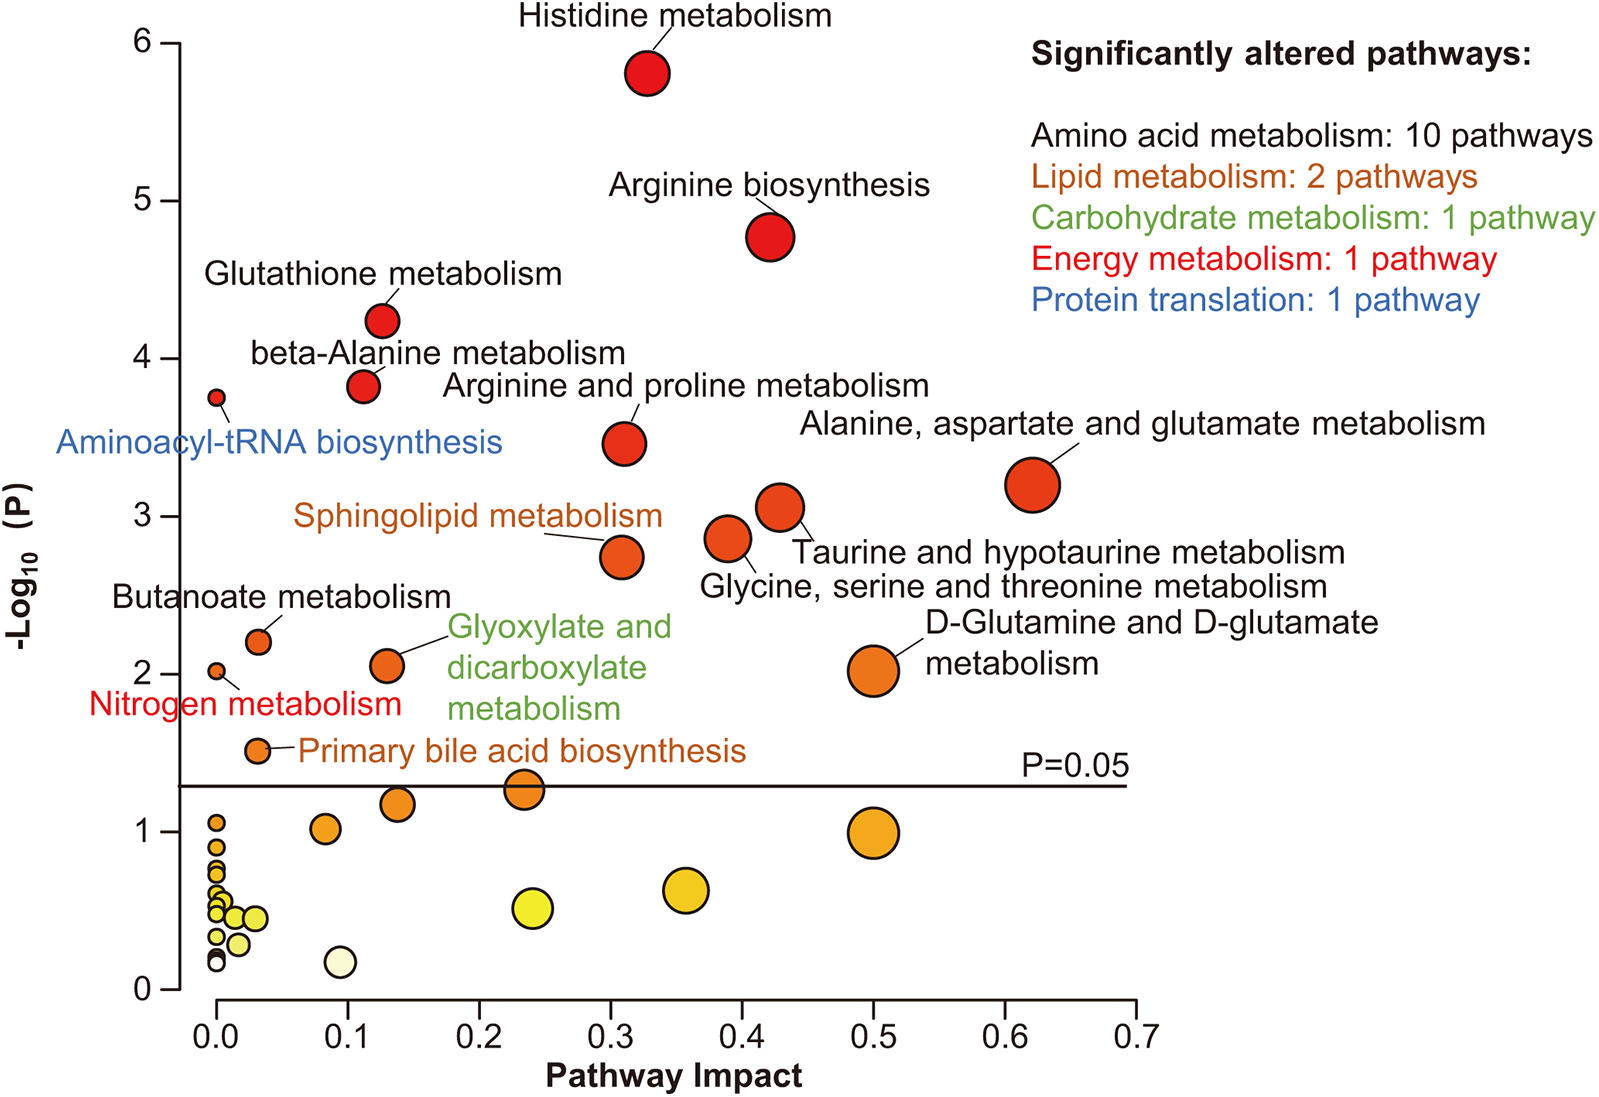
Pathway analysis of differential metabolites. Scatter plot presenting enriched metabolic pathways. The color gradient indicates the significance of the pathway ranked by P-value (yellow, higher P-values; red, lower P-values), and the circle's size indicates the pathway impact score (the larger the circle, the higher the impact score). Significantly enriched pathways were marked by names, and the colors of the names represent categories of enriched pathways. The black horizontal line indicates P = 0.05.
MSEA revealed that muscles were the most likely sources of differential metabolites (Figure 3A). Moreover, based on MSEA, differential metabolites were most significantly enriched in renal disease states, including continuous ambulatory peritoneal dialysis and chronic renal failure (Figure 3B).
Figure 3
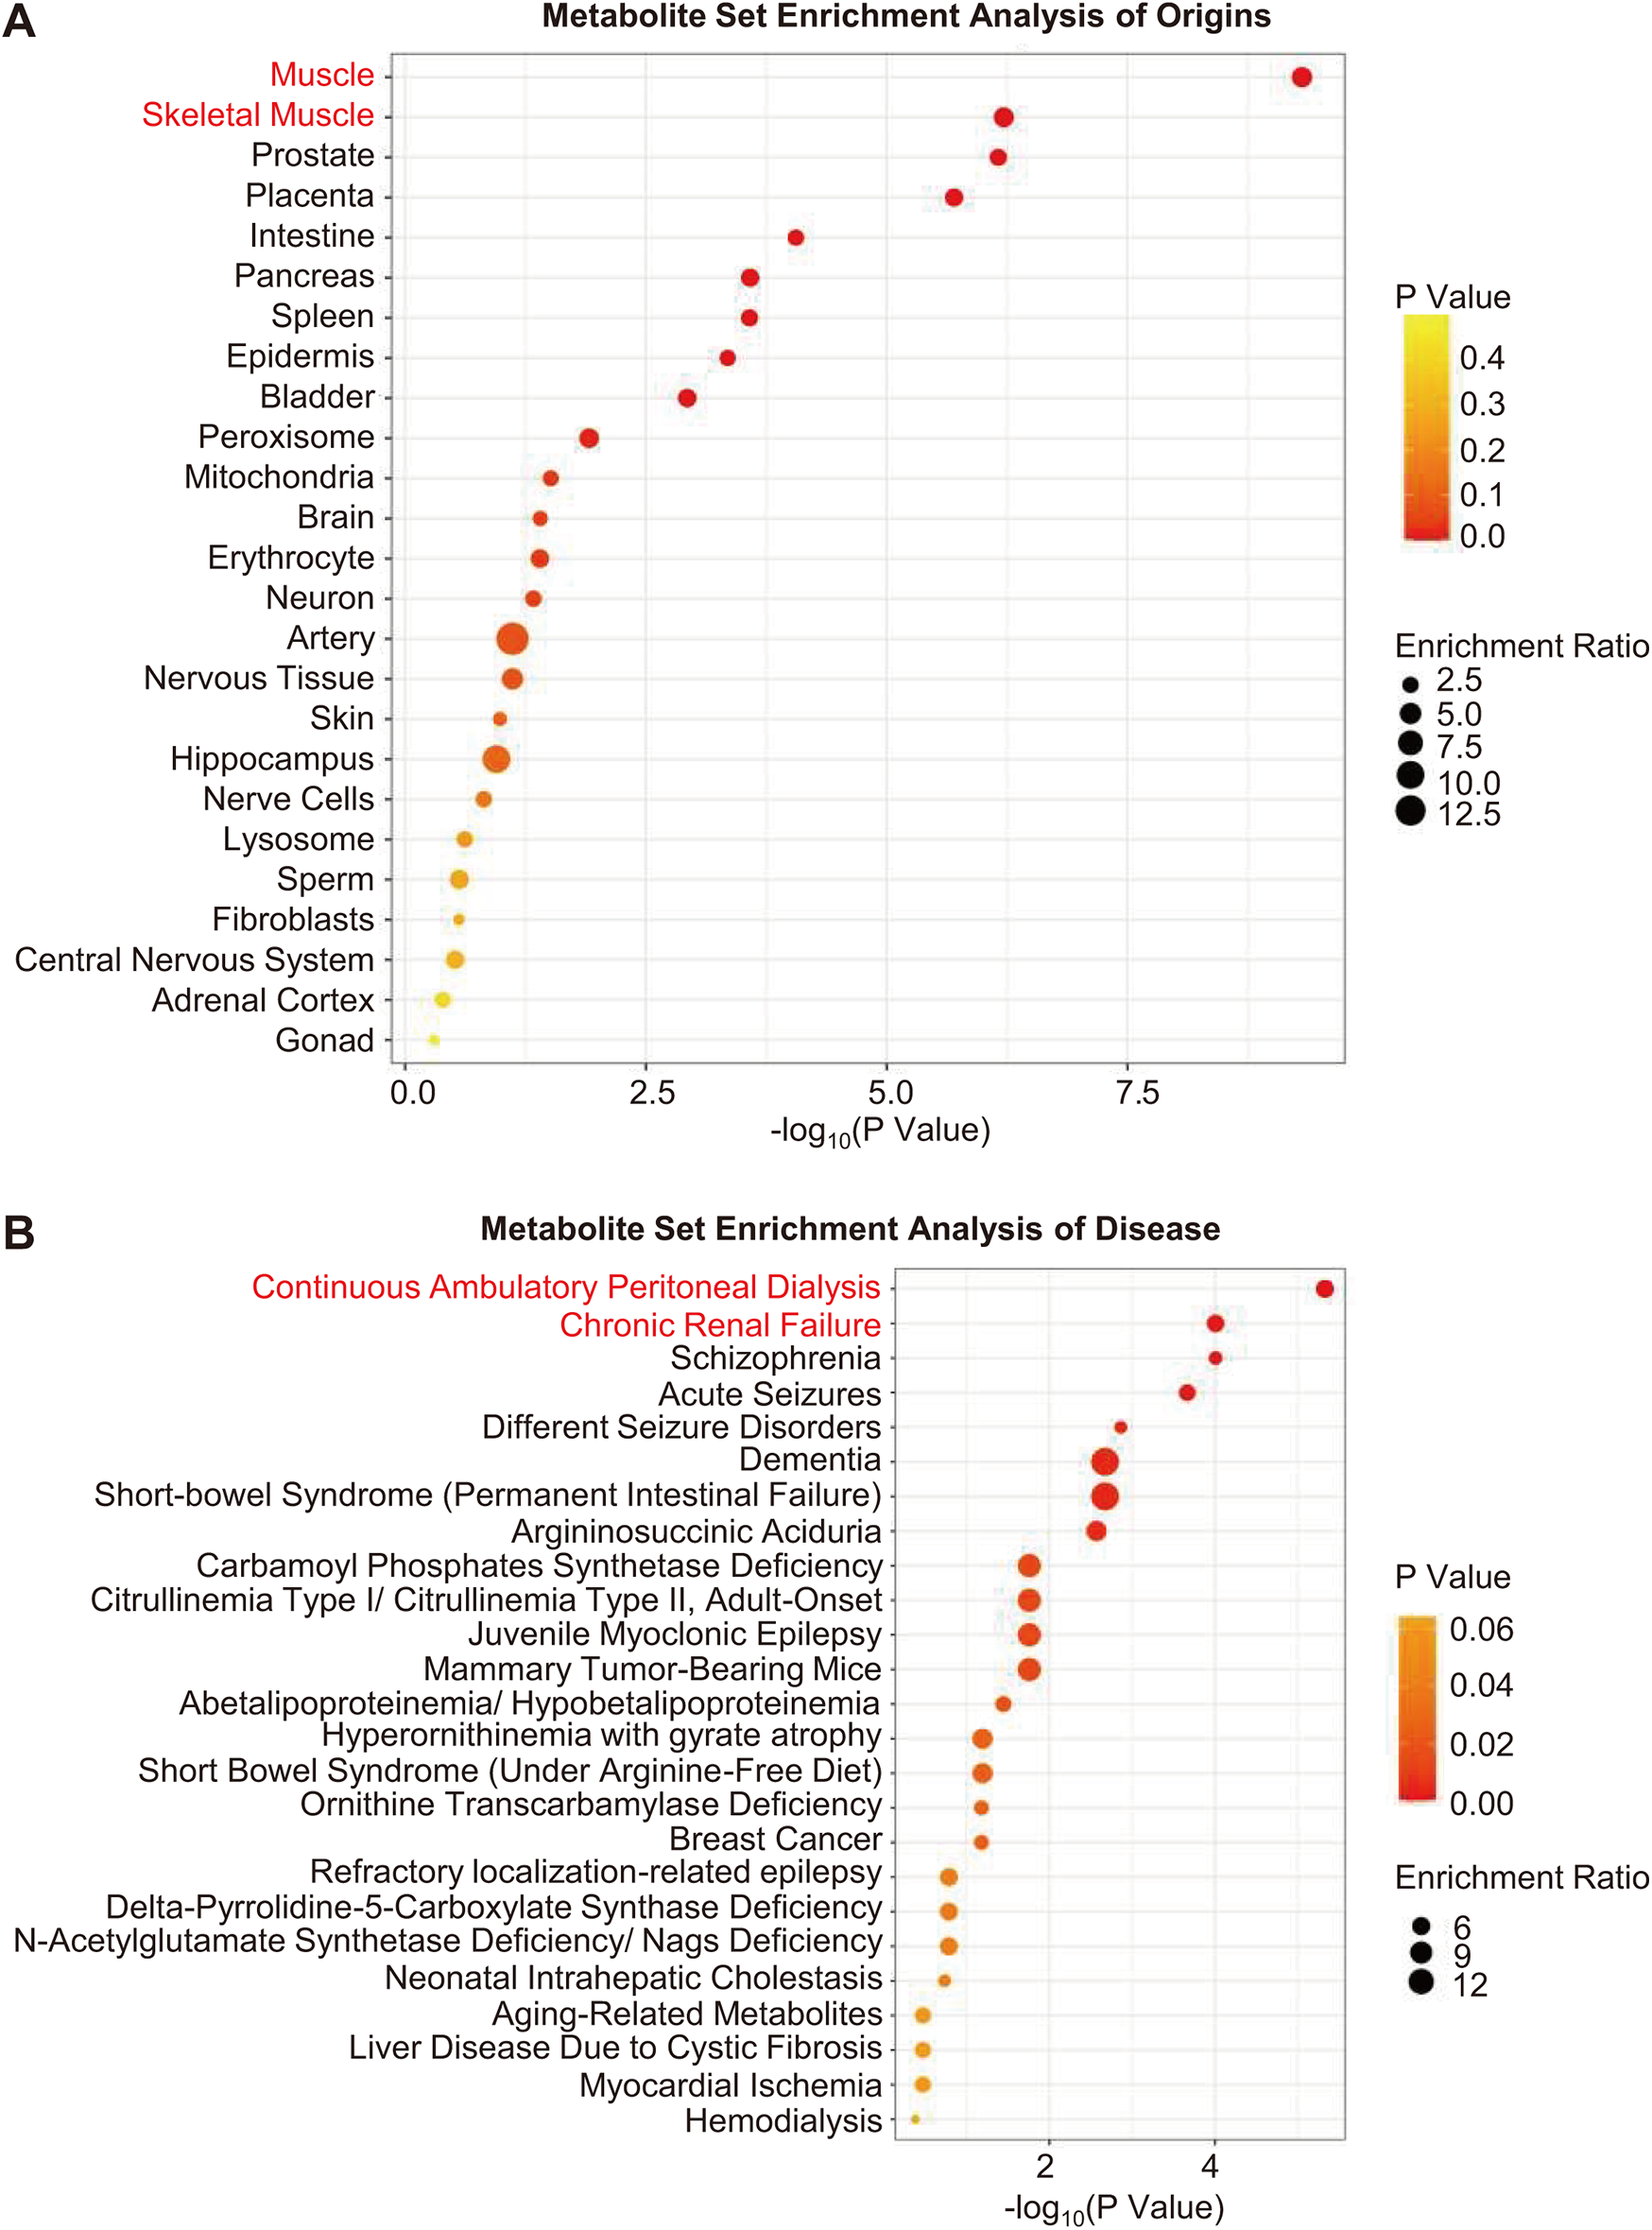
Metabolite set enrichment analysis. (A,B) Enrichment analysis of origins and associated diseases of differential metabolites. The color gradient indicates the significance of the enriched organs or diseases ranked by P-value (yellow, higher P-values; red, lower P-values), and the circle's size indicates the enrichment ratio (the larger the circle, the higher the enrichment ratio). Red font indicates organs or diseases that were most significantly enriched.
Diagnostic value of metabolic biomarkers
To screen metabolites that maximally contributed to the separation of HFpEF stages, an OPLS-DA model was created based on 355 metabolites that passed quality control. OPLS-DA plot demonstrated clear separation between Stage B and Stage C patients (Figure 4A). The goodness-of-fit parameters (R2X = 0.756, R2Y = 0.67) revealed a good fit, and the parameter for prediction (Q2 = 0.444) suggested a moderate predictive ability of this model. The R2 and Q2 interceptive values were 0.273 and −0.387, respectively, after 200 random permutations, suggesting no overfitting. The criteria to screen potential biomarkers for discriminating preclinical and clinical HFpEF patients were VIP > 1.5 and FDR < 0.05. Of the 355 qualified metabolites, 28 fulfilled these criteria (Supplementary Table S3). We further assessed the diagnostic accuracy of the 28 metabolites using ROC curves. We found that cystine, FA (18:0), and SM C 16:0 were the metabolites with the highest areas under the curves (AUC = 0.919, 0.913, and 0.898, respectively), which were even higher than those of NT-proBNP (AUC = 0.838) (Figures 4B,C). Moreover, their combinations with NT-proBNP further improved the diagnostic accuracy. The AUCs were 0.924, 0.969, and 0.937 for NT-proBNP plus FA (18:0), NT-proBNP plus SM C 16:0, and NT-proBNP plus cystine, respectively. Based on the maximum Youden's index (maximal sum of sensitivity and specificity), the optimal cutoff concentrations of cystine, SM C 16:0, and FA (18:0) were 73, 103, and 234 µmol/L, respectively (Figure 4D).
Figure 4
![A set of charts analyzing biochemical data. (A) A 3D scatter plot categorizing data points marked as B (blue) and C (red) along axes labeled t[1], to[1], and Num. (B) A dot plot illustrating the area under curve values for various compounds, ranging from 0.6 to 1. (C) A Receiver Operating Characteristic (ROC) curve displaying sensitivity versus 100% - specificity for FA(18:0), SM C16:0, Cystine, and NT-proBNP. (D) Three scatter plots comparing concentrations of Cystine, SM C16:0, and FA 18:0 between groups B and C, illustrating specific threshold levels in red.](https://www.frontiersin.org/files/Articles/1674243/xml-images/fcvm-12-1674243-g004.webp)
Screening metabolites with potential diagnostic value. (A) Three-dimensional scatter plot of OPLS-DA model analysis for Stage C patients (red dot) vs. Stage B patients (blue dot) by the main components. (B) Plot of the area under the curve of each metabolite to differentiate Stage B and Stage C patients. (C) Receiver operating characteristic curves of FA (18:0), SM C 16:0, cystine, and NT-proBNP. (D) Concentrations and optimal cutoff values of FA (18:0), SM C 16:0, and cystine to differentiate Stage B and C patients.
Discussion
This study explored the metabolic differences between patients with Stage B and Stage C HFpEF. Compared to the Stage B group, multiple categories of metabolites and corresponding pathways, especially lipids and AAs, were significantly altered in Stage C patients. Bioinformatics analysis revealed that the differential metabolites most likely originated from muscles and were most significantly enriched in renal disease states. Three non-heart-specific metabolites, cystine, SM C 16:0, and FA (18:0), differentiated between preclinical and clinical HFpEF patients with accuracy higher than NT-proBNP.
Pathophysiological significance
Impaired lipid metabolism and abnormal energetic metabolism
Lipid metabolism is strongly associated with cardiovascular diseases. A high-fat diet has previously been reported to induce cardiac abnormalities and murine HFpEF (15, 16). Mechanistically, the accumulation of lipids, including TGs (17, 18), CEs (19), PCs (20), Cers (21, 22), and glycosylated Cers (17), in the myocardium results in cardiac structural and functional abnormalities. Thus, we speculate that the excessively increased serum lipids in Stage C patients account for their worse cardiac parameters (Figure 1B and Table 1).
We also observed that lipids in the same categories, especially TGs–DGs, PCs, FAs, LysoPCs, Cers, and HexCers, tend to cluster together in the hierarchical clustering heatmap (Supplementary Figure S1), suggesting a strong intrinsic association between lipids in the same class. Theoretically, this association should be attributed to shared metabolic pathways for the same class of lipids. These results suggest that intrinsic metabolic defects are the cause of disturbed lipid metabolism in Stage C patients. Consistent with our results, previous investigations also reported that fatty acid metabolism is impaired in HFpEF patients' or animals' myocardium (23, 24), and restoring fatty acid metabolism corrected HFpEF phenotype in animals (25–27).
Lipids are the storage form of energy. Recently, two glucose-lowering drugs, SGLT2 inhibitor and GLP-1RA, were reported to improve the exercise tolerance of symptomatic HFpEF patients (8, 9). Moreover, a previous study reported that exercise training reduced Stage B HFpEF patients' LV myocardial stiffness (7). These investigations, together with our findings, provide a possibility that decreasing energy, whether by drugs or exercise, helps to prevent Stage B HFpEF progression.
In this research, blood lipids tested by the hospital's clinical laboratory, including total cholesterol, total triglyceride, HDL, and LDL, were not significantly different between the two groups (Table 1). However, the metabolomics approach identified various significantly altered lipids (Figure 1 and Supplementary Table S2). This may be owing to the more precise detectability of the metabolomics approach, which can detect differences at the molecular level.
Amino acid metabolism disorder and HFpEF
As shown in Figure 2, the differential metabolites were significantly enriched in 10 AA metabolism pathways with high impact. AAs, AA-related metabolites, and biogenic amines are metabolically related. Consistently, previous studies also demonstrate impaired AA metabolism in HFpEF (23, 28, 29). In this study, we speculate that muscular abnormalities and decreased renal function partly account for the perturbation of AA metabolism.
In this study, MSEA revealed that muscles were the most significantly enriched origins of differential metabolites (Figure 3A). Seven essential AAs, including glutamine, glycine, phenylalanine, glutamate, aspartate, arginine, and cysteine, which participate in protein biosynthesis, increased in the serum of Stage C patients (Figure 1B and Supplementary Table S2). Moreover, the levels of two muscle-related metabolites, sarcosine (30) and taurine (31), also increased in the serum of patients with Stage C disease (Supplementary Table S2). These results suggest that Stage C patients suffer from increased muscle proteolysis, a process of releasing AAs into the blood, which also accounts for the decreased exercise tolerance of Stage C patients. Similarly, previous studies also reported increased proteolysis in both the myocardium (32) and skeletal muscles of HFpEF patients (33).
In addition, differential metabolites were most significantly enriched in renal disease states (Figure 3B), and Stage C patients had lower eGFR (Table 1). Creatinine, kynurenine, asymmetric dimethylarginine (ADMA), symmetric dimethylarginine (SDMA), and homocysteine are uremic toxins (34, 35), and their increase is accompanied by a decline in eGFR (Supplementary Table S2 and Table 1). In addition, ADMA and SDMA can decrease nitric oxide (NO) biosynthesis by inhibiting NO synthase and suppressing the transportation of arginine, respectively (36, 37). Moreover, impaired NO bioavailability contributes to cardiac dysfunction in HFpEF patients (38). Our results provided a possible mechanistic link between the decline of renal function and the exacerbation of HFpEF—that is, decreased renal function in HFpEF patients increases serum uremic toxins, which impair NO biosynthesis and exacerbate cardiac dysfunction. Future study would concentrate on whether and how slowing down eGFR decline or clearing uremic toxins (such as ADMA and SDMA) helps to prevent Stage B HFpEF progression.
Diagnostic value of serum metabolites
In this study, we found that three non-heart-specific metabolites, i.e., FA (18:0), SM C 16:0, and cystine, were more accurate than NT-proBNP in differentiating between patients with Stage B and Stage C HFpEF (Figure 4B). Although FA (18:0), SM C 16:0, and cystine are not heart-specific metabolites, their high diagnostic accuracy should be ascribed to systemic changes that occur during the progression of HFpEF (39, 40). In addition, the accuracy of NT-proBNP is limited as it also increases in Stage B patients (4). In summary, these findings reveal the potential value of non-heart-specific biomarkers for differentiating the subtypes of cardiovascular disease.
Limitations
In this research, patients' baseline characteristics, including age and comorbidities, were significantly different between the two groups. Stage C patients were older, more vulnerable to atrial fibrillation, had lower eGFR, and worse cardiac function (Table 1), which may impact the metabolome to some extent. As a matter of fact, metabolites associated with renal dysfunction, such as ADMA and SDMA (34), did increase in Stage C group serum, which means the kidney-related metabolites may provide a mechanistic link between renal dysfunction and HFpEF progression. Aging is a risk factor of HFpEF, which suggests that aging may promote the progression of HFpEF via an altered metabolome. Thus, it is reasonable that Stage C patients are older than Stage B control. Moreover, SGLT2 inhibitors were not prescribed for Stage C patients as they were enrolled from 2018 to 2019 when this drug had not been recommended by guidelines. Future studies must include patients taking SGLT2 inhibitors to clarify the residual risk under such therapy. In addition, it would have been valuable to take healthy subjects as controls. However, it was not available as all participants were inpatients in our previous cohort. Finally, the findings of this study were derived from a single cohort. Therefore, the results should be interpreted with caution.
Conclusion
The metabolic differences between Stage B and Stage C HFpEF patients are diverse, involving various metabolites and metabolic pathways, among which lipid metabolism and AA metabolism are most significantly impaired. The perturbations of metabolism are largely attributed to muscle proteolysis and renal dysfunction. Non-heart-specific metabolites, including FA (18:0), SM C 16:0, and cystine, are candidate biomarkers to differentiate HFpEF subgroups with accuracy higher than NT-proBNP. In the future, therapeutic strategies targeting excessive energy, renal dysfunction, and uremic toxins have the potential to prevent Stage B patients from progression.
Statements
Data availability statement
The original contributions presented in the study are included in the article/Supplementary Material, further inquiries can be directed to the corresponding author.
Ethics statement
The studies involving humans were approved by the Ethics Committee of Beijing Hospital. The studies were conducted in accordance with the local legislation and institutional requirements. The participants provided their written informed consent to participate in this study.
Author contributions
SZ: Conceptualization, Visualization, Formal analysis, Writing – original draft, Data curation. L-WZ: Writing – original draft, Formal analysis. TW: Formal analysis, Investigation, Writing – original draft. Y-HW: Investigation, Writing – original draft. KC: Writing – original draft, Investigation. S-MW: Resources, Methodology, Writing – original draft, Data curation, Funding acquisition, Investigation, Supervision, Validation, Software, Formal analysis, Project administration, Visualization, Conceptualization. CM: Writing – original draft, Investigation. J-PC: Resources, Supervision, Writing – review & editing. HW: Conceptualization, Methodology, Writing – review & editing, Supervision, Resources, Project administration, Funding acquisition. J-FY: Resources, Conceptualization, Writing – review & editing, Methodology, Project administration, Supervision.
Funding
The author(s) declare that financial support was received for the research and/or publication of this article. This research was supported by grants from the National Natural Science Foundation of China (82170396), Capital Funds for Health Improvement and Research (2022-1-4052), and the Chinese Academy of Medical Sciences, Innovation Fund for Medical Sciences (2021-I2M-1-050).
Acknowledgments
The authors would like to express their deep gratitude to the Clinical Biobank of Beijing Hospital for the biological sample collection, processing, storage, and information management.
Conflict of interest
The authors declare that the research was conducted in the absence of any commercial or financial relationships that could be construed as a potential conflict of interest.
Generative AI statement
The author(s) declare that no Generative AI was used in the creation of this manuscript.
Any alternative text (alt text) provided alongside figures in this article has been generated by Frontiers with the support of artificial intelligence, and reasonable efforts have been made to ensure accuracy, including review by the authors wherever possible. If you identify any issues, please contact us.
Publisher’s note
All claims expressed in this article are solely those of the authors and do not necessarily represent those of their affiliated organizations, or those of the publisher, the editors and the reviewers. Any product that may be evaluated in this article, or claim that may be made by its manufacturer, is not guaranteed or endorsed by the publisher.
Supplementary material
The Supplementary Material for this article can be found online at: https://www.frontiersin.org/articles/10.3389/fcvm.2025.1674243/full#supplementary-material
References
1.
Khan MS Shahid I Bennis A Rakisheva A Metra M Butler J . Global epidemiology of heart failure. Nat Rev Cardiol. (2024) 21(10):717–34. 10.1038/s41569-024-01046-6
2.
Dunlay SM Roger VL Redfield MM . Epidemiology of heart failure with preserved ejection fraction. Nat Rev Cardiol. (2017) 14(10):591–602. 10.1038/nrcardio.2017.65
3.
Shah KS Xu H Matsouaka RA Bhatt DL Heidenreich PA Hernandez AF et al Heart failure with preserved, borderline, and reduced ejection fraction: 5-year outcomes. J Am Coll Cardiol. (2017) 70(20):2476–86. 10.1016/j.jacc.2017.08.074
4.
Heidenreich PA Bozkurt B Aguilar D Allen LA Byun JJ Colvin MM et al 2022 AHA/ACC/HFSA guideline for the management of heart failure: a report of the American College of Cardiology/American Heart Association Joint Committee on Clinical Practice Guidelines. Circulation. (2022) 145(18):e895–1032. 10.1161/CIR.0000000000001063
5.
Mohebi R Wang D Lau ES Parekh JK Allen N Psaty BM et al Effect of 2022 ACC/AHA/HFSA criteria on stages of heart failure in a pooled community cohort. J Am Coll Cardiol. (2023) 81(23):2231–42. 10.1016/j.jacc.2023.04.007
6.
Cai A Zheng C Qiu J Fonarow GC Lip GYH Feng Y et al Prevalence of heart failure stages in the general population and implications for heart failure prevention: reports from the China Hypertension Survey 2012−15. Eur J Prev Cardiol. (2023) 30(13):1391–400. 10.1093/eurjpc/zwad223
7.
Hieda M Sarma S Hearon CM Jr MacNamara JP Dias KA Samels M et al One-year committed exercise training reverses abnormal left ventricular myocardial stiffness in patients with stage B heart failure with preserved ejection fraction. Circulation. (2021) 144(12):934–46. 10.1161/CIRCULATIONAHA.121.054117
8.
Nassif ME Windsor SL Borlaug BA Kitzman DW Shah SJ Tang F et al The SGLT2 inhibitor dapagliflozin in heart failure with preserved ejection fraction: a multicenter randomized trial. Nat Med. (2021) 27(11):1954–60. 10.1038/s41591-021-01536-x
9.
Kosiborod MN Abildstrom SZ Borlaug BA Butler J Rasmussen S Davies M et al Semaglutide in patients with heart failure with preserved ejection fraction and obesity. N Engl J Med. (2023) 389(12):1069–84. 10.1056/NEJMoa2306963
10.
Liang YD Zhang YN Li YM Chen YH Xu JY Liu M et al Identification of frailty and its risk factors in elderly hospitalized patients from different wards: a cross-sectional study in China. Clin Interv Aging. (2019) 14:2249–59. 10.2147/CIA.S225149
11.
Zheng PP Yao SM Shi J Wan YH Guo D Cui LL et al Prevalence and prognostic significance of frailty in gerontal inpatients with Pre-clinical heart failure: a subgroup analysis of a prospective observational cohort study in China. Front Cardiovasc Med. (2020) 7:607439. 10.3389/fcvm.2020.607439
12.
Xu H Huang L Jin E Liang Z Zhao M . Plasma metabolomic profiling of central serous chorioretinopathy. Exp Eye Res. (2021) 203:108401. 10.1016/j.exer.2020.108401
13.
Diboun I Ramanjaneya M Majeed Y Ahmed L Bashir M Butler AE et al Metabolic profiling of pre-gestational and gestational diabetes mellitus identifies novel predictors of pre-term delivery. J Transl Med. (2020) 18(1):366. 10.1186/s12967-020-02531-5
14.
Pang Z Chong J Zhou G de Lima Morais DA Chang L Barrette M et al Metaboanalyst 5.0: narrowing the gap between raw spectra and functional insights. Nucleic Acids Res. (2021) 49(W1):W388–96. 10.1093/nar/gkab382
15.
Williams M Capcha JMC Irion CI Seo G Lambert G Kamiar A et al Mouse model of heart failure with preserved ejection fraction driven by hyperlipidemia and enhanced cardiac low-density lipoprotein receptor expression. J Am Heart Assoc. (2022) 11(17):e027216. 10.1161/JAHA.122.027216
16.
Schiattarella GG Altamirano F Tong D French KM Villalobos E Kim SY et al Nitrosative stress drives heart failure with preserved ejection fraction. Nature. (2019) 568(7752):351–6. 10.1038/s41586-019-1100-z
17.
Pieroni M Moon JC Arbustini E Barriales-Villa R Camporeale A Vujkovac AC et al Cardiac involvement in fabry disease: JACC review topic of the week. J Am Coll Cardiol. (2021) 77(7):922–36. 10.1016/j.jacc.2020.12.024
18.
Wu CK Lee JK Hsu JC Su MM Wu YF Lin TT et al Myocardial adipose deposition and the development of heart failure with preserved ejection fraction. Eur J Heart Fail. (2020) 22(3):445–54. 10.1002/ejhf.1617
19.
Da Dalt L Castiglioni L Baragetti A Audano M Svecla M Bonacina F et al PCSK9 deficiency rewires heart metabolism and drives heart failure with preserved ejection fraction. Eur Heart J. (2021) 42(32):3078–90. 10.1093/eurheartj/ehab431
20.
Kawashima I Takeuchi I Ohsawa M Kotani M Tajima Y Inomata T et al Phospholipid storage in the myocardium of a unique Japanese case of idiopathic cardiomyopathy. Clin Chim Acta. (2006) 372(1-2):154–7. 10.1016/j.cca.2006.04.009
21.
Park TS Hu Y Noh HL Drosatos K Okajima K Buchanan J et al Ceramide is a cardiotoxin in lipotoxic cardiomyopathy. J Lipid Res. (2008) 49(10):2101–12. 10.1194/jlr.M800147-JLR200
22.
Simon JN Chowdhury SA Warren CM Sadayappan S Wieczorek DF Solaro RJ et al Ceramide-mediated depression in cardiomyocyte contractility through PKC activation and modulation of myofilament protein phosphorylation. Basic Res Cardiol. (2014) 109(6):445. 10.1007/s00395-014-0445-6
23.
Hahn VS Petucci C Kim MS Bedi KC Jr Wang H Mishra S et al Myocardial metabolomics of human heart failure with preserved ejection fraction. Circulation. (2023) 147(15):1147–61. 10.1161/CIRCULATIONAHA.122.061846
24.
Tan W Wang Y Cheng S Liu Z Xie M Song L et al Adiporon ameliorates the progression of heart failure with preserved ejection fraction via mitigating lipid accumulation and fibrosis. J Adv Res. (2025) 68:299–315. 10.1016/j.jare.2024.02.015
25.
Peng L Song Z Zhao C Abuduwufuer K Wang Y Wen Z et al Increased soluble epoxide hydrolase activity positively correlates with mortality in heart failure patients with preserved ejection fraction: evidence from metabolomics. Phenomics. (2023) 3(1):34–49. 10.1007/s43657-022-00069-8
26.
Costantino S Mengozzi A Velagapudi S Mohammed SA Gorica E Akhmedov A et al Treatment with recombinant Sirt1 rewires the cardiac lipidome and rescues diabetes-related metabolic cardiomyopathy. Cardiovasc Diabetol. (2023) 22(1):312. 10.1186/s12933-023-02057-2
27.
Wang X Chen X Wang Y He X Li L Wang X et al Astragaloside IV alleviates inflammation and improves myocardial metabolism in heart failure mice with preserved ejection fraction. Front Pharmacol. (2024) 15:1467132. 10.3389/fphar.2024.1467132
28.
Wang M Liu Z Ren S Zhu J Morisawa N Chua GL et al BCAA catabolism targeted therapy for heart failure with preserved ejection fraction. Theranostics. (2025) 15(13):6257–73. 10.7150/thno.105894
29.
Berger JH Shi Y Matsuura TR Batmanov K Chen X Tam K et al Two-hit mouse model of heart failure with preserved ejection fraction combining diet-induced obesity and renin-mediated hypertension. Sci Rep. (2025) 15(1):422. 10.1038/s41598-024-84515-9
30.
Socala K Nieoczym D Rundfeldt C Wlaz P . Effects of sarcosine, a glycine transporter type 1 inhibitor, in two mouse seizure models. Pharmacol Rep. (2010) 62(2):392–7. 10.1016/S1734-1140(10)70279-6
31.
Ito T Oishi S Takai M Kimura Y Uozumi Y Fujio Y et al Cardiac and skeletal muscle abnormality in taurine transporter-knockout mice. J Biomed Sci. (2010) 17(Suppl 1):S20. 10.1186/1423-0127-17-S1-S20
32.
Meddeb M Koleini N Binek A Keykhaei M Darehgazani R Kwon S et al Myocardial ultrastructure of human heart failure with preserved ejection fraction. Nat Cardiovasc Res. (2024) 3(8):907–14. 10.1038/s44161-024-00516-x
33.
Adams V Wunderlich S Mangner N Hommel J Esefeld K Gielen S et al Ubiquitin-proteasome-system and enzymes of energy metabolism in skeletal muscle of patients with HFpEF and HFrEF. ESC Heart Fail. (2021) 8(4):2556–68. 10.1002/ehf2.13405
34.
Tain YL Hsu CN . Toxic dimethylarginines: asymmetric dimethylarginine (ADMA) and symmetric dimethylarginine (SDMA). Toxins (Basel). (2017) 9(3), 92. 10.3390/toxins9030092
35.
Mair RD Sirich TL Meyer TW . Uremic toxin clearance and cardiovascular toxicities. Toxins (Basel). (2018) 10(6):226. 10.3390/toxins10060226
36.
Bode-Boger SM Scalera F Kielstein JT Martens-Lobenhoffer J Breithardt G Fobker M et al Symmetrical dimethylarginine: a new combined parameter for renal function and extent of coronary artery disease. J Am Soc Nephrol. (2006) 17(4):1128–34. 10.1681/ASN.2005101119
37.
Toutouzas K Riga M Stefanadi E Stefanadis C . Asymmetric dimethylarginine (ADMA) and other endogenous nitric oxide synthase (NOS) inhibitors as an important cause of vascular insulin resistance. Horm Metab Res. (2008) 40(9):655–9. 10.1055/s-0028-1083814
38.
Unger ED Dubin RF Deo R Daruwalla V Friedman JL Medina C et al Association of chronic kidney disease with abnormal cardiac mechanics and adverse outcomes in patients with heart failure and preserved ejection fraction. Eur J Heart Fail. (2016) 18(1):103–12. 10.1002/ejhf.445
39.
Shah SJ Borlaug BA Kitzman DW McCulloch AD Blaxall BC Agarwal R et al Research priorities for heart failure with preserved ejection fraction: national heart, lung, and blood institute working group summary. Circulation. (2020) 141(12):1001–26. 10.1161/CIRCULATIONAHA.119.041886
40.
Shah SJ Kitzman DW Borlaug BA van Heerebeek L Zile MR Kass DA et al Phenotype-specific treatment of heart failure with preserved ejection fraction: a multiorgan roadmap. Circulation. (2016) 134(1):73–90. 10.1161/CIRCULATIONAHA.116.021884
Summary
Keywords
heart failure with preserved ejection fraction, metabolomics, bioinformatics, pathophysiology, biomarker
Citation
Zou S, Zhang L-W, Wang T, Wan Y-H, Chai K, Wang S-M, Meng C, Cai J-P, Wang H and Yang J-F (2025) Comparison and identification of serum metabolomic profiles in Stage B and Stage C ejection fraction preserved heart failure. Front. Cardiovasc. Med. 12:1674243. doi: 10.3389/fcvm.2025.1674243
Received
27 July 2025
Accepted
19 September 2025
Published
07 October 2025
Volume
12 - 2025
Edited by
Tatsuya Sato, Sapporo Medical University, Japan
Reviewed by
Mengnan Liu, Southwest Medical University, China
Maria Kozhevnikova, I.M. Sechenov First Moscow State Medical University (Sechenov University), Russia
Updates
Copyright
© 2025 Zou, Zhang, Wang, Wan, Chai, Wang, Meng, Cai, Wang and Yang.
This is an open-access article distributed under the terms of the Creative Commons Attribution License (CC BY). The use, distribution or reproduction in other forums is permitted, provided the original author(s) and the copyright owner(s) are credited and that the original publication in this journal is cited, in accordance with accepted academic practice. No use, distribution or reproduction is permitted which does not comply with these terms.
* Correspondence: Jian-Ping Cai caijp61@vip.sina.com Hua Wang wh74220@aliyun.com Jie-Fu Yang yangjiefu2011@126.com
Disclaimer
All claims expressed in this article are solely those of the authors and do not necessarily represent those of their affiliated organizations, or those of the publisher, the editors and the reviewers. Any product that may be evaluated in this article or claim that may be made by its manufacturer is not guaranteed or endorsed by the publisher.