Abstract
Background:
Stress-induced hyperglycemia (SHG) represents a significant metabolic complication in non-diabetic cardiac surgery older adult patients, with substantial implications for postoperative outcomes. Despite its clinical importance, reliable predictive tools remain scarce. This study systematically compared the performance of logistic regression 5 s. advanced machine learning algorithms for SHG risk prediction in this vulnerable population.
Patients and Methods:
We conducted a retrospective cohort analysis of 600 patients (≥65 years) undergoing cardiac surgery at a tertiary medical center (January 2021–May 2025). Six clinically relevant perioperative variables were incorporated into five predictive models: logistic regression, Random Forest (RF), Gradient Boosting Machine (GBM), Adaptive Boosting (AdaBoost), and Extreme Gradient Boosting (XGBoost). Model performance was rigorously evaluated using AUC-ROC with 95% confidence intervals, sensitivity, specificity, positive (PPV) and negative predictive values (NPV), and precision.
Results:
The incidence of SHG in this cohort was 70.5%. Comparative analysis revealed logistic regression as the top-performing model (AUC 0.944, 95% CI 0.923–0.966), surpassing other algorithms: GBM (0.923, 0.902–0.952), 10GBoost (0.904, 0.890–0.941), AdaBoost (0.916, 0.871–0.936), and RF (0.877, 0.866–0.932). Moreover, the logistic model achieved optimal performance in sensitivity (94.5%), specificity (93.4%), PPV (97.7%), and NPV (96.8%).
Conclusion:
In contrast to more complex machine learning approaches, logistic regression demonstrated superior predictive accuracy for SHG in non-diabetic cardiac surgery older adult patients. Its exceptional performance metrics and clinical interpretability support its practical utility as an effective decision-support tool for perioperative risk stratification and management.
1 Introduction
Stress-induced hyperglycemia (SIH) following cardiac surgery presents a formidable clinical challenge, with reported incidence rates as high as 27.9% in cardiothoracic populations (1). Increasing evidence suggests that SIH is not merely a transient metabolic disturbance but a strong predictor of both acute complications—such as cardiogenic shock, life-threatening arrhythmias, and cerebrovascular events (2, 3)—and long-term mortality in patients without diabetes (4, 5). The stress hyperglycemia ratio (SHR) has demonstrated superior prognostic value than conventional glucose metrics for predicting adverse cardiovascular outcomes (4), with the first 48-h postoperative period representing a critical window for glycemic monitoring (6, 7). While current management protocols recommend maintaining glucose levels within 140–180 mg/dL (8–12), these reactive measures fail to address the pressing need for proactive risk identification, highlighting a key limitation and reinforcing the importance of predictive modeling in perioperative care.
Existing approaches to SIH prediction face several critical limitations that constrain their clinical utility. First, most models disproportionately focus on diabetic populations, overlooking the unique pathophysiology of non-diabetic individuals. Second, they often fail to integrate key metabolic-inflammatory markers, (e.g., C-reactive protein [CRP] and white blood cells [WBC], which significantly influence hyperglycemic responses (13, 14). Third, conventional statistical models lack the sophistication to capture complex clinical patterns, while machine learning alternatives are hampered by poor interpretability due to their reliance on statistically derived rather than clinically meaningful features (15). This “black box” problem presents particular challenges in surgical settings where transparent, actionable predictions are essential. The absence of comprehensive comparisons between traditional and advanced predictive methods further compounds these limitations.
Our research addresses these gaps through a systematic evaluation of logistic regression vs. contemporary machine learning algorithms [e.g., Extreme Gradient Boosting Machine [eGBM], Extreme Gradient Boosting [XGBoost], and Random Forest [RF]] for SIH prediction. This study employs an innovative approach that integrates three key elements: using clinically relevant variables with established pathophysiological significance; performing rigorous algorithmic comparison to optimize both accuracy [area under the curve (AUC) > 0.94] and clinical utility; and demonstrating that logistic regression provides a superior balance between performance and interpretability. The resulting model enables early identification of high-risk patients while maintaining clinical transparency, which is a crucial advantage over existing alternatives (16). By bridging the gap between computational sophistication and clinical applicability, this work represents a significant advancement in perioperative risk prediction and patient management.
2 Material and methods
2.1 Definition of stress hyperglycemia
SHG refers to a transient increase in blood glucose levels in individuals without a prior history of diabetes, occurring under conditions of severe stress such as major trauma, critical infections, or cardiovascular events. Prior to the stressor, the individual's blood glucose is completely normal; however, during the stress response, blood glucose levels significantly exceed the normal range. Once the stressor is removed, blood glucose levels typically return to normal. Currently, there is no standardized diagnostic criterion for stress hyperglycemia in China. The American Diabetes Association (ADA) defines the diagnostic criteria for SHG (17), which include fasting blood glucose levels ≥7.0 mmol/L on two or more occasions, or random blood glucose levels ≥11.1 mmol/L, in non-diabetic patients during periods of acute stress. In this study, to ensure consistency, all postoperative blood glucose measurements were obtained under fasting conditions in the morning according to the hospital's standardized testing protocol. Measurements were taken before meals and outside acute stress events to minimize confounding influences on glucose levels.
2.2 Measurement methods of stress hyperglycemia
The blood glucose levels were monitored using the Shengjia Steady Hao model rapid glucose meter to measure capillary blood glucose. According to the blood glucose monitoring guidelines reported in the literature (18, 19), when the patient's blood glucose concentration is 8.0 mmol/L or above, it is monitored every 0.5–1.0 h. When the blood glucose concentration is below 8.0 mmol/L, it is monitored every 2 h. Once the blood glucose results stabilize for 4 h, monitoring is performed every 4 h. Postoperatively, when blood glucose levels range from 8.0 mmol/L to 12.0 mmol/L, the glucose infusion rate is adjusted accordingly. If blood glucose levels exceed 12.0 mmol/L, insulin therapy is administered via intravenous micro-pump injection of recombinant insulin with a concentration ratio of 1:5–1:1. The initial dosage is 0.05 U/(kg·h) to 0.10 U/(kg·h), and the micro-pump speed is adjusted based on the blood glucose levels. The maximum insulin infusion rate is 0.5 U/(kg·h) (20).
2.3 Study endpoints
The occurrence of SHG after cardiac surgery was used as the outcome variable.
2.4 Setting
The 423 patients from January 2021 to 2024 May constituted the modeling group for internal validation, and the 177 patients from June 2024 to May 2025 constituted the validation group for external validation.
2.5 Study population
A retrospective collection of 600 patients treated at the First Affiliated Hospital of Bengbu Medical University between January 2021 to May 2025 was included in the study.
2.6 Inclusion and exclusion criteria
2.6.1 Inclusion criteria
The study population comprised consecutive adult patients (≥18 years) who underwent elective or emergency cardiac surgical procedures at our tertiary referral center. Eligible surgical interventions included isolated coronary artery bypass grafting (CABG), valve replacement/repair procedures, and combined major cardiac vascular operations. Strict diabetes exclusion criteria were applied, requiring: (i) absence of documented diabetes mellitus in medical records or by patient self-report, (ii) confirmation of normoglycemic status per ADA standards (preoperative fasting plasma glucose <7.0 mmol/L and HbA1c<6.5%). All enrolled participants either provided written informed consent (prospective cohort) or had comprehensively documented medical records with institutional review board approval (retrospective cohort), with mandatory availability of serial postoperative glucose measurements (minimum 48 h monitoring period) for reliable assessment of stress-induced glycemic responses.
2.6.2 Exclusion criteria
We applied rigorous exclusion parameters to ensure cohort homogeneity and data quality: (i) any preoperative diagnosis of diabetes mellitus or current antihyperglycemic therapy use; (ii) evidence of significant hepatic dysfunction (Child-Pugh class C cirrhosis) or end-stage renal disease (eGFR <30 mL/min/1.73 m2); (iii) preoperative systemic inflammatory conditions (sepsis, septic shock, or severe active infection); (iv) known secondary causes of glucose metabolism disorders (including paraneoplastic syndromes and endocrine disorders such as Cushing's syndrome or uncontrolled thyroid dysfunction); (v) postoperative mortality or study attrition within the initial 48-hour metabolic monitoring window; and (vi) inadequate glycemic monitoring (defined as either missing glucose values or insufficient measurement frequency to permit reliable assessment of glycemic variability).
2.7 Ethics statements
This study follows the principles of the Declaration of Helsinki and has been approved by the Ethics Committee of the First Affiliated Hospital of Bengbu Medical University [approval number (2024):KY012]. The research subjects understand the research purpose and collect data after obtaining informed consent. The research subjects may withdraw from the study at any time. The medical records of the research subjects are digitally encoded, stored anonymously and securely, and are only used for this study.
2.8 Model development and training strategy
In this study, five models—logistic regression (GLM), random forest (RF), gradient boosting machine (GBM), XGBoost, and AdaBoost—were constructed for comparison. To ensure fair comparison across models, all algorithms were trained using default parameter configurations without systematic hyperparameter tuning, except for the GBM model, in which the optimal number of trees was selected via fivefold cross-validation. This strategy minimized human-induced optimization bias, ensured consistent evaluation conditions, and maintained the stability and reproducibility of the results.
2.9 Model construction plan
In this study, we conducted a comparative evaluation of five machine learning algorithms—logistic regression (GLM), random forest (RF), gradient boosting machine (GBM), XGBoost, and AdaBoost. To ensure an unbiased comparison, all models were trained using their default parameter settings without systematic hyperparameter tuning, thereby minimizing the influence of manual optimization and enabling an objective assessment under consistent experimental conditions. A logistic regression model was employed to predict the outcome of stress hyperglycaemia. Patients were randomly divided into training and validation datasets at a 7:3 ratio. Variables showing significance in univariate analyses were included in the multivariable model, with forward and backward stepwise selection applied for variable refinement (21–24). Based on the resulting regression coefficients, an individualised nomogram was constructed to predict stress hyperglycaemia during major surgery. The model's performance was evaluated in the validation cohort using the area under the receiver operating characteristic curve (AUC). The remaining machine learning models—RF, GBM, AdaBoost, and XGBoost—were similarly developed to enable a comprehensive comparison of predictive performance.
2.10 Data collection
The study utilized comprehensive clinical data extracted from the hospital's electronic medical records system. To ensure clinical relevance and predictive validity, we systematically selected preoperative and intraoperative variables with established or plausible associations with stress-induced hyperglycemia. The collected parameters encompassed: (1) demographic and baseline clinical characteristics including age, sex, BMI, comorbidities (hypertension, prior cardiac surgery, cardiovascular disease, chronic obstructive pulmonary disease, chronic kidney disease, and cerebrovascular disease), ASA physical status classification, valvular heart disease, substance use history (smoking and alcohol consumption), hyperlipidemia, congestive heart failure, anemia, cardiogenic shock, recent myocardial infarction, aortic dissection, pulmonary disease, and advanced cardiac dysfunction (NYHA class ≥3); (2) preoperative medication exposure, particularly glucocorticoid administration (dexamethasone or methylprednisolone); (3) laboratory parameters including leukocyte count, serum uric acid, CRP, and renal function markers (with creatinine >200 μmol/L defined as clinically significant elevation); and (4) intraoperative variables consisting of surgical procedure type, operative duration, estimated blood loss, transfusion requirements (encompassing all blood product components), vasopressor use (norepinephrine), combined valve/CABG procedures, aortic cross-clamp time ≥110 min, reoperation status, prolonged cardiopulmonary bypass (>3 h), and CPB-associated hyperoxia.
2.11 Statistical and predictive modeling methodology
Statistical analyses were performed using a two-stage analytical framework. Initial univariate screening of potential risk factors was conducted in SPSS (v27.0), with statistically significant variables (p < 0.05) subsequently incorporated into multivariate logistic regression models after assessing multicollinearity through variance inflation factors (VIF <5 considered acceptable). For predictive modeling, the dataset underwent stratified random partitioning (70:30 training:validation ratio) to preserve outcome distribution. Five distinct algorithms—logistic regression, RF, GBM, AdaBoost, and XGBoost—were implemented in R (v4.2.2) using standardized preprocessing pipelines. Model performance was rigorously evaluated through: (1) internal 5-fold cross-validation within the training cohort, and (2) external validation using the hold-out set, with comprehensive metrics including AUC-ROC, sensitivity, specificity, PPV/NPV, and precision. Ensemble methods additionally underwent feature importance analysis to quantify predictor contributions, ensuring both predictive accuracy and clinical interpretability.
2.12 Data division and justification for selected predictive models in clinical settings
Total sample size: 600 non-diabetic patients undergoing cardiac surgery. Data partitioning: The dataset was randomly divided into a training (modeling) set (n = 423, 70%) and an independent validation set (n = 177, 30%).
Cross-validation: Within the training set only, five-fold cross-validation was used to train the models and tune internal parameters (e.g., number of trees in the GBM).The validation set remained completely independent and was not used during model training or cross-validation. A schematic flowchart of the data splitting and validation procedure has been added to the revised manuscript to illustrate this process more clearly.
To ensure methodological rigor, we used stratified random sampling to split the dataset into training (70%) and validation (30%) sets (see Figure 1). This strategy maintained consistent distributions of both hyperglycemic (SIH) and normoglycemic (AH) cases across partitions, thereby minimizing sampling bias and preserving the clinical prevalence of the target condition. Within the training cohort, we employed k-fold cross-validation to enhance model generalizability and prevent overfitting. For predictive modeling, we strategically selected five established algorithms representing distinct methodological approaches: logistic regression provided a clinically interpretable parametric baseline, while four advanced ensemble methods—RF, GBM, AdaBoost, and XGBoost—were implemented to capture complex nonlinear relationships and interaction effects while maintaining interpretability through feature importance quantification. This comprehensive analytical framework enabled robust comparison of traditional statistical modeling with contemporary machine learning techniques, balancing predictive performance with clinical applicability.
Figure 1
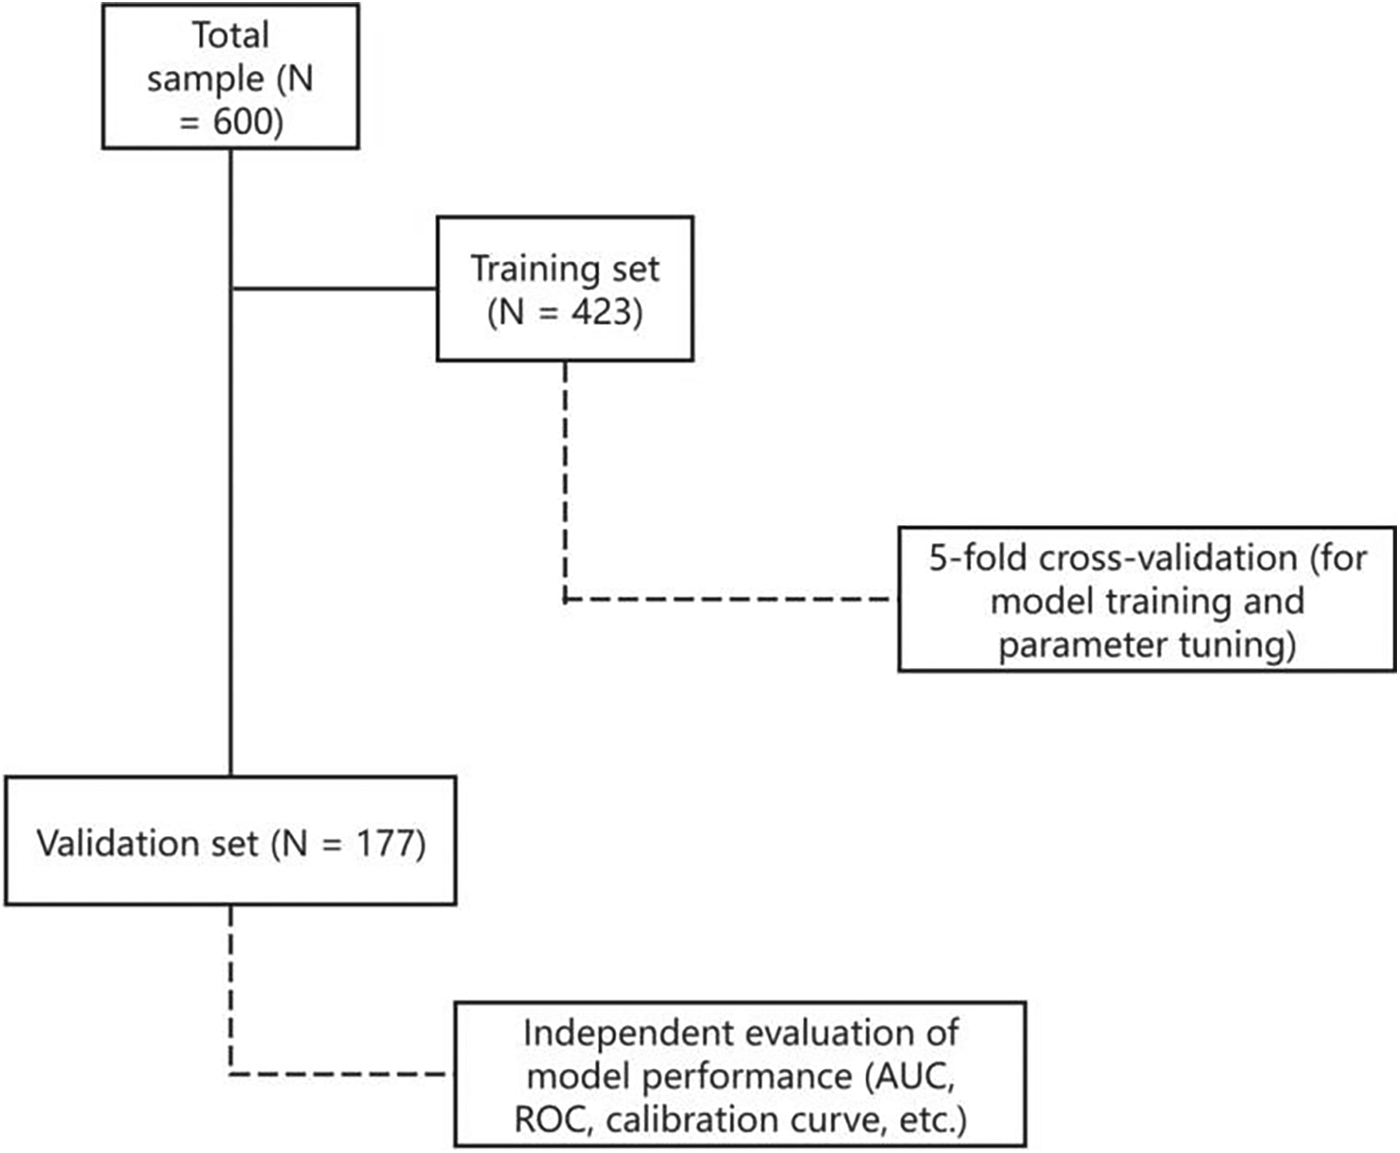
Data splitting and validation flowchart.
2.13 Validation strategies
To ensure comprehensive evaluation of model performance, we implemented a tripartite validation strategy incorporating both internal and external validation methodologies. First, k-fold cross-validation was systematically employed, wherein the dataset was partitioned into k mutually exclusive subsets, with each subset serving sequentially as the validation set while the remaining k-1 subsets were used for model training. This approach effectively minimizes random sampling bias while providing robust estimates of model generalizability. Second, external validation was conducted using a temporally and geographically distinct patient cohort, offering critical assessment of real-world clinical applicability beyond the derivation dataset. Third, internal validation was performed through intensive resampling techniques, including both k-fold and leave-one-out cross-validation, enabling rigorous evaluation of model stability and reliability within the development cohort. This multi-dimensional validation framework provides complementary evidence of model performance across different clinical and methodological contexts.
2.14 Data preprocessing and model evaluation protocols
To ensure methodological rigor and reproducibility, we implemented a comprehensive data preprocessing and analytical pipeline comprising six key components: (1) missing data were addressed through multiple imputation by chained equations (MICE) to preserve dataset completeness while minimizing bias; (2) all continuous variables underwent z-score normalization to standardize feature scales, particularly critical for distance-sensitive algorithms (SVM, KNN) and linear models; (3) categorical variables were uniformly transformed using one-hot encoding to maintain consistency across model comparisons; (4) hyperparameter optimization was conducted via Bayesian optimization with Gaussian processes, enabling efficient identification of optimal parameter configurations for each algorithm; (5) model validation employed a stratified 5-fold cross-validation framework with maintained class distributions to robustly assess generalizability while mitigating overfitting; and (6) performance evaluation incorporated multiple complementary metrics including AUC-ROC, sensitivity, specificity, and precision-recall analysis to provide comprehensive assessment of model discrimination and calibration characteristics. This standardized protocol ensured consistent, reproducible model development while accounting for both predictive performance and clinical applicability.
2.15 Confounding control and adjustment
To minimize confounding in the SHG prediction model, we implemented a systematic approach encompassing strict cohort selection (non-diabetic adults >18 years undergoing cardiac surgery), prospective collection of key clinical and surgical variables (demographics, comorbidities, procedural details, and perioperative management), and rigorous analytical methods, including multivariable logistic regression with spline terms for non-linear effects, collinearity assessment, multiple imputation for missing data, and comprehensive sensitivity analyses (stratified models and penalized regression), thereby ensuring robust and clinically valid risk prediction.
2.16 Expected applications of the nomogram
This clinically validated nomogram provides four key utilities for perioperative management: (1) individualized risk quantification through weighted integration of demographic, preoperative, surgical, and postoperative parameters; (2) objective risk stratification (low/intermediate/high) to guide tiered intervention strategies—from intensive glucose monitoring/early insulin therapy for high-risk cases to standard surveillance for low-risk patients; (3) data-driven decision support that supplements clinical judgment for interventions, such as corticosteroid-associated glycemic control; and (4) optimized resource allocation by matching monitoring intensity and nursing care. The multidimensional scoring system of the tool balances precision with practicality in routine cardiac surgical practice.
2.17 Clinical application of the nomogram
The nomogram is implemented through a structured clinical workflow beginning with data acquisition, encompassing demographic characteristics (e.g., age, sex, BMI), preoperative comorbidities (e.g., hypertension, prior cardiac surgery), surgical variables (e.g., procedure type/duration, blood loss), and postoperative management (e.g., corticosteroid administration). Subsequently, risk quantification translates input variables into weighted scores via the algorithmic framework of the nomogram, with differential weighting reflecting each parameter's predictive contribution (e.g., corticosteroids >age). The aggregated scores are then converted into probabilistic estimates through validated calibration during risk projection (e.g., 0.25 = 25% SHG risk). Finally, risk-stratified management guides clinical actions: high-risk patients (≥50% probability) receive intensive monitoring and prophylactic insulin protocols, while low-risk patients undergo standard surveillance without additional interventions. This standardized yet adaptable protocol ensures reproducible risk assessment while preserving clinician discretion in therapeutic decision-making.
2.18 Missing data handling
All six predictive variables were first examined for missingness, and all were found to be complete (missing count = 0; missing rate = 0%). Consequently, multiple imputation by chained equations (MICE) was not applied. For studies with missing values, MICE can be used to impute variables under the assumption of missing at random, employing predictive mean matching for continuous variables and logistic regression for categorical variables. Typically, five imputed datasets are generated and analyzed separately, with final estimates pooled using Rubin's rules to account for variability between imputations. In the present study, logistic regression and all machine learning models (RF, GBM, XGBoost, AdaBoost) were trained and validated on the complete dataset, and all performance metrics, including ROC, AUC, and calibration, were calculated based on this dataset (25).
Assessment of model calibration using bootstrap resampling
3 Results
3.1 Patient characteristics
This retrospective cohort study evaluated 600 consecutive adult patients (>18 years) undergoing cardiac surgery at the First Affiliated Hospital of Bengbu Medical University between January 2021 and May 2025. Following rigorous application of inclusion/exclusion criteria with complete case analysis (no exclusions for missing data), the cohort was stratified into model development (n = 423) and validation (n = 177) groups. Postoperative stress-induced hyperglycemia (P-SIH) within 48–72 h occurred in 423 patients (70.5%), consistent with established metabolic stress responses following cardiac procedures. Analysis of P-SIH cases (n = 303) revealed male predominance (54.8% vs. 45.2% female) with primary surgical indications being valve procedures (49.2%) and coronary artery bypass grafting (39.9%). Key risk factors included advanced age (>65 years, 41.9%), obesity (BMI ≥28 kg/m2, 15.2%), and prevalent comorbidities, such as hypertension (53.5%), hyperlipidemia (41.3%), and congestive heart failure (22.4%). Notable metabolic markers included elevated uric acid (73.9%) and anemia (70.3%). Significant surgical factors comprised prolonged cardiopulmonary bypass (>3 h, 67%), extended aortic cross-clamp time (>90 min, 56.8%), and lengthy procedures (>5 h, 32.7%). Pharmacological contributors included norepinephrine administration (61.7%) and preoperative glucocorticoid use (79.5%), with high-risk patients (ASA ≥3: 6.3%; NYHA class ≥3: 32%) demonstrating particular susceptibility. The complete perioperative characteristics are detailed in Table 1.
Table 1
| Variables, n (%) | Category | AH (n = 120), n (%) | SIH (n = 303), n (%) | P-value |
|---|---|---|---|---|
| Sex | Male | 72 (60.0) | 166 (54.8) | 0.38 |
| Female | 48 (40.0) | 137 (45.2) | ||
| Age >65 years | No | 83 (69.2) | 176 (58.1) | 0.04 |
| Yes | 37 (30.8) | 127 (41.9) | ||
| Valvular heart disease | No | 30 (25.0) | 141 (46.5) | P < 0.0001 |
| Yes | 90 (75.0) | 162 (53.5) | ||
| Heart valve surgery | No | 37 (30.8) | 154 (50.8) | P < 0.0001 |
| Yes | 83 (69.2) | 149 (49.2) | ||
| Cardiac coronary artery bypass grafting | No | 90 (75.0) | 182 (60.1) | 0.004 |
| Yes | 30 (25.0) | 121 (39.9) | ||
| Great vascular surgery of the heart | No | 116 (96.7) | 293 (96.7) | 0.986 |
| Yes | 4 (3.3) | 10 (3.3) | ||
| Two kinds of operations | No | 112 (93.3) | 281 (92.7) | 0.83 |
| Yes | 8 (6.7) | 22 (7.3) | ||
| Three kinds of operations | No | 118 (98.3) | 301 (99.3) | 0.335 |
| Yes | 2 (1.7) | 2 (0.7) | ||
| BMI ≥ 28 Kg/m2n | No | 108 (90.0) | 257 (84.8) | 0.163 |
| Yes | 12 (10.0) | 46 (15.2) | ||
| Smoking history | No | 26 (21.7) | 67 (22.1) | 0.92 |
| Yes | 94 (78.3) | 236 (77.9) | ||
| Drinking history | No | 95 (79.2) | 253 (83.5) | 0.293 |
| Yes | 25 (20.8) | 50 (16.5) | ||
| History of cardiac surgery | No | 109 (90.8) | 271 (89.4) | 0.669 |
| Yes | 11 (9.2) | 32 (10.6) | ||
| Dialysis history | No | 115 (95.8) | 301 (99.3) | 0.011 |
| Yes | 5 (4.2) | 2 (0.7) | ||
| Hyperlipidaemia | No | 55 (45.8) | 178 (58.7) | 0.016 |
| Yes | 65 (54.2) | 125 (41.3) | ||
| Renal failure | No | 115 (95.8) | 300 (99.0) | 0.031 |
| Yes | 5 (4.2) | 3 (1.0) | ||
| Abnormal liver function | No | 115 (95.8) | 259 (85.5) | 0.003 |
| Yes | 5 (4.2) | 44 (14.5) | ||
| Congestive heart failure | No | 88 (73.3) | 235 (77.6) | 0.357 |
| Yes | 32 (26.7) | 68 (22.4) | ||
| Anaemia | No | 32 (26.7) | 90 (29.7) | 0.534 |
| Yes | 88 (73.3) | 213 (70.3) | ||
| Hypertension | No | 32 (26.7) | 141 (46.5) | P < 0.0001 |
| Yes | 88 (73.3) | 162 (53.5) | ||
| History of cardiogenic shock | No | 117 (97.5) | 299 (98.7) | 0.663 |
| Yes | 3 (2.5) | 4 (1.3) | ||
| Myocardial infarction | No | 103 (85.8) | 272 (89.8) | 0.25 |
| Yes | 17 (14.2) | 31 (10.2) | ||
| Leucocytosis | No | 99 (82.5) | 249 (82.2) | 0.938 |
| Yes | 21 (17.5) | 54 (17.8) | ||
| Increased neutrophil numbers | No | 99 (81.7) | 241 (79.5) | 0.489 |
| Yes | 21 (18.3) | 62 (20.5) | ||
| Elevated uric acid | No | 107 (89.2) | 79 (26.1) | P < 0.0001 |
| Yes | 13 (10.8) | 224 (73.9) | ||
| C-reactive protein increased >5 mg | No | 82 (68.3) | 113 (37.3) | P < 0.0001 |
| Yes | 38 (31.7) | 190 (62.7) | ||
| Creatinine increased >200 μmol | No | 113 (94.2) | 281 (92.7) | 0.6 |
| Yes | 7 (5.8) | 22 (7.3) | ||
| Cardiac function grade ≥3 | No | 77 (64.2) | 206 (68.0) | 0.452 |
| Yes | 43 (35.8) | 97 (32.0) | ||
| ASA score ≥3 | No | 103 (85.8) | 284 (93.7) | 0.009 |
| Yes | 17 (14.2) | 19 (6.3) | ||
| Valve combined heart bypass surgery | No | 112 (93.3) | 292 (96.4) | 0.174 |
| Yes | 8 (6.7) | 11 (3.6) | ||
| Aortic dissection | No | 114 (95.0) | 287 (94.7) | 1.00 |
| Yes | 6 (5.0) | 16 (5.3) | ||
| Intraoperative blood loss >1,200ml | No | 114 (95.0) | 291 (96.0) | 0.633 |
| Yes | 6 (5.0) | 12 (4.0) | ||
| Aortic occlusion time >90 min | No | 85 (70.8) | 131 (43.2) | <0.0001 |
| Yes | 35 (29.2) | 172 (56.8) | ||
| Blood transfusion | No | 88 (73.3) | 170 (56.1) | 0.001 |
| Yes | 32 (26.7) | 133 (43.9) | ||
| Operation time >5H | No | 42 (35.0) | 204 (67.3) | P < 0.0001 |
| Yes | 78 (65.0) | 99 (32.7) | ||
| Second operation | No | 116 (96.7) | 300 (99.0) | P < 0.0001 |
| Yes | 4 (3.3) | 3 (1.0) | ||
| Intraoperative norepinephrine administration | No | 86 (71.7) | 116 (38.3) | P < 0.0001 |
| Yes | 34 (28.3) | 187 (61.7) | ||
| Preoperative glucocorticoid administration | No | 105 (87.5) | 241 (79.5) | 0.56 |
| Yes | 15 (12.5) | 62 (20.5) | ||
| Cardiopulmonary bypass time >3H | No | 91 (75.8) | 100 (33.0) | P < 0.0001 |
| Yes | 29 (24.2) | 203 (67.0) | ||
| CPB hyperoxic state | No | 62 (51.7) | 207 (68.3) | 0.001 |
| Yes | 58 (48.3) | 96 (31.7) | ||
| Pulmonary disease | No | 110 (91.7) | 280 (92.4) | 0.797 |
| Yes | 10 (8.3) | 23 (8.6%) |
Patient characteristics and baseline variables.
AH, absence of hyperglycaemia; SIH, stress-induced hyperglycaemia.
(1) History of Cardiac Surgery: The patient had a prior history of cardiac surgery before this hospitalization. (2) The percentages primarily represent the proportion of patients included for each influencing factor related to postoperative SHG in non-diabetic patients undergoing cardiac surgery, expressed as a percentage of the total number in either the modeling or validation group. (3) All extracted influencing factors specifically refer to patients who developed SHG, indicating a potential association between these factors and the postoperative metabolic stress response in non-diabetic cardiac surgery patients. (4) Patients aged >18 years were eligible for inclusion to ensure enrollment of an adult cohort. Within this population, multivariate analysis identified age >65 years as an independent predictor of postoperative SIH in non-diabetic patients undergoing cardiac surgery.
3.2 Predictive nomogram for postoperative stress hyperglycemia: logistic regression vs. machine learning
A training dataset comprising 423 patients was used to develop the predictive model (Figure 2). The results of the univariate logistic regression analysis are presented in Table 2. Variables that were statistically significant in the univariate analysis were included in the multivariate logistic regression model. The independent risk factors for SIH identified in this analysis included liver dysfunction, high uric acid, CRP > 5 mg, surgical time >5 h, norepinephrine use, and CPB > 3H.
Figure 2
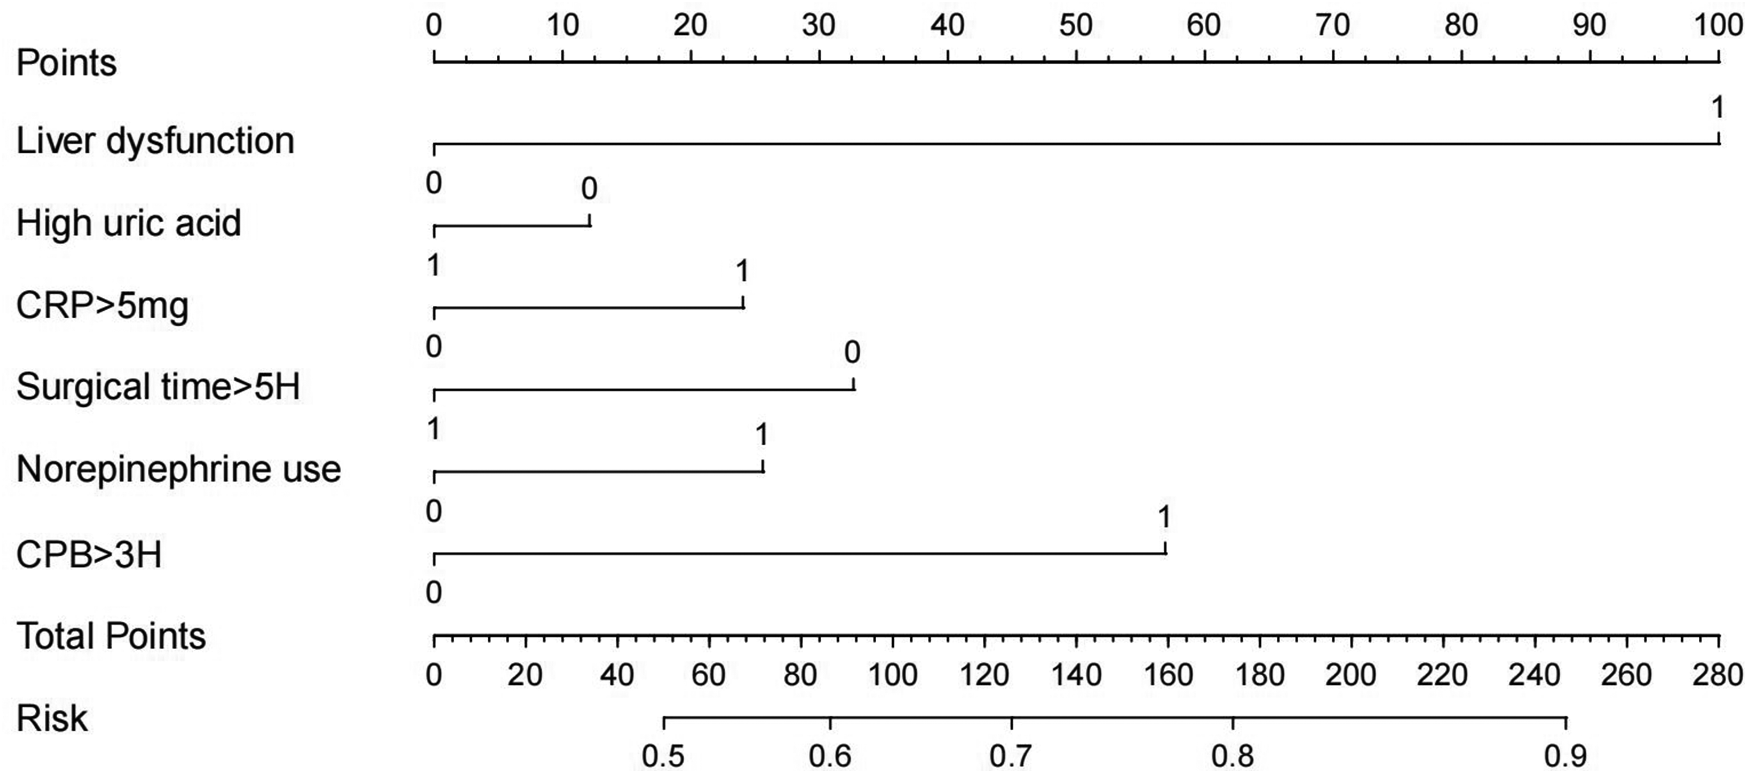
Nomogram of logistic regression model.
Table 2
| Variable | β | OR | Wldχ2 | 95% CI | SE | P-value |
|---|---|---|---|---|---|---|
| Liver dysfunction | 1.35 | 3.86 | 17.8 | 2.06, 7.23 | 0.32 | <0.001 |
| High uric acid | 2.842 | 17.149 | 16.622 | 4.374–67.233 | 0.697 | <0.001 |
| CRP > 5 mg | 2.016 | 7.508 | 9.936 | 2.144–26.300 | 0.64 | 0.002 |
| Surgical time >5H | −1.682 | 0.186 | 7.422 | 0.055–0.624 | 0.617 | <0.001 |
| Norepinephrine use | 2.486 | 12.008 | 15.344 | 3.462–41.648 | 15.344 | <0.001 |
| CPB > 3H | 2.506 | 12.252 | 0.712 | 3.032–49.499 | 0.712 | <0.001 |
Multivariate analysis of non-diabetic stress hyperglycaemia after cardiac surgery.
CI, confidence interval; CPB, cardiopulmonary bypass; CRP, C-reactive protein; H, hours; OR, odds ratio; SE, standard error; Wldχ2, Wald chi-squared statistic.
Based on the logistic regression analysis results, a risk prediction model for the occurrence of SHG in patients without diabetes undergoing cardiac surgery was constructed by incorporating significant factors. The logistic regression equation is as follows: −4.504 + (1.35 × Liver dysfunction) + (2.842 × High uric acid) + (2.016 × CRP > 5 mg) + (−1.682 × Surgical time >5H) + (2.486 × Norepinephrine use) + (2.506 × CPB >3H). A visual nomogram was developed, with each factor assigned a specific score. The total score—the sum of all individual scores—corresponds to the probability of SHG occurrence in non-diabetic cardiac surgery patients (Figure 1).
The predictive model was evaluated using 177 patients from the validation dataset, and demonstrated strong performance, with AUC of 0.944(95% CI: 0.923–0.966), sensitivity of 0.945, and specificity of 0.943. Six key variables were identified as the most relevant for predicting SIH (Table 3).
Table 3
| Model approach | AUC | Sensitivity | Specificity | PPV | NPV | F1 score |
|---|---|---|---|---|---|---|
| Glm | 0.944 (0.923–0.966) | 0.945 | 0.943 | 0.977 | 0.968 | 0.961 |
| RF | 0.877 (0.866–0.932) | 0.861 | 0.900 | 0.956 | 0.720 | 0.906 |
| GBM | 0.923 (0.902–0.952) | 0.934 | 0.716 | 0.892 | 0.811 | 0.912 |
| Adaboost | 0.916 (0.871–0.936) | 0.881 | 0.850 | 0.936 | 0.739 | 0.908 |
| XGB | 0.904 (0.890–0.941) | 0.924 | 0.658 | 0.872 | 0.774 | 0.898 |
Comparison of model performance characterised by AUC, sensitivity, specificity PPV and NPV.
AUC, area under the curve; PPV, positive predictive value; NPV, negative predictive value; RF, random forest; GBM, gradient boosting machine; Ada, adaptive boosting.
Table 4
| Model approach | AUC | Sensitivity | Specificity | PPV | NPV | F1 score |
|---|---|---|---|---|---|---|
| Glm | 0.895 (0.848−0.942) | 0.88 | 0.86 | 0.87 | 0.91 | 0.87 |
| RF | 0.780 (0.712–0.848) | 0.75 | 0.78 | 0.77 | 0.76 | 0.76 |
| GBM | 0.805 (0.740–0.870) | 0.78 | 0.79 | 0.79 | 0.81 | 0.78 |
| Adaboost | 0.816 (0.751–0.881) | 0.80 | 0.81 | 0.80 | 0.83 | 0.80 |
| XGB | 0.795 (0.727–0.863) | 0.77 | 0.78 | 0.78 | 0.80 | 0.77 |
Comparison of validation set characterised by AUC, sensitivity, specificity PPV, NPV and F1 score.
3.3 Development of different machine learning models for SHG
Five distinct machine learning algorithms were implemented to predict SHG risk in non-diabetic cardiac surgery patients: logistic regression, GBM, XGBoost, and AdaBoost (Figure 3). Model performance was rigorously evaluated through multiple metrics, including AUC-ROC, sensitivity, specificity, PPV, and NPV. Comparative analysis revealed that logistic regression achieved optimal performance, exhibiting both superior discriminative ability (highest AUC) and the most balanced sensitivity-specificity profile. Consequently, the logistic regression model was selected for external validation and subsequent development of the clinical nomogram.
Figure 3
Comparison of the calibration plot for stress-induced hyperglycemia.
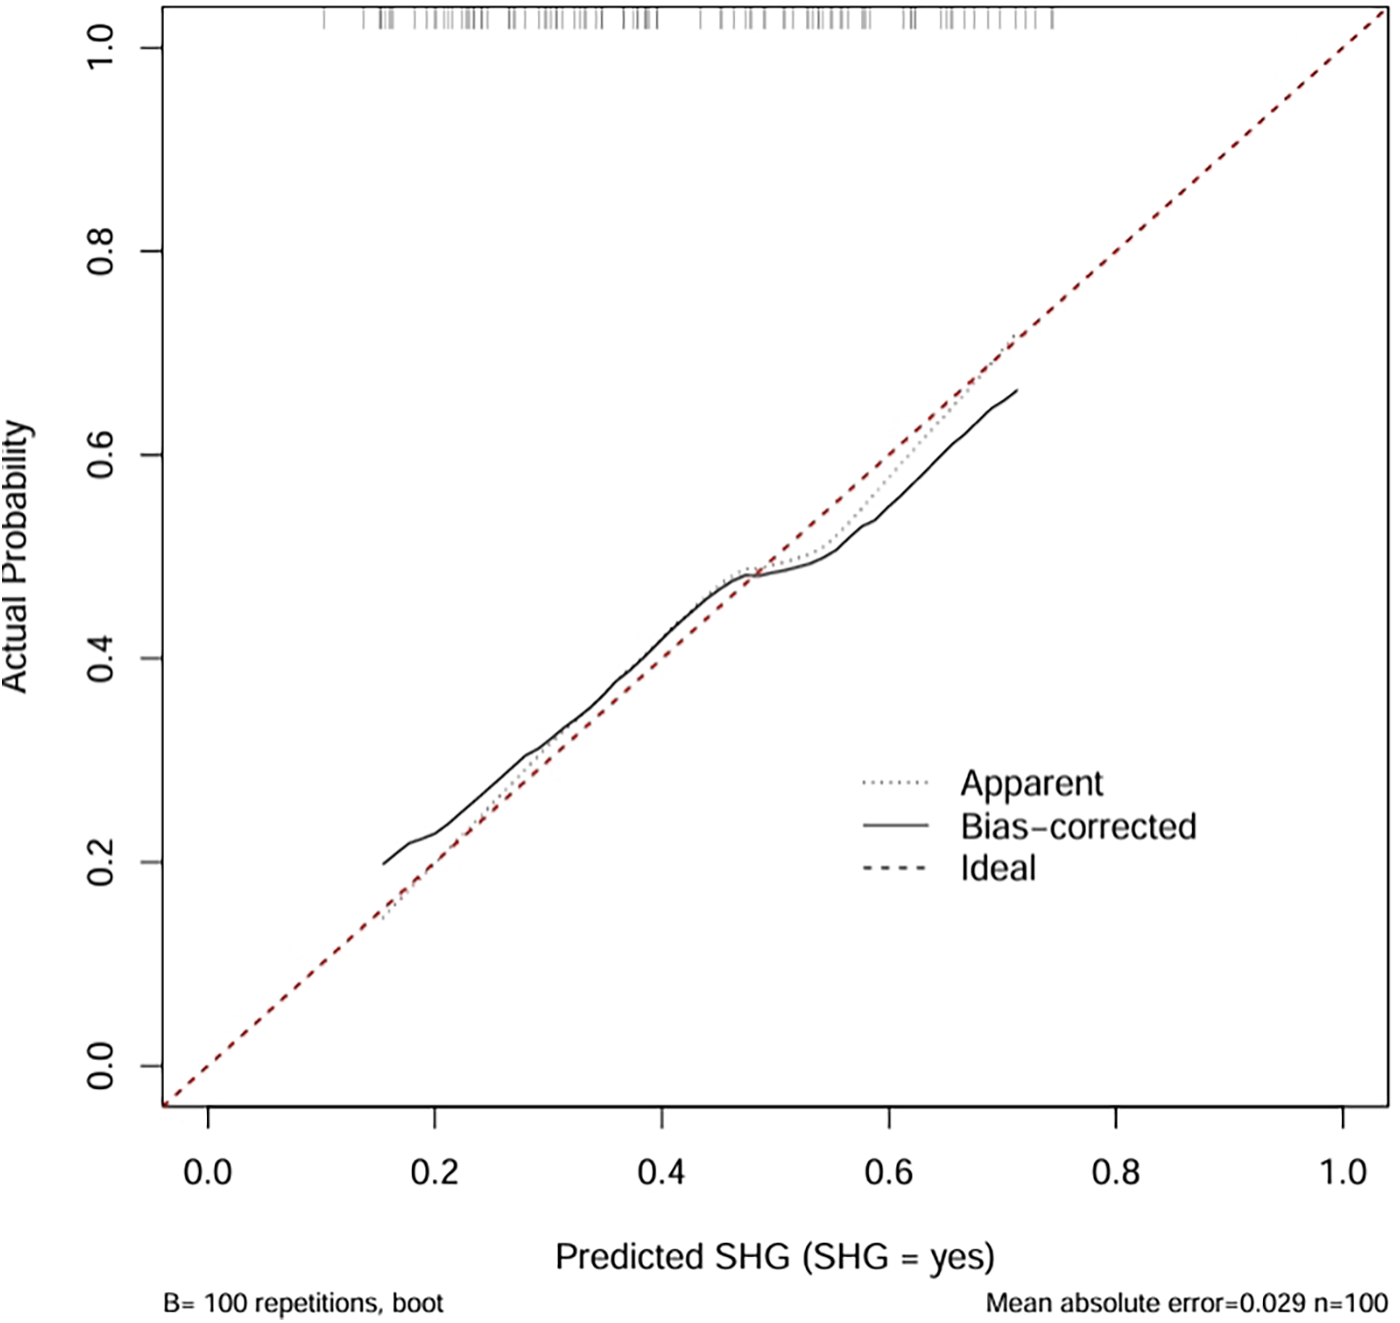
3.4 Calibration performance of the predictive model
The calibration plot assessed the accuracy of predicted probabilities from the logistic regression model (Figure 4). The “Apparent” curve represents the model's performance on the training data, while the “Bias-corrected” curve, derived via bootstrap resampling (B = 100 repetitions), adjusts for overfitting. Both curves closely align with the ideal diagonal, indicating excellent agreement between predicted probabilities and observed outcomes. The minimal mean absolute error of 0.029 further confirms high calibration accuracy, suggesting that the model provides reliable probability estimates for clinical application.
The calibration curve revealed that the bias-corrected line was closely aligned with both the apparent and ideal reference lines, indicating good agreement between predicted and observed probabilities. This suggests that the model is well-calibrated and not significantly overfitted to the training data. Calibration plots are used to evaluate the accuracy of predicted probabilities in a risk prediction model. The ideal line represents perfect prediction, where the predicted risk exactly matches the observed outcome. The apparent line reflects the model's performance on the training data, while the bias-corrected line, obtained through bootstrapping, adjusts for potential overfitting and provides a more reliable estimate of the model's calibration in future samples.
Figure 4
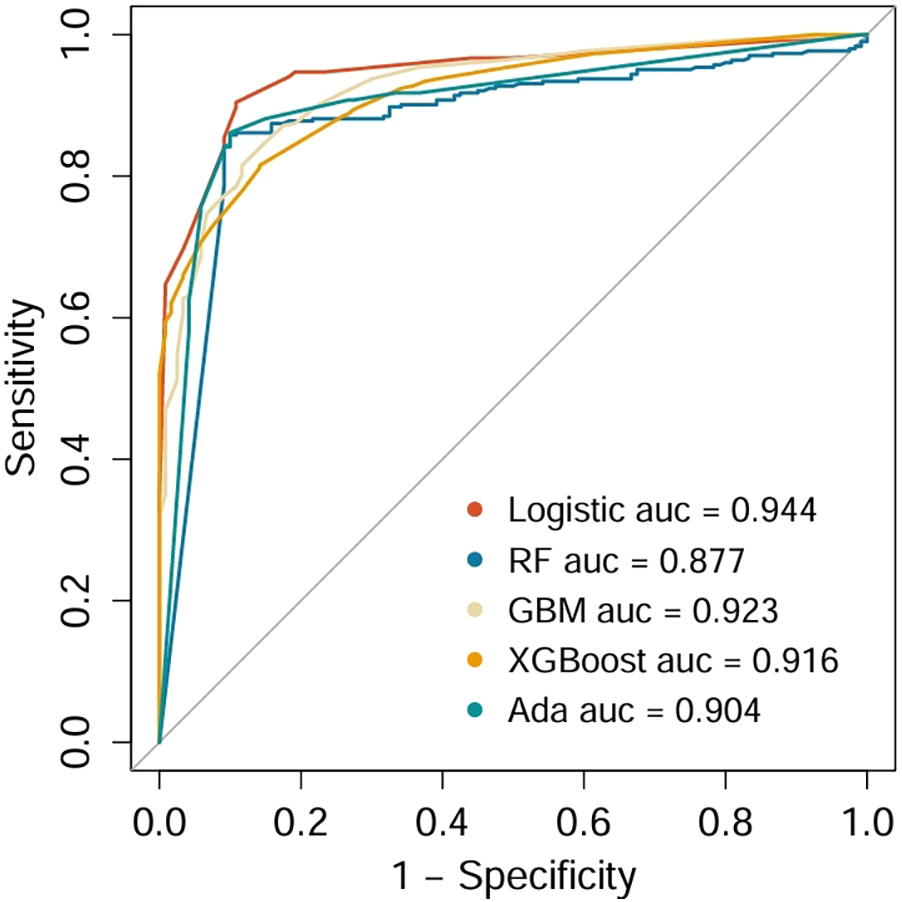
Comparison of ROCs and AUCs for prediction of SHG by the various machine learning models.
3.5 Model performance comparison and validation in non-diabetic cardiac surgery patients
The predictive performance of five models was compared using multiple evaluation metrics, including AUC, sensitivity, specificity, PPV, and NPV. Logistic regression demonstrated the highest discriminative ability with an AUC of 0.944, with favorable sensitivity (0.945), specificity (0.943), PPV (0.977), and NPV (0.968), outperforming the more complex machine learning models. Accordingly, logistic regression was selected as the optimal model for further validation. When applied to the independent validation cohort, the model achieved an AUC of 0.895, thereby confirming its robustness, generalizability, and clinical applicability for identifying non-diabetic cardiac surgery patients at high risk for SIH.
3.6 Decision curve analysis of a nomogram for postoperative stress hyperglycemia
Figure 5 presents the decision curve analysis (DCA), which evaluated the clinical utility of the nomogram for predicting SIH in non-diabetic cardiac surgery patients. The analysis framework incorporates: (1) threshold probability (x-axis) representing the minimum predicted risk at which clinical intervention would be considered, and (2) net benefit (y-axis) quantifying the trade-off between true-positive identifications and false-positive interventions across the probability spectrum. The logistic regression model demonstrated superior clinical utility, as evidenced by its consistently high net benefit across the clinically relevant threshold probability range of 20%–80%. This robust performance indicates that the model provides meaningful decision support for perioperative glycemic management in the specified risk range.
Figure 5
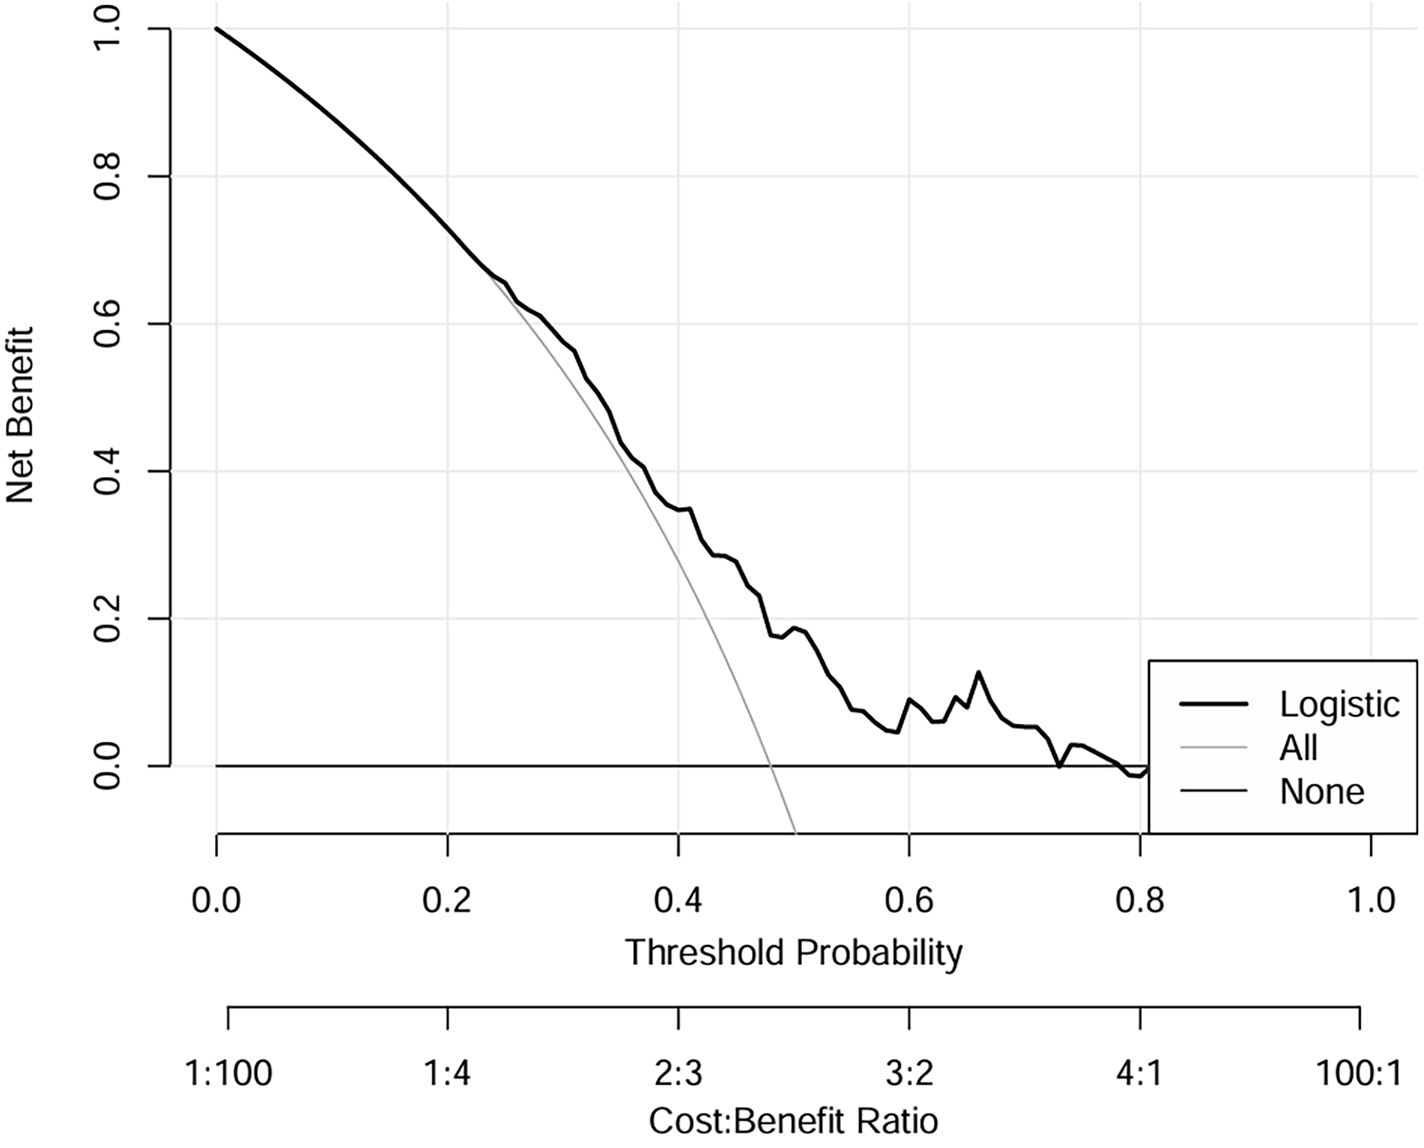
DCA of logistic regression model for the training dataset. Liver dysfunction, High uric acid, CRP > 5 mg, Surgical time >5H, Norepinephrine use, CPB > 3H. DCA, decision curve analysis.
3.7 External validation results
In the validation cohort (Table 4), GLM model maintained the best overall performance among all tested algorithms, with an AUC of 0.895 (95% CI: 0.848–0.942), sensitivity of 0.88, specificity of 0.86, PPV of 0.87, NPV of 0.91, and F1 score of 0.87. Ensemble models, including Random Forest (AUC = 0.780), GBM (AUC = 0.805), AdaBoost (AUC = 0.816), and XGBoost (AUC = 0.795), showed moderate predictive ability. These results further confirmed the strong discriminative capacity and external generalizability of the logistic regression model, justifying its selection for the final nomogram construction.
3.8 Interpretable analysis of a clinical prediction model using SHAP
We employed SHAP (SHapley Additive exPlanations) analysis to interpret the internal decision mechanisms of the prediction model. The global SHAP summary revealed that liver function indicators and hyperuricemia were the most influential features shaping model predictions. Higher liver enzyme levels were positively associated with an increased predicted risk, whereas higher, norepinephrine use,elevated C-reactive protein (CRP > 5 mg/L), and longer operative time (>5 h) showed negative SHAP contributions. Local interpretability using SHAP force plots further validated these effects by visualizing how individual feature contributions and their interactions collectively determined each patient's predicted risk. Overall, these SHAP-based findings underscore that the model's predictions are both physiologically plausible and transparent, thereby enhancing its clinical interpretability and trustworthiness (see Figures 6, 7A,B).
Figure 6
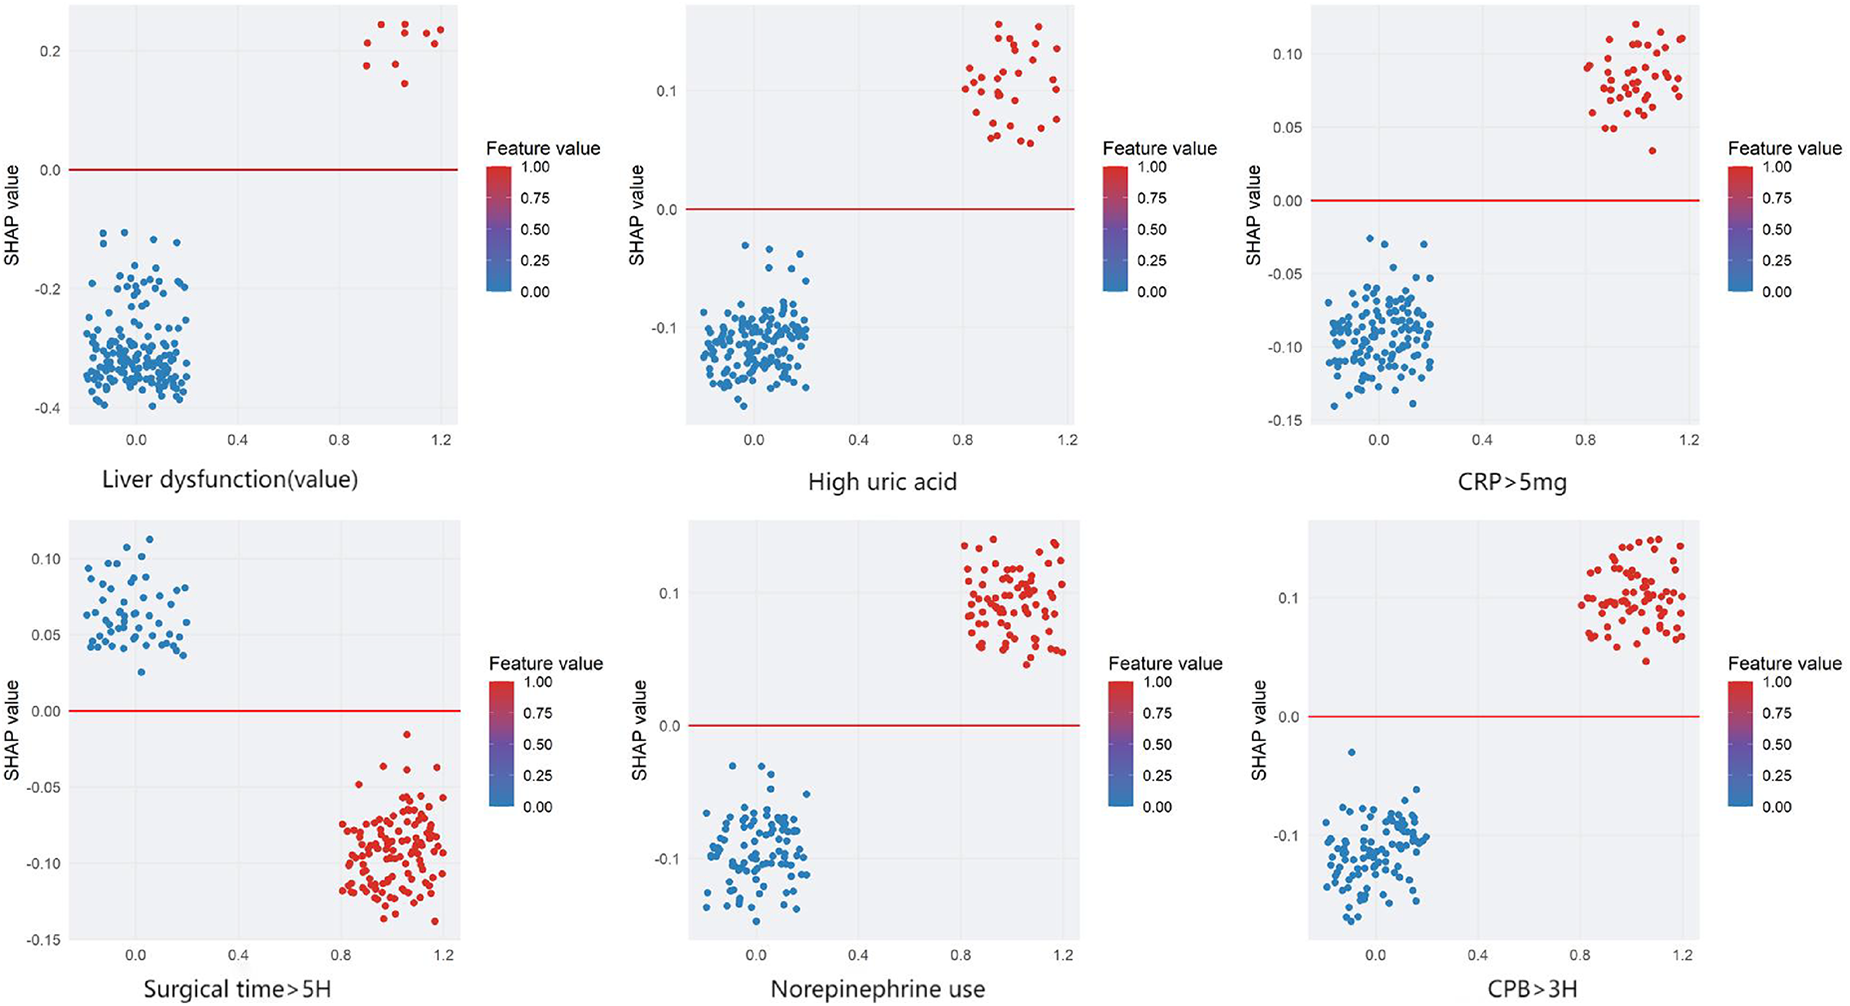
Shapley Additive exPlanations (SHAP) dependence plots for the model predicting stress hyperglycemia after cardiac surgery in non-diabetic patients. Features: Liver dysfunction, high uric acid, CRP > 5 mg, surgical time >5H, norepinephrine use, and CPB > 3H. The x-axis shows the SHAP value (impact on model output), and the y-axis lists the features. Each dot represents one patient. The color bar indicates the feature value (1 = yes, 0 = no). Positive SHAP values indicate a higher predicted risk of stress hyperglycemia, and negative values indicate a lower risk.
Figure 7
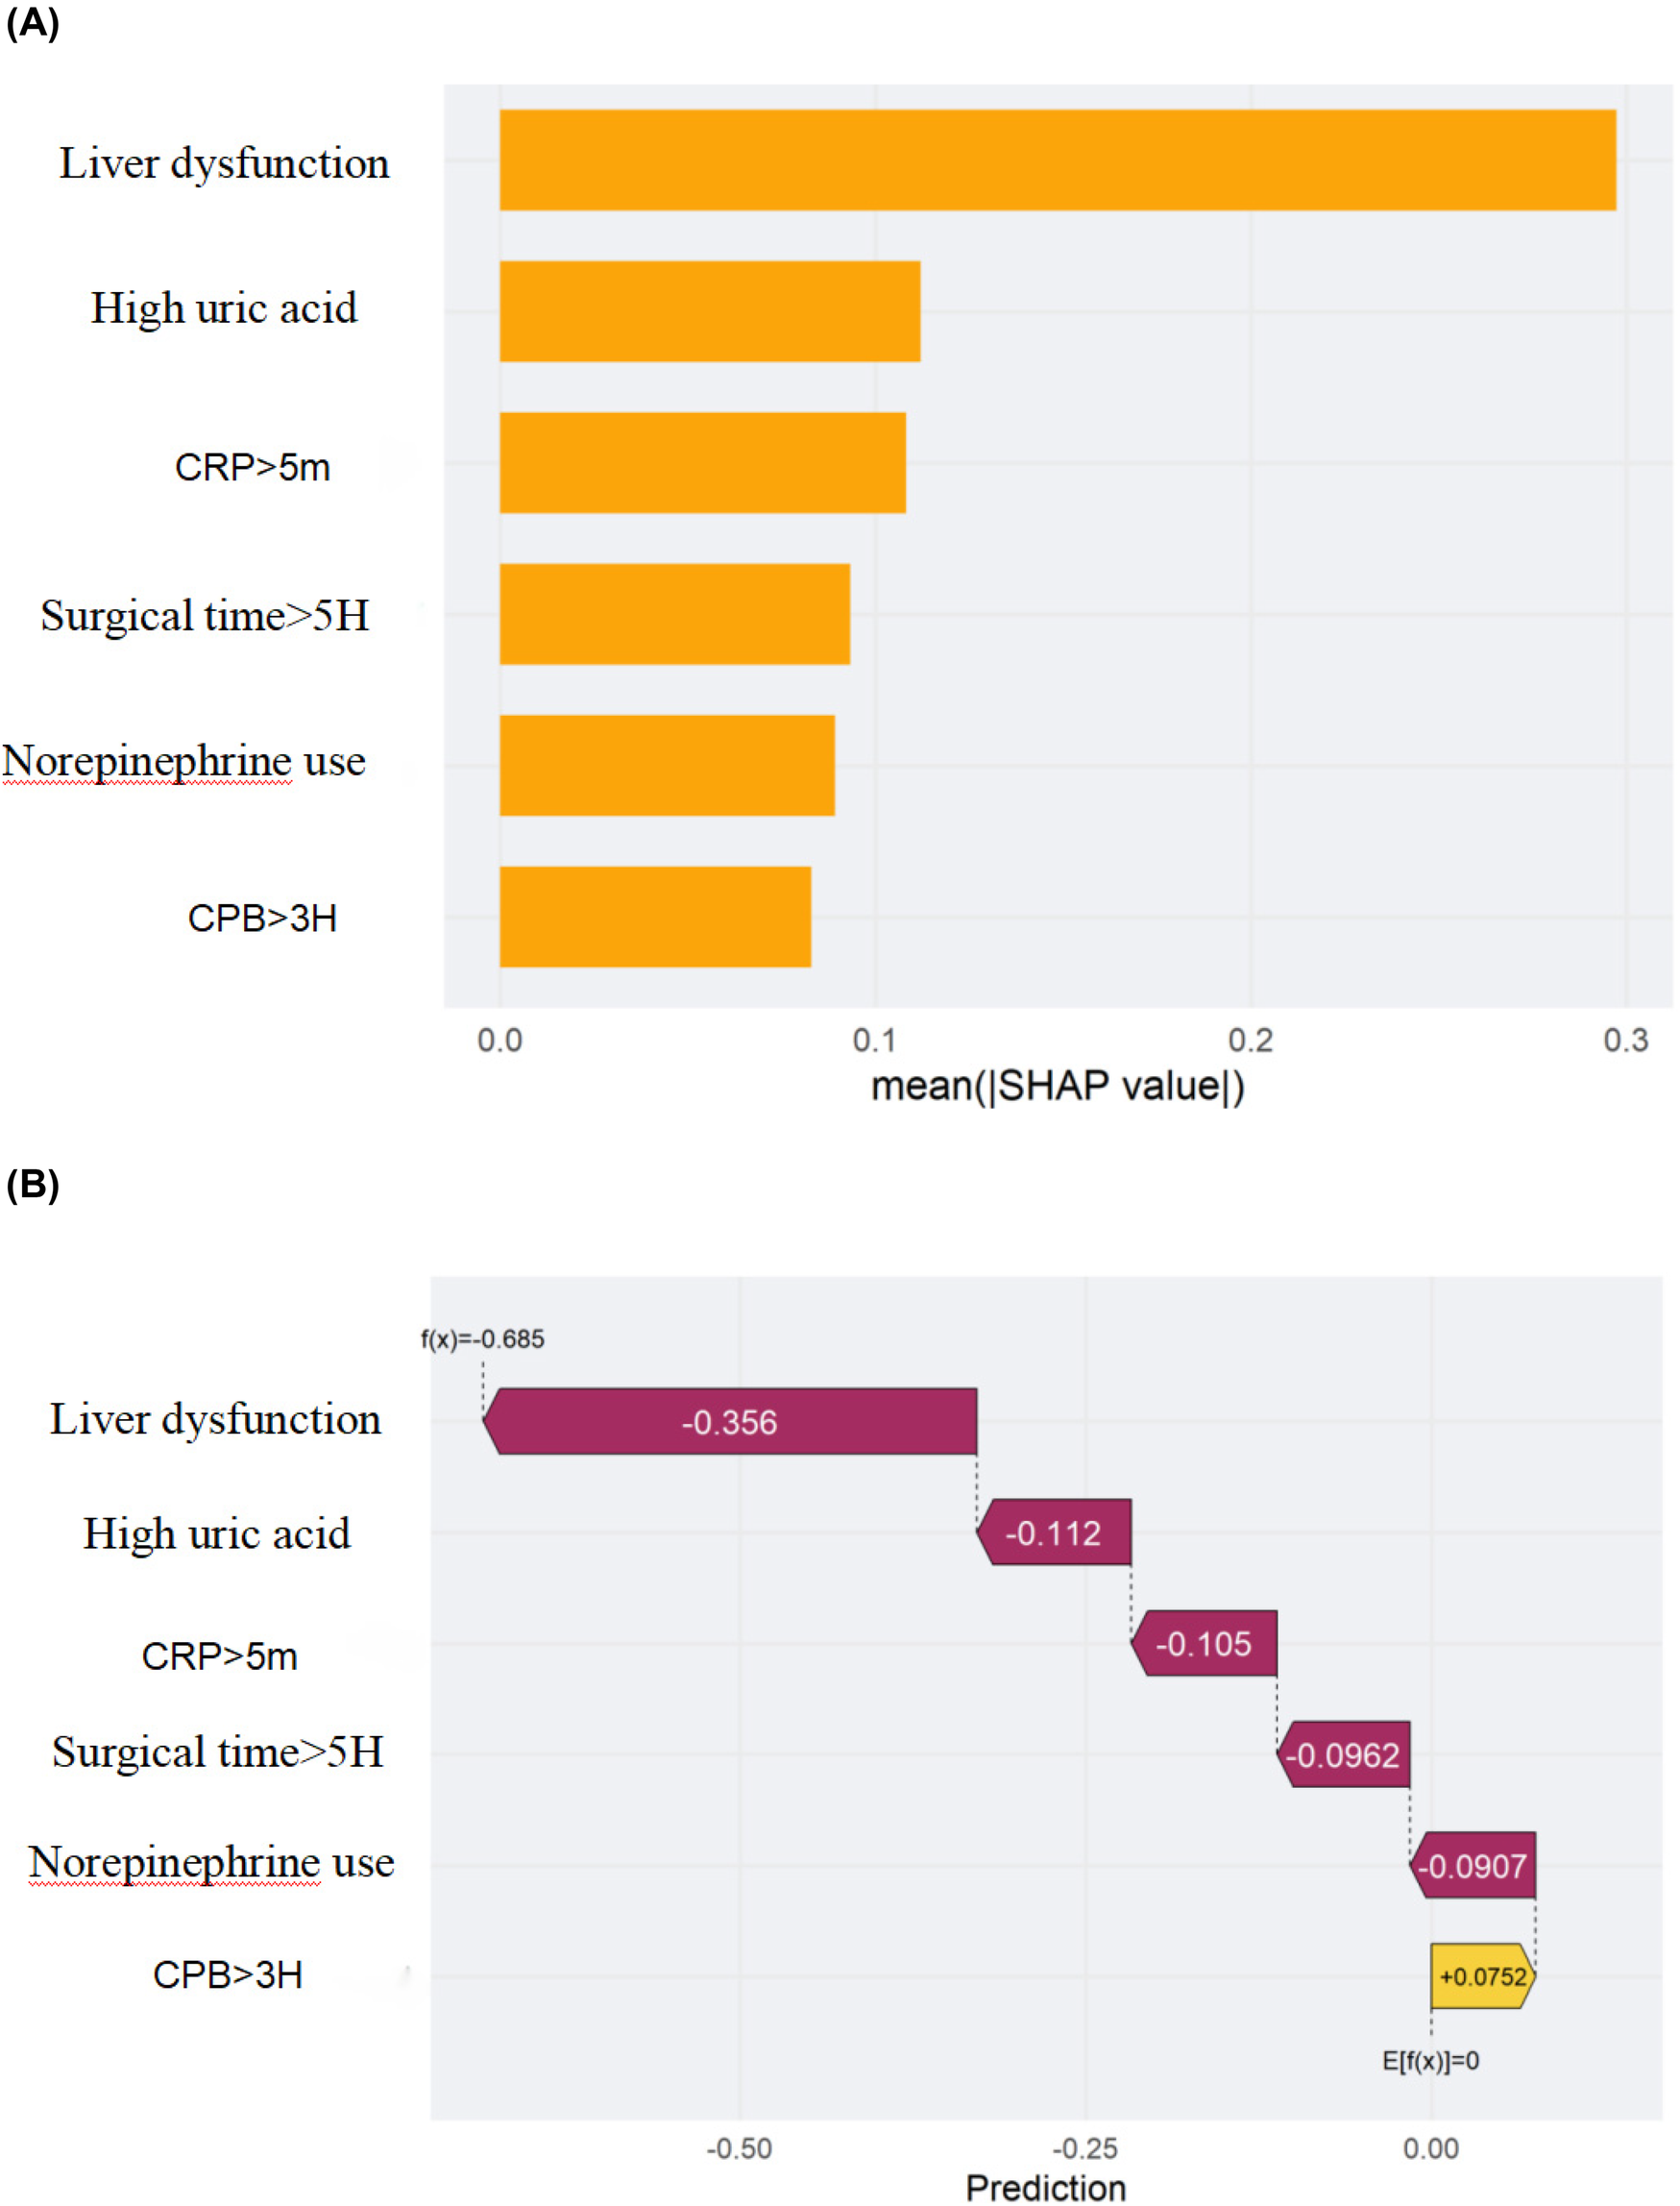
Shapley additive exPlanations (SHAP) of the machine-learning model for predicting stress hyperglycemia after cardiac surgery in non-diabetic patients. (A) Feature importance ranked by the mean absolute SHAP value across all patients. (B) SHAP decision (waterfall) plot for a representative patient showing how each feature shifts the prediction from the expected value. The x-axis denotes the SHAP value (impact on model output), and the y-axis lists the features. Each dot represents one patient in (A); in (B) each bar is the SHAP contribution of a feature for the selected patient. Positive SHAP values indicate a higher predicted risk, whereas negative values indicate a lower risk. Feature encoding: 1 = yes, 0 = no.
4 Discussion
In this study, we systematically developed and compared five predictive models—logistic regression, random forest, GBM, AdaBoost, and XGBoost—to identify stress-induced hyperglycemia (SIH) in 423 non-diabetic cardiac surgery patients. While previous studies have primarily focused on diabetic populations or lacked rigorous validation (26–29), research specifically addressing non-diabetic cardiac surgery patients remains limited, despite reported SIH incidence rates of 32.7%–75% in this cohort (30–32).
Notably, logistic regression outperformed more complex machine learning algorithms, achieving excellent discriminative ability (AUC = 0.944) with high sensitivity (94.5%), specificity (94.3%), positive predictive value (97.7%), and negative predictive value (96.8%). Its clinical applicability is further supported by a parsimonious model incorporating six readily obtainable perioperative variables—liver dysfunction, elevated uric acid, CRP >5 mg/L, surgical duration >5 h, norepinephrine administration, and cardiopulmonary bypass time >3 h—demonstrating robust performance in external validation (sensitivity 94.5%, specificity 93.4%). This balance of predictive accuracy and interpretability facilitates early risk stratification and individualized perioperative management, addressing a critical clinical need (33).
Several factors may explain the superior performance of logistic regression. First, the relatively small sample size may limit the ability of complex models to capture nonlinear interactions, potentially leading to overfitting. Second, the relationships between predictors and postoperative glucose appear predominantly linear, allowing logistic regression to effectively model these associations. Third, although all models except GBM were trained using default parameter settings to minimize potential optimization bias, future studies may explore whether more extensive hyperparameter tuning could reduce the performance gap between machine learning algorithms and logistic regression. Finally, logistic regression offers clear interpretability, enabling clinicians to intuitively assess each variable's contribution—a crucial advantage in clinical decision-making.
Compared with prior studies, our work provides three key advances: (1) comprehensive evaluation of five machine learning algorithms with rigorous internal and external validation; (2) identification of an interpretable model achieving optimal predictive performance; and (3) a practical, parsimonious structure facilitating early risk identification and individualized glycemic management while optimizing resource allocation.
Nevertheless, some limitations warrant consideration. The single-center, retrospective design may limit generalizability, and residual confounding cannot be excluded despite rigorous multivariate adjustment and imputation of missing data. Moreover, systematic hyperparameter tuning for complex models was not performed, which may offer further improvement in future studies.
5 Conclusion
In this study, we developed and validated a logistic regression model incorporating six perioperative variables—liver dysfunction, elevated uric acid, CRP >5 mg/L, surgical duration >5 h, norepinephrine administration, and cardiopulmonary bypass time >3 h—for predicting stress-induced hyperglycemia (SIH) in non-diabetic cardiac surgery patients. The model demonstrated excellent discriminative performance and consistently outperformed four advanced machine learning algorithms (random forest, GBM, XGBoost, and AdaBoost) in internal and external validation.
This work represents the first systematic comparison of multiple machine learning approaches for SIH prediction in this population, highlighting logistic regression as an optimal balance between predictive accuracy and clinical interpretability for perioperative risk stratification. Although machine learning methods are generally effective for high-dimensional datasets, inclusion of numerous predictors in a limited-sample clinical study may increase the risk of overfitting and reduce generalizability. Our variable selection process retained six clinically and statistically meaningful predictors, which captured the major risk signals of postoperative SIH while improving model robustness and interpretability.
The superior performance of logistic regression may be attributed to several factors. First, the relationships between the selected predictors and postoperative glucose levels were predominantly linear, enabling effective modeling with GLM. Second, the relatively small sample size may have limited the ability of more complex models to capture nonlinear or high-order interactions, potentially leading to overfitting. Finally, logistic regression offers clear interpretability by quantifying each variable's contribution, an important advantage in clinical contexts where transparency and actionable insights are essential. Therefore, under the specific conditions of this study, logistic regression provided a stable, reliable, and clinically applicable predictive tool for early identification of high-risk non-diabetic cardiac surgery patients.
Statements
Data availability statement
The raw data supporting the conclusions of this article will be made available by the authors, without undue reservation.
Ethics statement
The studies involving humans were approved by the First Affiliated Hospital of Bengbu Medical University. The studies were conducted in accordance with the local legislation and institutional requirements. The participants provided their written informed consent to participate in this study.
Author contributions
JW: Conceptualization, Methodology, Writing – original draft. MZ: Data curation, Conceptualization, Writing – original draft, Investigation, Methodology. SC: Writing – review & editing, Formal analysis, Conceptualization, Methodology, Investigation. GY: Investigation, Software, Data curation, Writing – original draft, Validation. LW: Data curation, Methodology, Investigation, Writing – review & editing. HD: Supervision, Writing – review & editing, Resources, Project administration. FX: Writing – review & editing, Supervision, Project administration, Resources.
Funding
The author(s) declare that no financial support was received for the research and/or publication of this article.
Acknowledgments
We would like to express our gratitude to all those who helped us during the writing of this manuscript.
Conflict of interest
The authors declare that the research was conducted in the absence of any commercial or financial relationships that could be construed as a potential conflict of interest.
Generative AI statement
The author(s) declare that no Generative AI was used in the creation of this manuscript.
Any alternative text (alt text) provided alongside figures in this article has been generated by Frontiers with the support of artificial intelligence and reasonable efforts have been made to ensure accuracy, including review by the authors wherever possible. If you identify any issues, please contact us.
Publisher’s note
All claims expressed in this article are solely those of the authors and do not necessarily represent those of their affiliated organizations, or those of the publisher, the editors and the reviewers. Any product that may be evaluated in this article, or claim that may be made by its manufacturer, is not guaranteed or endorsed by the publisher.
References
1.
Yan F Chen X Quan X Wang L Wei X Zhu J . Association between the stress hyperglycemia ratio and 28-day all-cause mortality in critically ill patients with sepsis: a retrospective cohort study and predictive model establishment based on machine learning. Cardiovasc Diabetol. (2024) 23(1):163. 10.1186/s12933-024-02265-4
2.
Li M Li Q Fan GL Li QW Liu WX Huang R . Analysis of influencing factors of hyperglycemia in patients after coronary artery bypass grafting. Tianjin Nurs J. (2019) 27(1):59–61. 10.3969/j.issn.1006-9143.2019.01.016
3.
Kushimoto S Abe T Ogura H Shiraishi A Saitoh D Fujishima S et al Impact of blood glucose abnormalities on outcomes and disease severity in patients with severe sepsis: an analysis from a multicenter, prospective survey of severe sepsis. PLoS One. (2020) 15(3):e0229919. 10.1371/journal.pone.0229919
4.
Pan SS Liang GY Liu DX Zhang J Wang F Tang Q et al A meta-analysis of the impact of strict glycemic control on the prognosis of non-diabetic patients undergoing cardiopulmonary bypass in cardiac surgery. Chin J Clin Cardiovasc Dis. (2019) 35:167–73. 10.13201/j.issn.1001-1439.2019.02.017
5.
Capes SE Hunt D Malmberg K Gerstein HC . Stress hyperglycaemia and increased risk of death after myocardial infarction in patients with and without diabetes: a systematic overview. Lancet. (2000) 355(9206):773–8. 10.1016/S0140-6736(99)08415-9
6.
Kourek C Georgopoulou M Kolovou K Rouvali N Panoutsopoulou M Kinti C et al Intensive care unit hyperglycemia after cardiac surgery: risk factors and clinical outcomes. J Cardiothorac Vasc Anesth. (2024) 38(1):162–9. 10.1053/j.jvca.2023.09.022
7.
Garg R Grover A McGurk S Rawn JD . Predictors of hyperglycemia after cardiac surgery in nondiabetic patients. J Thorac Cardiovasc Surg. (2013) 145(4):1083–7. 10.1016/j.jtcvs.2012.07.089
8.
Guerrero-Arroyo L Faulds E Perez-Guzman MC Davis GM Dungan K Pasquel FJ . Continuous glucose monitoring in the intensive care unit. J Diabetes Sci Technol. (2023) 17(3):667–78. 10.1177/19322968231169522
9.
Lazar HL McDonnell M Chipkin SR Bridges CR Haan CK Svedjeholm R et al The society of thoracic surgeons practice guideline series: blood glucose management during adult cardiac surgery. Ann Thorac Surg. (2009) 87(2):663–9. 10.1016/j.athoracsur.2008.11.011
10.
Torre T Schlotterbeck H Ferraro F Klersy C Surace G Toto F et al Continuous glucose monitoring system after coronary artery bypass graft surgery: a feasibility study. Asian Cardiovasc Thorac Ann. (2024) 32(4):179–85. 10.1177/02184923241240035
11.
ElSayed NA Aleppo G Aroda VR Bannuru RR Brown FM Bruemmer D et al Diabetes care in the hospital: standards of care in diabetes-2023. Diabetes Care. (2023) 46(suppl 1):S267–78. 10.2337/dc23-S016
12.
Thongsuk Y Hwang NC . Perioperative glycemic management in cardiac surgery: a narrative review. J Cardiothorac Vasc Anesth. (2024) 38(1):248–67. 10.1053/j.jvca.2023.08.149
13.
Sato H Hosojima M Ishikawa T Aoki K Okamoto T Saito A et al Glucose variability based on continuous glucose monitoring assessment is associated with postoperative complications after cardiovascular surgery. Ann Thorac Cardiovasc Surg. (2017) 23(5):239–47. 10.5761/atcs.oa.17-00045
14.
Clement KC Alejo D DiNatale J Whitman GJR Matthew TL Clement SC et al Increased glucose variability is associated with atrial fibrillation after coronary artery bypass. J Card Surg. (2019) 34(7):549–54. 10.1111/jocs.14071
15.
Li A Li H Yuan G . Continual learning with deep neural networks in physiological signal data: a survey. Healthcare (Basel). (2024) 12(2):155. 10.3390/healthcare12020155
16.
Marik PE Zaloga GP . Early enteral nutrition in acutely ill patients: a systematic review. Crit Care Med. (2001) 29(12):2264–70. 10.1097/00003246-200112000-00005
17.
Gearhart M Parbhoo SK . Hyperglycemia in the critically ill patient. AACN Clin Issues. (2006) 17(1):50–5. 10.1097/00044067-200601000-00007
18.
Brinati LM de Fátima Januário C Balbino PC Gonçalves Rezende Macieira T Cardoso SA Moreira TR et al Incidence and prediction of unstable blood glucose level among critically ill patients: a cohort study. Int J Nurs Knowl. (2021) 32(2):96–102. 10.1111/2047-3095.12299
19.
Schultz MJ Spronk P Moeniralam H . Intensive insulin therapy in intensive care: an example of the struggle to implement evidence-based medicine. PLoS Med. (2006) 3(7):e456. 10.1371/journal.pmed.0030456
20.
Shan L . Nursing care for postoperative stress-induced hyperglycemiain cardiac surgery patients. General Nursing. (2015) 3(6):530–1. 10.3969/j.issn1674-4748.2015.06.025
21.
Jeong HK Park C Henao R Kheterpal M . Deep learning in dermatology: a systematic review of current approaches, outcomes, and limitations. JID Innov. (2023) 3(1):100150. 10.1016/j.xjidi.2022.100150
22.
Collins GS Reitsma JB Altman DG Moons KG . Transparent reporting of a multivariable prediction model for individual prognosis or diagnosis (TRIPOD): the TRIPOD statement. Br Med J. (2015) 350:g7594. 10.1136/bmj.g7594
23.
Heyland DK Dhaliwal R Drover JW Gramlich L Dodek P . Canadian critical care clinical practice guidelines committee. Canadian clinical practice guidelines for nutrition support in mechanically ventilated, critically ill adult patients. JPEN J Parenter Enter Nutr. (2003) 27(5):355–73. 10.1177/0148607103027005355
24.
Mathis MR Kheterpal S Najarian K . Artificial intelligence for anesthesia: what the practicing clinician needs to know: more than black magic for the art of the dark. Anesthesiology. (2018) 129(4):619–22. 10.1097/ALN.0000000000002384
25.
Li J Wang Z Wu L Qiu S Zhao H Lin F et al Method for incomplete and imbalanced data based on multivariate imputation by chained equations and ensemble learning. IEEE J Biomed Health Inform. (2024) 28(5):3102–13. 10.1109/JBHI.2024.3376428
26.
Yang SZ Peng MH Lin Q Guan SW Zhang KL Yu HB . A machine learning-based predictive model for the occurrence of lower extremity deep vein thrombosis after laparoscopic surgery in abdominal surgery. Front Surg. (2025) 12:1502944. 10.3389/fsurg.2025.1502944
27.
Yinna D Bing W Yanghong D . Establishment and validation of a risk prediction model for stress hyperglycemia after hip arthroplasty in elderly patients. Chin J Burns Wounds. (2024) 36:226–31. 10.3969/j.issn.1001-0726.2024.03.014
28.
Wong XW Chase JG Shaw GM Hann CE Lotz T Lin J et al Model predictive glycaemic regulation in critical illness using insulin and nutrition input: a pilot study. Med Eng Phys. (2006) 28(7):665–81. 10.1016/j.medengphy.2005.10.015
29.
Dungan KM Braithwaite SS Preiser JC . Stress hyperglycaemia. Lancet. (2009) 373(9677):1798–807. 10.1016/S0140-6736(09)60553-5
30.
Grocott HP . Glucose and outcome after cardiac surgery: what are the issues?J Extra Corpor Technol. (2006) 38(1):65–7. 10.1051/ject/200638065
31.
Liu Z Huang W . Effect of stress-induced hyperglycemia on long-term mortality in non-diabetic patients with acute type A aortic dissection: a retrospective analysis. Scand Cardiovasc J. (2024) 58(1):2373099. 10.1080/14017431.2024.2373099
32.
Zhang M Zhang Z Zhu N Wang L Huang H Wang Y et al Systematic review and meta analysis of risk factors associated with postoperative stress hyperglycemia in patients without diabetes following cardiac surgery. Rev Cardiovasc Med. (2025) 26(1):25485. 10.31083/RCM25485
33.
Pei Y Ma Y Xiang Y Zhang G Feng Y Li W et al Stress hyperglycemia ratio and machine learning model for prediction of all cause mortality in patients undergoing cardiac surgery. Cardiovasc Diabetol. (2025) 24:77. 10.1186/s12933-025-02644-5
Summary
Keywords
stress hyperglycaemia, model prediction, nomograms, risk assessment, retrospective analysis
Citation
Wu J, Zhang M, Cui S, Yang G, Wang L, Duan H and Xue F (2025) Comparison of multiple machine learning methods for predicting postoperative hyperglycemia in patients without diabetes undergoing cardiac surgery. Front. Cardiovasc. Med. 12:1699809. doi: 10.3389/fcvm.2025.1699809
Received
06 September 2025
Revised
04 November 2025
Accepted
06 November 2025
Published
27 November 2025
Volume
12 - 2025
Edited by
Milan Toma, New York Institute of Technology College of Osteopathic Medicine Library, United States
Reviewed by
Keyue Yan, University of Macau, China
Pankaj Bhambri, Guru Nanak Dev Engineering College, India
Updates
Copyright
© 2025 Wu, Zhang, Cui, Yang, Wang, Duan and Xue.
This is an open-access article distributed under the terms of the Creative Commons Attribution License (CC BY). The use, distribution or reproduction in other forums is permitted, provided the original author(s) and the copyright owner(s) are credited and that the original publication in this journal is cited, in accordance with accepted academic practice. No use, distribution or reproduction is permitted which does not comply with these terms.
* Correspondence: Huan Duan duanhuan886@sina.com Fang Xue 0700036@bbmc.edu.cn
Disclaimer
All claims expressed in this article are solely those of the authors and do not necessarily represent those of their affiliated organizations, or those of the publisher, the editors and the reviewers. Any product that may be evaluated in this article or claim that may be made by its manufacturer is not guaranteed or endorsed by the publisher.