Abstract
Background:
Thrombosis is a critical and lethal complication of isolated coronary artery ectasia (iCAE), potentially linked to hemodynamic changes, particularly wall shear stress (WSS) alterations. However, the association between thrombosis and multidirectionality of blood flow, and thus of WSS, is not well defined.
Methods:
This study retrospectively enrolled 34 patients diagnosed with iCAE. In total, 53 ectatic coronary arteries were identified for hemodynamics analysis, of which 11 had thrombosis and 42 did not. We used an automated workstation for coronary three-dimensional reconstruction and conducted computational fluid dynamics (CFD) analysis. Particularly, we analyzed the mean changes in the following multidirectional WSS metrics at the ectatic segments: time-averaged WSS (TAWSS), oscillatory shear index (OSI), relative residence time (RRT), transverse WSS (transWSS), cross-flow index (CFI), and topological shear variation index (TSVI).
Results:
Local TAWSSmean, OSImean, RRTmean, transWSSmean, CFImean, and TSVImean of iCAE with thrombosis were significantly higher than those of iCAE without thrombosis (p < 0.05 for all). Logistic regression analyses indicated that RRTmean (OR = 1.010, 95% CI: 1.002–1.019, p = 0.021) and transWSSmean (OR = 1.992, 95% CI: 1.257–2.939, p = 0.003) were independently associated with the risk of thrombosis among patients with iCAE. The RRTmean + transWSSmean model [Area Under the Curve (AUC) = 0.911] exhibited a greater capacity for identifying the risk of thrombosis among patients with iCAE compared to maximum vascular diameter (MVD) (AUC = 0.789, p = 0.048).
Conclusions:
Multidirectional WSS metrics can help identify iCAE with a higher risk of thrombosis. It can improve thrombosis risk stratification.
1 Introduction
Isolated coronary artery ectasia (iCAE) is a rare disease characterized by pathological dilatation of the coronary artery exceeding 1.5-fold the diameter of the adjacent normal segment and the absence of significant atherosclerotic narrowing (1, 2). Compared to the similarly defined term coronary artery aneurysm (CAA), iCAE refers to more diffuse lesions (3, 4). Previous studies have indicated that CAE may be a high-risk lesion due to the abnormal dilation and impaired coronary flow, forming an environment susceptible to thrombus and acute coronary events (5, 6). Given the largely unknown natural course of iCAE, its management presents significant challenges. The risk of thrombosis and the necessity for antithrombotic therapy in this condition remain subjects of ongoing investigation (2, 7). So far, the maximum vascular diameter (MVD) has been regarded as the important basis for assessing the risk of thrombosis among individuals with iCAE and deciding the anti-thrombotic strategy, referring to the guidelines on CAA due to Kawasaki disease (8, 9). However, multiple studies have suggested that the risk of thrombosis among patients with iCAE appears to be more closely associated with hemodynamic alterations than with MVD (1, 10, 11).
Patient-specific hemodynamics analysis has become feasible with the advancement of computational fluid dynamics (CFD) technology. CFD enables the computation of hemodynamic metrics such as wall shear stress (WSS)/time-averaged wall shear stress (TAWSS), oscillatory shear index (OSI), and relative residence time (RRT) with high accuracy, and certain levels of these hemodynamic metrics can induce platelet activation, resulting in thrombosis (12–14). To date, there are no CFD-related studies on iCAE. Gutierrez et al. (11, 15) performed two small-sized studies to explore hemodynamic changes of CAA due to Kawasaki disease. Blood flow simulations showed that the hemodynamic metrics could highly differ in cases with same MVD. Furthermore, these metrics may provide improved thrombotic risk stratification compared to current MVD-based metrics. It's worth noting that in these studies, each CAA was treated as a discrete case, and they did not comprehensively assess the hemodynamic parameters of the “entire” coronary artery. Moreover, since two studies only use TAWSS, OSI, and RRT as predictors of impaired blood flow, the multidirectionality of blood flow, induced by its pulsatile nature and three-dimensional geometry, is not fully taken into account. Recently, new WSS metrics have been developed to capture this multidirectional flow behavior, including topological shear variation index (TSVI) (16), transverse WSS (transWSS) (17), and its normalized version known as the cross-flow index (CFI) (18). These new WSS metrics have not been investigated before in studies on iCAE and CAA.
Therefore, this study aimed to compare alterations in six distinct (multidirectional) WSS metrics between iCAE with and without thrombosis and identify key hemodynamic parameters associated with the risk of thrombosis in iCAE.
2 Methods
2.1 Study population
From July 2007 to July 2023, patients diagnosed with iCAE by coronary angiography at the Peking Union Medical College Hospital, Beijing, China were included in this study. Written informed consent was obtained from each patient included in the study, the study protocol conforms to 1975 Declaration of Helsinki and its later amendments and has been priorly approved by the the Ethics Committee of Peking Union Medical College Hospital (Ethics batch number: I-22PJ893). The exclusion criteria were as follows: (i) coronary artery stenosis >20%, or a history of prior percutaneous coronary intervention or coronary artery bypass grafting; (ii) thrombotic ectatic coronaries without complete recanalization; (iii) concurrent severe heart disease (e.g., heart failure, malignant arrhythmia, and severe valvular disease) or hemodynamic instability; (iv) Long-term use of antithrombotic drugs (including antiplatelet therapy and anticoagulation therapy) before thrombotic events occur in ectatic coronary arteries; (v) poor clarity of coronary angiography, absence of suitable sites for three-dimensional coronary reconstruction, or software recognition failure; (vi) Stenosis or ectasia of the coronary artery openings, which may influence the precision of multidirectional WSS metrics calculations. We finally enrolled 34 patients diagnosed with iCAE. In total, 53 ectatic coronary arteries were identified for hemodynamics analysis, of which 11 had thrombosis and 42 did not. The baseline clinical characteristics of the enrolled patients are provided in Supplementary Table S1.
2.2 Coronary three-dimensional reconstruction
The workflow of the study is shown in Figure 1. We conducted three-dimensional coronary reconstruction using the CAAS Workstation WSS software 8.2 prototype (Pie Medical Imaging, Maastricht, and the Netherlands). Its accuracy and reproducibility have been validated in other publications (19–21). DICOM files for three-dimensional reconstruction of coronary angiography images contained information on rotation, angulation, source image distance, and pixel size on the detector. First, two angiographic end-diastolic images with a difference in spatial angle of more than 30 degrees were identified by the software. Second, automated lumen contour detection was enabled and manually corrected when needed. Spatial alignment between the angiographic projection is automatically performed by identifying a “common image point”, the red dot in the two-dimensional segmentation, which is located at the same anatomical position. The three-dimensional reconstruction of the coronary artery commenced at the coronary opening and encompassed the entire main branch and branches with a diameter ≥2 mm if feasible, in addition to the ectatic segments.
Figure 1
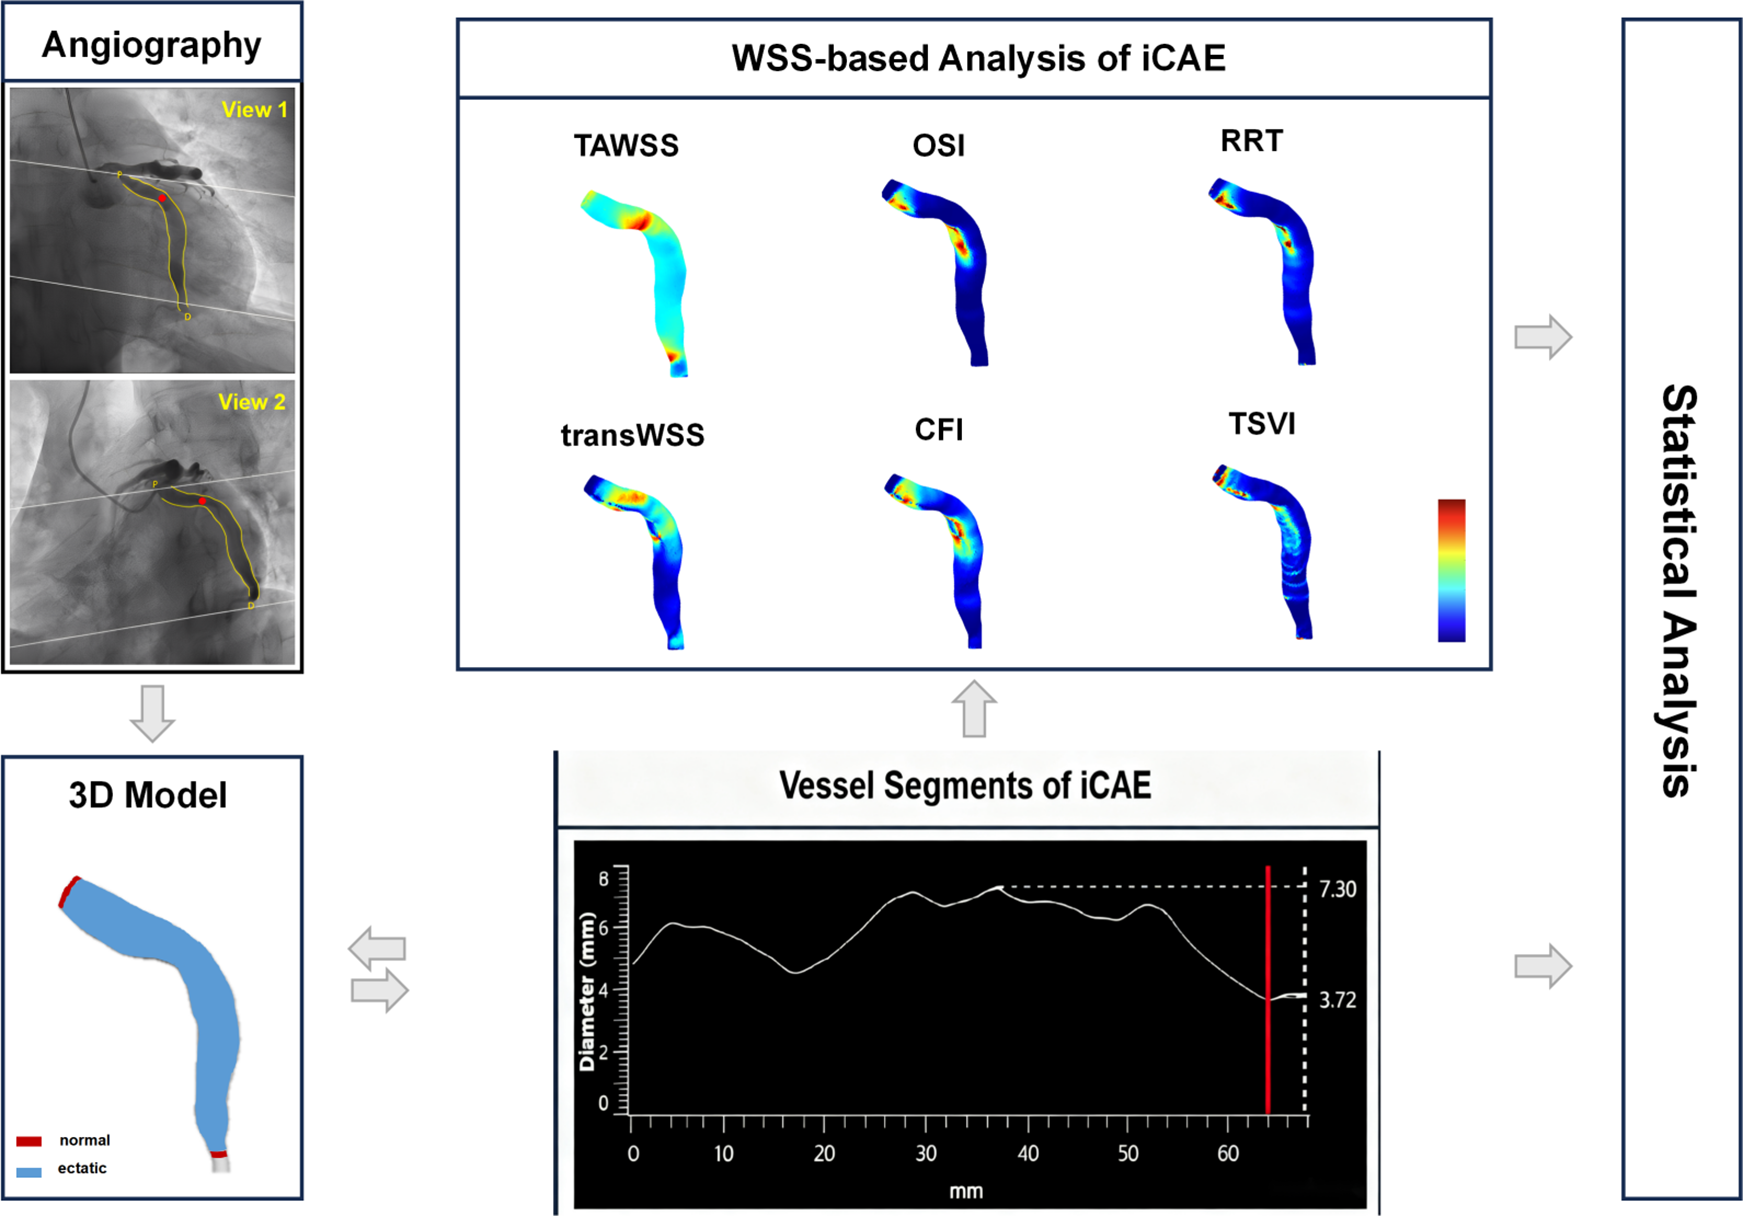
Workflow of the study. iCAE, isolated coronary artery ectasia; TAWSS, time-averaged wall shear stress; OSI, oscillatory shear index; RRT, relative residence time; transWSS, transverse wall shear stress; CFI, cross-flow index; TSVI, topological shear variation index.
2.3 Computational simulations
Based on three-dimensional coronary reconstruction, CFD simulations were carried out automatically by CAAS Workstation WSS software 8.2 prototype. Adopting a radius-based strategy and incorporating five near-wall tetrahedral layers, the fluid domain was meshed with P1-P1 tetrahedral elements using NETGEN (22). The governing equations of fluid motion were solved in their discretized form under unsteady-state conditions by applying the finite element code Kratos (23). Blood was modeled as a homogeneous, incompressible, Newtonian fluid with a density of 1060 kg/m³ and a dynamic viscosity of 0.0035 Pa·s. Rigid vessel walls were assumed, with no-slip conditions applied at the wall boundaries. Following a previously described scaling method (24), inlet boundary conditions were defined using generic Doppler velocity profiles, which were customized to each patient based on the individual inlet cross-sectional diameter. Inlet flow rates were set using parabolic velocity profiles, while zero pressure was applied at the outlets (25).
2.4 Multidirectional WSS metrics
The quantitative characterization of endothelial shear forces included the following multidirectional WSS metrics: TAWSS, OSI, RRT, transWSS, CFI, and TSVI. TAWSS denotes the average WSS throughout a cardiac cycle, reflecting the mean force exerted by blood flow on the vascular wall and serving as a key metric for evaluating hemodynamic impact (26). OSI, dimensionless, gauges directional WSS fluctuations, with greater values suggesting increased vortex and reverse flow (27). RRT, also dimensionless, is associated with the blood's average dwell time near the vascular wall to the cardiac cycle's duration, with higher values indicating slower flow and prolonged dwell times (28). TransWSS quantifies the WSS vector component normal to blood flow's primary axis, reflecting lateral wall friction. It is a critical marker for assessing hemodynamic disturbance (17). CFI, the ratio of transWSS to TAWSS, assesses lateral flow intensity, and higher values indicate substantial lateral flow and potential turbulence (18). TSVI quantifies the variability of the local contraction/expansion motion's exerted by WSS on the endothelium along the cardiac cycle, with higher values denoting more complex hemodynamic conditions (16).
The calculation formulas for multidirectional WSS metrics are presented in Supplementary Table S2. Hemodynamic parameters were automatically computed using the aforementioned software. The mean, maximum, and minimum values of the hemodynamic parameters in the ectatic coronary segments were recorded. Utilizing coronary angiography images and coronary vessel diameter curves (supplemented by intravascular imaging if necessary), coronary segments are categorized into normal segments and ectatic segments. The focus of hemodynamic analysis is confined to ectatic segments (Figure 1). The susceptibility of maximum and minimum values to errors in three-dimensional vascular reconstruction and blood flow simulation can lead to significant variability in results; thus, we focused on the mean values of hemodynamic parameters (19, 29).
2.5 Statistical methods
Statistical analyses were conducted using SPSS (version 26.0) and R software (version 4.3.1). The normality of data was assessed using the Shapiro–Wilk test and Histogram. Normally distributed continuous data were expressed as mean ± SD, while non-normally distributed data were reported as median (Q1–Q3). Categorical variables were expressed as numerals (percentages) and evaluated using the chi-square test. Continuous variables with normal distribution were compared using the two independent-sample two independent-sample t-test and continuous variables without normal distribution were compared using the Mann–Whitney U test. Both univariable and multivariable logistic regression analyses were conducted to ascertain predictors of thrombotic events in iCAE. Initially, potential risk factors of thrombosis were identified through univariable analysis. Subsequently, variables with a p-value of less than 0.10 were subjected to a “forward, conditional” multivariable regression model. The predictive accuracy of the model was determined using the area under the receiver operating characteristic (ROC) curve. The area under the curve (AUC) was compared using the Bootstrap method. All tests were two-tailed, with statistical significance defined as p < 0.05.
3 Results
3.1 Imaging characteristics of ectatic coronary arteries
The imaging characteristics of the 53 ectatic coronary arteries are presented in Table 1. RCA was the most frequently affected artery (41.5%), followed by the left circumflex artery (LCX, 34.0%). The left anterior descending artery (LAD) was the least affected (24.5%) artery. iCAE with thrombosis exhibited a higher proportion of RCA ectasia compared to iCAE without thrombosis (72.7% vs. 33.3%, p = 0.044) (Figure 2A). Diffuse ectatic lesions were common in iCAE (75.5%), and there was no significant difference between the two groups (81.8% vs. 73.8%, p = 0.876). Notably, MVD in the iCAE with thrombosis was significantly larger than that in iCAE without thrombosis (7.2 ± 0.7 vs. 5.3 ± 0.1 mm, p = 0.015) (Figure 2B).
Table 1
| Anatomical and hemodynamic parameters | iCAE with thrombosis (n = 11) | iCAE without thrombosis (n = 42) | p value | |
|---|---|---|---|---|
| Ectatic LAD | 2 (18.2) | 11 (26.2) | 0.867 | |
| Ectatic LCX | 1 (9.1) | 17 (40.5) | 0.110 | |
| Ectatic RCA | 8 (72.7) | 14 (33.3) | 0.044 | |
| Diffuse ectatic lesiona | 9 (81.8) | 31 (73.8) | 0.876 | |
| MVD (mm) | 7.2 ± 0.7 | 5.3 ± 0.1 | 0.015 | |
| Multidirectional shear stress metrics | ||||
| TAWSS (*10−2) (Pa) | Mean | 124.9 (100.9–179.2) | 74.6 (53.5–96.8) | 0.013 |
| Maximum | 700.0 (274.7–1,095.8) | 235.1 (134.6–362.2) | 0.003 | |
| Minimum | 9.9 (7.5–15.3) | 15.0 (11.4–18.2) | 0.007 | |
| OSI (*10−2) | Mean | 3.0 (2.0–6.5) | 0.8 (0.3–1.5) | <0.001 |
| Maximum | 34.2 (31.7–40.1) | 15.5 (4.8–29.0) | <0.001 | |
| Minimum | 0 (0.001–0.004) | 0 (0–0.001) | 0.004 | |
| RRT (*10−2) (Pa−1) | Mean | 286.3 (256.2–353.0) | 183.4 (146.2–271.8) | 0.011 |
| Maximum | 4,712.9 (2,322.4–6,369.8) | 1,349.0 (747.7–2,887.6) | <0.001 | |
| Minimum | 14.4 (9.2–36.5) | 45.0 (30.1–69.7) | 0.006 | |
| transWSS (*10−2) (Pa) | Mean | 7.7 (6.7–11.6) | 3.8 (2.8–5.4) | <0.001 |
| Maximum | 46.3 (25.3–60.7) | 12.2 (10.2–17.3) | <0.001 | |
| Minimum | 0.4 (0.2–0.9) | 0.2 (0.1–0.3) | 0.004 | |
| CFI (*10−2) | Mean | 15.8 (12.5–21.3) | 9.0 (4.9–10.4) | <0.001 |
| Maximum | 66.9 ± 2.6 | 42.3 ± 3.0 | <0.001 | |
| Minimum | 0.6 (0.5–0.7) | 0.2 (0.2–0.4) | 0.007 | |
| TSVI (m−1) | Mean | 142.2 (114.5–171.1) | 78.2 (46.9–103.3) | <0.001 |
| Maximum | 1,191.4 ± 81.6 | 778.6 ± 62.4 | 0.001 | |
| Minimum | 4.9 (3.4–7.4) | 2.7 (1.7–4.0) | 0.001 | |
Imaging and hemodynamic characteristics of ectatic coronary arteries.
iCAE, isolated coronary artery ectasia; LAD, left anterior descending artery; LCX, left circumflex artery; RCA, right coronary artery; MVD, maximum vascular diameter; TAWSS, time-averaged wall shear stress; OSI, oscillatory shear index; RRT, relative residence time; transWSS, transverse wall shear stress; CFI, cross-flow index; TSVI, topological shear variation index.
Diffuse ectatic lesion was defined as those in which the ectatic segment extends beyond one-third of the arterial length.
Figure 2
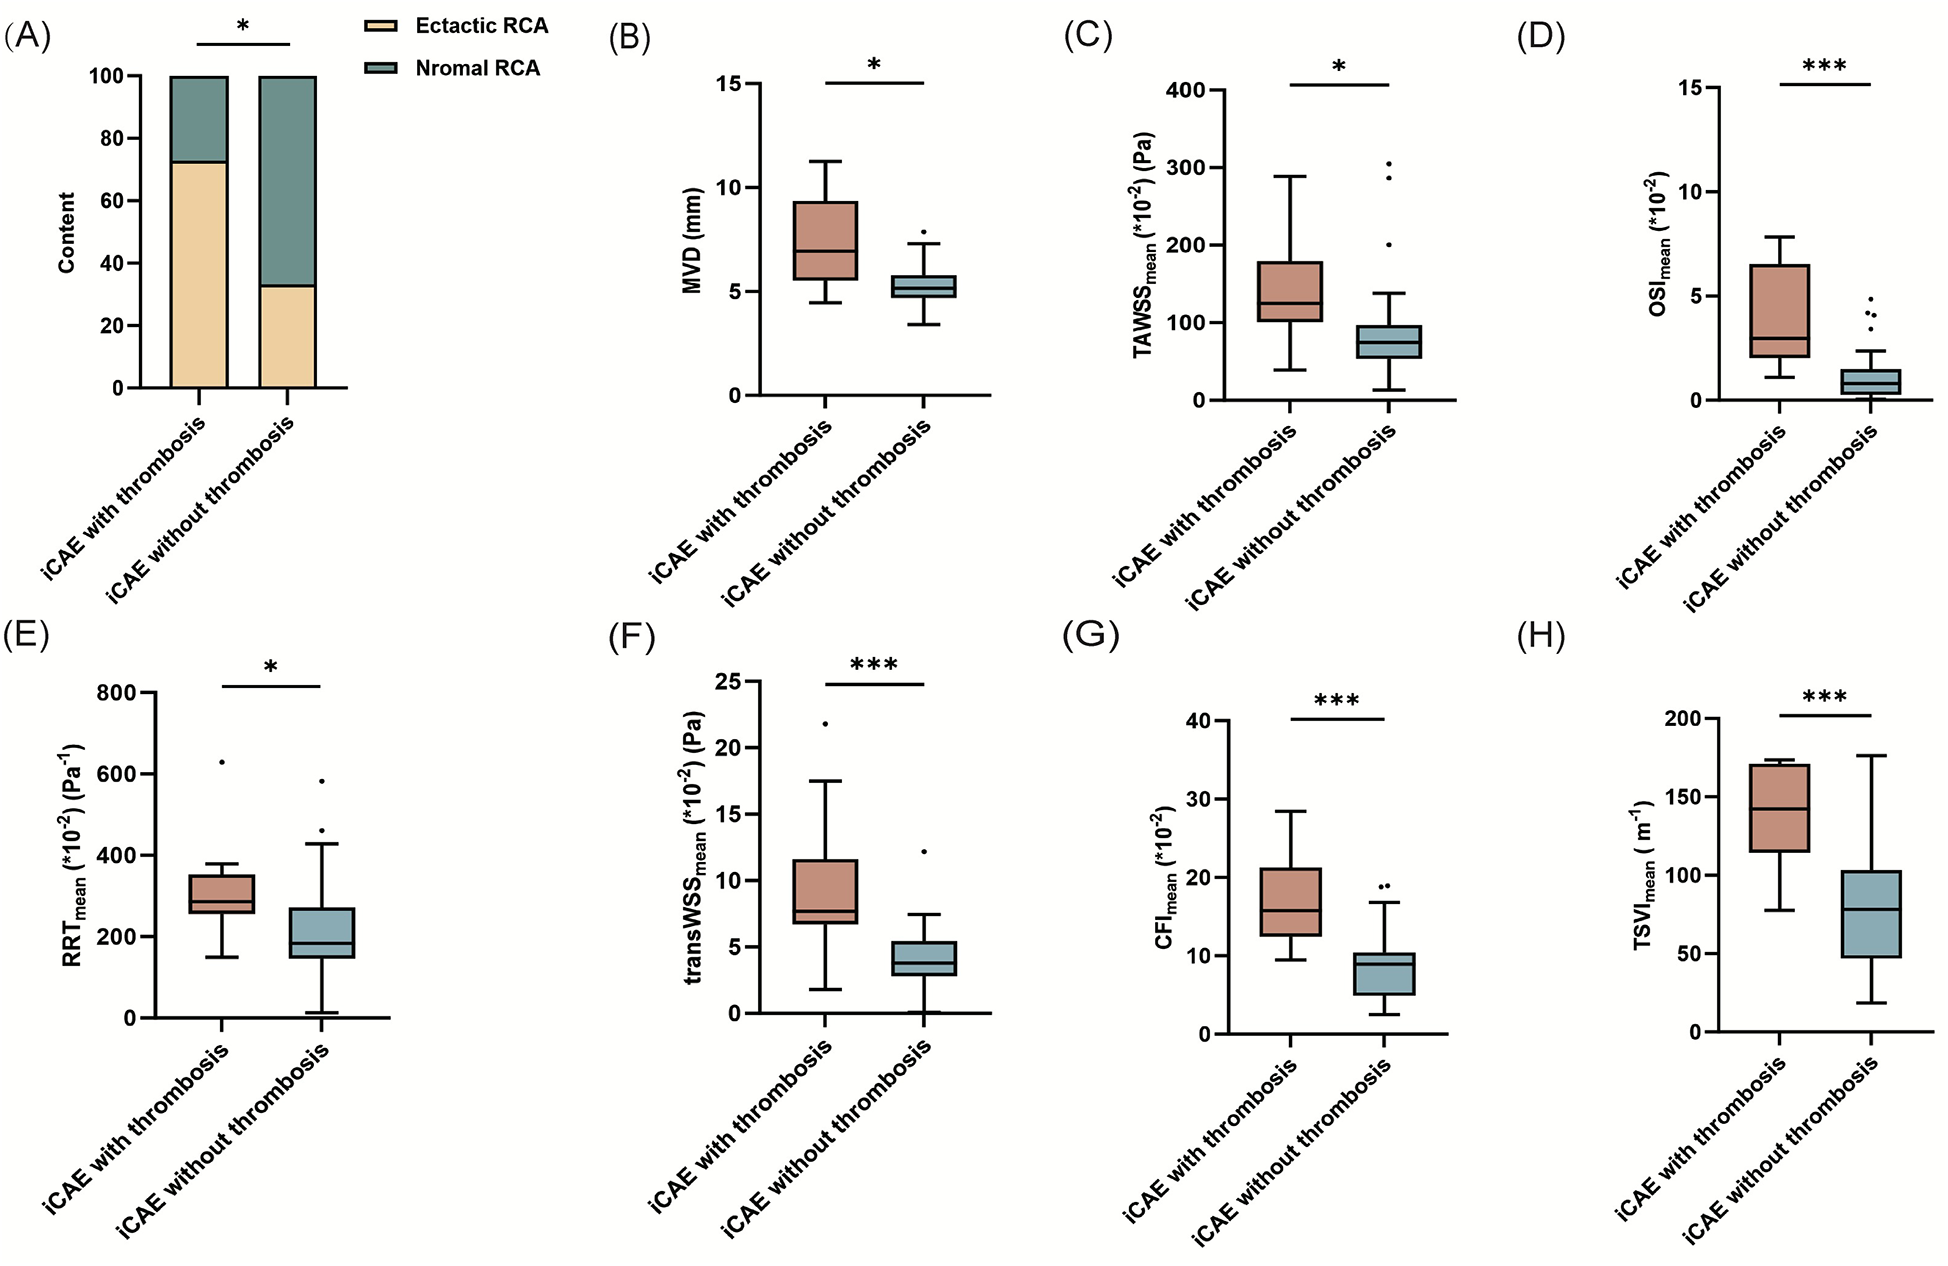
Comparison of the mean values of hemodynamic parameters between iCAE with and without thrombosis. *p < 0.05; **p < 0.01; ***p < 0.001; iCAE, isolated coronary artery ectasia; RCA, right coronary artery; MVD, maximum vascular diameter; TAWSS, time-averaged wall shear stress; OSI, oscillatory shear index; RRT, relative residence time; transWSS, transverse wall shear stress; CFI, cross-flow index; TSVI, topological shear variation index.
3.2 Multidirectional WSS metrics can help identify risk of thrombosis
Quantitative analysis of multidirectional WSS metrics exhibited significant differences between iCAE with thrombosis and iCAE without thrombosis (Table 1). TAWSSmean of ectatic segments was significantly higher in iCAE with thrombosis than in iCAE without thrombosis [124.9 (100.9–179.2) vs. 74.6 (53.5, 96.8) *10−2 (Pa), p = 0.013]. Similarly, local OSImean [(3.0 (2.0, 6.5) vs. 0.8 (0.3, 1.5)*10−2, p < 0.001], RRTmean [286.3 (256.2, 353.0) vs. 183.4 (146.2, 271.8) *10−2 (Pa−1), p = 0.011], transWSSmean [7.7 (6.7, 11.6) vs. 3.8 (2.8, 5.4)*10−2 (Pa), p < 0.001], CFImean [15.8 (12.5, 21.3) vs. 9.0 (4.9, 10.4)*10−2, p < 0.001] and TSVImean [142.2 (114.5, 171.1) vs. 78.2 (46.9, 103.3) (m−1), p < 0.001] were significantly higher in iCAE with thrombosis than in iCAE without thrombosis (Figures 2C–H). Furthermore, the maximum values of all multidirectional WSS metrics between the two groups not only revealed the aforementioned trend but also exhibited significant differences (Table 1, Supplementary Figures S1A–F). The minimum values of the majority of the multidirectional WSS metrics were significantly higher in iCAE with thrombosis than in iCAE without thrombosis, except for TAWSS and RRT (Table 1, Supplementary Figures S2A–F).
Subgroup analysis was conducted on ectatic RCA. Local TAWSSmean [120.1 (101.0–233.7) vs. 75.5 (67.0–119.0) *10−2 (Pa), p = 0.048], OSImean [3.5 (2.3–6.2) vs. 0.8 (0.3–1.2)*10−2, p = 0.001], RRTmean [288.1 (268.2–339.3) vs. 169.2 (143.9–248.1) *10−2 (Pa−1), p = 0.029], transWSSmean [8.4 (6.9–15.9) vs. 3.8 (3.2–6.3)*10−2 (Pa), p = 0.008], CFImean [15.6 (12.9–20.2) vs. 8.5 (4.9–9.6)*10−2, p = 0.001) and TSVImean [148.8 (120.5–171.8) vs. 68.4 (44.2–86.6) (m−1), p < 0.001] were significantly higher in iCAE with thrombosis than in iCAE without thrombosis (Supplementary Table S3, Figures 3A–F). Furthermore, the comparison of the maximum values of the multidirectional WSS indicators between the two groups was generally consistent with the trends observed for the mean values, and the majority of these trends were statistically significant, except for that observed for TSVI (Supplementary Table S3, Supplementary Figures S3A–F). Instead, only TSVImin of ectatic segments was significantly higher in ectatic RCA with thrombosis than in those without thrombosis [4.4 (3.4–7.4) vs. 2.7 (1.7–3.4) (m−1), p = 0.014] (Supplementary Table S3, Figures 4A–F). In addition, diffuse ectatic lesions were common in ectatic RCA (77.7%), and there were no significant differences between the two groups (75.0% vs. 78.6%, p = 1.000). The MVD in ectatic RCA with thrombosis was larger than that in ectatic RCA without thrombosis, but the difference did not meet the threshold of statistical significance [6.8 (5.0–8.9) vs. 5.0 (4.6–5.8) mm, p = 0.056] (Supplementary Table S3).
Figure 3
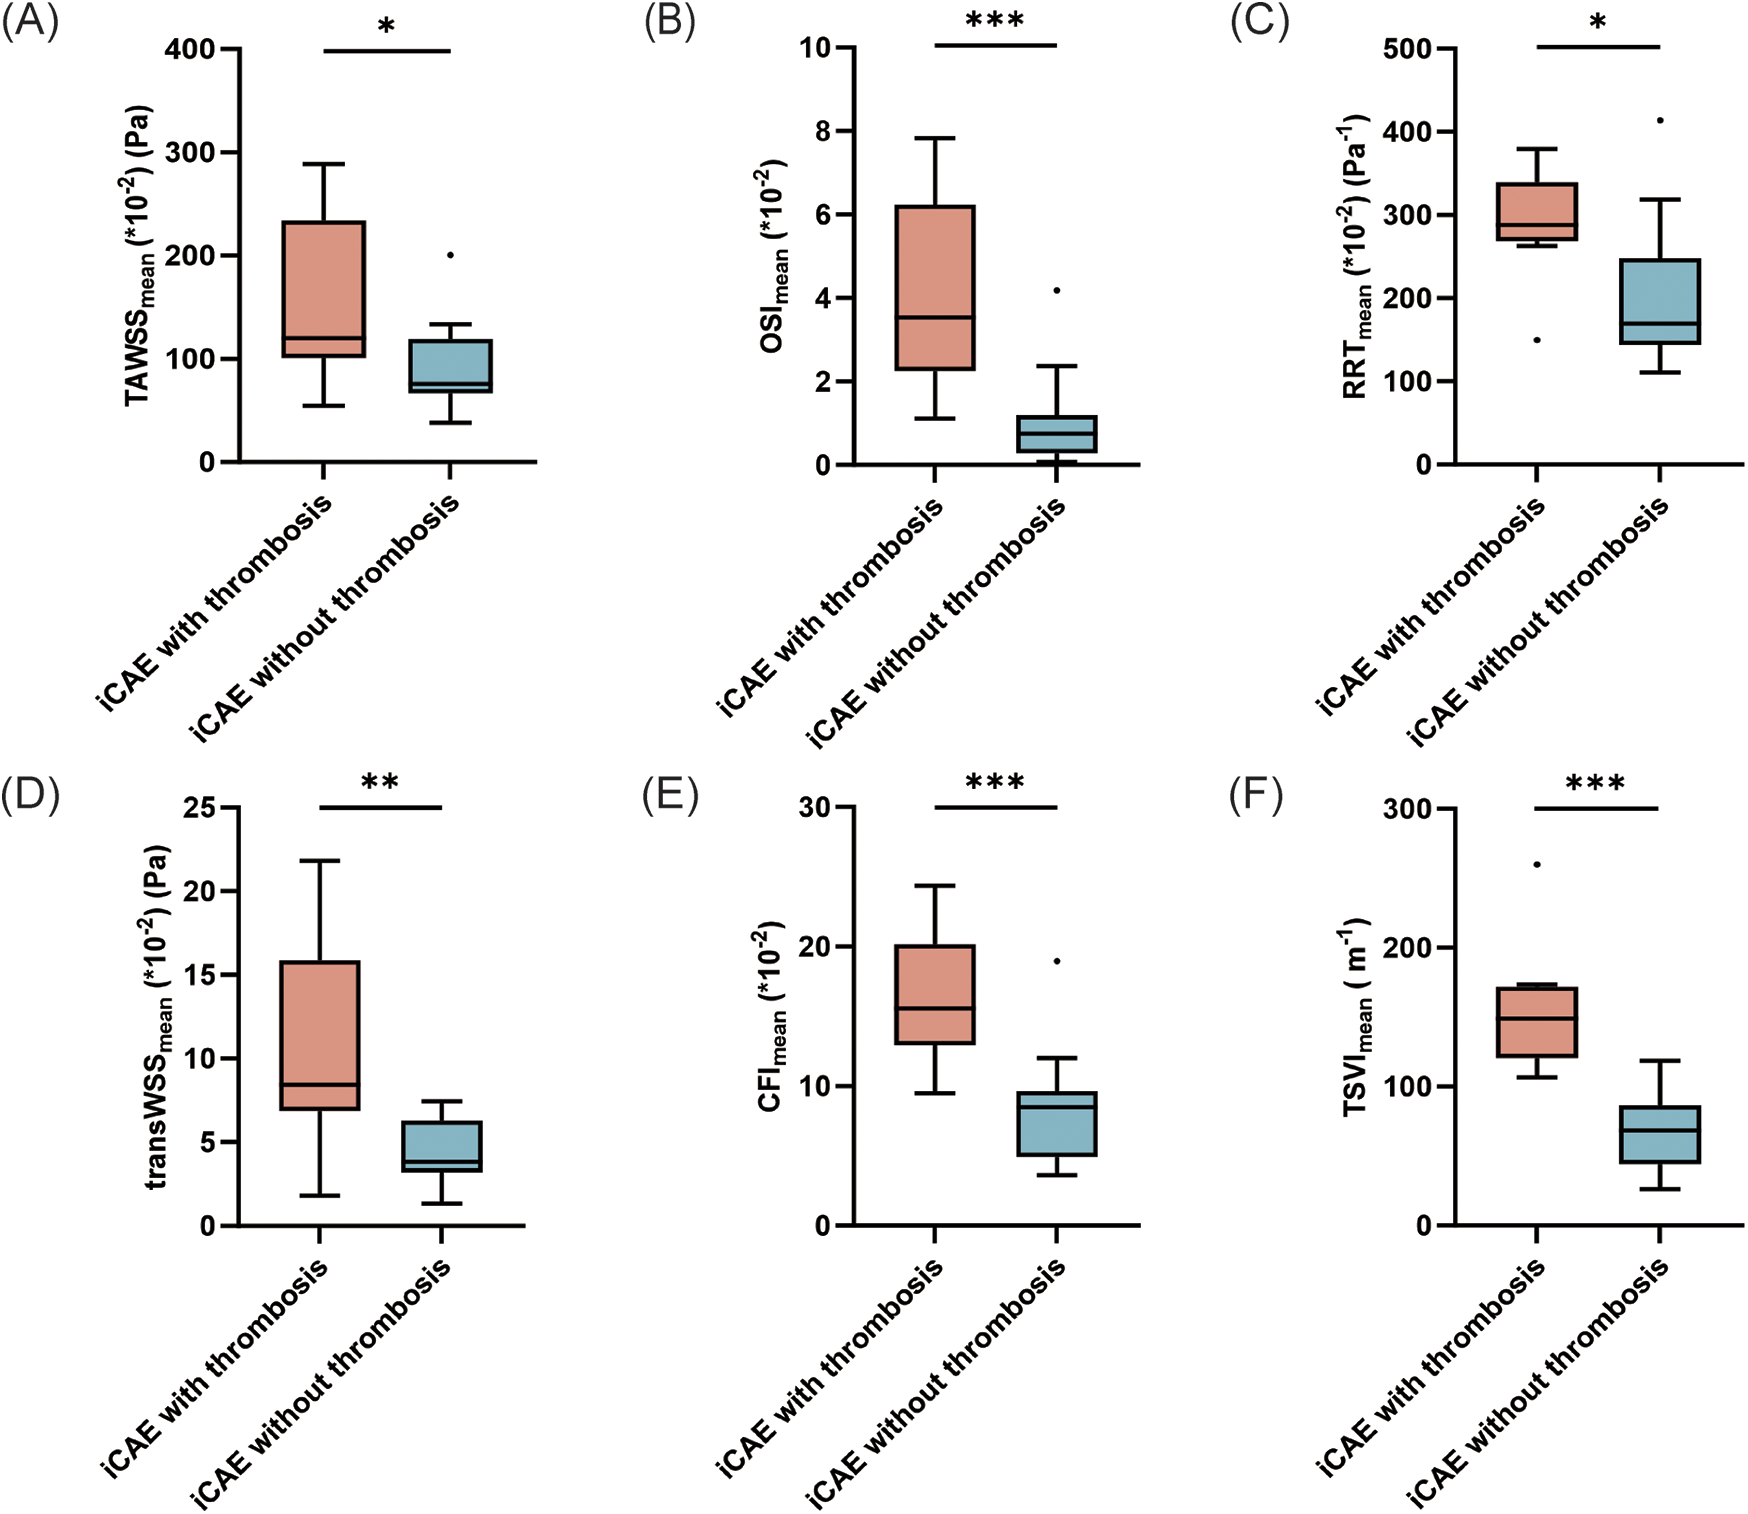
Comparison of the mean values of hemodynamic parameters between ectatic RCA with and without thrombosis. *p < 0.05; **p < 0.01; ***p < 0.001. iCAE, isolated coronary artery ectasia; TAWSS, time-averaged wall shear stress; OSI, oscillatory shear index; RRT, relative residence time; transWSS, transverse wall shear stress; CFI, cross-flow index; TSVI, topological shear variation index.
Figure 4
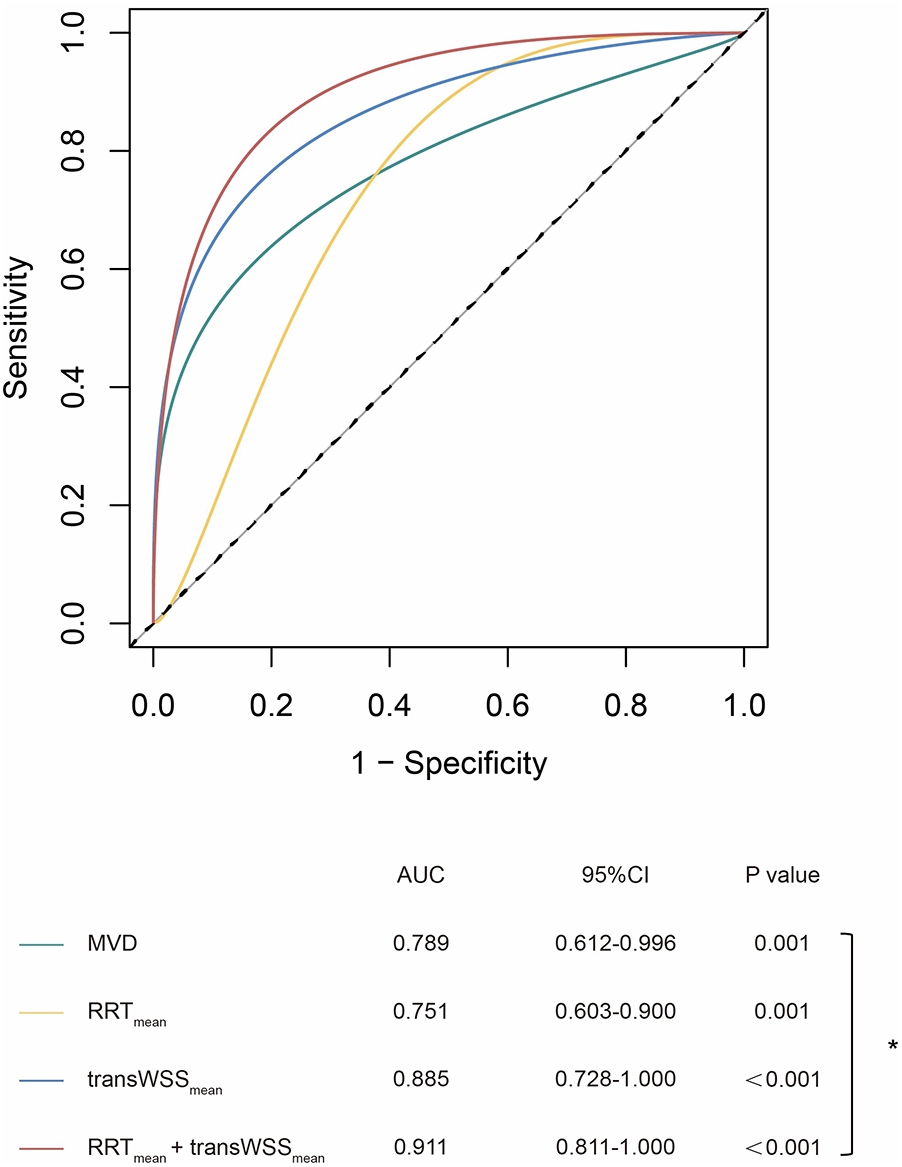
ROC curves of geometric and hemodynamic parameters in predicting thrombosis. *p < 0.05; MVD, maximum vascular diameter; RRT, relative residence time; transWSS, transverse wall shear stress.
3.3 Multidirectional WSS metrics were independently associated with risk of thrombosis
The results of univariable and multivariable logistic regression analysis are presented in Table 2. Univariable analysis indicated that ectatic RCA, MVD, TAWSSmean, RRTmean, and transWSSmean were associated with a higher risk of thrombosis in iCAE. Moreover, multivariable analysis showed that RRTmean (OR = 1.010, 95% CI: 1.002–1.019, p = 0.021) and transWSSmean (OR = 1.992, 95% CI: 1.257–2.939, p = 0.003) were independently associated with the thrombotic risk of iCAE.
Table 2
| Variables | Univariable analysis | Multivariable analysis | ||
|---|---|---|---|---|
| OR (95% CI) | p value | OR (95% CI) | p value | |
| Ectatic RCA | 5.333 (1.222–23.286) | 0.026 | 10.082 (0.916–110.985) | 0.059 |
| Diffuse ectasia lesion | 1.579 (0.298–8.563) | 0.585 | - | - |
| MVD (mm) | 2.594 (1.349–4.988) | 0.004 | - | - |
| TAWSSmean (*10−2) (Pa) | 1.010 (1.001–1.020) | 0.036 | - | - |
| OSImean (*10−2) | 0.995 (0.972–1.018 | 0.667 | - | - |
| RRTmean (*10−2) (Pa) | 1.006 (1.000–1.012) | 0.035 | 1.010 (1.002–1.019) | 0.021 |
| transWSSmean (*10−2) (Pa) | 1.753 (1.206–2.547) | 0.003 | 1.992 (1.257–2.939) | 0.003 |
| CFImean (*10−2) | 1.109 (1.000–1.230) | 0.051 | - | - |
| TSVImean (m−1) | 1.001 (0.998–1.005) | 0.532 | - | - |
Univariable and multivariable logistic regression analysis of thrombotic events in iCAE.
RCA, right coronary artery; MVD, maximum vascular diameter; TAWSS, time-averaged wall shear stress; OSI, oscillatory shear index; RRT, relative residence time; transWSS, transverse wall shear stress; CFI, cross-flow index; TSVI, topological shear variation index.
3.4 Multidirectional WSS metrics can help stratify risk of thrombosis
ROC analysis revealed that transWSSmean was the best single parameter to predict thrombotic events in iCAE (AUC = 0.885, sensitivity = 0.909, specificity = 0.881) (Supplementary Table S4). Besides, the AUC of OSImean (AUC = 0.868, sensitivity = 0.909, specificity = 0.786), CFImean (AUC = 0.864, sensitivity = 0.909, specificity = 0.810) and TSVImean (AUC = 0.861, sensitivity = 0.909, specificity = 0.810) were all higher than that of MVD (AUC = 0.789, sensitivity = 0.727, specificity = 0.810), although the differences were not statistically significant (Supplementary Table S4). The RRTmean + transWSSmean model achieved a greater AUC value than MVD, and the difference was statistically significant (0.911 vs. 0.789, p = 0.048) (Figure 4).
4 Discussion
In this study, we employed angiography-based three-dimensional reconstruction of coronary arteries, coupled with CFD analysis, to determine the effect of multidirectional WSS on the risk of thrombosis in iCAE. Our main findings were as follows: (i) multidirectional WSS metrics (including TAWSSmean, OSImean, RRTmean, transWSSmean, CFImean, and TSVImean) of ectatic segments in iCAE with thrombosis were significantly higher than those of iCAE without thrombosis. The results of subgroup analysis for ectatic RCA were consistent; (ii) univariate and multivariate logistic regression analyses indicated that RRTmean and transWSSmean were independently associated with thrombotic events in iCAE; (iii) multidirectional WSS metrics (the RRTmean + transWSSmean model) showed a greater capacity for determining the risk of thrombosis in iCAE compared to the conventional measurement of MVD.
Compared to other aneurysmally ectatic blood vessels that are prone to rupture, the primary clinical concerns on iCAE are the risks of thrombosis and myocardial infarction (30). Numerous studies have indicated that the risk of thrombosis is not only associated with the MVD of the coronary artery but also is associated with hemodynamic alterations in the ectatic region. Sluggishness, stagnation, and blood flow turbulence have been implicated in thrombogenesis (1, 10, 11). Therefore, hemodynamic analysis may offer novel insights into iCAE and assist in the risk stratification of patients for appropriate medical intervention.
In previous hemodynamic studies, researchers have focused on a single CAA (11, 15). However, iCAE are more diffuse lesions (2). In clinical practice, a coronary artery can have several aneurysms or exhibit no distinct aneurysmal changes, instead showing a relatively uniform and diffuse ectasia (Figure 1). Focusing solely on single aneurysms can undermine the significance of hemodynamic data. Therefore, in this study, we considered the “entire” coronary artery as the primary subject of investigation to explore the relationship between its hemodynamic alterations and the risk of thrombosis. Moreover, since most studies have utilized only TAWSS, OSI, and RRT as indices of flow disturbance, they have not fully addressed the multidirectional nature of blood flow induced by its pulsatility in conjunction with the three-dimensional geometry (11, 31). Therefore, we introduced a broader array of WSS metrics to address this multidirectional flow behavior, including transWSS, CFI, and TSVI, as the first report of their application in CAE research.
Our study demonstrated significant hemodynamic differences between iCAE with thrombosis and iCAE without thrombosis. Consistent with the findings of Gutierrez et al. (15), iCAE with thrombosis exhibited markedly higher local RRT and OSI (mean value) compared to iCAE without thrombosis. Increased OSI and RRT are the primary characteristics of oscillatory and circulatory flow. They can induce the inflammatory response and platelet activation, thereby prmoting thrombogenesis (32). However, our results were different from those of Gutierrez et al. in terms of TAWSS. In our study, iCAE with thrombosis had higher TAWSSmean and TAWSSmax but lower TAWSSmin compared to those without thrombosis. In contrast, Gutierrez et al. reported lower TAWSS in CAA with thrombosis (15). Despite differences, both studies reported lower TAWSS in the ectatic segments compared to adjacent normal segments (Figure 1). Possible reasons for this discrepancy may be: (i) the study populations were different between the two studies. Gutierrez et al. (15) focused on a single CAA, whereas the present study addressed iCAE, whose lesions tended to be more diffuse. Previous studies have confirmed the correlation between TAWSS distribution and the length of the coronary ectatic segment (32); (ii) the method of hemodynamic parameter acquisition varied between the two studies. Gutierrez et al. (15) did not mention how hemodynamic parameters were obtained in their study. In addition to TAWSS, RRT, and OSI, the novel hemodynamic parameters we introduced were significantly different between iCAE with thrombosis and iCAE without thrombosis. The results indicated that transWSSmean, CFImean, and TSVImean were higher in iCAE with thrombosis than in iCAE without thrombosis. Increased transWSSmean, CFImean, and TSVImean imply a greater magnitude of perpendicular shear force on the vessel wall by blood flow, increased lateral flow, a higher risk of turbulence, and more severe flow disturbance. These hemodynamic changes may further promote the formation of thrombosis (16–18). This hypothesis is supported by Russo et al. (33), who found that higher WSS in ruptured fibrous cap plaques correlated significantly with the expression of thrombosis-related genes: TNFα (R = 0.9, p < 0.001), MMP9 (p = 0.005, R = 0.7)—key mediators of inflammation and vascular integrity loss—and inversely with EDN1 (R = −0.4, p = 0.036), a vasoconstrictor gene. Although we did not measure gene expression in iCAE, the WSS-gene regulatory axis observed in ruptured fibrous cap plaques suggests iCAE's abnormal WSS may similarly modulate pro-thrombotic gene expression, a hypothesis requiring further validation.
Furthermore, our study was the first to identify an independent association between RRTmean and transWSSmean with the occurrence of thrombotic events in iCAE. Additionally, compared to MVD alone, the combination of hemodynamic parameters (AUC of RRTmean + transWSSmean model: 0.911) may better predict the risk of thrombosis in patients with iCAE (AUC of MVD: 0.789, p = 0.048). This finding may question the current clinical practice of relying on single MVD measurements to evaluate thrombosis risk and guide antithrombotic treatment decisions (8, 9). Moreever, Naturally, further validation through larger cohort studies is needed to confirm these observations. With the maturation and development of automated computational models, hemodynamic analysis can be easily and widely applied in clinical practice.
An additional phenomenon merits attention in the context of our study. In our study, RCA was the most frequently affected blood vessel in iCAE, with a prevalence of as high as 41.5%. These findings are largely consistent with those of previous reports (34, 35). This susceptibility was further supported by the findings of Wu et al. (36) who conducted fluid-structure interaction numerical simulations and demonstrated that the RCA is more susceptible to ectatic remodeling compared to the LAD and LCX. Additionally, our findings revealed a higher likelihood of RCA involvement in iCAE with thrombosis compared to iCAE without thrombosis (72.7% vs. 33.3%, p = 0.044). In univariate logistic regression analysis, ectatic RCA was correlated with a higher risk of thrombosis. However, subsequent multivariate analysis indicated that ectatic RCA was not an independent risk factor for thrombosis in iCAE (p = 0.059). Therefore, whether the unique hemodynamic characteristics of the RCA itself increase the risk of thrombosis in iCAE necessitates further studies.
There were some limitations to this study. First, all of the participants were from a single center, and the sample size was small; however, this study is currently the largest among CFD studies. Future multiple-center studies with larger sample sizes are needed to validate these findings. Second, ectatic RCA accounted for 41.5% of the total population and 72.7% of iCAE with thrombosis. Although this represents a typical distribution of iCAE treated in hospitals, it can bias the results. We conducted a subgroup analysis of ectatic RCA; however, our data volume was not large enough to separately analyze ectatic LAD and LCX, necessitating multiple-center studies with larger sample sizes. Third, similar to other retrospective studies, the hemodynamics of iCAE can be affected by the thrombotic event itself even in the presence of successful reperfusion therapy. Fourth, in our study, coronary branches <2 mm in diameter were not three-dimensionally reconstructed, and the consequent reduction in main branch blood flow was not fully incorporated into our analysis. Under such circumstances, the WSS in the main branch distal to these small branches may be overestimated. However, it must be emphasized that this limitation is also unavoidable in traditional CFD modeling due to the precision constraints inherent in three-dimensional coronary model reconstruction. Fifth, the current study did not account for the non-Newtonian behavior of blood, which may affect the accurate simulation of blood flow patterns in certain pathological conditions. However, this simplified design enables relatively accurate and rapid calculation of multidirectional WSS metrics, making the analysis clinically feasible. Sixth, our CFD simulations assumed rigid vessel walls with a no-slip boundary condition, which is not consistent with the dynamic scenario in vivo (37). Therefore, further refinement of the CFD method is necessary.
5 Conclusions
Local multidirectional WSS metrics (including TAWSSmean, OSImean, RRTmean, transWSSmean, CFImean, and TSVImean) can help identify iCAE with a higher risk of thrombosis. RRTmean and transWSSmean are independently associated with thrombosis in iCAE. Multidirectional WSS metrics (the RRTmean + transWSSmean model) can help improve the stratification of the thrombosis risk in iCAE. Utilizing an automatic computational model, the hemodynamic analysis presents a promising clinical measure to assess the risk of thrombosis in iCAE.
Statements
Data availability statement
The original contributions presented in the study are included in the article/Supplementary Material, further inquiries can be directed to the corresponding authors.
Ethics statement
The studies involving humans were approved by the Ethics Committee of Peking Union Medical College Hospital. The studies were conducted in accordance with the local legislation and institutional requirements. The participants provided their written informed consent to participate in this study.
Author contributions
JS: Data curation, Formal analysis, Investigation, Methodology, Writing – original draft. MT: Data curation, Formal analysis, Investigation, Methodology, Writing – original draft. SL: Formal analysis, Methodology, Writing – review & editing. ZL: Data curation, Project administration, Supervision, Writing – review & editing. ZS: Data curation, Writing – review & editing. HX: Data curation, Writing – review & editing. WW: Data curation, Writing – review & editing. HQ: Data curation, Writing – review & editing. LW: Data curation, Writing – review & editing. ZZ: Data curation, Writing – original draft. RT: Conceptualization, Data curation, Investigation, Project administration, Writing – review & editing. SZ: Conceptualization, Funding acquisition, Project administration, Resources, Writing – review & editing.
Funding
The author(s) declare that financial support was received for the research and/or publication of this article. This work was supported by the National KeyR&D Program of China (2022ZD0116001), National High Level Hospital Clinical Research Funding (2022-PUMCH-B-098), CAMS Innovation Fund for Medical Sciences (CIFMS) (No. 2021-I2M-1-003), the 14th Five-Year Key Research and Development Plan, Ministry of Science and Technology (No.2022YFC2703100).
Acknowledgments
EditSprings (https://www.editsprings.cn) provided expert linguistic services. The contributions of Sun Kai, Zhang Dingding and Zhang Shuyuan in conducting the statistical analysis are acknowledged. The authors also thank Jean-Paul Aben for his help with the imaging analysis.
Conflict of interest
SL was employed by Beijing Uninsim Tech Co. Ltd.
The remaining authors declare that the research was conducted in the absence of any commercial or financial relationships that could be construed as a potential conflict of interest.
Generative AI statement
The author(s) declare that no Generative AI was used in the creation of this manuscript.
Any alternative text (alt text) provided alongside figures in this article has been generated by Frontiers with the support of artificial intelligence and reasonable efforts have been made to ensure accuracy, including review by the authors wherever possible. If you identify any issues, please contact us.
Publisher’s note
All claims expressed in this article are solely those of the authors and do not necessarily represent those of their affiliated organizations, or those of the publisher, the editors and the reviewers. Any product that may be evaluated in this article, or claim that may be made by its manufacturer, is not guaranteed or endorsed by the publisher.
Supplementary material
The Supplementary Material for this article can be found online at: https://www.frontiersin.org/articles/10.3389/fcvm.2025.1705263/full#supplementary-material
References
1.
Krüger D Stierle U Herrmann G Simon R Sheikhzadeh A . Exercise-induced myocardial ischemia in isolated coronary artery ectasias and aneurysms (“dilated coronopathy”). J Am Coll Cardiol. (1999) 34(5):1461–70. 10.1016/s0735-1097(99)00375-7
2.
Kawsara A Núñez Gil IJ Alqahtani F Moreland J Rihal CS Alkhouli M . Management of coronary artery aneurysms. JACC Cardiovasc Interv. (2018) 11(13):1211–23. 10.1016/j.jcin.2018.02.041
3.
Díaz-Zamudio M Bacilio-Pérez U Herrera-Zarza MC Meave-González A Alexanderson-Rosas E Zambrana-Balta GF et al Coronary artery aneurysms and ectasia: role of coronary Ct angiography. Radiographics. (2009) 29(7):1939–54. 10.1148/rg.297095048
4.
Luo Y Tang J Liu X Qiu J Ye Z Lai Y et al Coronary artery aneurysm differs from coronary artery ectasia: angiographic characteristics and cardiovascular risk factor analysis in patients referred for coronary angiography. Angiology. (2017) 68(9):823–30. 10.1177/0003319716665690
5.
Ipek G Gungor B Karatas MB Onuk T Keskin M Tanik O et al Risk factors and outcomes in patients with ectatic infarct-related artery who underwent primary percutaneous coronary intervention after St elevated myocardial infarction. Catheter Cardiovasc Interv. (2016) 88(5):748–53. 10.1002/ccd.26553
6.
Doi T Kataoka Y Noguchi T Shibata T Nakashima T Kawakami S et al Coronary artery ectasia predicts future cardiac events in patients with acute myocardial infarction. Arterioscler Thromb Vasc Biol. (2017) 37(12):2350–5. 10.1161/atvbaha.117.309683
7.
Demir M Demir C Keçeoğlu S . The relationship between vitamin D deficiency and coronary artery ectasia. Postepy Kardiol Interwencyjnej. (2014) 10(4):238–41. 10.5114/pwki.2014.46764
8.
Newburger JW Takahashi M Burns JC . Kawasaki disease. J Am Coll Cardiol. (2016) 67(14):1738–49. 10.1016/j.jacc.2015.12.073
9.
Dallaire F Dahdah N . New equations and a critical appraisal of coronary artery Z scores in healthy children. J Am Soc Echocardiogr. (2011) 24(1):60–74. 10.1016/j.echo.2010.10.004
10.
Abou Sherif S Ozden Tok O Taşköylü Ö Goktekin O Kilic ID . Coronary artery aneurysms: a review of the epidemiology, pathophysiology, diagnosis, and treatment. Front Cardiovasc Med. (2017) 4:24. 10.3389/fcvm.2017.00024
11.
Grande Gutierrez N Kahn A Burns JC Marsden AL . Computational blood flow simulations in kawasaki disease patients: insight into coronary artery aneurysm hemodynamics. Glob Cardiol Sci Pract. (2017) 2017(3):e201729. 10.21542/gcsp.2017.29
12.
Sriramarao P Languino LR Altieri DC . Fibrinogen mediates leukocyte-endothelium bridging in vivo at low shear forces. Blood. (1996) 88(9):3416–23. 10.1182/blood.v88.9.3416.bloodjournal8893416
13.
Kroll M Hellums J McIntire L Schafer A Moake J . Platelets and shear stress. Blood. (1996) 88(5):1525–41. 10.1182/blood.V88.5.1525.1525
14.
Passerini AG Polacek DC Shi C Francesco NM Manduchi E Grant GR et al Coexisting proinflammatory and antioxidative endothelial transcription profiles in a disturbed flow region of the adult porcine aorta. Proc Natl Acad Sci USA. (2004) 101(8):2482–7. 10.1073/pnas.0305938101
15.
Grande Gutierrez N Mathew M McCrindle BW Tran JS Kahn AM Burns JC et al Hemodynamic variables in aneurysms are associated with thrombotic risk in children with kawasaki disease. Int J Cardiol. (2019) 281:15–21. 10.1016/j.ijcard.2019.01.092
16.
Mazzi V De Nisco G Hoogendoorn A Calò K Chiastra C Gallo D et al Early atherosclerotic changes in coronary arteries are associated with endothelium shear stress contraction/expansion variability. Ann Biomed Eng. (2021) 49(9):2606–21. 10.1007/s10439-021-02829-5
17.
Peiffer V Sherwin SJ Weinberg PD . Computation in the rabbit aorta of a new metric—the transverse wall shear stress—to quantify the multidirectional character of disturbed blood flow. J Biomech. (2013) 46(15):2651–8. 10.1016/j.jbiomech.2013.08.003
18.
Mohamied Y Sherwin SJ Weinberg PD . Understanding the fluid mechanics behind transverse wall shear stress. J Biomech. (2017) 50:102–9. 10.1016/j.jbiomech.2016.11.035
19.
Candreva A Pagnoni M Rizzini ML Mizukami T Gallinoro E Mazzi V et al Risk of myocardial infarction based on endothelial shear stress analysis using coronary angiography. Atherosclerosis. (2022) 342:28–35. 10.1016/j.atherosclerosis.2021.11.010
20.
Tufaro V Torii R Erdogan E Kitslaar P Koo BK Rakhit R et al An automated software for real-time quantification of wall shear stress distribution in quantitative coronary angiography data. Int J Cardiol. (2022) 357:14–9. 10.1016/j.ijcard.2022.03.022
21.
Kageyama S Tufaro V Torii R Karamasis GV Rakhit RD Poon EKW et al Agreement of wall shear stress distribution between two core laboratories using three-dimensional quantitative coronary angiography. Int J Cardiovasc Imaging. (2023) 39(8):1581–92. 10.1007/s10554-023-02872-4
22.
Schöberl J . Netgen an advancing front 2d/3d-mesh generator based on abstract rules. Comput Vis Sci. (1997) 1(1):41–52. 10.1007/s007910050004
23.
Dadvand P Rossi R Oñate E . An object-oriented environment for developing finite element codes for multi-disciplinary applications. Arch Comput Methods Eng. (2010) 17(3):253–97. 10.1007/s11831-010-9045-2
24.
van der Giessen AG Groen HC Doriot PA de Feyter PJ van der Steen AF van de Vosse FN et al The influence of boundary conditions on wall shear stress distribution in patients specific coronary trees. J Biomech. (2011) 44(6):1089–95. 10.1016/j.jbiomech.2011.01.036
25.
Lodi Rizzini M Gallo D De Nisco G D'Ascenzo F Chiastra C Bocchino PP et al Does the inflow velocity profile influence physiologically relevant flow patterns in computational hemodynamic models of left anterior descending coronary artery? Med Eng Phys. (2020) 82:58–69. 10.1016/j.medengphy.2020.07.001
26.
Cunningham KS Gotlieb AI . The role of shear stress in the pathogenesis of atherosclerosis. Lab Invest. (2005) 85(1):9–23. 10.1038/labinvest.3700215
27.
Peiffer V Sherwin SJ Weinberg PD . Does low and oscillatory wall shear stress correlate spatially with early atherosclerosis? A systematic review. Cardiovasc Res. (2013) 99(2):242–50. 10.1093/cvr/cvt044
28.
Rikhtegar F Knight JA Olgac U Saur SC Poulikakos D Marshall W Jr et al Choosing the optimal wall shear parameter for the prediction of plaque location-a patient-specific computational study in human left coronary arteries. Atherosclerosis. (2012) 221(2):432–7. 10.1016/j.atherosclerosis.2012.01.018
29.
Sengupta D Kahn AM Kung E Esmaily Moghadam M Shirinsky O Lyskina GA et al Thrombotic risk stratification using computational modeling in patients with coronary artery aneurysms following kawasaki disease. Biomech Model Mechanobiol. (2014) 13(6):1261–76. 10.1007/s10237-014-0570-z
30.
Wang H Anzai H Liu Y Qiao A Xie J Ohta M . Hemodynamic-based evaluation on thrombosis risk of fusiform coronary artery aneurysms using computational fluid dynamic simulation method. Complexity. (2020) 2020:1–11. 10.1155/2020/8507273
31.
Fan T Zhou Z Fang W Wang W Xu L Huo Y . Morphometry and hemodynamics of coronary artery aneurysms caused by atherosclerosis. Atherosclerosis. (2019) 284:187–93. 10.1016/j.atherosclerosis.2019.03.001
32.
Asadbeygi A Lee S Kovalchin J Hatoum H . Predicting hemodynamic indices in coronary artery aneurysms using response surface method: an application in kawasaki disease. Comput Methods Programs Biomed. (2022) 224:107007. 10.1016/j.cmpb.2022.107007
33.
Russo G Pedicino D Chiastra C Vinci R Lodi Rizzini M Genuardi L et al Coronary artery plaque rupture and erosion: role of wall shear stress profiling and biological patterns in acute coronary syndromes. Int J Cardiol. (2023) 370:356–65. 10.1016/j.ijcard.2022.10.139
34.
Manginas A Cokkinos DV . Coronary artery ectasias: imaging, functional assessment and clinical implications. Eur Heart J. (2006) 27(9):1026–31. 10.1093/eurheartj/ehi725
35.
Syed M Lesch M . Coronary artery aneurysm: a review. Prog Cardiovasc Dis. (1997) 40(1):77–84. 10.1016/s0033-0620(97)80024-2
36.
Wu D Wang S Xie J Mao B Li B Jin C et al Hemodynamic mechanism of coronary artery aneurysm high occurrence on right coronary artery. Front Physiol. (2020) 11:323. 10.3389/fphys.2020.00323
37.
Kandangwa P Torii R Gatehouse PD Sherwin SJ Weinberg PD . Influence of right coronary artery motion, flow pulsatility and non-newtonian rheology on wall shear stress metrics. Front Bioeng Biotechnol. (2022) 10:962687. 10.3389/fbioe.2022.962687
Summary
Keywords
isolated coronary artery ectasia, hemodynamic changes, computational fluid dynamics, wall shear stress, thrombosis
Citation
Sun J, Tang M, Liu S, Liu Z, Shen Z, Xie H, Wu W, Qian H, Wang L, Zhang Z, Tian R and Zhang S (2025) Multidirectional wall shear stress is associated with thrombotic risk in isolated coronary artery ectasia. Front. Cardiovasc. Med. 12:1705263. doi: 10.3389/fcvm.2025.1705263
Received
14 September 2025
Accepted
27 October 2025
Published
18 November 2025
Volume
12 - 2025
Edited by
Rodrigo Assar, University of Chile, Chile
Reviewed by
Liang Wang, Southeast University, China
Giulio Russo, Policlinico Tor Vergata, Italy
Updates
Copyright
© 2025 Sun, Tang, Liu, Liu, Shen, Xie, Wu, Qian, Wang, Zhang, Tian and Zhang.
This is an open-access article distributed under the terms of the Creative Commons Attribution License (CC BY). The use, distribution or reproduction in other forums is permitted, provided the original author(s) and the copyright owner(s) are credited and that the original publication in this journal is cited, in accordance with accepted academic practice. No use, distribution or reproduction is permitted which does not comply with these terms.
* Correspondence: Ran Tian ron_tian@163.com Shuyang Zhang shuyangzhang103@nrdrs.org
†These authors share first authorship
Disclaimer
All claims expressed in this article are solely those of the authors and do not necessarily represent those of their affiliated organizations, or those of the publisher, the editors and the reviewers. Any product that may be evaluated in this article or claim that may be made by its manufacturer is not guaranteed or endorsed by the publisher.