 Nixon Sunny
 Andrea Bernardi
 David Danaci
 Mai Bui
 Andres Gonzalez-Garay
 Benoît Chachuat
- 1The Sargent Centre for Process Systems Engineering, Imperial College London, London, United Kingdom
- 2Centre for Environmental Policy, Imperial College London, London, United Kingdom
- 3Barrer Centre, Department of Chemical Engineering, Imperial College London, London, United Kingdom
Rapid industrialization and urbanization have increased the demand for both energy and mobility services across the globe, with accompanying increases in greenhouse gas emissions. This short paper analyzes strategic measures for the abatement of CO2 emissions from oil refinery operations. A case study involving a large conversion refinery shows that the use of post-combustion carbon capture and storage (CCS) may only be practical for large combined emission point sources, leaving about 30% of site-wide emissions unaddressed. A combination of post-combustion CCS with a CO2 capture rate well above 90% and other mitigation measures such as fuel substitution and emission offsets is needed to transition towards carbon-neutral refinery operations. All of these technologies must be configured to minimize environmental burden shifting and scope 2 emissions, whilst doing so cost-effectively to improve energy access and affordability. In the long run, scope 3 emissions from the combustion of refinery products and flaring must also be addressed. The use of synthetic fuels and alternative feedstocks such as liquefied plastic waste, instead of crude oil, could present a growth opportunity in a circular carbon economy.
1 Introduction
The Sixth Assessment report from the Intergovernmental Panel on Climate Change (IPCC) finds that limiting global average temperature rise to 1.5–2°C from 1850 is unlikely without material reductions in greenhouse gas (GHG) emissions (IPCC, 2021). This sets an imperative to drastically reduce emissions from economic activities globally, whilst improving access to energy and ensuring its affordability.
Owing to its role as a provider of transport fuels and chemicals, the global refining sector has increased its capacity by 13% over the period from 2000 to 2018, with a corresponding increase in total GHG emissions by 24% (Lei et al., 2021). In total, oil refineries contributed 4% to global CO2 emissions in the year 2018, equating to approximately 1.3 Gt CO2. Although the demand for refined petroleum products has been declining in Europe and Latin America, a significant growth is seen in India and China, in part driven by rapid industrialization and an increasing demand for mobility services (Australian Institute of Petroleum, 2020; Marschinski et al., 2020). By 2025, over 150 additional refineries are planned to be operational across Asia, the Middle East, and Africa (Lei et al., 2021), thereby posing an inherent challenge to carbon-neutrality (Carbon Tracker Initiative, 2021).
A cost-effective emission mitigation strategy needs to be developed for refineries to be operable in a net-zero society. The nub of the argument in this paper is that a combination of post-combustion CO2 capture and storage (CCS) with fuel switching could provide the basis for such a strategy, considering both economic and environmental trade-offs. This ensures that scarcer greenhouse gas removal services (e.g., afforestation, direct air capture of CO2) are utilized to offset the most challenging sources of emissions in the economy, and not as the principal means to mitigation (Scott and Geden, 2018). A key consideration is that CO2 capture rates well above 90% are necessary to achieve a sufficiently high CO2 avoidance using post-combustion CCS because of upstream impacts from the fuel supply chains. Furthermore, it is important to minimize environmental burden shifting for any net-zero strategy to achieve sustainable deployment.
2 Emission Sources in a Large Conversion Refinery
There are more than a thousand oil refineries worldwide today, categorized broadly as hydroskimming or larger conversion refineries. Hydroskimming refineries comprise distillation units, and a series of process units to produce petrol, jet fuel, and middle distillates. By contrast, larger conversion refineries include hydrocrackers and catalytic cracking units to further reduce heavier crude fractions into lighter products (Jing et al., 2020). These constitute over 70% of all refineries in Europe and the United States, and emit around four times as much CO2 per barrel of oil as the simpler conversion refineries (Lei et al., 2021).
The main emission sources in larger conversion refineries are, in order of importance, the power station (29% of total emissions in an average refinery), fluid catalytic cracking unit (19%), atmospheric distillation units (19%), and steam methane reformer for hydrogen production (11%) (IEAGHG, 2017). The refinery flow diagram in Figure 1A shows the key conversion processes and outputs. Nowadays, the power station often consists of a natural gas combined cycle (NGCC) plant with additional gas-fired boilers to cover the overall power requirements of the refinery. Similarly, the heat requirements of the atmospheric and vacuum distillation units are met by burning the fuel oil and gases. The steam methane reformer uses natural gas both as a feedstock and a fuel, producing two separate CO2 point sources that add up to about 10 kgCO2,eq for each kg of hydrogen produced.
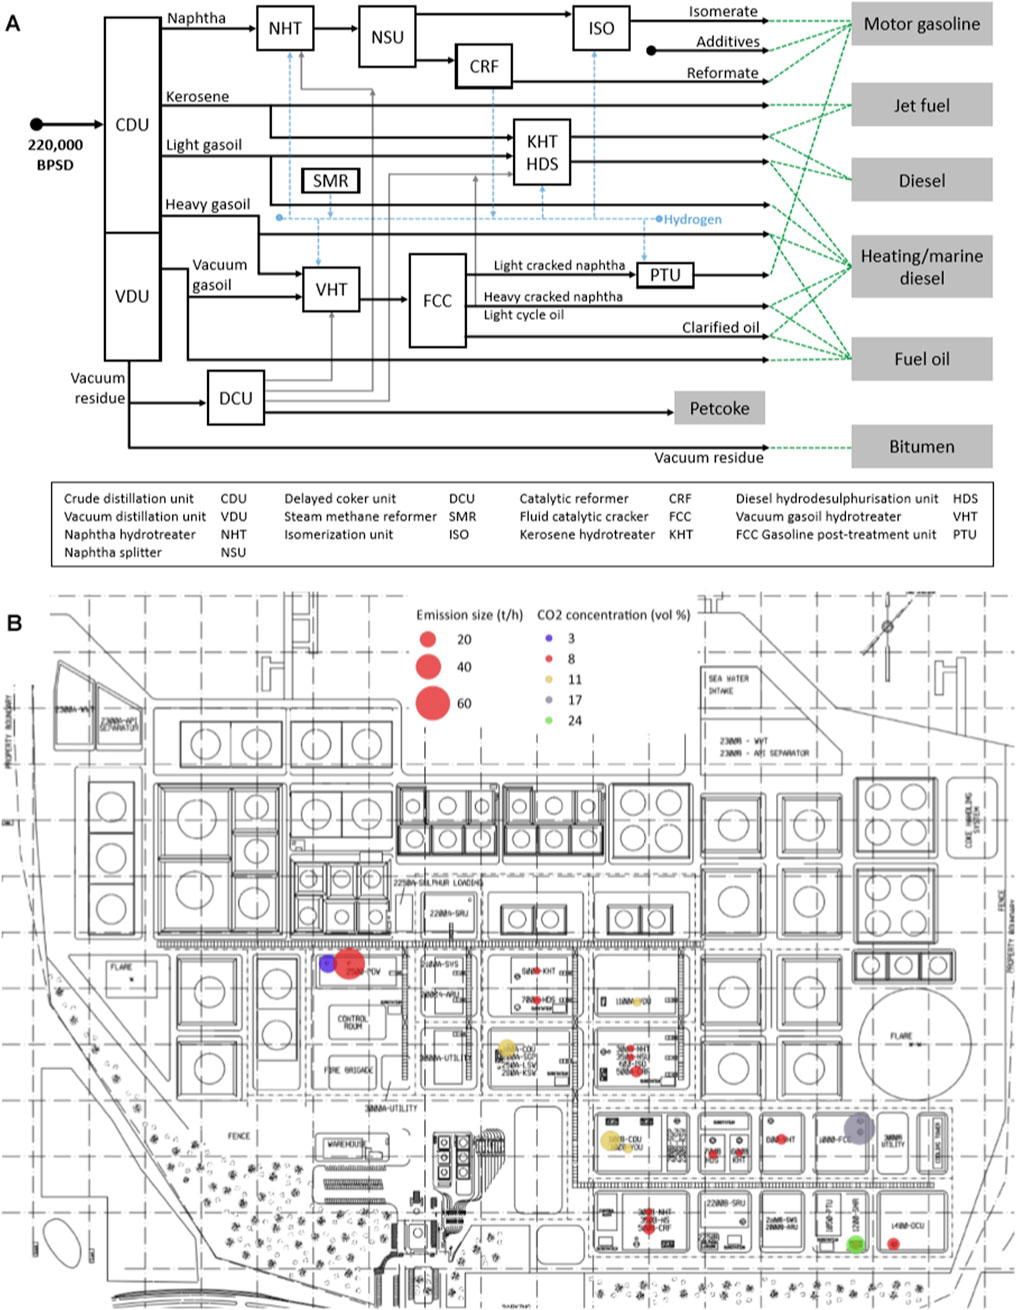
FIGURE 1. Simplified refinery block flow diagram (A), and example refinery plan (B) adapted from case 3 in IEAGHG (2017). The emission point sources in the refinery are overlaid in (B) to illustrate the distributed nature of these emissions.
Smaller units such as heaters, boilers, and gas turbines are also commonly powered by fuel gases, fuel oil, or natural gas. These heterogeneous emission point sources have a relatively low CO2 concentration (around 8%vol), but may emit large quantities of CO2 altogether. They are often distributed across a refinery’s site, as illustrated in Figure 1B, forming clusters that are separated over distances of several hundred meters or more (Simmonds et al., 2003; van Straelen et al., 2010).
A breakdown of emission point sources in a typical larger conversion refinery (Figure 1B) is provided in Supplementary Table S1 of the Electronic Supplementary Material (ESI), including an estimated CO2 concentration for each stream. Given these characteristics, the next section reviews the principal CO2 abatement measures, either approaches or technologies for reducing the CO2 footprint of assets, followed by an assessment of their suitability for deployment in this sector to meet net-zero targets in the final section.
3 Carbon Mitigation in Refineries
This section summarizes the main strategic measures to drive down direct CO2 emissions in oil refineries.
3.1 Energy Efficiency
Energy efficiency improvements are regarded by many as a cost-effective mitigation strategy (Szklo and Schaeffer, 2007; Morrow et al., 2015; Comodi et al., 2016; Malinauskaite et al., 2019), although they may only allow a modest reduction in emissions of 5–10% (Talaei et al., 2020; Lei et al., 2021). It has also been argued that a higher energy efficiency afforded by technology development could lead to an increase in refining throughput across the world (Lutz et al., 2021), a phenomenon known as rebound effect and one that would partially negate the benefits. Clearly, energy efficiency improvements cannot be the sole driver for decarbonization of the refining sector.
3.2 Carbon Capture and Storage
The oil and gas sector was an early adopter of CCS technology since the 1970s for enhanced oil recovery (EOR), which has provided a foundation of experience for deployment in other CO2 mitigation applications. A large body of research thereof has examined the use of CCS technology for mitigating emissions in refineries (Simmonds et al., 2003; van Straelen et al., 2010; Kuramochi et al., 2012; Johansson et al., 2013). The consensus is that CO2 capture from larger combined emission stacks is feasible (van Straelen et al., 2010). A recent analysis by the International Energy Agency Greenhouse Gas R&D Programme (IEAGHG, 2017) places the cost of CO2 avoidance using post-combustion CCS in refineries at US$166–185 per ton of CO2, with an overall direct emission avoidance share of 17–48%. These projections consider CO2 capture from larger emission sources, including the power plant stacks, fluid catalytic cracker, crude atmospheric and vacuum distillation units, and steam methane reformer. They identify the utilities plant fuelled by natural gas as the main contributor to the overall cost of CO2 avoidance (47%), followed by the CO2 capture and compression system (38%), and the interconnectors and retrofits (15%). By contrast, other emissions from boilers, heaters, or furnaces scattered across a refining site are more costly to abate due to their lower CO2 concentrations and flow rates, and the possible presence of impurities (van Straelen et al., 2010; Element Energy et al., 2014). However, the economics of CO2 capture from these heterogeneous point sources remains poorly understood and requires site-specific appraisals for a more accurate assessment (Element Energy et al., 2014).
3.3 Fuel Switching
Since around 70% of a refinery’s emissions are the result of fuel combustion (IEAGHG, 2017), fuel switching constitutes another key mitigation strategy. The corresponding CO2 abatement cost varies widely with the replacement fuel, with estimates in the UK in the order of US$30
4 Discussion
4.1 Why Use a Multipronged Approach?
The net-zero paradigm entails balancing any residual CO2 emissions with an equivalent amount of permanent CO2 removal from the atmosphere. Because of large uncertainties in the cost of technologies such as direct air capture (DAC) (Dods et al., 2021), a recent focus in CCS development has been to achieve CO2 capture rates well above 90% (Feron et al., 2019; Gao et al., 2019; Hirata et al., 2020; Brandl et al., 2021; Danaci et al., 2021). But regardless of the ability to achieve high capture rates, upwards of 30% of a refinery’s emissions may remain unaddressed by post-combustion CCS alone. The treatment of flared gases using post-combustion CCS is furthermore considered impractical, mainly because of the uncertainty in unplanned flaring (equipment failures, blow downs, or emergency shutdowns) (Emam, 2015; Calel and Mahdavi, 2020). This is where a multipronged approach becomes necessary. In particular, a system combining post-combustion CCS to tackle the largest emission point sources with fuel switching for smaller distributed emission sources may curtail refining emissions cost-effectively (Element Energy and Jacobs, 2018). Fuel switching is also relevant when the CCS installation and auxiliary on-site equipment are constrained by space. Further analysis is needed, however, to better understand the trade-offs between both post-combustion CCS and fuel switching, considering both economic and environmental impacts as well as technology readiness.
The CO2 avoidance is defined as the quantity of CO2 emissions avoided using abatement measures relative to a reference plant which uses a given mix of fuels and technologies. It is clear that both scope 1 (direct emissions from owned or controlled assets) and scope 2 emissions (indirect emissions from utilities, electricity, heating and cooling) need to be an integral part of any CO2 avoidance assessment in order for strategic decisions to be fully aligned with net-zero ambitions. An increase in the CO2 capture rate of the CCS plant generally goes in hand with an increase in overall (absolute) energy consumption and thus indirect environmental impacts (Feron et al., 2019). Similarly, the overall benefit of fuel switching to hydrogen, electricity, or biomass is largely dependent on indirect emissions associated with upstream processes used for their production. An archetypal example would be switching to hydrogen fuel produced from high-carbon electricity, which may not reduce the overall carbon footprint of a refinery, albeit reducing its direct CO2 emissions.
Here, we discuss the merits and caveats of post-combustion CCS in a highly optimistic case where all point-source emissions of the model refinery from Figure 1B would be captured. The case study assumes that the CCS unit would be powered by a dedicated CHP plant, any CO2 emissions of which would also be directed to the CCS unit—a realistic scenario insofar as installing CCS in existing refineries would entail retrofits, yet excess utilities (steam and electricity) might not be available on-site in most refineries. Further details about the case study assumptions and calculation procedure are reported in Section 3 of the ESI for completeness.
The first scenario in Figure 2A considers a natural gas-fired CHP plant. Notice how achieving 90% CO2 avoidance requires a capture rate in the CCS unit greater than 96% when natural gas from Great Britain fuels the CHP—a discrepancy attributed to upstream emissions from the natural gas supply chain as aforementioned. Conversely, a 99% capture rate in the CCS unit delivers 86% and 79% CO2 avoidance when the CHP fuel corresponds to natural gas and LNG, respectively, both at the global average emissions intensity. To put it in perspective, for our model refinery where post-combustion CCS covers 72% of the direct CO2 emissions (Figure 1B and Supplementary Table S1), the CO2 avoidance with a CHP plant fired by natural-gas at the global average emissions intensity and a 99% CO2 capture rate is no more than 62%. This reinforces the need for complementary measures such as fuel switching and negative emissions technologies, in addition to reducing scope 2 emissions. Another important consideration is that the post-combustion CCS unit consumes around 0.13 tonnes of natural gas per tonne of CO2 at capture rates of 90% and above, thus significantly increasing the primary energy requirements of a refinery.
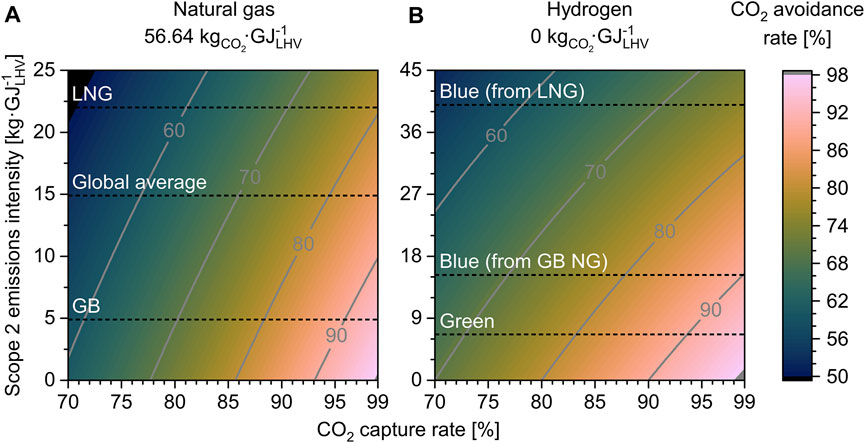
FIGURE 2. Interplay between CO2 avoidance rate (color map and contour lines), CO2 capture rate (x-axis), and scope 2 emissions intensity (y-axis) in post-combustion CCS. (A): Scenario of a CCS unit powered by a natural gas-fired CHP plant, with all its exhaust gases directed to the CCS unit. The dashed horizontal line labelled
For comparison, the second scenario in Figure 2B considers a hydrogen-fired CHP plant. Observe how scope 2 emissions (y-axis) attributed to blue (methane-derived with CCS) hydrogen increase compared to those of natural gas. Under the assumption of a 90% CO2 capture rate in the blue hydrogen production process, they are predicted to triple in the case of natural gas from Great Britain and almost double in the case of LNG at the global average emissions intensity. This supports the conclusion that burning natural gas in the CHP plant and capturing the resulting CO2 emissions would be more effective than switching to hydrogen fuel, unless this substitution fuel has a low indirect emission intensity as for instance with green (electrolytically-derived using renewable power) hydrogen. If blue hydrogen (generated from a global average supply of natural gas with a 90% CO2 capture rate) was used to address the remaining 28% of the direct emissions from the model refinery, the overall CO2 avoidance would increase from 62% to 75%; this would further increase to 87% if green hydrogen was used instead. To achieve net-zero, around 13–25% of the refinery’s direct emissions would still need to be offset through CO2 removal technologies.
The broader implications of producing green hydrogen to fuel the CHP plant of a refinery should also be considered carefully. In particular, guaranteeing a continuous supply of green hydrogen would require hydrogen storage, increasing cost. Moreover, green hydrogen suffers higher conversion losses compared to renewable electricity, and switching to renewable electricity could thus allow for greater CO2 avoidance rates. This cursory analysis points to the need for a detailed techno-economic analysis and life-cycle assessment between renewable electricity, green hydrogen, and blue hydrogen as future energy vectors in refineries.
4.2 Future Prospects
The previous discussion has underlined the need for a combination of emission mitigation strategies to effectively decarbonize existing oil refineries, taking the best of post-combustion CCS and fuel switching and complementing with CO2 removal technologies. Newer refinery installations could benefit further from the use of low-carbon power sources, such as solar or wind electricity, as the power plant typically is the single largest point-source emitter. Concentrated solar power (CSP) systems can already operate at steam temperatures between 60 and 250°C and have the ability to reach temperatures beyond 400°C (González-Garay et al., 2021). Not only could such CSP systems curb CO2 emissions from the utility system, but they might also be directly coupled with the CCS unit in the future (Wang et al., 2017). Of course, a key challenge in practice is integrating such technologies efficiently within a refinery.
Incorporating CCS in any application causes some degree of environmental burden shifting. The additional energy and infrastructure requirements, along with the consumption of additional resources (e.g., MEA solvent), increase water consumption and smog formation among other environmental impacts (Giordano et al., 2018). These environmental trade-offs are driven primarily by scope 1 and 2 emissions from the extra fuel needed for capturing the CO2 (Young et al., 2019). However, the relevance of burden shifting is unclear, as potential risks associated with increased impacts on indicators other than global warming potential are poorly understood, except perhaps for water scarcity due to its importance in arid regions (Zhu et al., 2021). More research is needed to understand the wider environmental implications of post-combustion CCS, fuel switching, and CO2 removal. In particular, the environmental burden shifting caused by decarbonizing refineries could be analyzed through the framework of planetary boundaries (Rockström et al., 2009; Ryberg et al., 2018a,b), which has already been used to compare a range of CCU applications (González-Garay et al., 2019; Galán-Martín et al., 2021). This would allow for the nexus between carbon emissions, water use, and primary energy consumption to be considered as a whole (Wang et al., 2021), even opening up opportunities for expanding the scope to material flows (Elshkaki, 2019) and resource availability (Chamas et al., 2021).
A major focus herein has been on addressing scope 1 and 2 emissions from refineries, in the manner of a well-to-tank analysis. Yet these activities may only account for 10–20% of emissions from oil products, while the remaining 80–90% is associated with fuel use (Total, 2020; Bieker, 2021)—these so-called scope 3 emissions cover fuel combustion by consumers (tank-to-wheel) as well as flaring along with other activities in a company’s value chain. To comply with the net-zero vision, scope 3 emissions will eventually need to be eliminated or offset alongside scope 1 and 2 emissions.
Besides DAC, engineered CO2 removal technologies include the use of biogenic carbon feedstock with CCS for bioenergy production, also known as BECCS (Fajardy and Mac Dowell, 2017). Higher penetration of CO2 capture and utilization technology combined with the development of green hydrogen could also enable synthetic fuels, which have the potential to deliver near-zero emissions over the entire well-to-wheel life-cycle, so long as their production processes are carbon-neutral. Although the economics of synthetic fuels is currently hindered by high energy consumption, production costs are expected to fall as the technology scales up (E4tech, 2021; Gudde et al., 2019; Daggash et al., 2018). Furthermore, various chemical feedstocks and products could be displaced through plastic waste recycling, thereby lowering scope 3 emissions and enabling a circular carbon economy. For example, the pyrolysis of plastic waste could displace virgin naptha and lower the total impact by approximately 400 kgCO2,eq for each tonne of plastic (Jeswani et al., 2021).
More generally, CO2 utilization may be financially viable in a supportive market environment but commercially available utilization technologies are still lacking the scale and permanence of CO2 removal required to be relevant for long-term climate stabilization (Mac Dowell et al., 2017). CO2 utilization has a role in the portfolio of CO2 mitigation approaches in the near-term, albeit likely a small one, as it is highly dependent on supportive regional policies (such as the 45Q tax credits for enhanced oil recovery in the United States) and coordinated market development for a diverse set of CO2-based products. This is in contrast with CCS technologies, which offer the opportunity to use existing technologies and infrastructure without a significant reshaping of the industry, whilst permanently removing CO2 from the atmosphere (Gabrielli et al., 2020).
Finally, the sustainability of CO2 mitigation strategies in refineries ought to consider the social dimension alongside economic and environmental trade-offs. This could follow a triple helix approach, as recently advocated for CO2 utilization assessment (McCord et al., 2021). Furthermore, the costs associated with the transition to net-zero should be managed in a socially equitable manner (GCCSI, 2020). The development of regulatory and policy frameworks that facilitate such a sustainable transition to net-zero for the refining sector will be a crucial milestone in this endeavour.
Data Availability Statement
The original contributions presented in the study are included in the article/Supplementary Material, further inquiries can be directed to the corresponding authors.
Author Contributions
Conceptualization—AB, NS. Writing (original draft)—AB, MB, DD, AG-G, NS. Writing (review and editing)—AB, MB, BC, DD, AG-G, NS. Visualization—MB, DD, NS. Supervision—BC.
Conflict of Interest
The authors declare that the research was conducted in the absence of any commercial or financial relationships that could be construed as a potential conflict of interest.
The handling Editor declared a past co-authorship with the authors MB, NS.
Publisher’s Note
All claims expressed in this article are solely those of the authors and do not necessarily represent those of their affiliated organizations, or those of the publisher, the editors and the reviewers. Any product that may be evaluated in this article, or claim that may be made by its manufacturer, is not guaranteed or endorsed by the publisher.
Acknowledgments
AB and BC are grateful to the Engineering and Physical Sciences Research Council (EPSRC) for funding the research under the UKRI Interdisciplinary Centre for Circular Chemical Economy programme (EP/V011863/1). DD would like to acknowledge EPSRC funding under the United Kingdom Carbon Capture and Storage Research Centre (UKCCSRC, EP/P026214/1). MB would like to acknowledge RCUK funding under grants EP/T033940/1 (CCS Project), NE/P019900/1 (GGR Opt), EP/M001369/1 (MESMERISE-CCS), EP/N024567/1 (CCSInSupply) and EP/M015351/1 (ONF).
Supplementary Material
The Supplementary Material for this article can be found online at: https://www.frontiersin.org/articles/10.3389/fceng.2022.804163/full#supplementary-material
References
Australian Institute of Petroleum (2020). Downstream Petroleum. Tech. Rep. Barton, ACT, AU: Australian Institute of Petroleum. Available at: https://www.aip.com.au/sites/default/files/download-files/2020-04/Downstream%20Petroleum.pdf (Accessed 08 29, 2021).
Bieker, G. (2021). A Global Comparison of the Life-Cycle Greenhouse Gas Emissions of Combustion Engine and Electric Passenger Cars. San Francisco, CA: The international Counil of Clean Transportation.
Brandl, P., Bui, M., Hallett, J. P., and Mac Dowell, N. (2021). Beyond 90% Capture: Possible, but at what Cost? Int. J. Greenhouse Gas Control. 105, 103239. doi:10.1016/j.ijggc.2020.103239
Calel, R., and Mahdavi, P. (2020). Opinion: The Unintended Consequences of Antiflaring Policies-And Measures for Mitigation. Proc. Natl. Acad. Sci. U.S.A. 117, 12503–12507. doi:10.1073/PNAS.2006774117
Carbon Tracker Initiative (2021). Adapt to Survive: Why Oil Companies Must Plan for Net Zero and Avoid Stranded Assets. Tech. Rep. London, UK: Carbon Tracker Initiative.
Chamas, Z., Abou Najm, M., Al-Hindi, M., Yassine, A., and Khattar, R. (2021). Sustainable Resource Optimization under Water-Energy-Food-Carbon Nexus. J. Clean. Prod. 278, 123894. doi:10.1016/j.jclepro.2020.123894
Comodi, G., Renzi, M., and Rossi, M. (2016). Energy Efficiency Improvement in Oil Refineries through Flare Gas Recovery Technique to Meet the Emission Trading Targets. Energy 109, 1–12. doi:10.1016/j.energy.2016.04.080
Daggash, H. A., Patzschke, C. F., Heuberger, C. F., Zhu, L., Hellgardt, K., Fennell, P. S., et al. (2018). Closing the Carbon Cycle to Maximise Climate Change Mitigation: power-to-methanolvs.Power-To-Direct Air Capture. Sustain. Energ. Fuels 2, 1153–1169. doi:10.1039/C8SE00061A
Danaci, D., Bui, M., Petit, C., and Mac Dowell, N. (2021). En Route to Zero Emissions for Power and Industry with Amine-Based post-combustion Capture. Environ. Sci. Technol. 55, 10619–10632. doi:10.1021/acs.est.0c07261
Dods, M. N., Kim, E. J., Long, J. R., and Weston, S. C. (2021). Deep CCS: Moving beyond 90% Carbon Dioxide Capture. Environ. Sci. Technol. 55, 8524–8534. doi:10.1021/acs.est.0c07390
E4tech (2021). Role of DAC in E-Fuels for Aviation. Tech. Rep. Brussels, BE: Transport & Environment.
Element Energy and Jacobs (2018). Industrial Fuel Switching Market Engagement Study. Tech. Rep. December. London, UK: Department of Business, Energy, and Industrial Strategy. Available at: https://assets.publishing.service.gov.uk/government/uploads/system/uploads/attachment_data/file/824592/industrial-fuel-switching.pdf (Accessed 08 24, 2021).
Element Energy (2014). Demonstrating CO2 Capture in the UK Cement, Chemicals, Iron and Steel and Oil Refining Sectors by 2025: A Techno-Economic Study. Tech. Rep. Cambridge, UK: Carbon Counts, PSE, Imperial College London, and University of Sheffield, Element Energy Ltd. Available at: https://www.element-energy.co.uk/wordpress/wp-content/uploads/2017/06/Element_Energy_DECC_BIS_Industrial_CCS_and_CCU_final_report_14052014.pdf (Accessed 08 28, 2021).
Elshkaki, A. (2019). Material-energy-water-carbon Nexus in China's Electricity Generation System up to 2050. Energy 189, 116355. doi:10.1016/j.energy.2019.116355
Fajardy, M., and Mac Dowell, N. (2017). Can BECCS Deliver Sustainable and Resource Efficient Negative Emissions? Energy Environ. Sci. 10, 1389–1426. doi:10.1039/C7EE00465F
Feron, P., Cousins, A., Jiang, K., Zhai, R., Shwe Hla, S., Thiruvenkatachari, R., et al. (2019). Towards Zero Emissions from Fossil Fuel Power Stations. Int. J. Greenhouse Gas Control. 87, 188–202. doi:10.1016/j.ijggc.2019.05.018
Gabrielli, P., Gazzani, M., and Mazzotti, M. (2020). The Role of Carbon Capture and Utilization, Carbon Capture and Storage, and Biomass to Enable a Net-Zero-CO2 Emissions Chemical Industry. Ind. Eng. Chem. Res. 59, 7033–7045. doi:10.1021/acs.iecr.9B06579
Galán-Martín, Á., Tulus, V., Díaz, I., Pozo, C., Pérez-Ramírez, J., and Guillén-Gosálbez, G. (2021). Sustainability Footprints of a Renewable Carbon Transition for the Petrochemical Sector within Planetary Boundaries. One Earth 4, 565–583. doi:10.1016/j.oneear.2021.04.001
Gao, T., Selinger, J. L., and Rochelle, G. T. (2019). Demonstration of 99% CO2 Removal from Coal Flue Gas by Amine Scrubbing. Int. J. Greenhouse Gas Control. 83, 236–244. doi:10.1016/j.ijggc.2019.02.013
GCCSI (2020). CCS: Applications and Opportunities for the Oil and Gas Industry. Tech. Rep. Australia: Global CCS Institute. Available at: https://www.globalccsinstitute.com/wp-content/uploads/2020/05/Brief-_CCS-in-OAG-3.pdf (Accessed 08 26, 2021).
Giordano, L., Roizard, D., and Favre, E. (2018). Life Cycle Assessment of post-combustion CO 2 Capture: A Comparison between Membrane Separation and Chemical Absorption Processes. Int. J. Greenhouse Gas Control. 68, 146–163. doi:10.1016/j.ijggc.2017.11.008
González-Garay, A., Frei, M. S., Al-Qahtani, A., Mondelli, C., Guillén-Gosálbez, G., and Pérez-Ramírez, J. (2019). Plant-to-planet Analysis of CO2-based Methanol Processes. Energ. Environ. Sci. 12, 3425–3436. doi:10.1039/C9EE01673B
González-Garay, A., Mac Dowell, N., and Shah, N. (2021). A Carbon Neutral Chemical Industry Powered by the Sun. Discov. Chem. Eng. 1, 1–22. doi:10.1007/s43938-021-00002-x
Gudde, N., Larivé, J., and Yugo, M. (2019). Refinery 2050: Conceptual Assessment. Exploring Opportunities and Challenges for the EU Refining Industry to Transition towards a low-CO2 Intensive Economy. Tech. Rep. Brussels, BE: Concawe. Available at: https://www.concawe.eu/wp-content/uploads/Rpt_19-9-1.pdf (Accessed 08 27, 2021).
Hirata, T., Tsujiuchi, T., Kamijo, T., Kishimoto, S., Inui, M., Kawasaki, S., et al. (2020). Near-zero Emission Coal-Fired Power Plant Using Advanced KM CDR Process. Int. J. Greenhouse Gas Control. 92, 102847. doi:10.1016/j.ijggc.2019.102847
IEAGHG (2017). Understanding the Cost of Retrofitting CO2 Capture in an Integrated Oil Refinery. 2017/TR8. AugustCheltenham, UK: IEAGHG.
IPCC (2021). Climate Change 2021: The Physical Science Basis. Contribution of Working Group I to the Sixth Assessment Report of the Intergovernmental Panel on Climate Change. Cambridge, UK: Cambridge University Press.
Jeswani, H., Krüger, C., Russ, M., Horlacher, M., Antony, F., Hann, S., et al. (2021). Life Cycle Environmental Impacts of Chemical Recycling via Pyrolysis of Mixed Plastic Waste in Comparison with Mechanical Recycling and Energy Recovery. Sci. Total Environ. 769, 144483. doi:10.1016/J.SCITOTENV.2020.144483
Jing, L., El-Houjeiri, H. M., Monfort, J.-C., Brandt, A. R., Masnadi, M. S., Gordon, D., et al. (2020). Carbon Intensity of Global Crude Oil Refining and Mitigation Potential. Nat. Clim. Chang. 10, 526–532. doi:10.1038/s41558-020-0775-3
Johansson, D., Franck, P. A., and Berntsson, T. (2013). CO2 Capture in Oil Refineries: Assessment of the Capture Avoidance Costs Associated with Different Heat Supply Options in a Future Energy Market. Energ. Convers. Manage. 66, 127–142. doi:10.1016/j.enconman.2012.09.026
Kuramochi, T., Ramírez, A., Turkenburg, W., and Faaij, A. (2012). Comparative Assessment of CO2 Capture Technologies for Carbon-Intensive Industrial Processes. Prog. Energ. Combustion Sci. 38, 87–112. doi:10.1016/j.pecs.2011.05.001
Lei, T., Guan, D., Shan, Y., Zheng, B., Liang, X., Meng, J., et al. (2021). Adaptive CO2 Emissions Mitigation Strategies of Global Oil Refineries in All Age Groups. One Earth 4, 1114–1126. doi:10.1016/j.oneear.2021.07.009
Lutz, C., Banning, M., Ahmann, L., and Flaute, M. (2021). Energy Efficiency and Rebound Effects in German Industry - Evidence from Macroeconometric Modeling. Econ. Syst. Res., 1–20. doi:10.1080/09535314.2021.1937953
Mac Dowell, N., Fennell, P. S., Shah, N., and Maitland, G. C. (2017). The Role of CO2 Capture and Utilization in Mitigating Climate Change. Nat. Clim. Change 7, 243–249. doi:10.1038/nclimate3231
Malinauskaite, J., Jouhara, H., Ahmad, L., Milani, M., Montorsi, L., and Venturelli, M. (2019). Energy Efficiency in Industry: EU and National Policies in Italy and the UK. Energy 172, 255–269. doi:10.1016/j.energy.2019.01.130
Marschinski, R., Barreiro-Hurle, J., and Lukach, R. (2020). Competitiveness of Energy-Intensive Industries in Europe: The Crisis of the Oil Refining Sector between 2008 and 2013. Econ. Energ. Environ. Pol. 9, 167–185. doi:10.5547/2160-5890.8.2.rmar
McCord, S., Armstrong, K., and Styring, P. (2021). Developing a Triple helix Approach for CO2 Utilisation Assessment. Faraday Discuss. 230, 247–270. doi:10.1039/D1FD00002K
Morrow, W. R., Marano, J., Hasanbeigi, A., Masanet, E., and Sathaye, J. (2015). Efficiency Improvement and CO2 Emission Reduction Potentials in the United States Petroleum Refining Industry. Energy 93, 95–105. doi:10.1016/j.energy.2015.08.097
Progressive Energy (2020). HyNet Industrial Fuel Switching Feasibility Study. Tech. Rep. January. Stonehouse, UK: Progressive Energy Ltd. Available at: https://assets.publishing.service.gov.uk/government/uploads/system/uploads/attachment_data/file/866402/Phase_2_-_Progressive_Energy_-_HyNet.pdf (Accessed 08 24, 2021).
Rockström, J., Steffen, W., Noone, K., Persson, A., Chapin, F. S., Lambin, E. F., et al. (2009). A Safe Operating Space for Humanity. Nature 461, 472–475. doi:10.1038/461472a
Ryberg, M. W., Owsianiak, M., Clavreul, J., Mueller, C., Sim, S., King, H., et al. (2018a). How to Bring Absolute Sustainability into Decision-Making: An Industry Case Study Using a Planetary Boundary-Based Methodology. Sci. Total Environ. 634, 1406–1416. doi:10.1016/j.scitotenv.2018.04.075
Ryberg, M. W., Owsianiak, M., Richardson, K., and Hauschild, M. Z. (2018b). Development of a Life-Cycle Impact Assessment Methodology Linked to the Planetary Boundaries Framework. Ecol. Indicators 88, 250–262. doi:10.1016/j.ecolind.2017.12.065
Scott, V., and Geden, O. (2018). The challenge of Carbon Dioxide Removal for EU Policy-Making. Nat. Energ. 3, 350–352. doi:10.1038/S41560-018-0124-1
Simmonds, M., Hurst, P., Wilkinson, M., Watt, C., and Roberts, C. (2003). “A Study of Very Large Scale Post Combustion CO2 Capture at A Refining & Petrochemical Complex,” in Greenhouse Gas Control Technologies - 6th International Conference. Editors J. Gale, and Y. Kaya (Amsterdam, Netherlands: Elsevier), 39–44. doi:10.1016/B978-008044276-1/50007-6
Szklo, A., and Schaeffer, R. (2007). Fuel Specification, Energy Consumption and CO2 Emission in Oil Refineries. Energy 32, 1075–1092. doi:10.1016/j.energy.2006.08.008
Talaei, A., Oni, A. O., Ahiduzzaman, M., Roychaudhuri, P. S., Rutherford, J., and Kumar, A. (2020). Assessment of the Impacts of Process-Level Energy Efficiency Improvement on Greenhouse Gas Mitigation Potential in the Petroleum Refining Sector. Energy 191, 116243. doi:10.1016/j.energy.2019.116243
Total (2020). Getting to Net Zero. France: Courbevoie. Available at: https://totalenergies.com/sites/g/files/nytnzq121/files/documents/2020-10/total-climate-report-2020.pdf (Accessed 08 26, 2021).
van Straelen, J., Geuzebroek, F., Goodchild, N., Protopapas, G., and Mahony, L. (2010). CO2 Capture for Refineries, a Practical Approach. Int. J. Greenhouse Gas Control. 4, 316–320. doi:10.1016/j.ijggc.2009.09.022
Wang, J., Yu, Z., Zeng, X., Wang, Y., Li, K., and Deng, S. (2021). Water-energy-carbon Nexus: A Life Cycle Assessment of post-combustion Carbon Capture Technology from Power Plant Level. J. Clean. Prod. 312, 127727. doi:10.1016/j.jclepro.2021.127727
Wang, J., Zhao, J., Wang, Y., Deng, S., Sun, T., and Li, K. (2017). Application Potential of Solar-Assisted post-combustion Carbon Capture and Storage (CCS) in China: A Life Cycle Approach. J. Clean. Prod. 154, 541–552. doi:10.1016/j.jclepro.2017.04.021
Young, B., Krynock, M., Carlson, D., Hawkins, T. R., Marriott, J., Morelli, B., et al. (2019). Comparative Environmental Life Cycle Assessment of Carbon Capture for Petroleum Refining, Ammonia Production, and Thermoelectric Power Generation in the United States. Int. J. Greenhouse Gas Control. 91, 102821. doi:10.1016/j.ijggc.2019.102821
Keywords: refinery, decarbonization, CCS, fuel switching, hydrogen, oil, net-zero
Citation: Sunny N, Bernardi A, Danaci D, Bui M, Gonzalez-Garay A and Chachuat B (2022) A Pathway Towards Net-Zero Emissions in Oil Refineries. Front. Chem. Eng. 4:804163. doi: 10.3389/fceng.2022.804163
Received: 28 October 2021; Accepted: 13 January 2022;
Published: 11 February 2022.
Edited by:
Matteo Gazzani, Utrecht University, NetherlandsReviewed by:
Qingchun Yang, Hefei University of Technology, ChinaMar Pérez-Fortes, Delft University of Technology, Netherlands
Copyright © 2022 Sunny, Bernardi, Danaci, Bui, Gonzalez-Garay and Chachuat. This is an open-access article distributed under the terms of the Creative Commons Attribution License (CC BY). The use, distribution or reproduction in other forums is permitted, provided the original author(s) and the copyright owner(s) are credited and that the original publication in this journal is cited, in accordance with accepted academic practice. No use, distribution or reproduction is permitted which does not comply with these terms.
*Correspondence: Andrea Bernardi, YS5iZXJuYXJkaTEzQGltcGVyaWFsLmFjLnVr; Benoît Chachuat, Yi5jaGFjaHVhdEBpbXBlcmlhbC5hYy51aw==