 Vishalini Nair Kuncheekanna1*
 Stefania Gardarsdottir
 Simon Roussanaly
- 1Department of Chemical Engineering, Norwegian University of Science and Technology (NTNU), Trondheim, Norway
- 2SINTEF Energy Research, Trondheim, Norway
This study seeks to understand the impact of uncertainties in the solvent property submodel on the design and cost of the solvent-based CO2 capture process. First, a deterministic model of the MEA-based CO2 capture process using the CEMCAP reference cement plant case was developed and validated in the CO2SIM flowsheet simulator. Subsequently, a stochastic approach using the Monte Carlo simulation framework was applied by coupling the validated process model and UQLab, a MATLAB-based uncertainty quantification toolbox. Based on this, the implications of these uncertainties on key performance indicators are derived: CO2 capture ratio, specific reboiler duty, reboiler duty, condenser duty, lean rich heat exchanger duty, and lean and rich loading. Finally, the impact of these uncertainties on equipment design and the CO2 avoidance cost are assessed and discussed. The results show that heat exchanger duty uncertainty falls within the overdesign margin commonly used in engineering practice. However, the CO2 avoidance cost exhibits significant uncertainty linked to solvent properties (∼5.2%) that are mainly linked to uncertainty in the CO2 capture ratio. Hence, a key element in reducing CO2 avoidance cost uncertainty may be to validate suitable absorber height to guarantee, with a reasonable confidence, a 90% capture ratio via pilot testing.
1 Introduction
Process simulation and modeling tools have made a valuable contribution to the development and deployment of solvent-based CO2 capture systems. They are widely utilized to simulate and predict key performance indicators (KPIs) within the context of design and operational possibilities, techno-economic feasibility, and the energy integration and reduction aspects of the process (Gardarsdottir et al., 2019; Neveux et al., 2013). Despite the broad implementation of computational tools for this process, the level of confidence in the evaluation of these KPIs often entails questions due to the presence of inherent uncertainties in the process models.
Furthermore, many of these modeling activities for solvent-based CO2 capture are performed under a deterministic setting (i.e., with set values not considering possible uncertainties). Although the use of deterministic simulation models has proven its capability in reasonably predicting process design performance, it is important to assess and understand the impact of uncertainties on KPIs, especially for novel systems such as CO2 capture. This is also known as a “stochastic simulation model” (Diwekar and Rubin, 1991). In the research area of uncertainty quantification (UQ), a stochastic simulation uses a probabilistic approach that allows the specification of boundaries for uncertain inputs, leading to the estimation and display of the probability of various model KPIs, which is considered more informative. This, in turn, will not only help to test the robustness of model predictions but also maximize the knowledge gained specifically for process performance and cost evaluations of the CO2 capture process.
The application of UQ has been gaining popularity in the field of solvent-based CO2 capture technologies as described in our previously published mini-literature review (Kuncheekanna and Jakobsen, 2023). Based on the existing literature, few studies have focused on demonstrating the effect of solvent property submodels on KPIs such as the percentage of CO2 captured and CO2 loading within the UQ framework (Morgan et al., 2015; Morgan et al., 2017; Soares Chinen et al., 2018). Meanwhile, very few additional studies have attempted to demonstrate the impact of solvent property submodels on the design and cost analysis of absorption units using a sensitivity analysis approach (Nookuea et al., 2015, 2016; Øi and Karunarathne, 2021). However, we argue that the reported literature is lacking; first, a consideration of the possible interaction and combined effects in solvent property submodels and, second, performance under the probabilistic modeling approach that allows prediction in the overall variation in the system behavior when a range of input uncertainty is accounted for. Additional to these arguments, the effect of solvent property uncertainty on the assessment of confidence in the process performance of major equipment in the full-scale CO2 capture process model, including economic performance, does not seem to have been evaluated. There is a need to establish more reliable predictions in economic KPIs of CO2 capture systems that account for fundamental uncertainties.
In our previous research (Kuncheekanna and Jakobsen, 2023; Kuncheekanna et al., 2020), the application of Monte Carlo UQ propagation methodology on a CO2-MEA solvent-based absorber model was illustrated. This effectively established the foundation for applying UQ methodologies for the CO2 absorber column process model to understand the confidence in the CO2 capture ratio (CCR), taking into account uncertainties in solvent property submodels. Consequently, a visible range of variation in the prediction of CO2 absorber column sizing and cost was shown. It has thus become apparent that explicitly quantifying the uncertainties and integrating uncertainty analysis during the modeling phase for CO2 capture processes is beneficial. Furthermore, these analyses can profoundly increase the understanding of the technical and cost performance of CCS technologies for modeling practitioners as well as for policy and decision makers (van der Spek et al., 2020). Therefore, this research intends to build on previous studies by expanding the scope of research to understand the overall effect of solvent property uncertainties across a full-scale CO2 capture process model. In order to achieve this, a Monte Carlo uncertainty analysis framework using UQLab V2.0 tool (Marelli and Sudret, 2014) is integrated with the CO2SIM flowsheet simulator (Einbu et al., 2022), developed by SINTEF Industry, to evaluate the impact of uncertainties in MEA solvent property submodels on the performance of the solvent-based capture process. This includes the design of different parts of the capture process (i.e., condenser, reboiler and lean-rich heat exchanger), CO2 capture ratio, and ultimately, the economic KPIs of the overall capture process.
The paper is organized as follows. Section 2 describes the simulation of the CO2 capture process model employed, including the key inputs to the simulation, the methodology for the stochastic approach applied for the uncertainty analysis, and cost estimation. Section 3 presents the simulation results of the deterministic process model, stochastic effect of the uncertain inputs on the selected key performance indicators for the overall capture performance, and a cost impact analysis. Finally, some concluding remarks are made in Section 4.
2 Methodology
2.1 Deterministic baseline case for CO2 capture process simulation
This section presents the essential details of the deterministic baseline case of the CO2 capture process model, simulation approach, and the process simulator before navigating through the different elements of implementing the end-to-end UQ analysis.
2.1.1 Process description
In this study, stochastic uncertainty analysis is performed on a steady-state CO2 capture model of a typical solvent-based full-scale absorption process (Figure 1). The case consists of removing CO2 in the flue gas generated from a cement production plant using 30 wt% monoethanolamine (MEA) solvent. The process consists of five major pieces of equipment which are assessed in this study; an absorber column, a stripper column, a lean-rich heat exchanger, a cooler, and a reboiler. The flue gas received from the cement plant is first cooled in the direct contact cooler (DCC) to approximately 40°C and subsequently introduced to the absorber. The flue gas then flows upwards through the absorber countercurrent to the lean solvent flow (cold lean amine stream) where the CO2 in the flue gas reacts with the solvent. The solvent heats as it gradually absorbs CO2, with the temperature inside the absorber typically being between 40°C and 60°C and at 1 atm. The treated gas is then sent to a water wash column and vented to the atmosphere, while the condensed water is recovered and recycled back to the rich solvent (cold rich amine stream). The water wash unit is used to control the amount of water in the entire system as well as to reduce degradation products in the treated gas. The condensed water from this unit is recycled back to the rich solvent pump. The rich solvent from the bottom of the absorber is then transferred to the top of the stripper via a lean rich heat exchanger. In the stripper, CO2 and MEA solutions were separated from the rich solvent mixture by heating between 110°C and 120°C and at a slightly higher atmospheric pressure of 1.8–2 atm. Typically, a slightly higher pressure than atmospheric pressure is selected for the stripper to gain advantage of reducing energy and sizing requirements. In this study, this pressure is chosen to match similar operating conditions implemented in the CO2 capture from a cement plant process model for the CEMCAP project (Voldsund et al., 2019). The stripper is connected to the reboiler, providing heat requirements for solvent regeneration. The regenerated solvent (hot lean amine stream) is then pumped back to the absorber via the lean/rich heat exchanger that allows heat recovery from the hot lean solution to the cold rich solution to reduce the temperature. A trim cooler is used to further cool the lean solution before entering the absorber. The high-purity CO2 from the top of the stripper is separated from the solvent in a flash separator (condenser unit) and is sent for additional conditioning to reach the transport specifications. The condensate stream (Condenser to Mix01 stream) from the separation is then recycled back to the top of the stripper column.
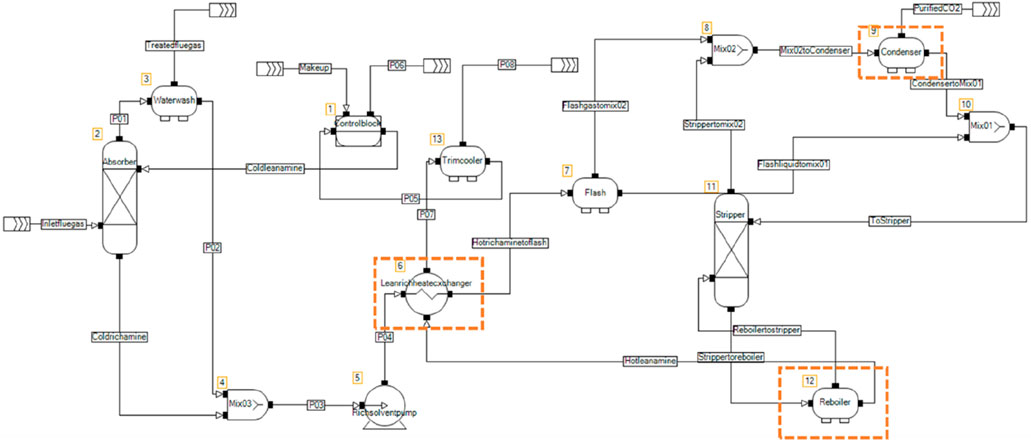
Figure 1. Process flowsheet for the deterministic 30 wt% MEA-based CO2 capture plant modeled using the CO2SIM flowsheet simulator. The dashed lines are the selected equipment for the stochastic cost analysis.
The steady-state rate-based CO2 capture process model shown in Figure 1 was simulated using the flowsheet simulator CO2SIM version 7.1.0.5 (Einbu et al., 2022; Tobiesen et al., 2007). This is proprietary in-house software developed by SINTEF and NTNU which is specifically dedicated to model solvent-based CO2 absorption post-combustion. The existing process setup was adapted as a basis for the MEA-based CO2 capture simulation model (Tobiesen et al., 2017). While the adopted reference case in the existing simulation includes a DCC and a flue gas fan, these are here excluded as they are not impacted by uncertainties in solvent properties. This current model and the specific flowsheet tool have been selected for this study as it is an advanced platform specifically for modeling the CO2 absorption process and for developing various solvent systems. It is a well-validated process modeling tool against pilot plant experimental data over a wide range of operating conditions and with various amine solvents. Performing uncertainty analysis for a complex model can be computationally demanding. The process was simulated using the inbuilt CO2SIM soft model thermodynamic fluid package expressed as temperature- and loading-dependent polynomial correlations to account for the vapor liquid equilibrium (VLE). The simulator also includes other important thermo-physical solvent property submodels to represent the heat and mass transfer, chemical reaction kinetics, and internal column hydraulics required to solve the complex reactive absorption process. More comprehensive knowledge about the underlying rate-based model implementation, including the soft model for VLE and property submodels, is described in detail in Einbu et al. (2022), Kvamsdal et al. (2011), Tobiesen et al. (2008), and Tobiesen et al. (2007).
2.1.2 Case study and process simulation input specifications
In the present study, the case of CO2 capture from a cement plant is considered based on the Horizon 2020 CEMCAP project (Gardarsdottir et al., 2019; Voldsund et al., 2019). The design of the CO2 capture plant is thus based on Anantharaman et al. (2017) and Voldsund et al. (2018). The deterministic baseline case with the flue gas conditions from the stack during the second part of the year is used for the equipment sizing and economic evaluation in Gardarsdottir et al. (2019). Therefore, the flue gas composition and specification of this scenario will be considered for the process simulation. The composition is extracted directly from the inlet to the absorber (outlet stream DCC) stream data (Voldsund et al., 2019). Table 1 shows the specific input data of the flue gas stream provided in the CO2SIM simulator.

Table 1. Input specifications of the flue gas at the absorber inlet for the CO2SIM simulator.
The selected operating parameters for the main units as input to the CO2SIM simulator are summarized in Table 2. The approach here is to simulate the process model using the plant design specification as the CEMCAP simulation case using Aspen HYSYS V9 (Voldsund et al., 2019), except for some inputs that need to be adjusted to achieve a similar 90% CO2 capture ratio scenario since the CO2SIM simulator is used in this study. In addition, the following specifications and assumptions are required to solve the developed close-loop flowsheet of the rate-based model uniquely in the CO2SIM simulator,
a) Sulzer Mellapak 250Y structured packing is adopted for both absorber and stripper columns in the CO2SIM simulator.
b) The absorber and stripper column packing heights and diameter are fixed based on the equipment design used for economic analysis in CEMCAP project specification (Gardarsdottir et al., 2019).
c) The sizing of the lean rich heat exchanger is defined by specifying the minimum temperature approach at 10°C following CEMCAP project specifications, and the pressure is set to the inlet pressure by default.
d) Lean solvent trim cooler temperature is fixed at 40°C for the absorber inlet, and the condenser temperature is set to 30°C following the CEMCAP project specification.
e) As per CEMCAP project specifications, lean and rich loading of 0.22 and 0.5 mol CO2/mol MEA, respectively, are required to achieve CCR of 90%. However, in the CO2SIM simulator, both rich and lean loadings are calculated for the closed-loop flowsheet where rich loading is based on overall absorber performance and lean loading is based on the reboiler duty and solvent circulation rate (Einbu et al., 2022).
f) For the whole flowsheet simulator to be solved with MEA concentration and for plant water balance and overall material balances to be maintained, the lean solvent circulation rate must be supplied as an input to the control block unit (Einbu et al., 2022). Therefore, lean solvent flowrate will be tuned to achieve the 90% CO2 capture performance, and simulation convergence can be achieved.
g) As per CEMCAP project specifications, the regenerator reboiler requires 96–97 MW steam, corresponding to 3.76–3.80 MJ/kg CO2 specific reboiler duty at 128°C. However, for this closed-loop flowsheet case, the reboiler temperature will be tuned and given a constraint not exceeding 128°C while setting the pressure at 2 bar to reach CCR at 90%. This will allow the study of impact of the uncertainties in the reboiler duty and its associated cost as the model output.
h) The discharge pressure of the rich solvent pump is set to 6.09 bar as per CEMCAP project specifications.
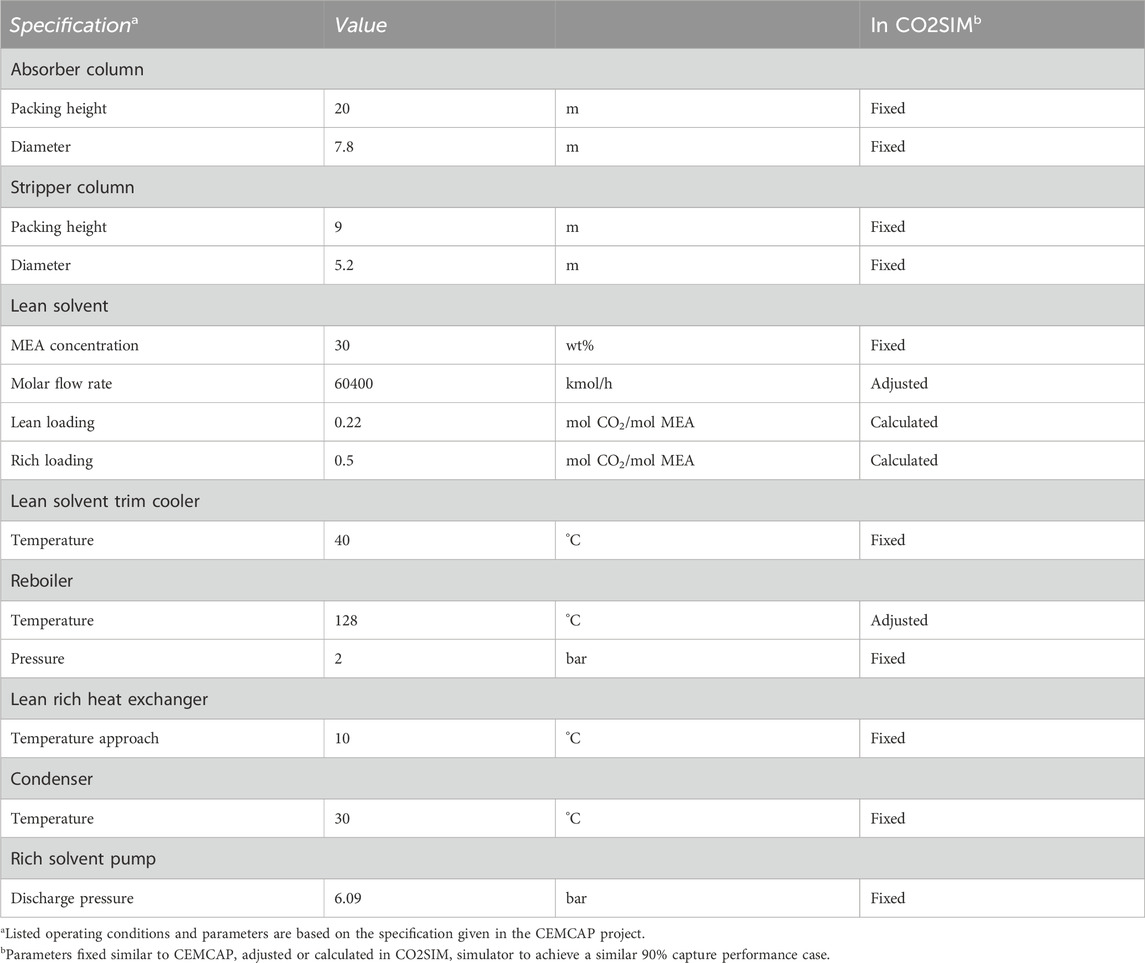
Table 2. Key process specification used for simulating the CO2 capture closed-loop process flowsheet as shown in Figure 1.
2.2 Stochastic uncertainty analysis
In this section, the steps to perform stochastic uncertainty analysis are elaborated by describing the identification of sources of uncertainties pertaining to the CO2 capture process model, the uncertainty propagation methodology, and the defined key performance indicators (KPIs) as the process model outputs.
2.2.1 Selection of uncertain inputs and key performance indicators as stochastic output
Solvent characteristics such as absorption capacity, kinetics, mass transfer, energy performance for solvent regeneration, and thermal and chemical stabilities are typically sources of uncertainty for the performances and design of the solvent-based CO2 capture process, hence impacting its cost (Borhani and Wang, 2019). An accurate knowledge of solvent properties may thus be essential to assess CO2 capture processes precisely. Solvent properties are typically represented using appropriate semi-empirical and empirical correlations which are then incorporated into the process model. While numerous correlations are reported in the literature, these correlations may differ in their accuracy and applicability depending on the specific solvent-based CO2 capture system. The accuracy and applicability of these submodel correlations are induced by uncertainties that can arise from different sources such as measurement accuracy and regression uncertainties. By using the different options for solvent property models in rate-based capture models, significant prediction variations can be encountered, especially for the CO2 absorption efficiency which defines overall capture performance (Kvamsdal and Hillestad, 2012; Luo and Wang, 2017; Mota-Martinez et al., 2017; Putta et al., 2017a; Putta et al., 2017b).
As we previously discussed (Kuncheekanna and Jakobsen, 2023; Kuncheekanna et al., 2020), the MEA solvent property submodels were quantified as the uncertain stochastic parameters of the planned uncertainty analysis. The corresponding submodels are based on the correlation models adopted in the CO2SIM tool. Therefore, this research focused on the characterization and quantification of the uncertainty in the MEA property submodels selected based on the solvent property packages applied in this simulator. The selected list of the stochastic parameters along with the uncertainty range adopted is shown in Table 3.
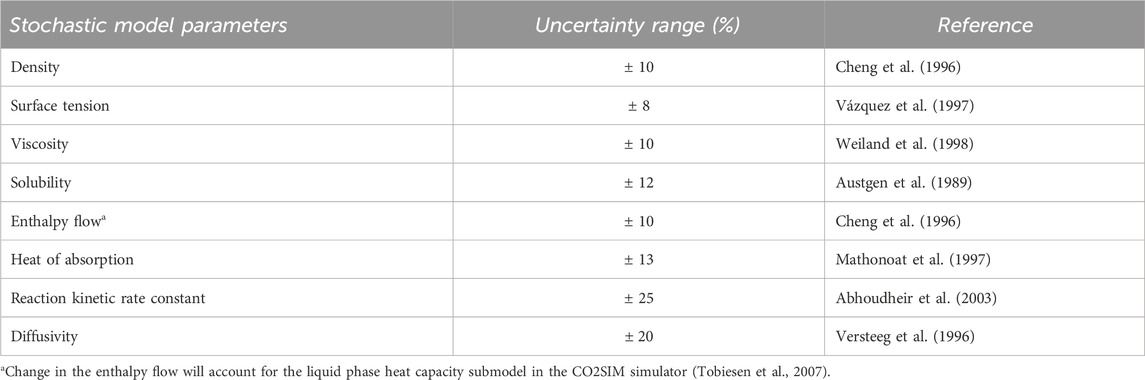
Table 3. Summary of the uncertain stochastic parameters for 30 wt% MEA solvent model for CO2SIM with their uncertainty range.
The uncertainties in the submodel prediction values are represented by a probability density function (PDF). Hence, the characterization of uncertainty may benefit from summarizing all the experimental dataset and fit distribution profiles for each of the solvent submodels considered to give a more credible distribution range. However, this is a challenging and time-consuming endeavor when multiple model correlations are available for the specific solvent property. In this study, the uncertainty range for the dedicated solvent property submodels are selected based on the literature and expert knowledge. The uncertainty range based on expert opinion implies that it is based on the degree of belief in the uncertainty distribution based on existing knowledge. For this study, this judgment pertains to the collected information from various experimental studies within the solvent absorption group in NTNU. Regarding the literature-based uncertainty range, the range is chosen either based on the maximum absolute percent deviation (MAD) or average absolute deviation (AAD) values found in the respective references shown in Table 3. The MAD and AAD values typically depict the difference between the experimental dataset and the outputs predicted by the correlation submodels. We have also previously explained this (Kuncheekanna and Jakobsen, 2023). The uncertainty in a submodel is assumed to vary from their nominal (i.e., deterministic) values estimated in the simulation where a wider range implies that the solvent property is more uncertain and a narrower range is less uncertain. It was furthermore assumed that each uncertain submodel has a normal type of uncertainty distribution.
As our aim is to understand the impact of solvent property uncertainties on the overall design and cost of the capture process, the impact of these uncertainties on the following four aspects will be computed.
• The heat duty of the reboiler, which impacts the required equipment size and thus the cost;
• The heat duty of the lean-rich heat exchanger, which impacts the required equipment size and thus cost;
• The heat duty of the condenser, which impacts the required equipment size and thus cost;
• The CO2 capture ratio, which is the percentage of the CO2 extracted from the flue gas in the absorption column, and is thus linked to the quantity of CO2 to which cost is normalized.
With the absorber and desorber characteristics being set, these fours parameters are those with the strongest impact on the plant design and cost (Gardarsdottir et al., 2019). Further details on how these parameters are subsequently linked to cost are presented in Section 2.3.
2.2.2 Uncertainty propagation approach
A Monte Carlo simulation (MCS) approach is employed here in order to perform the uncertainty analysis. This is done by using the UQLab software package V2.0 developed by ETH Zurich (Marelli and Sudret, 2014). This open-source MATLAB-based tool supports interfaces with existing third-party software in a nonintrusive approach also known as “black box-type”. As the CO2 capture process flowsheet built in CO2SIM can be executed in MATLAB from the GUI functionality, the UQLab tool can be rather easily integrated with CO2SIM to evaluate the impact of the desired uncertainties. Based on the UQLab user manual, the model module (Lataniotis et al., 2015), the coupling of CO2SIM is achieved using a code wrapper—a plug-in that allows the execution of the external software as a simple function that possess a similar input–output format to UQLab algorithms.
By exploiting the different software interfaces, the overall stochastic modeling framework setup shown in Figure 2 is employed in this work. The computational setup of the UQLab tool consists of creating three required modules with specific configurations: (1) an input module, (2) a model module, and (3) an analysis module. The first step to create an input module in UQLab is to define the uncertain variables by assigning a statistical description using probabilistic distribution. A probability distribution is expressed in terms of a probability density function (PDF) that requires the specification of distribution moments or parameters, such as mean and standard deviation. The marginal distribution for the selected uncertain stochastic parameters from Table 3 are estimated based on the 95% confidence interval of the uncertainty range. The nominal value (i.e., mean) is determined by the model correlation output, and the standard deviation value is estimated based on the 95% confidence interval following a standard normal distribution.
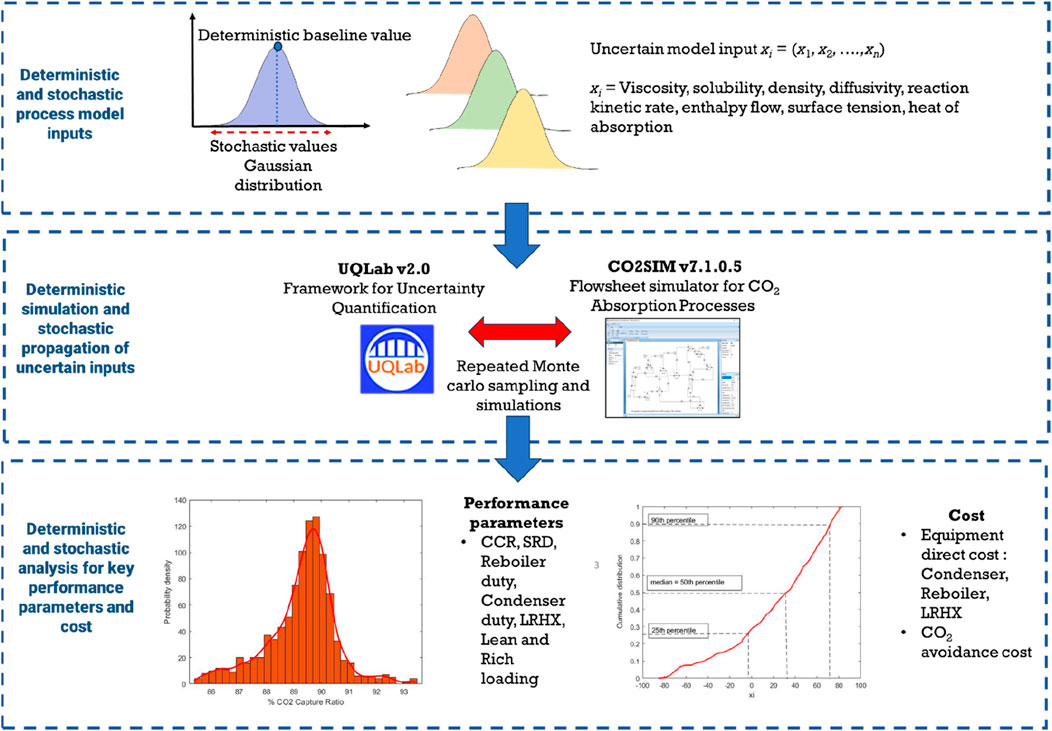
Figure 2. Deterministic and stochastic modeling framework setup for design and cost performance analysis.
The second step, the computational model created as a MATLAB m-file, is used as a model module in the UQLab platform. In the final step, the uncertainty analysis module can be deployed where the Monte Carlo method is applied. The basic framework of the Monte Carlo simulation technique consists of generating sample points (i.e., stochastic values) from the selected solvent property submodels. In this case, the samples were drawn from the assumed probability density function (PDF) for each of the uncertain submodels. The joint probability distribution for all eight uncertain submodels was constructed with the assumption that all eight were independent. This implies that the resulting samples are a product of the marginal distribution of each of the submodels. For the purpose of the analysis, a 1,500 sample size was used, and a series of repeated simulation evaluations were then performed to propagate the uncertainties simultaneously across the full CO2 capture process model. The choice of sampling strategies is necessary, and as the UQLab tool includes a variety of sampling strategies, the Sobol sequence strategy was implemented. According to our previous study (Kuncheekanna and Jakobsen, 2023), the Sobol sequence strategy was computationally more efficient to achieve the targeted accuracy for the KPI. This was measured through convergence analysis based on the sensitivity of the rate of convergence with sample size. Therefore, a sample size of 1,500 equivalent to the number of simulation runs was chosen for this study. To make inferences about the uncertainty in the model predictions, the resulting model outputs with respect to statistical outputs (i.e., minimum, maximum, percentiles, and mean) were then used to construct the distribution profiles using PDF plot. Subsequently, the lower and upper uncertainty bounds were then plotted from the deterministic output values generated from the simulated baseline capture case.
Additional computational details and functionalities of the UQLab required to complete the present uncertainty analysis study are described in Kuncheekanna and Jakobsen (2023).
2.3 Cost estimation methodology
The impact of the solvent property uncertainties on the cost evaluation of the CO2 capture process is measured via the CO2 avoidance costs (CAC) (Roussanaly, 2019). The evaluation of the CAC is performed following the CAC definition and the approach adopted in the CEMCAP evaluations (Gardarsdottir et al., 2019). The cost of CO2 avoided (CAC), in €/tCO2, is evaluated based on the cost of clinker and the equivalent specific emissions of the cement plant with and without CO2 capture, as per Equation 1:
where eclk,eq is specific equivalent emissions per ton of clinker for the cement plant with and without CO2 capture,
Figure 3 illustrates the steps adopted to evaluate the CAC. First, based on the duty distributions obtained for the three heat exchangers (reboiler, lean-rich heat exchanger, and cooler), heat exchanger areas of these units were calculated (Cinti et al., 2018) for a wide percentile range of the uncertainty distributions obtained (min, P2.5, P5, P10, P25, P50, P75, P90, P95, P97.5, max, and the mean). From these, direct equipment costs can be calculated using the Aspen Process Economic Analyzer and then escalated to a corresponding total capital requirement (TCR) following the bottom–up approach presented in Gardarsdottir et al. (2019) for consistency. Subsequently, a difference compared to the TCR of these units in the CEMCAP evaluation can be estimated and used to compute an updated TCR for the complete capture process and, subsequently, an updated cost of clinker. It is worth noting that the updated duties are also used to estimate updated utilities consumptions.
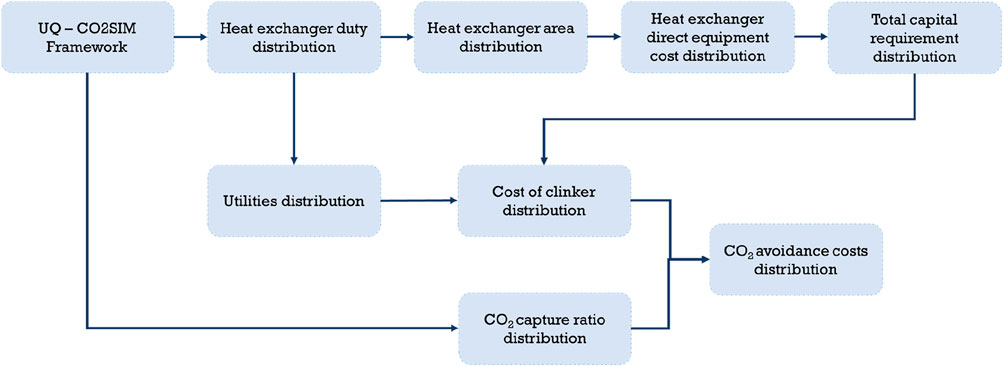
Figure 3. Approach adopted to obtain the impact of solvent uncertainties on equipment design and cost, as well as CO2 avoidance cost estimation.
Similarly, based on the CO2 capture ratio distribution obtained, an updated amount of CO2 capture can be computed for the different percentiles. Subsequently, updated specific equivalent emissions per ton of clinker can be computed.
Finally, based on the estimated updated TCR, utilities consumption, and specific equivalent emissions per ton of clinker, updated CAC values for the percentiles are computed.
3 Results and discussion
3.1 Deterministic analysis and validation results
In this study, the 30 wt% MEA solvent-based CO2 capture from cement plant using CEMCAP project specifications were formulated in a CO2SIM flowsheet simulator. Therefore, for the purpose of model validation, the predictions from the developed model using CO2SIM were compared with the outputs generated from Aspen HYSYS V9 applied in the CEMCAP project while setting to achieve a similar performance scenario of a 90% CO2 capture ratio. The key process parameters that were assessed and compared are presented in Table 5 for the deterministic baseline case.
It can be seen from Table 4 that the CO2SIM process model predicts the performance of the condenser and reboiler duty with good agreement while reaching 90% CO2 capture ratio and producing a slightly higher CO2 product purity (1 %-pt higher). In terms of heat exchanger duties, the reboiler and cooler result in virtually identical results between the CO2SIM and the CEMCAP evaluation, while a reasonable match is found for the lean-rich heat exchanger (approximately 6% difference).
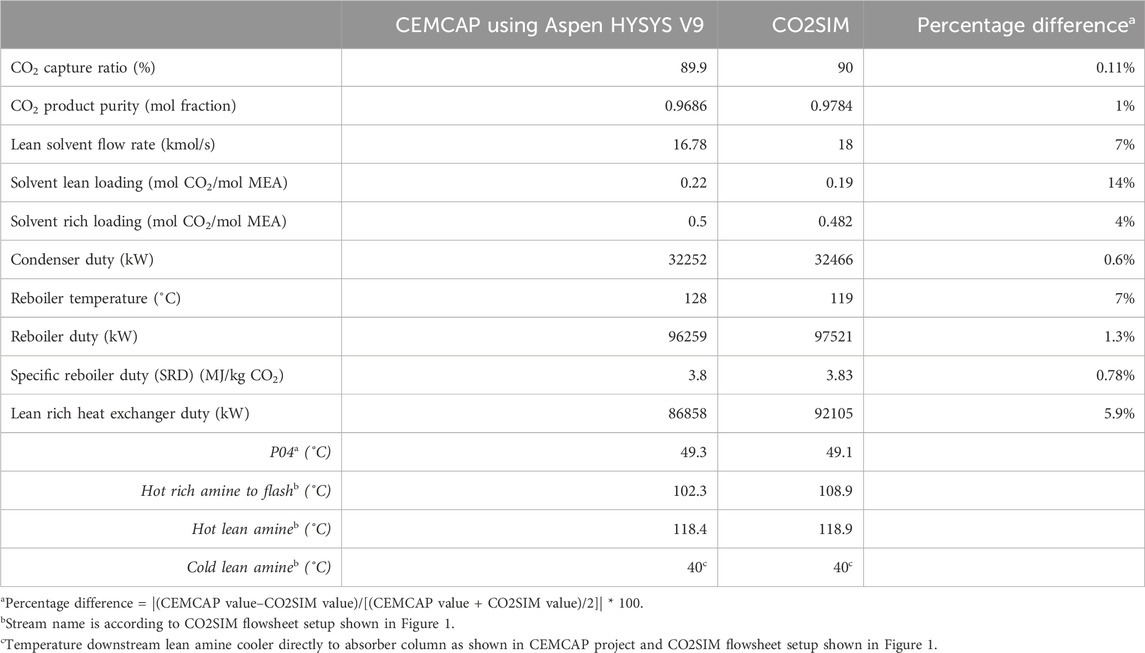
Table 4. Comparison of performance parameters based on the CEMCAP capture reference case using Aspen HYSYS V9 with CO2SIM simulator.
While equipment characteristics show good accord between the CO2SIM and CEMCAP evaluation, some small discrepancies in operational values can be noted. The reboiler temperature was required to be set at 119°C instead of 128°C (at the fixed pressure of 2 bar). With regard to rich and lean loadings, discrepancies in the order of 0.02–0.03 mol CO2/mol MEA are observed. However, the increase between lean and rich loading is nearly the same in both evaluations.
The small difference observed between the two evaluations could be influenced by the use of a different set of mass transfer principle, physical property, and thermodynamic correlations for the MEA solvent which may have had a significant impact on hydraulic parameters and on overall absorption efficiency. Furthermore, the different process configurations and the numerical solution applied for the performance of the close loop flowsheet setup in CO2SIM might also explain the difference. However, considering the aim of the study, the CO2SIM simulation seems to lead to quite similar results at the original CEMCAP evaluations. This comparison provides enough confidence in the CO2SIM model reproduction of the CEMCAP evaluation before it is integrated with the uncertainty methodological framework.
3.2 Stochastic analysis
3.2.1 Effect on key performance indicators
The uncertainties in the eight solvent property submodels were propagated simultaneously through the CO2 capture process model built in the CO2SIM flowsheet simulator. The stochastic nature of the influenced submodel property values was quantified based on a 95% confidence interval for the standard normal distribution. As a result, the distribution profiles for all the KPIs are statistically visualized in the PDF plot shown in Figure 4. On the generated PDF, the mean, 2.5th, and 97.5th percentile lines which are the two extremities for a 95% confidence interval are also shown in the figure to describe the performance characteristics of the distribution. The figures also display the different key percentile, the deterministic baseline described in Section 3.1, and the kernel fit1 represented by the fitted red line. In addition, Table 5 shows the resulting statistical indicator values (i.e., mean, minimum, maximum, range width, and percentiles) which can be inferred from the PDF output. The minimum and maximum values signify the lower and upper bounds of the derived PDF plot with a range width value computed as the difference between the maximum and minimum value.
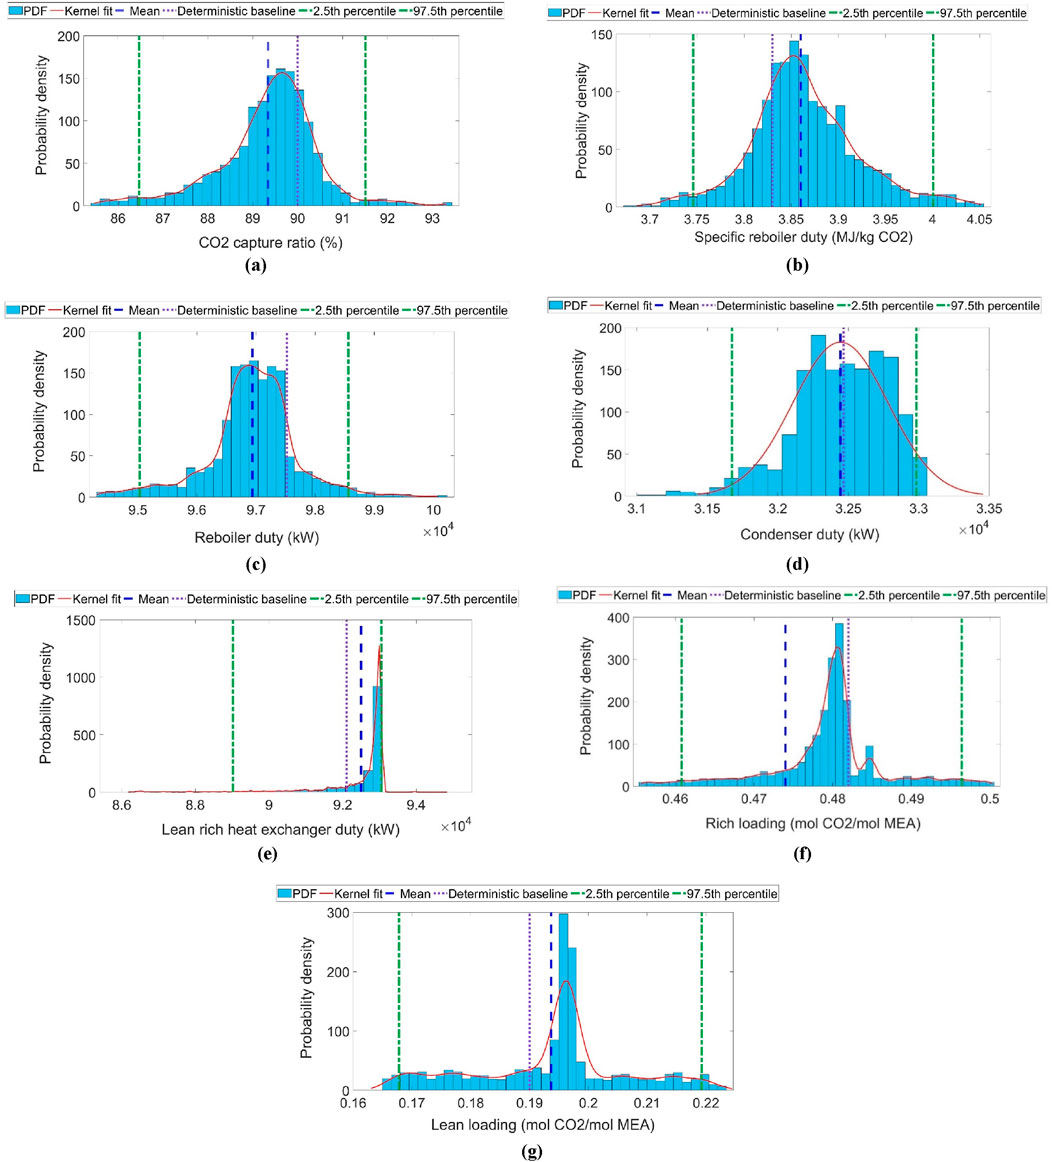
Figure 4. Probabilistic distribution estimates as stochastic output for selected key performance indicators. (a) CO2 capture ratio, (b) specific reboiler duty, (c) reboiler duty, (d) condenser duty, (e) lean rich heat exchanger, (f) rich loading (mol CO2/mol MEA) and (g) lean loading (mol CO2/mol MEA).
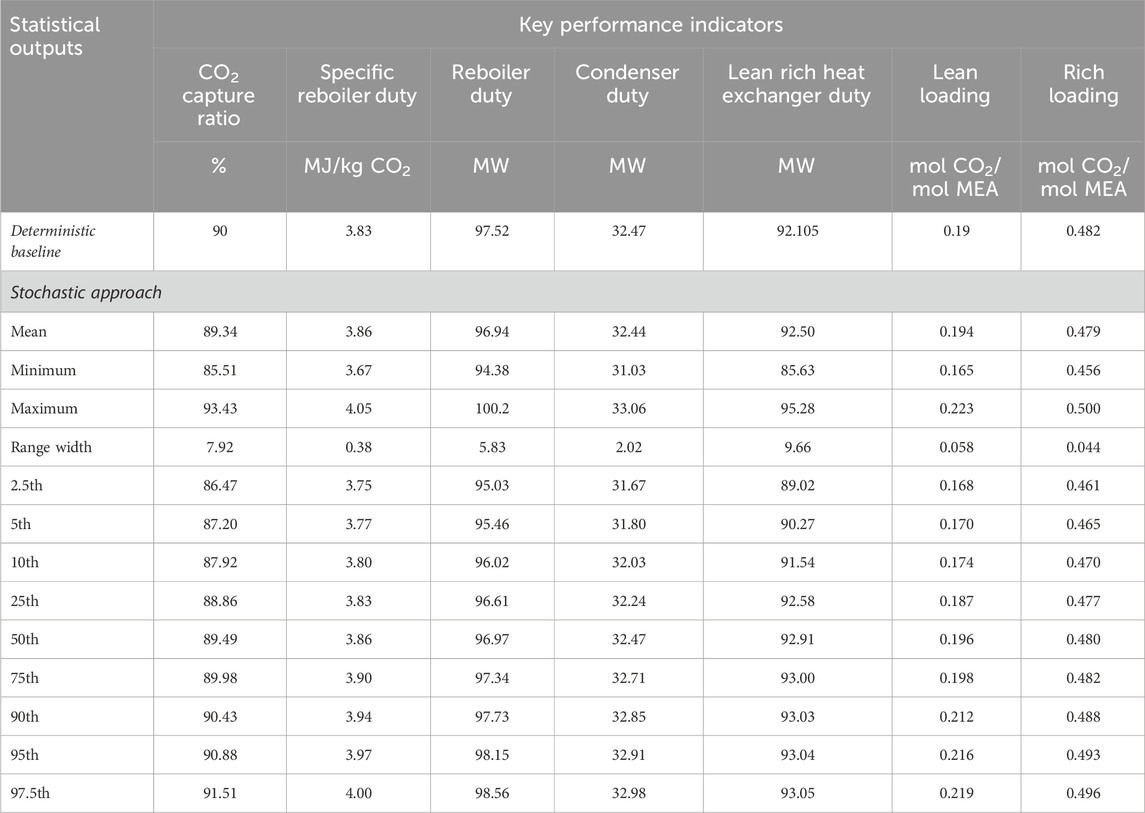
Table 5. Tabulated results of statistical outputs computed from stochastic analysis of the CO2 capture process model.
Overall, significant uncertainty exists in predicting all performance parameters based on the ranges obtained. This denotes that the larger the density distribution spread, the larger the impact of uncertainties on the model predictions. However, there was a varying extent of uncertainty found in the different targeted outputs. In general, based on the minimum to maximum range values examined, the lowest impact of solvent property uncertainty is shown for a reboiler duty parameter with a range of 94.4–100.2 MW (i.e., 3.28% lower and 2.72% higher than the deterministic value of 97.5 MW), while the highest impact was shown for a lean loading parameter with a range of 0.165–0.223 mol CO2/mol MEA (i.e. 14% lower and 16% higher than the deterministic value of 0.19 mol CO2/mol MEA). Beyond these two ends of the spectrum, the tested output going from the lowest to the highest impact in uncertainties are the condenser duty (between −4.5 and +1.8% compared to the deterministic value of 32.5 MW), the specific reboiler duty (between −4.3% and +5.6% compared to the deterministic value of 3.83 MJ/kgCO2), the rich loading (between −5.5% and +3.7% compared to the deterministic value of 0.482 mol CO2/mol MEA), the CO2 capture ratio (between −5.2% and +3.7% compared to the deterministic value of 90%), and the lean rich heat exchanger duty (between −7.3% and +3.4% compared to the deterministic value of 92.1 MW). These results indicate that given the prescribed uncertainty in the solvent property submodels, it is possible that the process model is not able to precisely predict all the KPIs, and the actual model predictions falls between the bounds for some targeted values.
Furthermore, while the lean rich heat exchanger duty showed a significant variability range (Figure 4e), it also exhibits a substantial negatively skewed distribution profile. The skewness for a probability distribution describes the degree of asymmetry observed for the given dataset. A median value corresponding to a 50th percentile output of 92.9 MW establishes that the distribution is indeed negatively skewed (also known as “left skewed” for statistical notation) as the mean value for the duty of 92.5 MW is lesser than the median value. In a symmetrically distributed profile, the mean and median should hold an equivalent value. Therefore, in practice, the uncertainties are unlikely to result in a significantly larger duty than the deterministic value but could result in a significantly smaller duty.
On the other hand, the distribution profiles for all the other KPIs present almost non-skewed profiles, where the distribution curves are not distorted more toward the right or left, such as for the lean rich heat exchanger duty profile. While the specific reboiler duty, lean, and rich loading shown in Figures 4c, f,g exhibit symmetrically distributed profiles which are demonstrated through their similar mean and median value (i.e., at 50th percentile), the rest of the parameters (CCR in Figure 4a, reboiler duty in Figure 4c, and condenser duty in Figure 4d) present a marginal difference between mean and median value of 0.18%, 0.03%, and 0.07% respectively, which are statistically insignificant. Therefore, these distributions can be concluded to be as symmetrically distributed as the rest. Although all the uncertain inputs are characterized with a normal distribution profile, it can be concluded from this observation that it does not lead to the expectations that a similar distribution type should be matched for the process model responses as shown for the lean rich heat exchanger duty profile.
It is also worth noting that, overall, the distributions’ mean is in good accordance with the deterministic value, as the maximum discrepancy is 2.1% (obtained for lean loading). The inclusion of uncertainties in the process model can result in predictions that are higher or lower than the deterministic value: CO2 capture ratio 0.74% lower, SRD 0.78% higher, reboiler duty 0.6% lower, condenser duty 0.1% lower, lean loading 2.1% lower, and rich loading 0.62% higher. A point of interest compared to our previous research (Kuncheekanna and Jakobsen, 2023) is that the difference between deterministic and mean CCR are more pronounced, while there were virtually identical previously. This can be linked to both the difference in underlying models and/or uncertainty interaction between different parts of the process.
3.2.2 Effect on design and cost estimation
To understand the full impact of these uncertainties, it is important to understand how these will impact the design of key equipment and the overall cost of the process. The obtained distribution of the heat exchanger’s direct cost and CCR are shown in Figures 5a–d with comparison to the deterministic and CEMCAP values. On the other hand, Figure 6 describes the obtained distribution in CO2 avoidance cost, also in comparison with the deterministic and CEMCAP value. Table 6 summarizes the distribution characteristics (min, max, key percentiles, etc.), the deterministic, and CEMCAP values corresponding to these two sets of figures.
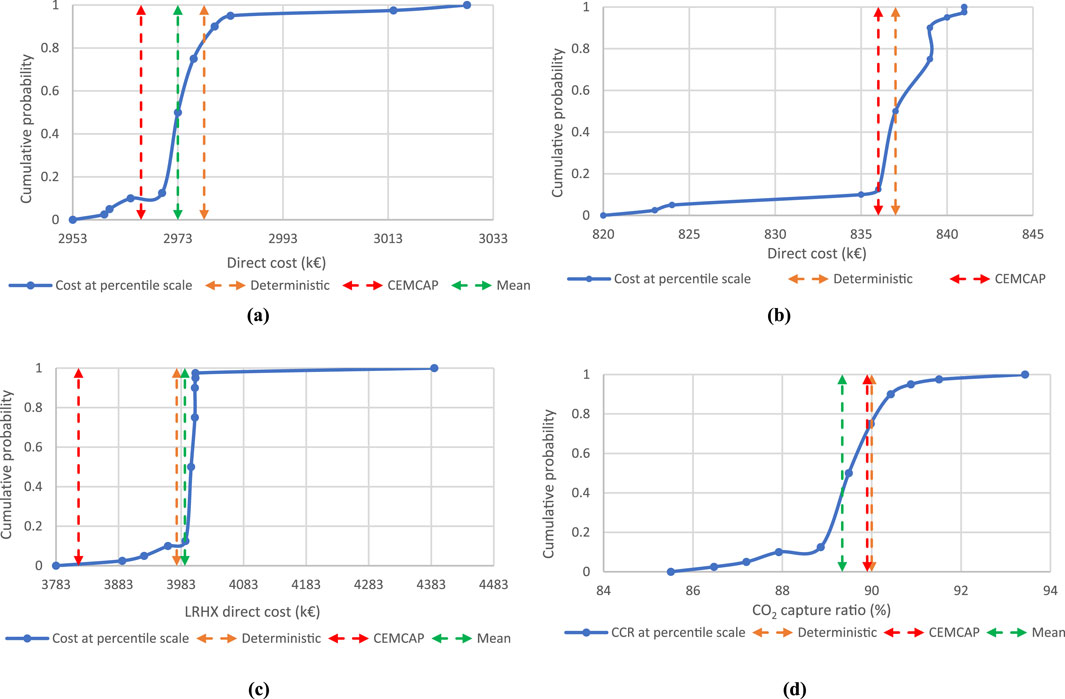
Figure 5. Estimated deterministic and stochastic output for (a) reboiler direct cost, (b) condenser direct cost, (c) lean–rich heat exchanger direct cost, and (d) CO2 capture ratio.
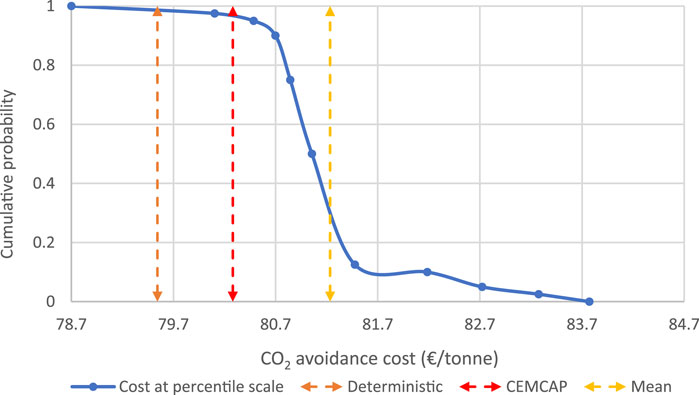
Figure 6. Estimated deterministic and stochastic output for the CO2 avoidance cost.
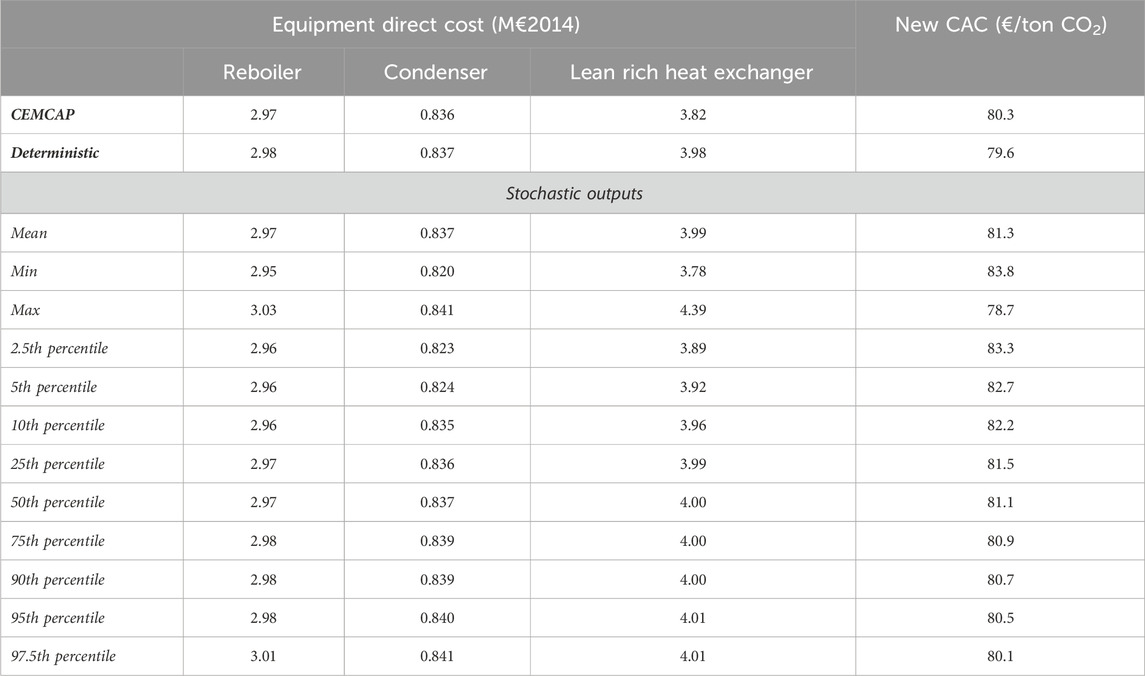
Table 6. Tabulated results of equipment direct cost estimated based on CEMCAP, deterministic, and stochastic approach.
In terms of equipment design, the results show that oversizing the heat exchangers with 4% (i.e., to supply the maximum value of the duty distribution) would be sufficient to guarantee that the required duty could be supplied independently of the uncertainties. It is worth noting that this is within the typical 10% overdesign factor considered in engineering practice. However, to not reduce this design margin, which may provide operational flexibility during operations, it is here assumed that heat exchange areas and cost will also be updated based on the uncertainties. In any case, as the heat exchanger costs are typically linear to the duty, the uncertainty in equipment cost is similar to the uncertainties in duties and is thus limited in extent as shown in Figures 5a–c. To specify here, the mean value for the condenser direct cost is similar to the deterministic value; hence, the mean line is not observed in Figure 5b.
Ultimately, it is important to look at the CO2 avoidance cost, which is the most important parameter to consider when seeking to understand the impact of uncertainties on the cost of the process. The results show that the calculated CO2 avoidance cost ranges from 83.8 to 78.7 €/ton CO2. The deterministic CO2 avoidance cost (79.6 €/ton CO2) is rather close to the lower end of the range, while the mean value (81.3 €/ton CO2) is closer to the middle of the uncertainty range. Considering that these uncertainties are only linked to solvent properties, the resulting 5.3% uncertainty range is significant. Interestingly, most of this uncertainty seems to be linked to the uncertainty in CCR, which impacts the amount of CO2 avoided in the CAC calculation. A possibility to reduce the CCR (and thus cost) uncertainty could be to increase the absorber height. However, as we indicated earlier (Kuncheekanna et al., 2020), ensuring that a 90% capture rate is met with high confidence may require drastically increasing the absorber height. Hence, confirming the optimal height to achieve a 90% CCR via pilot testing might be the best way to reduce the impact of solvent property uncertainties on the CCR and, ultimately, the CO2 avoidance cost.
4 Conclusion
The focus of this work is the adoption of stochastic approach for the assessment of solvent property submodel uncertainties on the key process design and cost performance of an MEA-based CO2 capture process. This study initially established a rigorous rate-based capture process model of the CEMCAP reference cement plant case using the CO2SIM flowsheet simulator. This allowed the validation of the key process parameters CO2SIM predicted with the ASPEN HYSYS® simulation carried out in CEMCAP, as the deterministic predictions of both models were in strong agreement.
With the established capture process model, the uncertainty analysis framework was accomplished by coupling CO2SIM with UQLab software tool, a MATLAB®-based uncertainty quantification toolbox. By using Monte Carlo uncertainty propagation, the performance of the capture model was assessed considering uncertainties in solvent property inputs (i.e., density, surface tension, viscosity, solubility, enthalpy flow to account for heat capacity property, heat of absorption, reaction kinetic rate constant, and diffusivity) on the key performance indicators (i.e., CO2 capture ratio, specific reboiler duty, reboiler duty, condenser duty, lean rich heat exchanger duty, and lean and rich loading). In the uncertainty analysis presented, the results demonstrate that the magnitude of the process performances distributions we obtained vary substantially. While the uncertainty dispersion away from the deterministic baseline value is highest for the lean loading parameter (i.e., 16%), the uncertainty in the reboiler duty was shown with the lowest impact (i.e., 2.7%). Additionally, with the prescribed normal distribution adopted for all uncertainty inputs, the lean-rich exchanger duty presented a very high negatively skewed distribution profile, whereas the rest of the parameters showed a symmetrically distributed profile. Overall, while the deterministic and mean value were in good accordance, the range of values of the distribution highlights a significant impact of solvent property uncertainties on key performance indicators. The study further evaluated the impact of the uncertainties on the cost of the individual heat exchanger (i.e., reboiler, condenser, and lean-rich heat exchanger), as well as the CO2 avoidance cost metric. The result highlighted that heat exchanger duty uncertainty falls within the overdesign margin commonly used in engineering practice. However, the CO2 avoidance cost exhibits significant uncertainty linked to solvent properties (∼5.2%) that are mainly linked to uncertainty in the CO2 capture ratio. Hence, a key element in reducing CO2 avoidance cost uncertainty may well be to validate suitable absorber height to guarantee, with a reasonable confidence, a 90% capture ratio via pilot testing.
Finally, it is important to note that process modelers should perform uncertainty analysis for their specific CO2 capture process model with the solvent of choice as the results cannot be generalized. A process model with configurations including the specific choice for rate-based model and solvent submodel correlations may impact on how the uncertainties propagate through the model and present in the respective KPIs.
While the overall results demonstrate that the influence of the solvent property models’ uncertainties varies on these parameters, stochastic analysis was used to adopt a more robust design and better understand cost uncertainties, thus highlighting the benefit of taking such approaches in addition to deterministic analysis. A potential area of further research is to integrate uncertainty analysis and pilot testing of technology to further improve the reliability of underlying models using, for example, Bayesian inference.
Data availability statement
The original contributions presented in the study are included in the article/supplementary material; further inquiries can be directed to the corresponding authors.
Author contributions
VK: formal analysis, methodology, writing – review and editing, conceptualization, data curation, investigation, resources, software, validation, visualization, writing – original draft. SG: formal analysis, methodology, writing – review and editing. SR: formal analysis, methodology, writing – review and editing.
Funding
The author(s) declare that financial support was received for the research and/or publication of this article. This publication has been produced with support from the NCCS Research Centre, performed under the Norwegian research program Centres for Environment-friendly Energy Research (FME). The authors acknowledge the following partners for their contributions: Aker Carbon Capture, Ansaldo Energia, Baker Hughes, CoorsTek Membrane Sciences, Equinor, Fortum Oslo Varme, Gassco, KROHNE, Larvik Shipping, Lundin Norway, Norcem, Norwegian Oil and Gas, Quad Geometrics, Stratum Reservoir, Total Energies, Vår Energi, Wintershall DEA and the Research Council of Norway (257579). This research was also funded by the Faculty of Natural Sciences of the Norwegian University of Science and Technology (NTNU).
Acknowledgments
We would also like to express our deepest gratitude to Andrew Tobiesen from SINTEF Industry for generously sharing the CO2SIM process simulator and providing knowledge on its application.
Conflict of interest
The authors declare that the research was conducted in the absence of any commercial or financial relationships that could be construed as a potential conflict of interest.
The author(s) declared that they were an editorial board member of Frontiers, at the time of submission. This had no impact on the peer review process and the final decision.
Generative AI statement
The authors declare that no Generative AI was used in the creation of this manuscript.
Publisher’s note
All claims expressed in this article are solely those of the authors and do not necessarily represent those of their affiliated organizations, or those of the publisher, the editors and the reviewers. Any product that may be evaluated in this article, or claim that may be made by its manufacturer, is not guaranteed or endorsed by the publisher.
Footnotes
1Kernel fit indicates the nonparametric visual representation of the random variable distribution. In other words, the overall shape of the probability curve for a data sample can be defined approximately without a predefined distribution
References
Aboudheir, A., Tontiwachwuthikul, P., Chakma, A., and Idem, R. (2003). Kinetics of the reactive absorption of carbon dioxide in high CO2-loaded, concentrated aqueous monoethanolamine solutions. Chem. Eng. Sci. 58 (23-24), 5195–5210. doi:10.1016/j.ces.2003.08.014
Anantharaman, R., Berstad, D., Cinti, G., De Lena, E., Gatti, M., Gazzani, M., et al. (2017). D3. 2 CEMCAP framework for comparative techno-economic analysis of CO2 capture from cement plants. H2020 Proj. CO2 Capture Cem. Prod.
Austgen, D. M., Rochelle, G. T., Peng, X., and Chen, C. C. (1989). Model of vapor-liquid equilibria for aqueous acid gas-alkanolamine systems using the electrolyte-NRTL equation. Industrial and Eng. Chem. Res. 28 (7), 1060–1073. doi:10.1021/ie00091a028
Borhani, T. N., and Wang, M. (2019). Role of solvents in CO2 capture processes: the review of selection and design methods. Renew. Sustain. Energy Rev. 114, 109299. doi:10.1016/j.rser.2019.109299
Cheng, S., Meisen, A., and Chakma, A. (1996). Predict amine solution properties accurately. Hydrocarb. Process. 75 (2).
Cinti, G., Anantharaman, R., De Lena, E., Fu, C., Gardarsdottir, S., Hoppe, H., et al. (2018). Cost of critical components in CO2 capture processes. CEMCAP Deliv. D4, 4. doi:10.5281/zenodo.2593219
Diwekar, U. M., and Rubin, E. S. (1991). Stochastic modeling of chemical processes. Comput. and Chem. Eng. 15 (2), 105–114. doi:10.1016/0098-1354(91)87009-x
Einbu, A., Pettersen, T., Morud, J., Tobiesen, A., Jayarathna, C. K., Skagestad, R., et al. (2022). Energy assessments of onboard CO2 capture from ship engines by MEA-based post combustion capture system with flue gas heat integration. Int. J. Greenh. Gas Control 113, 103526. doi:10.1016/j.ijggc.2021.103526
Gardarsdottir, S. O., De Lena, E., Romano, M., Roussanaly, S., Voldsund, M., Pérez-Calvo, J.-F., et al. (2019). Comparison of technologies for CO2 capture from cement production—Part 2: cost analysis. Energies 12 (3), 542. doi:10.3390/en12030542
Kuncheekanna, V. N., and Jakobsen, J. P. (2023). Exploring global uncertainty quantification and sensitivity analysis methodologies: CO2 capture absorber model with MEA solvent as a test case. Chem. Eng. Res. Des. 200, 107–133. doi:10.1016/j.cherd.2023.09.030
Kuncheekanna, V. N., Jakobsen, J. P., and Knuutila, H. K. (2020). Effect of uncertainties in solvent properties on the techno-economic performances of a CO2 absorber. The Italian Association of Chemical Engineering. 81, 997–1002. doi:10.3303/CET2081167
Kvamsdal, H. M., Haugen, G., Svendsen, H. F., Tobiesen, A., Mangalapally, H., Hartono, A., et al. (2011). Modelling and simulation of the Esbjerg pilot plant using the Cesar 1 solvent. Energy Procedia 4, 1644–1651. doi:10.1016/j.egypro.2011.02.036
Kvamsdal, H. M., and Hillestad, M. (2012). Selection of model parameter correlations in a rate-based CO2 absorber model aimed for process simulation. Int. J. Greenh. Gas Control 11, 11–20. doi:10.1016/j.ijggc.2012.07.013
Lataniotis, C., Marelli, S., and Sudret, B. (2015). Uqlab user manual-the model module, 9–103. Report UQLab-V0.
Luo, X., and Wang, M. (2017). Improving prediction accuracy of a rate-based model of an MEA-based carbon capture process for large-scale commercial deployment. Engineering. 3(2), 232–243. doi:10.1016/J.ENG.2017.02.001
Marelli, S., and Sudret, B. (2014). UQLab: a framework for uncertainty quantification in matlab. American Society of Civil Engineers. 2554, 2563. doi:10.1061/9780784413609.257
Mathonat, C., Majer, V., Mather, A. E., and Grolier, J. P. (1997). Enthalpies of absorption and solubility of CO2 in aqueous solutions of methyldiethanolamine. Fluid phase equilibria 140 (1-2), 171–182. doi:10.1016/s0378-3812(97)00182-9
Morgan, J. C., Bhattacharyya, D., Tong, C., and Miller, D. C. (2015). Uncertainty quantification of property models: methodology and its application to CO2-loaded aqueous MEA solutions. AIChE J. 61 (6), 1822–1839. doi:10.1002/aic.14762
Morgan, J. C., Chinen, A. S., Omell, B., Bhattacharyya, D., Tong, C., and Miller, D. C. (2017). Thermodynamic modeling and uncertainty quantification of CO2-loaded aqueous MEA solutions. Chem. Eng. Sci., 168, 309–324. doi:10.1016/j.ces.2017.04.049
Mota-Martinez, M. T., Hallett, J. P., and Mac Dowell, N. (2017). Solvent selection and design for CO 2 capture–how we might have been missing the point. Sustain. Energy and Fuels 1 (10), 2078–2090. doi:10.1039/c7se00404d
Neveux, T., Le Moullec, Y., Corriou, J.-P., and Favre, E. (2013). A rigorous optimization method of operating parameters for amine-based CO2 capture processes. Energy Procedia 37, 1821–1829. doi:10.1016/j.egypro.2013.06.060
Nookuea, W., Tan, Y., Li, H., Thorin, E., and Yan, J. (2015). Sensitivity study of thermo-physical properties of gas phase on absorber design for CO2 capture using monoethanolamine. Energy Procedia 75, 2305–2310. doi:10.1016/j.egypro.2015.07.426
Nookuea, W., Tan, Y., Li, H., Thorin, E., and Yan, J. (2016). Impacts of thermo-physical properties of gas and liquid phases on design of absorber for CO2 capture using monoethanolamine. Int. J. Greenh. Gas Control 52, 190–200. doi:10.1016/j.ijggc.2016.07.012
Øi, L. E., and Karunarathne, S. (2021). Impact of uncertainty of physical properties on CO2 absorption design.
Putta, K. R., Svendsen, H. F., and Knuutila, H. K. (2017a). CO2 absorption into loaded aqueous MEA solutions: impact of different model parameter correlations and thermodynamic models on the absorption rate model predictions. Chem. Eng. J. 327, 868–880. doi:10.1016/j.cej.2017.06.134
Putta, K. R., Tobiesen, F. A., Svendsen, H. F., and Knuutila, H. K. (2017b). Applicability of enhancement factor models for CO2 absorption into aqueous MEA solutions. Appl. Energy 206, 765–783. doi:10.1016/j.apenergy.2017.08.173
Roussanaly, S. (2019). Calculating CO2 avoidance costs of carbon capture and storage from industry. Carbon Manag. 10 (1), 105–112. doi:10.1080/17583004.2018.1553435
Soares Chinen, A., Morgan, J. C., Omell, B., Bhattacharyya, D., Tong, C., and Miller, D. C. (2018). Development of a rigorous modeling framework for solvent-based CO2 capture. 1. Hydraulic and mass transfer models and their uncertainty quantification. Industrial and Eng. Chem. Res. 57 (31), 10448–10463. doi:10.1021/acs.iecr.8b01471
Tobiesen, F. A., Haugen, G., Kim, I., and Kvamsdal, H. (2017). Simulation and energy evaluation of two novel solvents developed in the EU project HiPerCap. Energy Procedia 114, 1621–1629. doi:10.1016/j.egypro.2017.03.1291
Tobiesen, F. A., Juliussen, O., and Svendsen, H. F. (2008). Experimental validation of a rigorous desorber model for CO2 post-combustion capture. Chem. Eng. Sci. 63 (10), 2641–2656. doi:10.1016/j.ces.2008.02.011
Tobiesen, F. A., Svendsen, H. F., and Juliussen, O. (2007). Experimental validation of a rigorous absorber model for CO2 postcombustion capture. AIChE J. 53 (4), 846–865. doi:10.1002/aic.11133
van der Spek, M., Fout, T., Garcia, M., Kuncheekanna, V. N., Matuszewski, M., McCoy, S., et al. (2020). Uncertainty analysis in the techno-economic assessment of CO2 capture and storage technologies. Critical review and guidelines for use. Int. J. Greenh. Gas Control. 100, 103113. doi:10.1016/j.ijggc.2020.103113
Vázquez, G., Alvarez, E., Navaza, J. M., Rendo, R., and Romero, E. (1997). Surface tension of binary mixtures of water+ monoethanolamine and water+ 2-amino-2-methyl-1-propanol and tertiary mixtures of these amines with water from 25 C to 50 C. J. Chem. and Eng. Data 42 (1), 57–59. doi:10.1021/je960238w
Versteeg, G. F., Van Dijck, L. A. J., and van Swaaij, W. P. M. (1996). On the kinetics between CO2 and alkanolamines both in aqueous and non-aqueous solutions. An overview. Chem. Eng. Commun. 144 (1), 113–158. doi:10.1080/00986449608936450
Voldsund, M., Anantharaman, R., Berstad, D., Fu, C., Gardarsdottir, S. O., Jamali, A., et al. (2018). D4. 6: CEMCAP comparative techno-economic analysis of CO2 capture in cement plants. H2020 Proj. CO2 Capture Cem. Prod.
Voldsund, M., Gardarsdottir, S. O., De Lena, E., Pérez-Calvo, J.-F., Jamali, A., Berstad, D., et al. (2019). Comparison of technologies for CO2 capture from cement production—Part 1: technical evaluation. Energies 12 (3), 559. doi:10.3390/en12030559
Keywords: stochastic modeling, uncertainty quantification, Monte Carlo, economics, CO2 capture
Citation: Kuncheekanna VN, Gardarsdottir S and Roussanaly S (2025) Confidence analysis of design and cost performance for solvent-based CO2 capture from a cement plant: a stochastic modeling perspective. Front. Chem. Eng. 7:1537880. doi: 10.3389/fceng.2025.1537880
Received: 01 December 2024; Accepted: 28 March 2025;
Published: 13 May 2025.
Edited by:
Federica Raganati, National Research Council (CNR), ItalyReviewed by:
Mirko Skiborowski, Hamburg University of Technology, GermanyRuben Ruiz-Femenia, University of Alicante, Spain
Copyright © 2025 Kuncheekanna, Gardarsdottir and Roussanaly. This is an open-access article distributed under the terms of the Creative Commons Attribution License (CC BY). The use, distribution or reproduction in other forums is permitted, provided the original author(s) and the copyright owner(s) are credited and that the original publication in this journal is cited, in accordance with accepted academic practice. No use, distribution or reproduction is permitted which does not comply with these terms.
*Correspondence: Vishalini Nair Kuncheekanna, dmlzaGFsaW5pLm4ua3VuY2hlZWthbm5hQG50bnUubm8=; Simon Roussanaly, c2ltb24ucm91c3NhbmFseUBzaW50ZWYubm8=